Changes to Extreme Precipitation Events: What the Historical Record Shows and What It Means for Engineers
|
|
|
- Brittany Rogers
- 5 years ago
- Views:
Transcription


1 Changes to Extreme Precipitation Events: What the Historical Record Shows and What It Means for Engineers Geoffrey M Bonnin National Oceanic and Atmospheric Administration National Weather Service Office of Hydrologic Development AASHTO May 21-22, 2013 Session IVa: Design Breakout


2 Topics Brief introduction to NOAA Atlas 14 How it is used by engineers Ongoing efforts to update the Atlas Improvements that these updates contain Potential Impact of Climate Change on Precip Frequency The semantic problem Exceedances Climate Change and PMP

3 Ensure objective assessment of the probability of heavy rainfall in planning and design NOAA Atlas 14: Precipitation Frequency Atlas of the United States National design standard for infrastructure built to cope with rainfall and runoff Construction: storm water drainage systems, roads, bridges, culverts, small dams, detention basins, airport runways Ecosystems: in-stream ecosystems including fish habitat, stream erosion control, pollution control systems, soil conservation Other: flood insurance rate maps, flood plain management

4 Begun in 2000 NOAA Atlas 14 Summary Published as volumes by project area as funds become available Annual Exceedance Probability: 1/2 1/1,000 Durations: 5 minutes 60 days Error Estimates: 90% confidence intervals Locally Relevant: 30 arc-sec resolution User Friendly: web based, interactive

5 NOAA Atlas 14 Status

6 Sources of Change Much more data (examples from Volumes 8 & 9) 1,850 daily stations 360 stations in TP49 (1964) for all CONUS Average Record Length 70 Years Rejected daily stations with <~50 years TP49 average record length ~20 years New Statistical Techniques L-Moments replaces conventional moments Regional approach vs at site Trading space for time increases effective record length Objective methods of Spatial Interpolation Observations in mountains interpolation vs extrapolation


7 Potential Impact of Climate Change Management and mission-oriented agencies with public-sector responsibilities have been provided with marginally useful scientific information about the likely manifestations of future climate change. There are insufficient interactions and knowledge exchange between climate scientists, water scientists, and engineers and practitioners to solve these challenges. Global Change and Extreme Hydrology: Testing Conventional Wisdom National Research Council, Water Science and Technology Board, 2011
 found significant increases in the frequency of heavy and very heavy (between the 95th and 99.")
8 Climatology Semantics It is likely that the frequency of heavy precipitation events has increased over most areas. IPCC AR4, Climate Change 2007: Synthesis Report Groisman et al. (2005) found significant increases in the frequency of heavy and very heavy (between the 95th and 99.7th percentile of daily precipitation events) IPCC AR4 Working Group I These and similar statements in the literature define terms such as heavy, very heavy, or extreme precipitation Sometimes differently!

9 For Example Groisman et al 2005 we define a daily precipitation event as heavy when it falls into the upper 10% and/or 5% of all precipitation events; as very heavy when it falls into the upper 1% and/or 0.3% of precipitation events; and extreme when it falls into the upper 0.1% of all precipitation events. The return period for such events varies, for example, from 3 to 5 yr for very heavy precipitation events. Generally consider just daily durations
 Heavy, very heavy, and extreme rainfall: generally subjective terms Use many durations; not just daily NOAA Atlas 14 provides 5 min through 60")
10 Civil Engineering Semantics Use precipitation frequency estimates average annual exceedance probabilities (AEP) or average recurrence intervals (ARI) Heavy, very heavy, and extreme rainfall: generally subjective terms Use many durations; not just daily NOAA Atlas 14 provides 5 min through 60 days

11 Let s Count Exceedances Thresholds Use actual NOAA Atlas 14 thresholds Not a fixed value or a percentile of a time series For: 1 year 1,000 year ARI Durations: 6 hours 45 days Use Partial Duration Series Complies with ARI definition Count Number of Exceedances For each station Sum for each year over the all stations in the domain Normalize for varying number of stations each year Linear regression for all ARI/durations

12 NOAA Atlas 14 Status

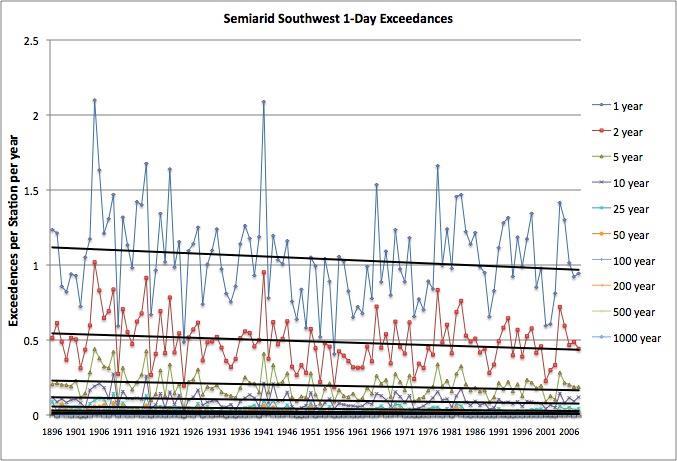
13 Example Trends in Exceedances
14 Generally statistically significant except for 6 hour durations -.05 level, T-test & Mann Kendall Trends in Exceedances NA14, 90% confidence intervals +/- 30% sparsely instrumented, shorter record; to +/- 10% more densely instrumented, longer record
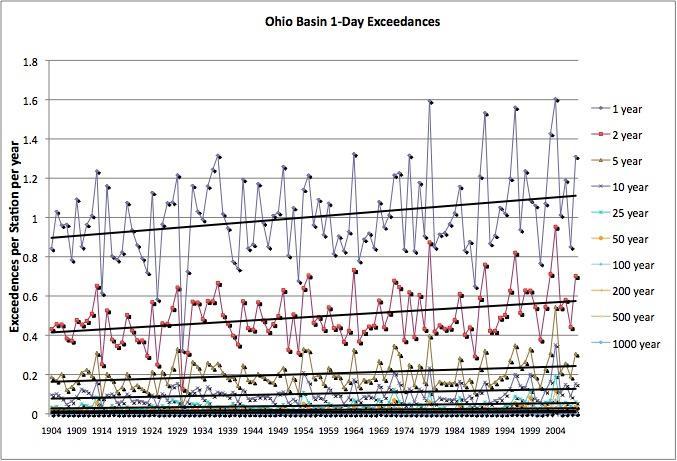
15 Trends in Exceedances (continued) NA14, 90% confidence intervals +/- 30% sparsely instrumented, shorter record; to +/- 10% more densely instrumented, longer record Generally not statistically significant except for daily durations above 2 yr ARI -.05 level, T-test & Mann Kendall
16 Spatial Coherence of AMS Means

17 Spatial Coherence of AMS Means

18 Precip Frequency Conclusions Climate community statements on trends in rainfall exceedances - Do not address frequencies and durations required for civil infrastructure Climate community statements are being misinterpreted - by Civil Engineers and probably the public Historical trends in number of events - Are small compared to uncertainty of IFD values Need better guidance on potential impact of climate change on IFD curves - In range relevant to civil infrastructure

19 Discussion Geoff Bonnin x103
Updated Precipitation Frequency Estimates for Minnesota
 1 Updated Precipitation Frequency Estimates for Minnesota Presenter: Authors: (alphabetical order) Sanja Perica, Director Hydrometeorological Design Studies Center (HDSC), Office of Hydrology, National
New design rainfalls. Janice Green, Project Director IFD Revision Project, Bureau of Meteorology
 New design rainfalls Janice Green, Project Director IFD Revision Project, Bureau of Meteorology Design Rainfalls Design Rainfalls Severe weather thresholds Flood forecasting assessing probability of rainfalls
USGS ATLAS. BACKGROUND
 USGS ATLAS. BACKGROUND 1998. Asquith. DEPTH-DURATION FREQUENCY OF PRECIPITATION FOR TEXAS. USGS Water-Resources Investigations Report 98 4044. Defines the depth-duration frequency (DDF) of rainfall annual
Recent Updates to NOAA/NWS Precipitation Frequency Estimates
 Recent Updates to NOAA/NWS Precipitation Frequency Estimates Geoffrey M. Bonnin Director, Hydrometeorological Design Studies Center Chief, Hydrologic Data Systems Branch Office of Hydrologic Development
Precipitation Extremes in the Hawaiian Islands and Taiwan under a changing climate
 Precipitation Extremes in the Hawaiian Islands and Taiwan under a changing climate Pao-Shin Chu Department of Atmospheric Sciences University of Hawaii-Manoa Y. Ruan, X. Zhao, D.J. Chen, and P.L. Lin December
David R. Vallee Hydrologist-in-Charge NOAA/NWS Northeast River Forecast Center
 David R. Vallee Hydrologist-in-Charge NOAA/NWS Northeast River Forecast Center Record flooding along the Shawsheen River during the 2006 Mother s Day Floods Calibrate and implement a variety of hydrologic
Using PRISM Climate Grids and GIS for Extreme Precipitation Mapping
 Using PRISM Climate Grids and GIS for Extreme Precipitation Mapping George H. Taylor, State Climatologist Oregon Climate Service 316 Strand Ag Hall Oregon State University Corvallis OR 97331-2209 Tel:
StreamStats: Delivering Streamflow Information to the Public. By Kernell Ries
 StreamStats: Delivering Streamflow Information to the Public By Kernell Ries U.S. Department of the Interior U.S. Geological Survey MD-DE-DC District 410-238-4317 kries@usgs.gov StreamStats Web Application
Updating Precipitation Intensities for Runoff Estimation and Infrastructure Designs.
 PROJECT TITLE: Estimation and Infrastructure Designs. PROJECT MANAGER: C. Bruce Wilson AFFILIATION : Minnesota Pollution Control Agency MAILING ADDRESS: 520 Lafayette Road North CITY/STATE/ZIP: St. Paul,
Results of Intensity-Duration- Frequency Analysis for Precipitation and Runoff under Changing Climate
 Results of Intensity-Duration- Frequency Analysis for Precipitation and Runoff under Changing Climate Supporting Casco Bay Region Climate Change Adaptation RRAP Eugene Yan, Alissa Jared, Julia Pierce,
Enhancing Weather Information with Probability Forecasts. An Information Statement of the American Meteorological Society
 Enhancing Weather Information with Probability Forecasts An Information Statement of the American Meteorological Society (Adopted by AMS Council on 12 May 2008) Bull. Amer. Meteor. Soc., 89 Summary This
Overview of a Changing Climate in Rhode Island
 Overview of a Changing Climate in Rhode Island David Vallee, Hydrologist in Charge, National Weather Service Northeast River Forecast Center, NOAA Lenny Giuliano, Air Quality Specialist, Rhode Island Department
Another 100-Year Storm. October 26, 2016 Mark Dennis, PE, CFM
 Another 100-Year Storm October 26, 2016 Mark Dennis, PE, CFM Agenda Are severe rainfall events becoming more frequent? Is there confusion about the 100-year storm that makes it seem like they happen all
NRC Workshop - Probabilistic Flood Hazard Assessment Jan 2013
 Regional Precipitation-Frequency Analysis And Extreme Storms Including PMP Current State of Understanding/Practice Mel Schaefer Ph.D. P.E. MGS Engineering Consultants, Inc. Olympia, WA NRC Workshop - Probabilistic
Appendix 1: UK climate projections
 Appendix 1: UK climate projections The UK Climate Projections 2009 provide the most up-to-date estimates of how the climate may change over the next 100 years. They are an invaluable source of information
New NOAA Precipitation-Frequency Atlas for Wisconsin
 New NOAA Precipitation-Frequency Atlas for Wisconsin #215966 Presentation to the Milwaukee Metropolitan Sewerage District Technical Advisory Team January 16, 2014 Michael G. Hahn, P.E., P.H. SEWRPC Chief
Global Climate Change and the Implications for Oklahoma. Gary McManus Associate State Climatologist Oklahoma Climatological Survey
 Global Climate Change and the Implications for Oklahoma Gary McManus Associate State Climatologist Oklahoma Climatological Survey OCS LEGISLATIVE MANDATES Conduct and report on studies of climate and weather
Southwest Climate Change Projections Increasing Extreme Weather Events?
 Southwest Climate Change Projections Increasing Extreme Weather Events? Jeremy Weiss Climate and Geospatial Extension Scientist School of Natural Resources and the Environment University of Arizona jlweiss@email.arizona.edu
Renewal and Update of MTO IDF Curves: Defining the Uncertainty
 Renewal and Update of MTO IDF Curves: Defining the Uncertainty Eric D. Soulis, Daniel Princz and John Wong University of Waterloo, Waterloo, Ontario. Received 204 05 4, accepted 205 0 29, published 205
Lecture 2: Precipitation
 2-1 GEOG415 Lecture 2: Precipitation Why do we study precipitation? Precipitation measurement -- depends on the study purpose. Non-recording (cumulative) Recording (tipping bucket) Important parameters
Robert Shedd Northeast River Forecast Center National Weather Service Taunton, Massachusetts, USA
 Robert Shedd Northeast River Forecast Center National Weather Service Taunton, Massachusetts, USA Outline River Forecast Centers FEWS Implementation Status Forcing Data Ensemble Forecasting The Northeast
David R. Vallee Hydrologist in Charge NWS/Northeast River Forecast Center
 David R. Vallee Hydrologist in Charge NWS/Northeast River Forecast Center http://weather.gov/nerfc Providence Street West Warwick, RI at 1030 am Wednesday 3/31/10 A bit about the Northeast River Forecast
Operational Perspectives on Hydrologic Model Data Assimilation
 Operational Perspectives on Hydrologic Model Data Assimilation Rob Hartman Hydrologist in Charge NOAA / National Weather Service California-Nevada River Forecast Center Sacramento, CA USA Outline Operational
ENGINEERING HYDROLOGY
 ENGINEERING HYDROLOGY Prof. Rajesh Bhagat Asst. Professor Civil Engineering Department Yeshwantrao Chavan College Of Engineering Nagpur B. E. (Civil Engg.) M. Tech. (Enviro. Engg.) GCOE, Amravati VNIT,
Monte Carlo Simulations for Probabilistic Flood Hazard Assessment
 Monte Carlo Simulations for Probabilistic Flood Hazard Assessment Jemie Dababneh, Ph.D., P.E., 1 and Mark Schwartz, P.E. 1 1 RIZZO Associates, Monroeville, Pennsylvania Presentation to PSA 2017 International
Hydrology and Hydraulics Design Report. Background Summary
 To: National Park Services Montezuma Castle National Monument Richard Goepfrich, Facility Manager From: Multicultural Technical Engineers Date: Tuesday - February 13, 2018 Subject: 30% Hydrology and Hydraulics
The general procedure for estimating 24-hour PMP includes the following steps:
 14th Conference on Applied Climatology Abstract # 71520 Using PRISM Climate Grids and GIS for Extreme Precipitation Mapping George H. Taylor and Christopher Daly Oregon State University Corvallis Oregon
TXHYETO.XLS: A Tool To Facilitate Use of Texas- Specific Hyetographs for Design Storm Modeling. Caroline M. Neale Texas Tech University
 TXHYETO.XLS: A Tool To Facilitate Use of Texas- Specific Hyetographs for Design Storm Modeling Caroline M. Neale Texas Tech University Acknowledgements Funding and direction provided by the Texas Department
Adaptation for global application of calibration and downscaling methods of medium range ensemble weather forecasts
 Adaptation for global application of calibration and downscaling methods of medium range ensemble weather forecasts Nathalie Voisin Hydrology Group Seminar UW 11/18/2009 Objective Develop a medium range
Understanding Weather and Climate Risk. Matthew Perry Sharing an Uncertain World Conference The Geological Society, 13 July 2017
 Understanding Weather and Climate Risk Matthew Perry Sharing an Uncertain World Conference The Geological Society, 13 July 2017 What is risk in a weather and climate context? Hazard: something with the
Solution: The ratio of normal rainfall at station A to normal rainfall at station i or NR A /NR i has been calculated and is given in table below.
 3.6 ESTIMATION OF MISSING DATA Data for the period of missing rainfall data could be filled using estimation technique. The length of period up to which the data could be filled is dependent on individual
Regional Drought Decision Support System (RDDSS) Project Update and Product Concepts
 Project Update and Product Concepts") Regional Drought Decision Support System (RDDSS) Project Update and Product Concepts Part of the Red River Basin Decision Information Network (RRBDIN) NEXT-GEN RRBDIN Decision Support for the Red River
Regional Drought Decision Support System (RDDSS) Project Update and Product Concepts Part of the Red River Basin Decision Information Network (RRBDIN) NEXT-GEN RRBDIN Decision Support for the Red River
USSD Conference, Denver 2016
 USSD Conference, Denver 2016 M Schaefer, MGS Engineering Consultants K Neff, TVA River Operations C Jawdy, TVA River Operations S Carney, Riverside Technology B Barker, MGS Engineering Consultants G Taylor,
Extreme Weather and Risks to Infrastructure. Heather Auld & Neil Comer Risk Sciences International
 Extreme Weather and Risks to Infrastructure Heather Auld & Neil Comer Risk Sciences International The Science is Valid and the Evidence grows Stronger AGREE Climate Change Disagree More Intense Rainfall
Section 4: Model Development and Application
 Section 4: Model Development and Application The hydrologic model for the Wissahickon Act 167 study was built using GIS layers of land use, hydrologic soil groups, terrain and orthophotography. Within
NWSEO CALLS FOR NATIONAL CLIMATE SERVICE TO BE MADE PART OF THE NATIONAL WEATHER SERVICE
 APRIL 2009 NWSEO CALLS FOR NATIONAL CLIMATE SERVICE TO BE MADE PART OF THE NATIONAL WEATHER SERVICE At its recent winter meeting, the NWSEO National Council decided to urge the Administration and Congress
Design Storms for Hydrologic Analysis
 Design Storms for Hydrologic Analysis Course Description This course is designed to fulfill two hours of continuing education credit for Professional Engineers. Its objective is to provide students with
Aurora Bell*, Alan Seed, Ross Bunn, Bureau of Meteorology, Melbourne, Australia
 15B.1 RADAR RAINFALL ESTIMATES AND NOWCASTS: THE CHALLENGING ROAD FROM RESEARCH TO WARNINGS Aurora Bell*, Alan Seed, Ross Bunn, Bureau of Meteorology, Melbourne, Australia 1. Introduction Warnings are
Speakers: NWS Buffalo Dan Kelly and Sarah Jamison, NERFC Jeane Wallace. NWS Flood Services for the Black River Basin
 Speakers: NWS Buffalo Dan Kelly and Sarah Jamison, NERFC Jeane Wallace NWS Flood Services for the Black River Basin National Weather Service Who We Are The National Oceanic and Atmospheric Administration
Depth-Duration Frequency (DDF) and Depth-Area- Reduction Factors (DARF)
 and Depth-Area- Reduction Factors (DARF)") Spatial Analysis of Storms Using GIS Brian Hoblit, Steve Zelinka, Cris Castello, and David Curtis Abstract Point data from rain gages have been historically used to develop depth-area relationships, design
Spatial Analysis of Storms Using GIS Brian Hoblit, Steve Zelinka, Cris Castello, and David Curtis Abstract Point data from rain gages have been historically used to develop depth-area relationships, design
Rainfall Analysis. Prof. M.M.M. Najim
 Rainfall Analysis Prof. M.M.M. Najim Learning Outcome At the end of this section students will be able to Estimate long term mean rainfall for a new station Describe the usage of a hyetograph Define recurrence
1990 Intergovernmental Panel on Climate Change Impacts Assessment
 1990 Intergovernmental Panel on Climate Change Impacts Assessment Although the variability of weather and associated shifts in the frequency and magnitude of climate events were not available from the
WSWC/NOAA Workshops on S2S Precipitation Forecasting
 WSWC/NOAA Workshops on S2S Precipitation Forecasting San Diego, May 2015 Salt Lake City at NWS Western Region HQ, October 2015 Las Vegas at Colorado River Water Users Association, December 2015 College
Areal Reduction Factors for the Colorado Front Range and Analysis of the September 2013 Colorado Storm
 Areal Reduction Factors for the Colorado Front Range and Analysis of the September 2013 Colorado Storm Doug Hultstrand, Bill Kappel, Geoff Muhlestein Applied Weather Associates, LLC - Monument, Colorado
PLANNED UPGRADE OF NIWA S HIGH INTENSITY RAINFALL DESIGN SYSTEM (HIRDS)
") PLANNED UPGRADE OF NIWA S HIGH INTENSITY RAINFALL DESIGN SYSTEM (HIRDS) G.A. Horrell, C.P. Pearson National Institute of Water and Atmospheric Research (NIWA), Christchurch, New Zealand ABSTRACT Statistics
PLANNED UPGRADE OF NIWA S HIGH INTENSITY RAINFALL DESIGN SYSTEM (HIRDS) G.A. Horrell, C.P. Pearson National Institute of Water and Atmospheric Research (NIWA), Christchurch, New Zealand ABSTRACT Statistics
Keywords: rainfall variation, extreme rainfall, intensity frequency duration, Eastern Australia
 Secular Variation in Rainfall and Intensity-Frequency-Duration Curves in Eastern Australia Yi-Ru Chen 1, Bofu Yu and Graham Jenkins Griffith University, QLD, Australia Abstract Rainfall intensity-frequency-duration
An Alternative Temporal Rainfall Distribution for Hydrologic Analysis and Design
 An Alternative Temporal Rainfall Distribution for Hydrologic Analysis and Design Joseph P. Wilson, PE, PH Wilson Hydro, LLC PhD Candidate Missouri University of Science Technology Rolla, Missouri Sorry
On the use of radar rainfall estimates and nowcasts in an operational heavy rainfall warning service
 On the use of radar rainfall estimates and nowcasts in an operational heavy rainfall warning service Alan Seed, Ross Bunn, Aurora Bell Bureau of Meteorology Australia The Centre for Australian Weather
NWS Flood Warning Products plus a Look Ahead
 NWS Flood Warning Products plus a Look Ahead September 21 & 22, 2010 DRBC Flood Warning Users Forum Presented by Gary Szatkowski Meteorologist-in-Charge NOAA s National Weather Service Philadelphia/Mt.
Basins-Level Heavy Rainfall and Flood Analyses
 Basins-Level Heavy Rainfall and Flood Analyses Peng Gao, Greg Carbone, and Junyu Lu Department of Geography, University of South Carolina (gaop@mailbox.sc.edu, carbone@mailbox.sc.edu, jlu@email.sc.edu)
Extreme Rain all Frequency Analysis for Louisiana
 78 TRANSPORTATION RESEARCH RECORD 1420 Extreme Rain all Frequency Analysis for Louisiana BABAK NAGHAVI AND FANG XIN Yu A comparative study of five popular frequency distributions and three parameter estimation
Typical Hydrologic Period Report (Final)
") (DELCORA) (Final) November 2015 (Updated April 2016) CSO Long-Term Control Plant Update REVISION CONTROL REV. NO. DATE ISSUED PREPARED BY DESCRIPTION OF CHANGES 1 4/26/16 Greeley and Hansen Pg. 1-3,
(DELCORA) (Final) November 2015 (Updated April 2016) CSO Long-Term Control Plant Update REVISION CONTROL REV. NO. DATE ISSUED PREPARED BY DESCRIPTION OF CHANGES 1 4/26/16 Greeley and Hansen Pg. 1-3,
Impact of climate change on Australian flood risk: A review of recent evidence
 Impact of climate change on Australian flood risk: A review of recent evidence 30/5/2018 FMA Conference, Gold Coast S Westra 1, B Bennett 1, J Evans 2, F Johnson 3, M Leonard 1, A Sharma 3, C Wasko 4,
Appendix D. Model Setup, Calibration, and Validation
 . Model Setup, Calibration, and Validation Lower Grand River Watershed TMDL January 1 1. Model Selection and Setup The Loading Simulation Program in C++ (LSPC) was selected to address the modeling needs
Global Climate Change and the Implications for Oklahoma. Gary McManus Associate State Climatologist Oklahoma Climatological Survey
 Global Climate Change and the Implications for Oklahoma Gary McManus Associate State Climatologist Oklahoma Climatological Survey Our previous stance on global warming Why the anxiety? Extreme Viewpoints!
USA National Weather Service Community Hydrologic Prediction System
 USA National Weather Service Community Hydrologic Prediction System Rob Hartman Hydrologist in Charge NOAA / National Weather Service California-Nevada River Forecast Center Sacramento, CA Background Outline
Updating Probable Maximum Precipitation for the Tennessee Valley Authority
 Updating Probable Maximum Precipitation for the Tennessee Valley Authority Bill Kappel, President/Senior Meteorologist Applied Weather Associates, Monument, CO www.appliedweatherassociates.com Mike Eiffe,
Minnesota s Changing Climate: Winter Impacts
 Minnesota s Changing Climate: Winter Impacts Dr. Mark Seeley Climatologist/Meteorologist Dept of Soil, Water, and Climate University of Minnesota 15 th Annual Road Salt Symposium Minnesota Landscape Arboretum
Ellen L. Mecray NOAA Regional Climate Services Director, Eastern Region Taunton, MA
 Ellen L. Mecray NOAA Regional Climate Services Director, Eastern Region Taunton, MA Regions of the US National Climate Assessment What we Observe: Climate changes and impacts Increasing temperature Increasingly
High Resolution Indicators for Local Drought Monitoring
 High Resolution Indicators for Local Drought Monitoring REBECCA CUMBIE, STATE CLIMATE OFFICE OF NC, NCSU Monitoring Drought Multiple indicators, multiple sources Local detail important 1 Point-Based Climate-Division
Napa Watershed Water Year Classification Methodology 1
 Napa Watershed Water Year Classification Methodology 1 Methodology to Classify Water Years An online data management and reporting platform ITAS) is being created for the Napa River Watershed to track
Alluvial Fan Flooding Workshop. Barry Pierce National Weather Service, Las Vegas
 Alluvial Fan Flooding Workshop Barry Pierce National Weather Service, Las Vegas Death Valley NP, August 15, 2004 Outline National Weather Service Alluvial Fan/Flash Flooding Weather Regimes Conducive For
Regional Climate Change Effects Report
 Regional Climate Change Effects Report Aug 6, 2010 Robert Kafalenos, FHWA U.S. Department of Transportation Federal Highway Administration 1 Past Performance does not guarantee future returns Past weather
DETECTION AND FORECASTING - THE CZECH EXPERIENCE
 1 STORM RAINFALL DETECTION AND FORECASTING - THE CZECH EXPERIENCE J. Danhelka * Czech Hydrometeorological Institute, Prague, Czech Republic Abstract Contribution presents the state of the art of operational
CLIMATE IMPACTS TO INFRASTRUCTURE ENHANCING CLIMATE RESILIENCY FOR MANITOBA INFRASTRUCTURE
 CLIMATE IMPACTS TO INFRASTRUCTURE ENHANCING CLIMATE RESILIENCY FOR MANITOBA INFRASTRUCTURE Heather Auld, Neil Comer, Simon Eng, Erik Sparling Manitoba: Climate Impacts on Infrastructure - OUTLINE of TALK
Claim: Global warming is increasing the magnitude and frequency of droughts and floods.
 Claim: Global warming is increasing the magnitude and frequency of droughts and floods. REBUTTAL Our use of fossil fuels to power our civilization is not causing droughts or floods. NOAA found there is
What makes it difficult to predict extreme climate events in the long time scales?
 What makes it difficult to predict extreme climate events in the long time scales? Monirul Mirza Department of Physical and Environmental Sciences University of Toronto at Scarborough Email: monirul.mirza@utoronto.ca
Adaptation by Design: The Impact of the Changing Climate on Infrastructure
 Adaptation by Design: The Impact of the Changing Climate on Infrastructure Heather Auld, J Klaassen, S Fernandez, S Eng, S Cheng, D MacIver, N Comer Adaptation and Impacts Research Division Environment
Precipitation Intensity-Duration- Frequency Analysis in the Face of Climate Change and Uncertainty
 Precipitation Intensity-Duration- Frequency Analysis in the Face of Climate Change and Uncertainty Supporting Casco Bay Region Climate Change Adaptation RRAP Eugene Yan, Alissa Jared, Edom Moges Environmental
Improving Sub-Seasonal to Seasonal Prediction at NOAA
 Improving Sub-Seasonal to Seasonal Prediction at NOAA Dr. Louis W. Uccellini Director, National Weather Service NOAA Assistant Administrator for Weather Services July 13, 2016 Congressional Briefing Value
An Overview of Operations at the West Gulf River Forecast Center Gregory Waller Service Coordination Hydrologist NWS - West Gulf River Forecast Center
 National Weather Service West Gulf River Forecast Center An Overview of Operations at the West Gulf River Forecast Center Gregory Waller Service Coordination Hydrologist NWS - West Gulf River Forecast
High Rainfall Events and Their Changes in the Hawaiian Islands
 High Rainfall Events and Their Changes in the Hawaiian Islands Pao-Shin Chu, Xin Zhao, Melodie Grubbs, Cheri Loughran, and Peng Wu Hawaii State Climate Office Department of Meteorology School of Ocean
Water Year 2019 Wet or Dry?? Improving Sub-seasonal to Seasonal Precipitation Forecasting Jeanine Jones, Department of Water Resources
 Water Year 2019 Wet or Dry?? Improving Sub-seasonal to Seasonal Precipitation Forecasting Jeanine Jones, Department of Water Resources Sub-Seasonal to Seasonal (S2S) Precipitation Forecasting Operational
Areal Reduction Factors for the Colorado Front Range and Analysis of the September 2013 Colorado Storm
 Areal Reduction Factors for the Colorado Front Range and Analysis of the September 2013 Colorado Storm Doug Hultstrand, Bill Kappel, Geoff Muhlestein Applied Weather Associates, LLC - Monument, Colorado
Review of existing statistical methods for flood frequency estimation in Greece
 EU COST Action ES0901: European Procedures for Flood Frequency Estimation (FloodFreq) 3 rd Management Committee Meeting, Prague, 28 29 October 2010 WG2: Assessment of statistical methods for flood frequency
Near Real-Time Runoff Estimation Using Spatially Distributed Radar Rainfall Data. Jennifer Hadley 22 April 2003
 Near Real-Time Runoff Estimation Using Spatially Distributed Radar Rainfall Data Jennifer Hadley 22 April 2003 Introduction Water availability has become a major issue in Texas in the last several years,
The NEXRAD Revolution: Scientific Basis for Updating the HMR-49 Statistical Storm Intensities and PMPs
 The NEXRAD Revolution: Scientific Basis for Updating the HMR-49 Statistical Storm Intensities and PMPs Bill Kappel, Senior Meteorologist/President Applied Weather Associates, Monument, CO www.appliedweatherassociates.com
STRUCTURAL ENGINEERS ASSOCIATION OF OREGON
 STRUCTURAL ENGINEERS ASSOCIATION OF OREGON P.O. Box 3285 PORTLAND, OR 97208 503.753.3075 www.seao.org E-mail: jane@seao.org 2010 OREGON SNOW LOAD MAP UPDATE AND INTERIM GUIDELINES FOR SNOW LOAD DETERMINATION
PO Box 680 Monument, Co / appliedweatherassociates.com. Probable Maximum Precipitation (PMP)
") PO Box 680 Monument, Co 80132 719/488-9117 appliedweatherassociates.com Probable Maximum Precipitation (PMP) Probable Maximum Precipitation Introduction Concept of Probable Maximum Precipitation (PMP)
PO Box 680 Monument, Co 80132 719/488-9117 appliedweatherassociates.com Probable Maximum Precipitation (PMP) Probable Maximum Precipitation Introduction Concept of Probable Maximum Precipitation (PMP)
Doug Kluck NOAA Kansas City, MO National Center for Environmental Information (NCEI) National Integrated Drought Information System (NIDIS)
 National Integrated Drought Information System (NIDIS)") National Integrated Drought Information System (NIDIS) for the Missouri River Basin Drought Early Warning Information System (DEWS) & Runoff Trends in the Missouri Basin & Latest Flood Outlook Doug Kluck
National Integrated Drought Information System (NIDIS) for the Missouri River Basin Drought Early Warning Information System (DEWS) & Runoff Trends in the Missouri Basin & Latest Flood Outlook Doug Kluck
sea levels 100 year/ payments. FIGURE 1
 MIAMI DADE COUNTY CLIMATE INDICATORS RAINFALL SUMMARY Much of Miami Dade County is susceptible to localized flooding, particularly during the rainy season of June through October. The County s flat terrain
CLIMATE MODEL DOWNSCALING: HOW DOES IT WORK AND WHAT DOES IT TELL YOU?
 rhgfdjhngngfmhgmghmghjmghfmf CLIMATE MODEL DOWNSCALING: HOW DOES IT WORK AND WHAT DOES IT TELL YOU? YAN FENG, PH.D. Atmospheric and Climate Scientist Environmental Sciences Division Argonne National Laboratory
Global Climate Change, Weather, and Disasters
 Global Climate Change, Weather, and Disasters The Hype and the Available Data! K.E. Kelly Is Climate Change Causing Extreme Weather? New Republic www.greenpeace.org Zogby Analytics poll shortly after hurricane
Claim: Global warming is increasing the magnitude and frequency of droughts and floods. REBUTTAL
 Claim: Global warming is increasing the magnitude and frequency of droughts and floods. REBUTTAL Our use of fossil fuels to power our civilization is not causing droughts or floods. NOAA found there is
Ground Water Protection Council 2017 Annual Forum Boston, Massachusetts. Ben Binder (303)
") Ground Water Protection Council 2017 Annual Forum Boston, Massachusetts Protecting Groundwater Sources from Flood Borne Contamination Ben Binder (303) 860-0600 Digital Design Group, Inc. The Problem Houston
Ground Water Protection Council 2017 Annual Forum Boston, Massachusetts Protecting Groundwater Sources from Flood Borne Contamination Ben Binder (303) 860-0600 Digital Design Group, Inc. The Problem Houston
Operational Hydrologic Ensemble Forecasting. Rob Hartman Hydrologist in Charge NWS / California-Nevada River Forecast Center
 Operational Hydrologic Ensemble Forecasting Rob Hartman Hydrologist in Charge NWS / California-Nevada River Forecast Center Mission of NWS Hydrologic Services Program Provide river and flood forecasts
STAMP Spa)al Tools for Arc)c Mapping & Planning. Creating an interactive data tool to improve access and usability of Arctic data
al Tools for Arc)c Mapping & Planning. Creating an interactive data tool to improve access and usability of Arctic data") STAMP Spa)al Tools for Arc)c Mapping & Planning Creating an interactive data tool to improve access and usability of Arctic data Mission Provide easy access to physical, chemical, and biological data Network
STAMP Spa)al Tools for Arc)c Mapping & Planning Creating an interactive data tool to improve access and usability of Arctic data Mission Provide easy access to physical, chemical, and biological data Network
MAPPING THE RAINFALL EVENT FOR STORMWATER QUALITY CONTROL
 Report No. K-TRAN: KU-03-1 FINAL REPORT MAPPING THE RAINFALL EVENT FOR STORMWATER QUALITY CONTROL C. Bryan Young The University of Kansas Lawrence, Kansas JULY 2006 K-TRAN A COOPERATIVE TRANSPORTATION
The Norwegian Centre for Climate Services - NCCS
 The Norwegian Centre for Climate Services - NCCS Extremes Products - Dissemination Eirik J. Førland, Norwegian Meteorological Institute, Oslo, Norway Impact assessment consultation workshop, Budapest,
Billion Dollar U.S. Flood Disasters in 2016
 Billion Dollar U.S. Flood Disasters in 2016 ArkLaMiss, Mar. 16 Houston, Apr. 16 WV, June 16 LA, Aug. 16 Matthew, Oct. 16 Greg Carbin Chief, Forecast Operations Branch NCEP/Weather Prediction Center College
The Documentation of Extreme Hydrometeorlogical Events: Two Case Studies in Utah, Water Year 2005
 The Documentation of Extreme Hydrometeorlogical Events: Two Case Studies in Utah, Water Year 2005 Tim Bardsley1*, Mark Losleben2, Randy Julander1 1. USDA, NRCS, Snow Survey Program, Salt Lake City, Utah.
Impact of climate change on freshwater resources in the Changjiang river basin
 Impact of climate change on freshwater resources in the Changjiang river basin Wenfa Yang, Yan Huang Bureau of Hydrology, Changjiang Water Resources Commission, MWR, China April,2009 Objective To identify
Flash Flood Guidance System On-going Enhancements
 Flash Flood Guidance System On-going Enhancements Hydrologic Research Center, USA Technical Developer SAOFFG Steering Committee Meeting 1 10-12 July 2017 Jakarta, INDONESIA Theresa M. Modrick Hansen, PhD
System Validation. SEEFFG Operations Workshop. Theresa M. Modrick, PhD Hydrologic Engineer Hydrologic Research Center
 SEEFFG Operations Workshop System Validation Theresa M. Modrick, PhD Hydrologic Engineer Hydrologic Research Center TModrick@hrcwater.org 09 May 2016 1 Fundamental Concepts for Flash Flood Guidance FFG
Artificial Neural Network Prediction of Future Rainfall Intensity
 Ryan Patrick McGehee Dr. Puneet Srivastava Artificial Neural Network Prediction of Future Rainfall Intensity A Precursor to Understanding Climate Change Outcomes for the Southeastern United States Why
Storm rainfall. Lecture content. 1 Analysis of storm rainfall 2 Predictive model of storm rainfall for a given
 Storm rainfall Lecture content 1 Analysis of storm rainfall 2 Predictive model of storm rainfall for a given max rainfall depth 1 rainfall duration and return period à Depth-Duration-Frequency curves 2
MIDWEST PROBABLE MAXIMUM PRECIPITATION STUDIES
 MIDWEST PROBABLE MAXIMUM PRECIPITATION STUDIES Bill Kappel Senior Meteorologist/Vice President Ed Tomlinson, PhD Chief Meteorologist/President Applied Weather Associates www.appliedweatherassociates.com
Incorporation of SMOS Soil Moisture Data on Gridded Flash Flood Guidance for Arkansas Red River Basin
 Incorporation of SMOS Soil Moisture Data on Gridded Flash Flood Guidance for Arkansas Red River Basin Department of Civil and Environmental Engineering, The City College of New York, NOAA CREST Dugwon
NOAA s Regional Climate Science & Information: Opportunities and Challenges
 NOAA s Regional Climate Science & Information: Opportunities and Challenges Dr. Wayne Higgins Climate Program Office, Director Office of Oceanic and Atmospheric Research National Oceanic and Atmospheric
Seasonal Climate Watch September 2018 to January 2019
 Seasonal Climate Watch September 2018 to January 2019 Date issued: Aug 31, 2018 1. Overview The El Niño-Southern Oscillation (ENSO) is still in a neutral phase and is still expected to rise towards an