Using PRISM Climate Grids and GIS for Extreme Precipitation Mapping
|
|
|
- Annabel Summers
- 6 years ago
- Views:
Transcription
1 Using PRISM Climate Grids and GIS for Extreme Precipitation Mapping George H. Taylor, State Climatologist Oregon Climate Service 316 Strand Ag Hall Oregon State University Corvallis OR Tel: Fax: Web: BIOGRAPHICAL SKETCH Since 1989 Mr. Taylor has served as State Climatologist for Oregon, and is a faculty member at Oregon State University (OSU). He received B.A. degrees in Mathematics and Geography from the University of California and an M.S. in Meteorology from the University of Utah. He is recognized as a Certified Consulting Meteorologist by the American Meteorological Society. Among his recent projects are the following: Co-manager of climate mapping products for the Spatial Climate Analysis Service (SCAS) at OSU. SCAS is currently responsible for nearly all major climate mapping efforts at the Federal level in the United States. SCAS data are certified as the official climate data sets for the USDA, and are now the only spatial climate data so certified at the Federal level. Examples of national programs that are, or will soon, use SCAS spatial data include USDA National Resource Inventory, USDA Conservation Reserve Program, USDA Wetlands Reserve Program, NOAA Office of Global Programs, and the U.S. Global Change Research Program. Project scientist for a number of Probable Maximum Precipitation studies, including recent projects in Saskatchewan, Canada; southwest British Columbia; and Lake Chelan, Washington. Principal Investigator for projects to map storm event precipitation for three large flood events in the Pacific Northwest. Climatologist for several projects to develop new precipitation frequency-duration products for the United States, including western Washington, Oregon, the southwest interior, and the Ohio Valley. Wrote analysis of streamflow forecasting for the Klamath Basin, Oregon, including development of new instrumentation sets and incorporation of GIS technology into forecasts. Author of two books and numerous articles on climate and factors influencing climate, such as the El Niño Southern Oscillation and Pacific Decadal Oscillation.
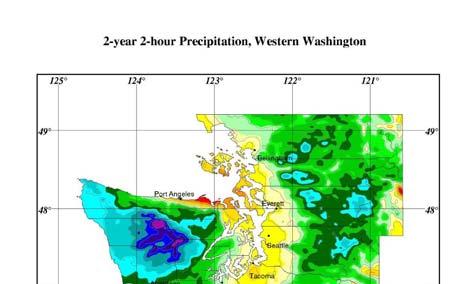
2 Use of PRISM Climate Grids and Geographic Information Systems (GIS) for Extreme Precipitation Mapping George H. Taylor and Christopher Daly Oregon State University Corvallis Oregon Extreme precipitation information is of interest for a variety of purposes, including public safety, water supply, dam design and operation, and transportation planning. Two common parameters calculated for extreme precipitation purposes are probable maximum precipitation (PMP) and intensity-duration-frequency (IDF). The definition of PMP is theoretically, the greatest depth of precipitation for a given duration that is physically possible over a given area at a particular geographical location at a certain time of the year. PMP estimates are used to calculate the probable maximum flood (PMF), which in turn is used to evaluate the adequacy of hydraulic structures. IDF calculations are used in a variety of precipitation-related tasks, including PMP. The primary agency responsible for establishing standards for PMP and IDF has been the National Oceanic and Atmospheric Administration (NOAA) see, for example, U.S. Department of Commerce(1994). Specific regional and local analyses have generally been performed by local agencies or private contractors. Historically, computations of these parameters have been accomplished using mostly manual techniques (e.g., hand-drawn maps). Advances in spatial climate mapping and geographical information systems (GIS) technology have created new opportunities for mapping extreme precipitation. Using GIS software and climate grids created using PRISM, new approaches to extreme precipitation mapping have been applied to specific locations with good success. In addition to automating analytical processes, thereby saving time, the new techniques have been shown to produce more consistent and defensible coverages (digital map layers) than those of previous analyses. PRISM (Parameter-elevation Regressions on Independent Slopes Model) is an expert system that uses point data and a digital elevation model (DEM) to generate gridded estimates of climate parameters (Daly et al., 2002). Unlike other statistical methods in use today, PRISM was written by a meteorologist specifically to address climate. PRISM is well-suited to mountainous regions, because the effects of terrain on climate play a central role in the model's conceptual framework. We call it an expert system, because it attempts to mimic the process an expert would use to map climate parameters. The user interacts with the process through a graphical interface. The general procedure for estimating 24-hour PMP includes the following steps: 1) Collect hourly and daily precipitation data for major historical storms and select major storms for analysis; 2) Obtain or develop station information representing computed or estimated 100-year 24-hour (or other averaging period) precipitation amounts (see Figure 1); 3) For each storm, calculate the percent of 100-year 24-hour precipitation observed at each available station
3 Using PRISM Climate Grids and GIS for Extreme Precipitation Mapping George Taylor and Chris Daly Oregon State University PRISM Parameter-elevation Regressions on Independent Slopes Model - Generates gridded estimates of climatic parameters - Moving-window regression of climate vs. elevation for each grid cell - Uses nearby station observations - Spatial climate knowledge base (KBS) weights stations in the regression function by their climatological similarity to the target grid cell
4 Types of Extreme Precipitation Mapping Precipitation Frequency Maps Probable Maximum Precipitation (PMP) Actual Extreme Events Precipitation Frequency Maps Existing products very old (TP-40 - early 1960s; NOAA-2 - early 1970s Used for a variety of purposes, including dam safety and civil engineering Working with the NWS-HDSC on updating these critical products for NRCS engineering work
 Built upon NRCS mapping project Semi-arid Southwest")

5 TP-40/NOAA Atlas 2 Precipitation Frequency Update (NOAA NWS HDSC) Built upon NRCS mapping project Semi-arid Southwest Ohio Valley Remainder of country needs to be mapped Analyses of extreme precipitation underway for a few individual states
6
7 Probable Maximum Precipitation (PMP) theoretically, the greatest depth of precipitation for a given duration that is physically possible over a given area at a particular geographical location at a certain time of the year. Probable Maximum Precipitation (PMP) Uses: 1. Dam safety 2. Other
8 PMP Procedure 1) Collect hourly and daily precipitation data for major historical storms and select major storms for analysis; 2) Obtain or develop station information representing computed or estimated 100-year 24-hour (or other averaging period) precipitation amounts; 3) For each storm, calculate the percent of 100-year 24-hour precipitation observed at each available station
 precipitation amounts; 3) For each storm, calculate the percent of 100-year 24- hour precipitation observed at each available")
9 PMP Procedure 1) Collect hourly and daily precipitation data for major historical storms and select major storms for analysis; 2) Obtain or develop station information representing computed or estimated 100-year 24-hour (or other averaging period) precipitation amounts; 3) For each storm, calculate the percent of 100-year 24- hour precipitation observed at each available station
 and 4); 6) Estimate the 100-year convergence precipitation (defined as the maximum precipitation component operating independent of terrain influences)")
10 PMP Procedure 4) Create a GIS coverage representing the percentage of 100-year precipitation using the station data above; 5) Create isohyetal maps of maximum 24-hour precipitation for each selected historical storm using the coverages from 2) and 4); 6) Estimate the 100-year convergence precipitation (defined as the maximum precipitation component operating independent of terrain influences) using a spatial grid and GIS;
 Transpose maximized convergence from each storm across a spatial grid using variations in maximum")
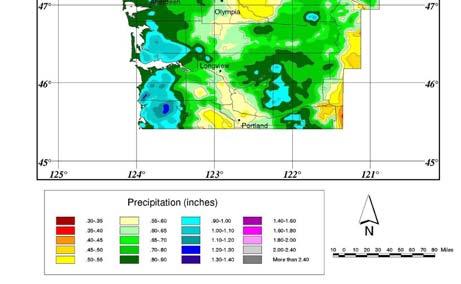
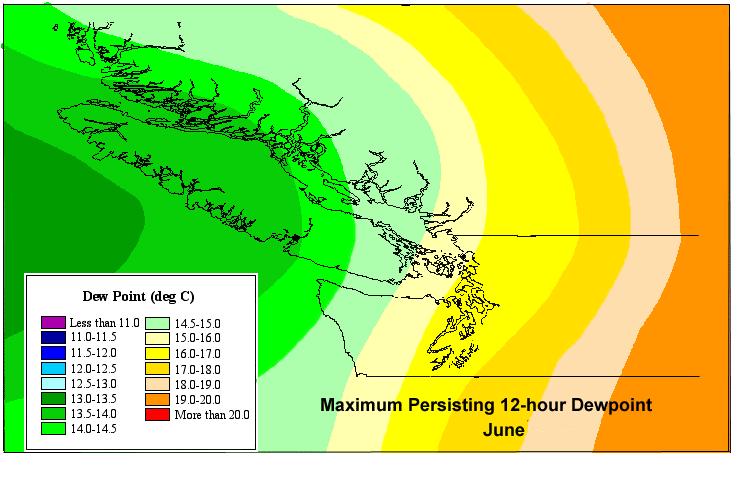
11 PMP Procedure 7) Determine the convergence precipitation from significant historical storms; 8) Maximize the convergence component of historical storms using a set of maximization factors, particularly the ratio of maximum observed dew point to observed dew point during each storm; 9) Transpose maximized convergence from each storm across a spatial grid using variations in maximum persisting dew point applying both vertical and horizontal transposition limits;
 Transpose maximized convergence from each storm across a spatial grid using variations in maximum")
12 PMP Procedure 7) Determine the convergence precipitation from significant historical storms; 8) Maximize the convergence component of historical storms using a set of maximization factors, particularly the ratio of maximum observed dew point to observed dew point during each storm; 9) Transpose maximized convergence from each storm across a spatial grid using variations in maximum persisting dew point applying both vertical and horizontal transposition limits;
13
14 PMP Procedure 10) Estimate the ratio of 100-year total precipitation to 100-year convergence precipitation (T/C) using the above data; 11) Estimate the variation in values of the storm intensity factor, M, to derive the orographic factor, K; and 12) Determine the total PMP by multiplying GIS coverage of convergence PMP by grid of K. 13) Add in effects of snow melt, if any.
 using the above data; 11) Estimate the variation in values of the storm")

15 PMP Procedure 10) Estimate the ratio of 100-year total precipitation to 100- year convergence precipitation (T/C) using the above data; 11) Estimate the variation in values of the storm intensity factor, M, to derive the orographic factor, K; and 12) Determine the total PMP by multiplying GIS coverage of convergence PMP by grid of K. 13) Add in effects of snow melt, if any.
 Determine the total PMP by multiplying GIS coverage of convergence PMP by grid of K.")
16 PMP Procedure 10) Estimate the ratio of 100-year total precipitation to 100- year convergence precipitation (T/C) using the above data; 11) Estimate the variation in values of the storm intensity factor, M, to derive the orographic factor, K; and 12) Determine the total PMP by multiplying GIS coverage of convergence PMP by grid of K. 13) Add in effects of snow melt, if any.

17 Mapping Actual Extreme Events Multi-day floods Single-day or shorter events
18
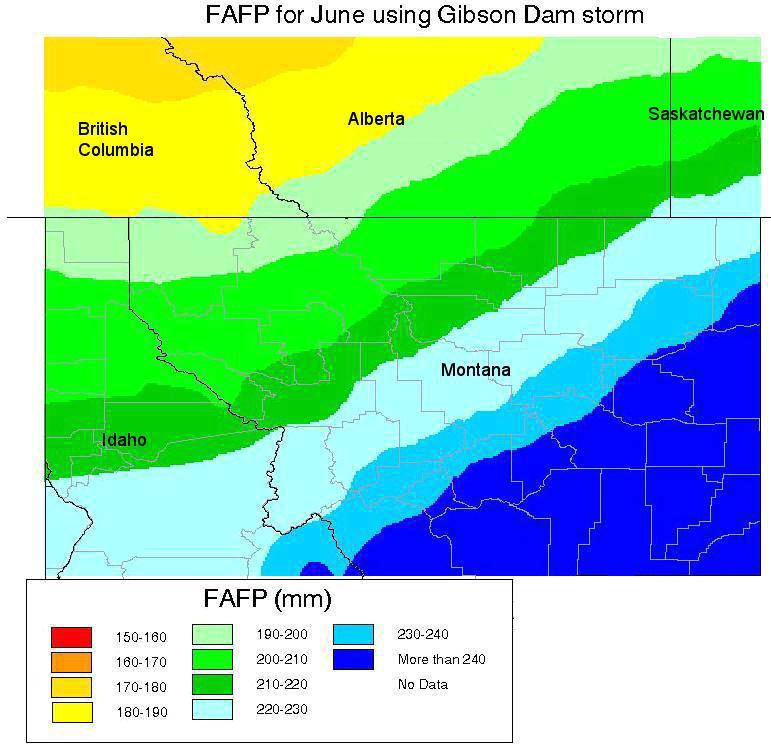
19 4) Create a GIS coverage representing the percentage of 100-year precipitation using the station data above (Figure 2); 5) Create isohyetal maps of maximum 24-hour precipitation for each selected historical storm using the coverages from 2) and 4) Figure 3. 6) Estimate the 100-year convergence precipitation (defined as the maximum precipitation component operating independent of terrain influences) using a spatial grid and GIS (Figure 3); 7) Determine the convergence precipitation from significant historical storms; 8) Maximize the convergence component of historical storms using a set of maximization factors, particularly the ratio of maximum observed dew point to observed dew point during each storm; 9) Transpose maximized convergence from each storm across a spatial grid using variations in maximum persisting dew point applying both vertical and horizontal transposition limits; 10) Estimate the ratio of 100-year total precipitation to 100-year convergence precipitation (T/C) using the above data (Figure 4); 11) Estimate the variation in values of the storm intensity factor, M, to derive the orographic factor, K; and 11) Determine the total PMP by multiplying GIS coverage of convergence PMP by grid of K (Figure 5). The figures shown were developed for two PMP projects in the Pacific Northwest: PMP for Southwestern British Columbia, for B.C. Hydro of Canada; and Extreme Precipitation (IDF) for Western Washington for the Washington Department of Transportation. References Daly, C., W. P. Gibson, G.H. Taylor, G. L. Johnson, P. Pasteris, A Knowledge-based Approach to Statistical mapping of Climate. Climate Research, 22, MGS Engineering and Oregon Climate Service (2001), Spatial Mapping of 100-Year and Year Precipitation for 6-Hour, 24-Hour, and 72-Hour Durations for Southwest British Columbia. Report to BC Hydro. Schaefer, M., Catalog Of Extreme Storms for use in Probable Maximum Precipitation Study for Southwest British Columbia. MGS Engineering, Olympia, WA. U.S. Department of Commerce, Probable Maximum Precipitation Pacific Northwest States. Hydrometeorological Report No. 57 (HMR-57), Silver Spring, MD.


20 Figure 1. Example of a 100-year, 24-hour Maximum Precipitation Map

21 Figure 2. Estimated Percent of 100-year Precipitation Observed During a Storm
 for Southwest British Columbia and")
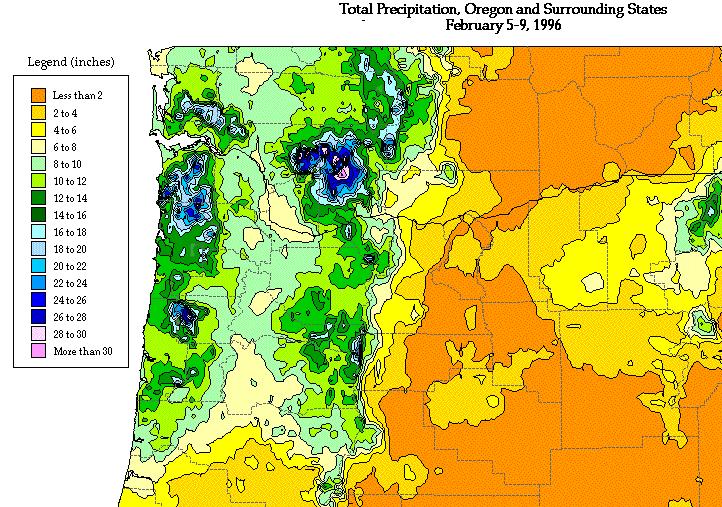
22 Figure 3. Estimated One-Day Precipitation for a Storm Event Figure 4. T over C (total to convergence precipitation) for Southwest British Columbia and Northwest Washington
 for Southwest")
23 Figure 5. Probable maximum Precipitation (PMP) for Southwest British Columbia and Northwest Washington
The general procedure for estimating 24-hour PMP includes the following steps:
 14th Conference on Applied Climatology Abstract # 71520 Using PRISM Climate Grids and GIS for Extreme Precipitation Mapping George H. Taylor and Christopher Daly Oregon State University Corvallis Oregon
Dam Safety: Revisiting PMPs
 Dam Safety: Revisiting PMPs Many dam safety officials use probable maximum precipitation (PMP) for dam safety evaluations and design requirements. But the series of federal publications that provides PMP
Updating PMP to Provide Better Dam and Spillway Design
 Protections 2016 2 nd International Seminar on Dam Protection Against Overtopping ISBN: 978-1-1889143-27-9 DOI: Ft. Collins, Colorado, USA, 7-9 September 2016 Updating PMP to Provide Better Dam and Spillway
PO Box 680 Monument, Co / appliedweatherassociates.com. Probable Maximum Precipitation (PMP)
") PO Box 680 Monument, Co 80132 719/488-9117 appliedweatherassociates.com Probable Maximum Precipitation (PMP) Probable Maximum Precipitation Introduction Concept of Probable Maximum Precipitation (PMP)
PO Box 680 Monument, Co 80132 719/488-9117 appliedweatherassociates.com Probable Maximum Precipitation (PMP) Probable Maximum Precipitation Introduction Concept of Probable Maximum Precipitation (PMP)
Probable Maximum Precipitation Study
 Probable Maximum Precipitation Study Virginia Floodplain Management Association Workshop Thursday, October 29, 2015 Robert T. Bennett, PE, RA, CFM DCR Dam Safety & Floodplain Management Definition (4VAC50-20-50.H)
Arizona Statewide Probable Maximum Precipitation (PMP), Improving HMR 49
, Improving HMR 49") Arizona Statewide Probable Maximum Precipitation (PMP), Improving HMR 49 Edward M. Tomlinson, Ph.D., Applied Weather Associates, LLC* William D. Kappel, Applied Weather Associates, LLC* Michael Johnson,
Arizona Statewide Probable Maximum Precipitation (PMP), Improving HMR 49 Edward M. Tomlinson, Ph.D., Applied Weather Associates, LLC* William D. Kappel, Applied Weather Associates, LLC* Michael Johnson,
P6.3 QPFHELPER: APPLICATION OF THE MOUNTAIN MAPPER FORECAST TECHNIQUE WITHIN THE GRAPHICAL FORECAST EDITOR
 P6.3 QPFHELPER: APPLICATION OF THE MOUNTAIN MAPPER FORECAST TECHNIQUE WITHIN THE GRAPHICAL FORECAST EDITOR Chris Gibson * Science and Operations Officer National Weather Service, Missoula, MT Ken Pomeroy
Presented by Jerry A. Gomez, P.E. National Hydropower Association Northeast Regional Meeting - September 17, 2009
 Presented by Jerry A. Gomez, P.E. National Hydropower Association Northeast Regional Meeting - September 17, 2009 Defining Probable Maximum Precipitation (PMP) PMP is the theoretically greatest depth of
NRC Workshop - Probabilistic Flood Hazard Assessment Jan 2013
 Regional Precipitation-Frequency Analysis And Extreme Storms Including PMP Current State of Understanding/Practice Mel Schaefer Ph.D. P.E. MGS Engineering Consultants, Inc. Olympia, WA NRC Workshop - Probabilistic
TEMPORAL DISTIRUBTION OF PMP RAINFALL AS A FUNCTION OF AREA SIZE. Introduction
 TEMPORAL DISTIRUBTION OF PMP RAINFALL AS A FUNCTION OF AREA SIZE Bill D. Kappel, Applied Weather Associates, LLC Edward M. Tomlinson, Ph.D., Applied Weather Associates, LLC Tye W. Parzybok, Metstat, Inc.
MIDWEST PROBABLE MAXIMUM PRECIPITATION STUDIES
 MIDWEST PROBABLE MAXIMUM PRECIPITATION STUDIES Bill Kappel Senior Meteorologist/Vice President Ed Tomlinson, PhD Chief Meteorologist/President Applied Weather Associates www.appliedweatherassociates.com
Recent Updates to NOAA/NWS Precipitation Frequency Estimates
 Recent Updates to NOAA/NWS Precipitation Frequency Estimates Geoffrey M. Bonnin Director, Hydrometeorological Design Studies Center Chief, Hydrologic Data Systems Branch Office of Hydrologic Development
Development of High-Quality Spatial Climate Datasets for the United States*
 Development of High-Quality Spatial Climate Datasets for the United States* Christopher Daly, George H. Taylor, Wayne P. Gibson, and Tye Parzybok Oregon State University Corvallis, Oregon, USA Gregory
Updating Probable Maximum Precipitation for the Tennessee Valley Authority
 Updating Probable Maximum Precipitation for the Tennessee Valley Authority Bill Kappel, President/Senior Meteorologist Applied Weather Associates, Monument, CO www.appliedweatherassociates.com Mike Eiffe,
Stochastic Modeling of Extreme Floods on the American River at Folsom Dam
 US Army Corps of Engineers Hydrologic Engineering Center Stochastic Modeling of Extreme Floods on the American River at Folsom Dam Appendix D - Procedures Implemented for Conducting Storm Analyses in Support
JEFF JOHNSON S Winter Weather Outlook
 JEFF JOHNSON S 2017-2018 Winter Weather Outlook TABLE OF CONTENTS ABOUT THE AUTHOR Components of the seasonal outlook... 2 ENSO state/ocean temperatures... 3 Sub-seasonal outlooks... 4 Forecast models...
Weather and Climate Summary and Forecast Winter
 Weather and Climate Summary and Forecast Winter 2016-17 Gregory V. Jones Southern Oregon University February 7, 2017 What a difference from last year at this time. Temperatures in January and February
The following information is provided for your use in describing climate and water supply conditions in the West as of April 1, 2003.
 Natural Resources Conservation Service National Water and Climate Center 101 SW Main Street, Suite 1600 Portland, OR 97204-3224 Date: April 8, 2003 Subject: April 1, 2003 Western Snowpack Conditions and
Changes to Extreme Precipitation Events: What the Historical Record Shows and What It Means for Engineers
 Changes to Extreme Precipitation Events: What the Historical Record Shows and What It Means for Engineers Geoffrey M Bonnin National Oceanic and Atmospheric Administration National Weather Service Office
Comparison of physical and statistical methods for estimating probable maximum precipitation in southwestern basins of Iran
 Fattahi et al. / DESERT 15 (2010) 127-132 DESERT DESERT Online at http://jdesert.ut.ac.ir DESERT 15 (2010) 127-132 Comparison of physical and statistical methods for estimating probable maximum precipitation
BSYSE 456/556 Surface Hydrologic Processes and Modeling
 BSYSE 456/556 Surface Hydrologic Processes and Modeling Lab 9 (Prepared by Erin Brooks and Jan Boll, UI, and Joan Wu, WSU) P Introduction One of the most difficult tasks in watershed assessment and management
SAMPLE. SITE SPECIFIC WEATHER ANALYSIS Rainfall Report. Bevens Engineering, Inc. Susan M. Benedict REFERENCE:
 SAMPLE SITE SPECIFIC WEATHER ANALYSIS Rainfall Report PREPARED FOR: Bevens Engineering, Inc. Susan M. Benedict REFERENCE: DUBOWSKI RESIDENCE / FILE# 11511033 CompuWeather Sample Report Please note that
INVISIBLE WATER COSTS
 Every Drop Every Counts... Drop Counts... INVISIBLE WATER COSTS Corn - 108.1 gallons per pound How much water it takes to produce... Apple - 18.5 gallons to grow Beef - 1,581 gallons per pound Oats - 122.7
Stochastic Modeling of Extreme Floods on the American River at Folsom Dam
 US Army Corps of Engineers Hydrologic Engineering Center Stochastic Modeling of Extreme Floods on the American River at Folsom Dam Appendix J - Analysis of Storms Antecedent and Posterior to Extreme Storms
HyMet Company. Streamflow and Energy Generation Forecasting Model Columbia River Basin
 HyMet Company Streamflow and Energy Generation Forecasting Model Columbia River Basin HyMet Inc. Courthouse Square 19001 Vashon Hwy SW Suite 201 Vashon Island, WA 98070 Phone: 206-463-1610 Columbia River
A Synoptic Climatology of Heavy Precipitation Events in California
 A Synoptic Climatology of Heavy Precipitation Events in California Alan Haynes Hydrometeorological Analysis and Support (HAS) Forecaster National Weather Service California-Nevada River Forecast Center
ACCUMULATED PRECIPITATION IN INCHES
 CUMULATIVE PRECIPITATION WATER YEAR COLUMBIA BASIN ABOVE GRAND COULEE 84% of Normal 1971- Average ACCUMULATED PRECIPITATION IN INCHES 8 6 82% of Normal 85% of Normal 82% of Normal SNAKE RIVER BASIN ABOVE
CW3E Atmospheric River Update
 CW3E Atmospheric River Update Update on Late Season AR Forecast to Impact West Coast Later This Week - Little change from yesterday s forecast - Ensemble GFS members are still in good agreement of the
March 1, 2003 Western Snowpack Conditions and Water Supply Forecasts
 Natural Resources Conservation Service National Water and Climate Center 101 SW Main Street, Suite 1600 Portland, OR 97204-3224 Date: March 17, 2003 Subject: March 1, 2003 Western Snowpack Conditions and
Needs to Update Probable Maximum Precipitation for Determining Hydrologic Loading on Dams
 Needs to Update Probable Maximum Precipitation for Determining Hydrologic Loading on Dams USSD 2017 Annual Conference Anaheim, CA Chandra S. Pathak, PhD, PE, F.ASCE Engineering and Construction Branch
SAMPLE. SITE SPECIFIC WEATHER ANALYSIS Rainfall Report. Bevins Engineering, Inc. Susan M. Benedict. July 1, 2017 REFERENCE:
 SAMPLE SITE SPECIFIC WEATHER ANALYSIS Rainfall Report PREPARED FOR: Bevins Engineering, Inc. Susan M. Benedict July 1, 2017 REFERENCE: DUBOWSKI RESIDENCE / FILE# 11511033 1500 Water Street, Pensacola,
The Climate of Oregon Climate Zone 4 Northern Cascades
 /05 E55 Unbound issue No. 9/ is Does not circulate Special Report 916 May 1993 The Climate of Oregon Climate Zone 4 Property of OREGON STATE UNIVERSITY Library Serials Corvallis, OR 97331-4503 Agricultural
Prediction of Snow Water Equivalent in the Snake River Basin
 Hobbs et al. Seasonal Forecasting 1 Jon Hobbs Steve Guimond Nate Snook Meteorology 455 Seasonal Forecasting Prediction of Snow Water Equivalent in the Snake River Basin Abstract Mountainous regions of
NIDIS Intermountain West Drought Early Warning System January 15, 2019
 NIDIS Drought and Water Assessment NIDIS Intermountain West Drought Early Warning System January 15, 2019 Precipitation The images above use daily precipitation statistics from NWS COOP, CoCoRaHS, and
Folsom Dam Water Control Manual Update
 Folsom Dam Water Control Manual Update Public Workshop April 3, 2014 Location: Sterling Hotel Ballroom 1300 H Street, Sacramento US Army Corps of Engineers BUILDING STRONG WELCOME & INTRODUCTIONS 2 BUILDING
Recent Northwest Snow Drought Explained Mainly by Natural Factors and for That Matter May be Over
 Recent Northwest Snow Drought Explained Mainly by Natural Factors and for That Matter May be Over Recently in a Seattle Times article How One Number Touched of Big Climate Change Fight at UW it was reported
Ed Tomlinson, PhD Bill Kappel Applied Weather Associates LLC. Tye Parzybok Metstat Inc. Bryan Rappolt Genesis Weather Solutions LLC
 Use of NEXRAD Weather Radar Data with the Storm Precipitation Analysis System (SPAS) to Provide High Spatial Resolution Hourly Rainfall Analyses for Runoff Model Calibration and Validation Ed Tomlinson,
Weather and Climate Summary and Forecast March 2018 Report
 Weather and Climate Summary and Forecast March 2018 Report Gregory V. Jones Linfield College March 7, 2018 Summary: The ridge pattern that brought drier and warmer conditions from December through most
Results of Intensity-Duration- Frequency Analysis for Precipitation and Runoff under Changing Climate
 Results of Intensity-Duration- Frequency Analysis for Precipitation and Runoff under Changing Climate Supporting Casco Bay Region Climate Change Adaptation RRAP Eugene Yan, Alissa Jared, Julia Pierce,
Oregon Water Conditions Report April 17, 2017
 Oregon Water Conditions Report April 17, 2017 Mountain snowpack continues to maintain significant levels for mid-april. By late March, statewide snowpack had declined to 118 percent of normal after starting
Design Storms for Hydrologic Analysis
 Design Storms for Hydrologic Analysis Course Description This course is designed to fulfill two hours of continuing education credit for Professional Engineers. Its objective is to provide students with
Westmap: The Western Climate Mapping Initiative An Update
 Westmap: The Western Climate Mapping Initiative An Update Andrew Comrie 1, Kelly Redmond 2, Mary Glueck 1, Hauss Reinbold 3, Chris Daly 4 1 University of Arizona, 2 DRI / Western Regional Climate Center
ACCUMULATED PRECIPITATION IN INCHES
 40 30 CUMULATIVE PRECIPITATION WATER YEAR 2010 COLUMBIA BASIN ABOVE GRAND COULEE 164% of Normal 1971-2000 Average ACCUMULATED PRECIPITATION IN INCHES 20 10 0 30 20 10 0 40 30 20 10 0 80 60 40 154% of Normal
NRC Workshop Probabilistic Flood Hazard Assessment (PFHA) Jan 29-31, Mel Schaefer Ph.D. P.E. MGS Engineering Consultants, Inc.
 Jan 29-31, Mel Schaefer Ph.D. P.E. MGS Engineering Consultants, Inc.") Stochastic Event Flood Model (SEFM) Stochastic Modeling of Extreme Floods A Hydrological Tool for Analysis of Extreme Floods Mel Schaefer Ph.D. P.E. MGS Engineering Consultants, Inc. Olympia, WA NRC Workshop
Stochastic Event Flood Model (SEFM) Stochastic Modeling of Extreme Floods A Hydrological Tool for Analysis of Extreme Floods Mel Schaefer Ph.D. P.E. MGS Engineering Consultants, Inc. Olympia, WA NRC Workshop
ACCUMULATED PRECIPITATION IN INCHES
 4 3 CUMULATIVE PRECIPITATION WATER YEAR 7 COLUMBIA BASIN ABOVE GRAND COULEE 18% of Normal 1971- Average ACCUMULATED PRECIPITATION IN INCHES 1 3 1 4 3 1 8 6 4 94% of Normal 17% of Normal 118% of Normal
Weather and Climate Summary and Forecast February 2018 Report
 Weather and Climate Summary and Forecast February 2018 Report Gregory V. Jones Linfield College February 5, 2018 Summary: For the majority of the month of January the persistent ridge of high pressure
CHAPTER 13 WEATHER ANALYSIS AND FORECASTING MULTIPLE CHOICE QUESTIONS
 CHAPTER 13 WEATHER ANALYSIS AND FORECASTING MULTIPLE CHOICE QUESTIONS 1. The atmosphere is a continuous fluid that envelops the globe, so that weather observation, analysis, and forecasting require international
Fire Season Prediction for Canada, Kerry Anderson Canadian Forest Service
 Fire Season Prediction for Canada, 2014 Kerry Anderson Canadian Forest Service 1 Introduction The Canadian Forest Service is now presenting monthly and seasonal forecast maps through the Canadian Wildland
StreamStats: Delivering Streamflow Information to the Public. By Kernell Ries
 StreamStats: Delivering Streamflow Information to the Public By Kernell Ries U.S. Department of the Interior U.S. Geological Survey MD-DE-DC District 410-238-4317 kries@usgs.gov StreamStats Web Application
Bill Kappel. Doug Hultstrand. Applied Weather Associates
 Cool-Season PMP/PMF Meteorological Time Series for Snow Melt Calculations Bill Kappel Senior Meteorologist/Vice President Doug Hultstrand Hydrometeorologist Applied Weather Associates www.appliedweatherassociates.com
LITERATURE REVIEW. History. In 1888, the U.S. Signal Service installed the first automatic rain gage used to
 LITERATURE REVIEW History In 1888, the U.S. Signal Service installed the first automatic rain gage used to record intensive precipitation for short periods (Yarnell, 1935). Using the records from this
Variability Across Space
 Variability and Vulnerability of Western US Snowpack Potential impacts of Climactic Change Mark Losleben, Kurt Chowanski Mountain Research Station, University of Colorado Introduction The Western United
The Stochastic Event Flood Model Applied to Minidoka Dam on the Snake River, Idaho
 The Stochastic Event Flood Model Applied to Minidoka Dam on the Snake River, Idaho K. L. Bullard 1, M. G. Schaeffer 2, B. A. Barker 3, D. Sutley 4, and V. Leverson 5 1 Bureau of Reclamation, Flood Hydrology
Operational MRCC Tools Useful and Usable by the National Weather Service
 Operational MRCC Tools Useful and Usable by the National Weather Service Vegetation Impact Program (VIP): Frost / Freeze Project Beth Hall Accumulated Winter Season Severity Index (AWSSI) Steve Hilberg
SAMPLE. SITE SPECIFIC WEATHER ANALYSIS Wind Report. Robinson, Smith & Walsh. John Smith REFERENCE:
 SAMPLE SITE SPECIFIC WEATHER ANALYSIS Wind Report PREPARED FOR: Robinson, Smith & Walsh John Smith REFERENCE: JACK HIGGINS / 4151559-01 CompuWeather Sample Report Please note that this report contains
SAMPLE. SITE SPECIFIC WEATHER ANALYSIS Wind Report. Robinson, Smith & Walsh. John Smith. July 1, 2017 REFERENCE: 1 Maple Street, Houston, TX 77034
 SAMPLE SITE SPECIFIC WEATHER ANALYSIS Wind Report PREPARED FOR: Robinson, Smith & Walsh John Smith July 1, 2017 REFERENCE: JACK HIGGINS / 4151559-01 1 Maple Street, Houston, TX 77034 CompuWeather Sample
New NOAA Precipitation-Frequency Atlas for Wisconsin
 New NOAA Precipitation-Frequency Atlas for Wisconsin #215966 Presentation to the Milwaukee Metropolitan Sewerage District Technical Advisory Team January 16, 2014 Michael G. Hahn, P.E., P.H. SEWRPC Chief
Weather and Climate Summary and Forecast January 2018 Report
 Weather and Climate Summary and Forecast January 2018 Report Gregory V. Jones Linfield College January 5, 2018 Summary: A persistent ridge of high pressure over the west in December produced strong inversions
Central Asia Regional Flash Flood Guidance System 4-6 October Hydrologic Research Center A Nonprofit, Public-Benefit Corporation
 http://www.hrcwater.org Central Asia Regional Flash Flood Guidance System 4-6 October 2016 Hydrologic Research Center A Nonprofit, Public-Benefit Corporation FFGS Snow Components Snow Accumulation and
An Overview of Operations at the West Gulf River Forecast Center Gregory Waller Service Coordination Hydrologist NWS - West Gulf River Forecast Center
 National Weather Service West Gulf River Forecast Center An Overview of Operations at the West Gulf River Forecast Center Gregory Waller Service Coordination Hydrologist NWS - West Gulf River Forecast
BUILDING A GRIDDED CLIMATOLOGICAL DATASET FOR USE IN THE STATISTICAL INTERPRETATION OF NUMERICAL WEATHER PREDICTION MODELS
 JP 1.6 BUILDING A GRIDDED CLIMATOLOGICAL DATASET FOR USE IN THE STATISTICAL INTERPRETATION OF NUMERICAL WEATHER PREDICTION MODELS Rachel A. Trimarco, Kari L. Sheets, and Kathryn K. Hughes Meteorological
Operational Perspectives on Hydrologic Model Data Assimilation
 Operational Perspectives on Hydrologic Model Data Assimilation Rob Hartman Hydrologist in Charge NOAA / National Weather Service California-Nevada River Forecast Center Sacramento, CA USA Outline Operational
4.5 Comparison of weather data from the Remote Automated Weather Station network and the North American Regional Reanalysis
 4.5 Comparison of weather data from the Remote Automated Weather Station network and the North American Regional Reanalysis Beth L. Hall and Timothy. J. Brown DRI, Reno, NV ABSTRACT. The North American
STRUCTURAL ENGINEERS ASSOCIATION OF OREGON
 STRUCTURAL ENGINEERS ASSOCIATION OF OREGON P.O. Box 3285 PORTLAND, OR 97208 503.753.3075 www.seao.org E-mail: jane@seao.org 2010 OREGON SNOW LOAD MAP UPDATE AND INTERIM GUIDELINES FOR SNOW LOAD DETERMINATION
Hydrologic Research Laboratory Department of Civil and Environmental Engineering University of California, Davis
 Physically-Based Estimation of Maximum Precipitation: Preliminary Results on Application to American River Basin for the December,1996-January,1997 Flood Event Hydrologic Research Laboratory Department
Weather and Climate of the Rogue Valley By Gregory V. Jones, Ph.D., Southern Oregon University
 Weather and Climate of the Rogue Valley By Gregory V. Jones, Ph.D., Southern Oregon University The Rogue Valley region is one of many intermountain valley areas along the west coast of the United States.
SAMPLE. SITE SPECIFIC WEATHER ANALYSIS Slip and Fall on Snow/Ice. Robinson, Smith & Walsh. John Smith. July 1, 2017 REFERENCE:
 SAMPLE SITE SPECIFIC WEATHER ANALYSIS Slip and Fall on Snow/Ice PREPARED FOR: Robinson, Smith & Walsh John Smith July 1, 2017 REFERENCE: MARIE DAVIDSON / 202301 1 Jackson Drive, Hicksville, NY 11801 CompuWeather
The Kentucky Mesonet: Entering a New Phase
 The Kentucky Mesonet: Entering a New Phase Stuart A. Foster State Climatologist Kentucky Climate Center Western Kentucky University KCJEA Winter Conference Lexington, Kentucky February 9, 2017 Kentucky
B.2 Sources for Hazard Identification, Profiling, and Ranking (Section 3) Overview of Sussex County s History of Hazards
 Overview of Sussex County s History of Hazards") Appendix B Sources B.1 Sources for Planning Process (Section 2) FEMA. Mitigation Planning Guidance (386 Series). Available on the web at: http://www.fema.gov/plan/mitplanning/planning_resources.shtm FEMA
Appendix B Sources B.1 Sources for Planning Process (Section 2) FEMA. Mitigation Planning Guidance (386 Series). Available on the web at: http://www.fema.gov/plan/mitplanning/planning_resources.shtm FEMA
SuperPack North America
 SuperPack North America Speedwell SuperPack makes available an unprecedented range of quality historical weather data, and weather data feeds for a single annual fee. SuperPack dramatically simplifies
2011 National Seasonal Assessment Workshop for the Eastern, Southern, & Southwest Geographic Areas
 2011 National Seasonal Assessment Workshop for the Eastern, Southern, & Southwest Geographic Areas On January 11-13, 2011, wildland fire, weather, and climate met virtually for the ninth annual National
Lecture 3. Data Sources for GIS in Water Resources
 Lecture 3 Data Sources for GIS in Water Resources GIS in Water Resources Spring 2015 http://www.data.gov/ 1 USGS GIS data for Water http://water.usgs.gov/maps.html Watersheds of the US 2-digit water resource
ALASKA ENERGY AUTHORITY AEA REP Appendix A. Probable Maximum Precipitation Study REP. Applied Weather Associates
 13-1402-REP-123114 Appendix A Probable Maximum Precipitation Study 14-07-REP by Applied Weather Associates Report 14-07-REP v1.0 Susitna-Watana Hydroelectric Project Probable Maximum Precipitation Study
National Weather Service. Harold H. Opitz Hydrologist in Charge
 National Weather Service Harold H. Opitz Hydrologist in Charge Goals Organization Role of the River Forecast Center Describe Forecast System & Tools Other Details NWS River Forecast Centers Northwest River
The Climate of Oregon Climate Zone 3 Southwest Interior
 .k) 105 Unbound issue " " 1 4oes not circulate C4P. Special Report 915 May 1993 The Climate of Oregon Climate Zone 3 Southwest Interior Property of OREGON STATE UNIVERSITY Library Serials Corvallis, OR
Climatic and Hydrologic Trends in the Western U.S.: A Review of Recent Peer-Reviewed Research
 Feature Article From Intermountain West Climate Summary, January 2007 Climatic and Hydrologic Trends in the Western U.S.: A Review of Recent Peer-Reviewed Research By Brad Udall, WWA and Gary Bates, NOAA/ESRL/PSD
ACCUMULATED PRECIPITATION IN INCHES
 CUMULATIVE PRECIPITATION WATER YEAR 9 COLUMBIA BASIN ABOVE GRAND COULEE 87% of Normal 1971- Average ACCUMULATED PRECIPITATION IN INCHES 8 6 97% of Normal 94% of Normal 77% of Normal SNAKE RIVER BASIN ABOVE
P3.1 Development of MOS Thunderstorm and Severe Thunderstorm Forecast Equations with Multiple Data Sources
 P3.1 Development of MOS Thunderstorm and Severe Thunderstorm Forecast Equations with Multiple Data Sources Kathryn K. Hughes * Meteorological Development Laboratory Office of Science and Technology National
Robert Shedd Northeast River Forecast Center National Weather Service Taunton, Massachusetts, USA
 Robert Shedd Northeast River Forecast Center National Weather Service Taunton, Massachusetts, USA Outline River Forecast Centers FEWS Implementation Status Forcing Data Ensemble Forecasting The Northeast
Oregon Water Conditions Report May 1, 2017
 Oregon Water Conditions Report May 1, 2017 Mountain snowpack in the higher elevations has continued to increase over the last two weeks. Statewide, most low and mid elevation snow has melted so the basin
Weather and Climate Summary and Forecast April 2018 Report
 Weather and Climate Summary and Forecast April 2018 Report Gregory V. Jones Linfield College April 4, 2018 Summary: A near Miracle March played out bringing cooler and wetter conditions to the majority
Daria Scott Dept. of Geography University of Delaware, Newark, Delaware
 5.2 VARIABILITY AND TRENDS IN UNITED STA TES SNOWFALL OVER THE LAST HALF CENTURY Daria Scott Dept. of Geography University of Delaware, Newark, Delaware Dale Kaiser* Carbon Dioxide Information Analysis
Display and analysis of weather data from NCDC using ArcGIS
 Display and analysis of weather data from NCDC using ArcGIS Helen M. Cox Associate Professor Geography Department California State University, Northridge and Stephen Krug Graduate Student Geography Department
2015: A YEAR IN REVIEW F.S. ANSLOW
 2015: A YEAR IN REVIEW F.S. ANSLOW 1 INTRODUCTION Recently, three of the major centres for global climate monitoring determined with high confidence that 2015 was the warmest year on record, globally.
The Tahoe Climate Information Management System (Tahoeclim)
") The Tahoe Climate Information Management System (Tahoeclim) Final Report August 2016 Kelly T. Redmond 1, Geoff Schladow 2 1 Desert Research Institute Reno, NV 2 Tahoe Environmental Research Center, UC
The Tahoe Climate Information Management System (Tahoeclim) Final Report August 2016 Kelly T. Redmond 1, Geoff Schladow 2 1 Desert Research Institute Reno, NV 2 Tahoe Environmental Research Center, UC
Speakers: NWS Buffalo Dan Kelly and Sarah Jamison, NERFC Jeane Wallace. NWS Flood Services for the Black River Basin
 Speakers: NWS Buffalo Dan Kelly and Sarah Jamison, NERFC Jeane Wallace NWS Flood Services for the Black River Basin National Weather Service Who We Are The National Oceanic and Atmospheric Administration
USGS ATLAS. BACKGROUND
 USGS ATLAS. BACKGROUND 1998. Asquith. DEPTH-DURATION FREQUENCY OF PRECIPITATION FOR TEXAS. USGS Water-Resources Investigations Report 98 4044. Defines the depth-duration frequency (DDF) of rainfall annual
The Documentation of Extreme Hydrometeorlogical Events: Two Case Studies in Utah, Water Year 2005
 The Documentation of Extreme Hydrometeorlogical Events: Two Case Studies in Utah, Water Year 2005 Tim Bardsley1*, Mark Losleben2, Randy Julander1 1. USDA, NRCS, Snow Survey Program, Salt Lake City, Utah.
National Wildland Significant Fire Potential Outlook
 National Wildland Significant Fire Potential Outlook National Interagency Fire Center Predictive Services Issued: September, 2007 Wildland Fire Outlook September through December 2007 Significant fire
Montana Drought & Climate
 Montana Drought & Climate MARCH 219 MONITORING AND FORECASTING FOR AGRICULTURE PRODUCERS A SERVICE OF THE MONTANA CLIMATE OFFICE IN THIS ISSUE IN BRIEF PAGE 2 REFERENCE In a Word PAGE 3 REVIEW Winter 219:
UP-TO-DATE MONTHLY CLIMATE MAPS FOR THE CONTERMINOUS UNITED STATES
 P5.1 UP-TO-DATE MONTHLY CLIMATE MAPS FOR THE CONTERMINOUS UNITED STATES Christopher Daly*, Wayne Gibson, Matt Doggett, Joseph Smith, and George Taylor Oregon State University, Corvallis, OR 1. INTRODUCTION
Weather and Climate Summary and Forecast March 2019 Report
 Weather and Climate Summary and Forecast March 2019 Report Gregory V. Jones Linfield College March 2, 2019 Summary: Dramatic flip from a mild winter to a top five coldest February on record in many locations
Weather and Climate Summary and Forecast Winter
 Weather and Climate Summary and Forecast Winter 2016-17 Gregory V. Jones Southern Oregon University December 5, 2016 Well after an October that felt more like November, we just finished a November that
Solution: The ratio of normal rainfall at station A to normal rainfall at station i or NR A /NR i has been calculated and is given in table below.
 3.6 ESTIMATION OF MISSING DATA Data for the period of missing rainfall data could be filled using estimation technique. The length of period up to which the data could be filled is dependent on individual
Weather and Climate Summary and Forecast Summer 2017
 Weather and Climate Summary and Forecast Summer 2017 Gregory V. Jones Southern Oregon University August 4, 2017 July largely held true to forecast, although it ended with the start of one of the most extreme
NWSEO CALLS FOR NATIONAL CLIMATE SERVICE TO BE MADE PART OF THE NATIONAL WEATHER SERVICE
 APRIL 2009 NWSEO CALLS FOR NATIONAL CLIMATE SERVICE TO BE MADE PART OF THE NATIONAL WEATHER SERVICE At its recent winter meeting, the NWSEO National Council decided to urge the Administration and Congress
NIDIS Intermountain West Drought Early Warning System February 12, 2019
 NIDIS Intermountain West Drought Early Warning System February 12, 2019 Precipitation The images above use daily precipitation statistics from NWS COOP, CoCoRaHS, and CoAgMet stations. From top to bottom,
10.5 PROBABLISTIC LIGHTNING FORECASTS AND FUEL DRYNESS LEVEL FORECASTS IN THE GRAPHICAL FOREAST EDITOR: EXPANDED DOMAIN AND DISTRIBUTION FOR 2009
 10.5 PROBABLISTIC LIGHTNING FORECASTS AND FUEL DRYNESS LEVEL FORECASTS IN THE GRAPHICAL FOREAST EDITOR: EXPANDED DOMAIN AND DISTRIBUTION FOR 2009 Chris V. Gibson 1*, and P. D. Bothwell 2, S. Sharples 3,
Stochastic Modeling of Extreme Floods on the American River at Folsom Dam
 US Army Corps of Engineers Hydrologic Engineering Center Stochastic Modeling of Extreme Floods on the American River at Folsom Dam Appendix F - Analysis of Air Temperature Profiles and Air Temperature
Presentation Overview. Southwestern Climate: Past, present and future. Global Energy Balance. What is climate?
 Southwestern Climate: Past, present and future Mike Crimmins Climate Science Extension Specialist Dept. of Soil, Water, & Env. Science & Arizona Cooperative Extension The University of Arizona Presentation