The Documentation of Extreme Hydrometeorlogical Events: Two Case Studies in Utah, Water Year 2005
|
|
|
- Brittany Wade
- 5 years ago
- Views:
Transcription


1 The Documentation of Extreme Hydrometeorlogical Events: Two Case Studies in Utah, Water Year 2005 Tim Bardsley1*, Mark Losleben2, Randy Julander1 1. USDA, NRCS, Snow Survey Program, Salt Lake City, Utah. 2. INSTAAR, University of Colorado, Boulder, Coloroado. * Corresponding Author, contact at Timothy.Bardsley@ut.usda.gov
2 INTRODUCTION The Natural Resources Conservation Service (NRCS) maintains a network of over 700 automated hydrometeorlogical stations called SNOTEL SNOw TELemetry for the purpose of making water supply predictions. These stations consist of a snow pillow to measure the snow water equivalent of the snowpack, a precipitation gage, air temperature, and in many cases snow depth and soil moisture. Many SNOTEL sites and all sites out of the Utah Data Collection Office (DCO) are now measured hourly. The SNOTEL network represents the largest network of near real-time hydrometeorlogical stations in the mountainous regions of the Western U.S. As such, data from the SNOTEL system are used for a large variety of applications. Extreme events are encountered during the course of data collection. These events are of particular interest to a wide variety of data users, due to large economic impacts of associated floods and droughts. The Utah DCO is working towards implementing a program-wide protocol for the documentation of such events. A current working definition of an extreme event requiring greater investigation is when a site with 15 or more years of record is outside the historic upper or lower 5%, and these data could have extreme consequences. These events will be validated and documented using whatever means are practical and reasonable, including, but not limited to, ground verification, comparison with neighboring sites, and remote sensing products. Two such events were apparent during the first third of the 2005 water year in Utah, and are the motivation for this poster. They are the events of October 17 to October23, 2004, and January 8 to January 11, 2005, and will be presented here.
 Figure 2.")
3 Circulation Indicies and Vector Analysis Southerly (S) Westerly (W) Flow Strength (F) Vorticity (Z) Std. Deviation from Ave. October January Figure 1. October 20, mb Geopotential Height Anomaly Map. Scale is in meters and based on 1968 to (NOAA-CIRES/Climate Diagnostic Center) Figure 2. Circulation Indices and Vector Analysis Results for the October and January storms vs to 2004 average. October 2004 Storm Analysis: A strong low pressure system centered off the coast of Northern California creating a strong SW flow over Utah (Figure1). Circulation and Vector analysis indicates this event was dominated by greater southerly vectors (S) and stronger air flow (F). Interestingly, increased vorticity (Z), or atmospheric instability, was not a factor (Figure 2). For more information on this technique, see Losleben (2000). Storm totals for October 17th through 23rd ranged between 31.5cm and 2cm with an average of 12.7 cm for 88 sites. This storm was followed by another significant, but lower intensity storm with little or no gap at many sites before the beginning of November. Of the 77 SNOTEL sites with a period of record of 15 years or greater, 51 had the cumulative October precipitation of record, and two tied the record. Twenty-four hour precipitation intensity frequency analysis revealed 12 of 86 sites (two missing) in excess of 25 year return intervals with 6 of those sites exceeding 100 year return intervals, with Gutz Peak site exceeding 1000 years (Figure 3) (NOAA 2005). Five of the six highest intensity sites were in the Southwest region of Utah. Additionally, the maximum 24 hour precipitation was compared with the historic 24 hour maximum, when sites had 15 or more years of record. This reveled 12 of 77 sites with a record 24 hour precipitation intensity, six of which were in SW Utah.

4 Stream Response: In general stream response to this event was relatively benign. This was in part a result of very low antecedent soil moisture and snowpack conditions. Most rivers showed moderate increases, while rivers in the Southwest and South-Central regions of the State showed increases on the order of 100 fold, these were still well below flood stage, and reservoir levels allowed much of this water to be captured. Figure 3. Average return interval for maximum 24 hour precipitation intensity. Select sites indicate maximum rate.

 Figure 5.")
5 Figure 4. January 11, 2005 Geopotential Height Anomaly Map Scale is in meters and based on 1968 to 1996 (NOAA-CIRES) Figure 5. Basin Average precipitation and SWE increase for January event.
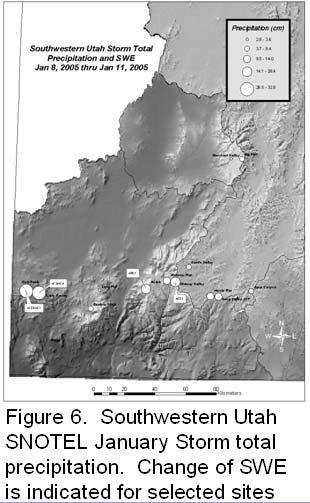
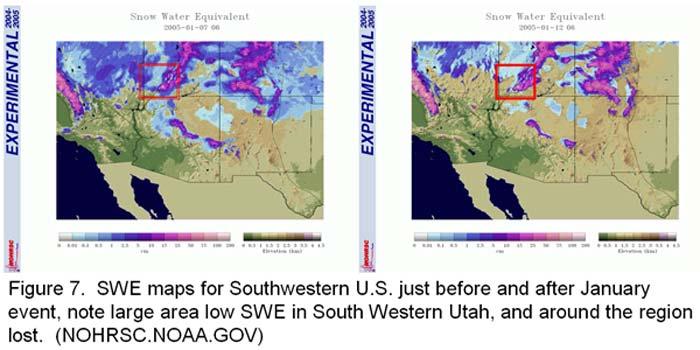
6 January 2005 Storm Analysis: Another very deep and slow moving low pressure system centered over the Southwest U.S. brought warm moist air over Utah for the days of this event. The timing of this storm was from January 8th to 11th The atmospheric circulation creating the January event was very similar to that of the October event, but with slightly weaker low pressure and Southwest flow (figure 4). This slightly weaker system corresponded to a somewhat weaker southerly flow (S) and flow vector (F), but a stronger westerly flow vector (W) (Figure 2). Similar to the October event, this storm impacted most of the state of Utah, but run-off in all but the Southwestern portion of the State was moderated as nearly all of these areas experience almost exclusively snow. Portions of Southwestern Utah collected a mixture of rain and snow, and had greater accumulation than other parts of the State. Basin average accumulated precipitation and snow water equivalent (SWE) for the entire state is displayed in (Figure 5). A closer look at accumulation in the Southwestern region of the State can be found in (Figure 6). The Little Grassy SNOTEL is the lowest elevation SNOTEL site in the Virgin Basin at 1830 meters. This site showed little net change in SWE during the event, starting and ending the event at near 15cm of SWE, indicating mostly rain fell at this elevation, but passed through the snowpack without causing significant melt. SNOTEL sites above approximately 2130 meters in this region collected nearly all precipitation as SWE and therefore did not represent a winter flooding risk. There is however a very large area that is not adequately represented by any measurement network in the 1500-to-1830 meter range that had a significant snowpack before this event, and lost most if not all of it in addition to very high rain accumulation (Figure 7).
7
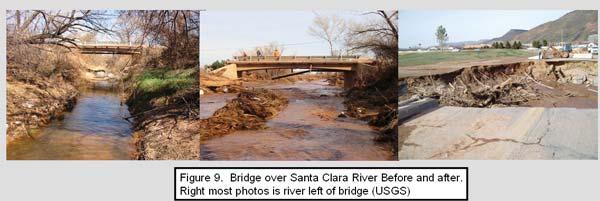
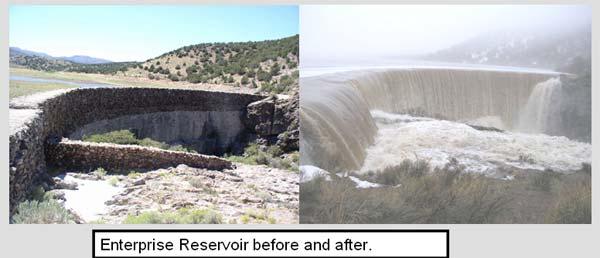
8 Stream Response: The stream response to the rain, rain on snow, and snowmelt event of January 8th to 11th 2005 was enormous, but very difficult to quantify. Runoff conditions were greatly enhanced by wet soil moisture conditions left behind by the October event, leading to unusually high runoff efficiency (Figure 8). Additionally, the loss of significant low elevation snowpack was a major contributor. Most of the USGS stream gages in the heaviest hit drainages of the Virgin, Santa Clara, and their tributaries were significantly compromised. The USGS has estimated flows and return intervals for the stations in the area, but only stations in less severely impacted areas have continuous real time records that include the peak flow. Many stations had estimated recurrence intervals near and in excess of 100 years (USGS 2005a, USGS 2005b). Stream channels were very significantly altered and had an enormous impact on adjacent property and infrastructure (Figures 9).
9
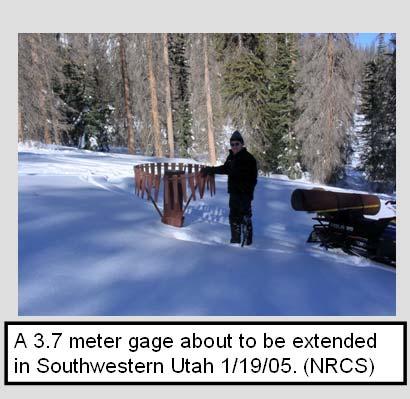
10 Data Quality Assurance Standard methods for data quality insurance include but are not limited to, ground verification, and comparison with neighboring sites, redundant instrumentation, and additional land and satellite data networks. The nature of an extreme event causes difficulty with remote stations, and requires greater data scrutiny. The relatively warm temperatures of the October event allowed precipitation measurements work accurately with very few exceptions. Ground verification of eight high accumulation sites shortly after this event revealed very close agreement with telemetered values. The much colder temps and greater snow component of the January event caused significant problems with precipitation measurements. Snow plugs formed in many gages preventing the real time measurements. In these cases, real-time estimates were made based on changes in SWE, snow depth, and neighboring sites. A more accurate post event estimate was made after the plug is naturally of manually removed. Six high accumulation sites were visited shortly after the January event. Precipitation plugs, if present were removed and ground verification taken. Post plug ground verification was consistent with telemetred values. These problems made frequency analysis impossible for the January event, but accurate estimates of storm totals were obtained. SUMMARY The Storms of October 17th - 23rd, 2004 and January 8th - 11th, 2005 had a very significant impact on immediate hydrologic conditions in the state of Utah as well as on the water year as a whole. While the January event was of similar magnitude to the October event, impacts of high flows far exceeded the October event. The October event set the stage for the extreme run-off generated in January. Estimates for damages caused by the January event exceed 150 million dollars (Utah Flood Relief, 2005). Combined precipitation totals from these two events were near the average water year total for several sites in the Southwestern region of the state. The extreme nature of these events will draw additional interest in hydrometeorlogical data from these time periods. In the near future data users will have access to an event summary report for these and future extreme events through the Utah Data Collection Office or its web page (NRCS 2005).
11 Acknowledgements: Thanks to Mike Bricco for his assistance in producing the GIS graphics, and Ray Wilson for valuable input. Photos: USGS and NRCS, top right photo source unknown References: Losleben, M., N. Pepin, S. Pedrick "Relationships of precipitation chemistry, atmospheric circulation, and elevation at two sites on the Colorado Front Range", Atmospheric Environment, 34, pp NRCS Utah Snow Survey Program (Web page); (Accessed November 30, 2005) NOAA Frequency NOAA s National Weather Service Hydrometeorlogical Design Studies Center, Precipitation Frequency Data Server. (Web page); (Accessed November 30, 2005) USGS. 2005a. USGS, Flood in the Virgin River Basin, Southwestern Utah, January 9-11, (Web page); (Accessed November 30, 2005) USGS. 2005b. USGS Daily Water Data for Utah. (Web page); (Accessed November 30, 2005) Utah Flood Relief Virgin River/Santa Clara River Flood Relief Inc, Foundation. (web page); (Accessed November 30, 2005)
12
13
-Assessment of current water conditions. - Precipitation Forecast. - Recommendations for Drought Monitor
 April 27, 2010 -Assessment of current water conditions - Precipitation Forecast - Recommendations for Drought Monitor 7 Day Precipitation 19-25 April 2010 Month-to-Date Precipitation 1-25 April 2010
Oregon Water Conditions Report May 1, 2017
 Oregon Water Conditions Report May 1, 2017 Mountain snowpack in the higher elevations has continued to increase over the last two weeks. Statewide, most low and mid elevation snow has melted so the basin
NIDIS Intermountain West Regional Drought Early Warning System February 7, 2017
 NIDIS Drought and Water Assessment NIDIS Intermountain West Regional Drought Early Warning System February 7, 2017 Precipitation The images above use daily precipitation statistics from NWS COOP, CoCoRaHS,
NIDIS Drought and Water Assessment
 NIDIS Drought and Water Assessment PRECIPITATION The images above use daily precipitation statistics from NWS COOP, CoCoRaHS, and CoAgMet stations. From top to bottom, and left to right: most recent 7-days
Upper Missouri River Basin December 2017 Calendar Year Runoff Forecast December 5, 2017
 Upper Missouri River Basin December 2017 Calendar Year Runoff Forecast December 5, 2017 Calendar Year Runoff Forecast Explanation and Purpose of Forecast U.S. Army Corps of Engineers, Northwestern Division
Upper Missouri River Basin February 2018 Calendar Year Runoff Forecast February 6, 2018
 Upper Missouri River Basin February 2018 Calendar Year Runoff Forecast February 6, 2018 Calendar Year Runoff Forecast Explanation and Purpose of Forecast U.S. Army Corps of Engineers, Northwestern Division
Flood Risk Assessment
 Flood Risk Assessment February 14, 2008 Larry Schick Army Corps of Engineers Seattle District Meteorologist General Assessment As promised, La Nina caused an active winter with above to much above normal
NIDIS Intermountain West Drought Early Warning System December 18, 2018
 NIDIS Intermountain West Drought Early Warning System December 18, 2018 Precipitation The images above use daily precipitation statistics from NWS COOP, CoCoRaHS, and CoAgMet stations. From top to bottom,
January 2011 Calendar Year Runoff Forecast
 January 2011 Calendar Year Runoff Forecast 2010 Runoff Year Calendar Year 2010 was the third highest year of runoff in the Missouri River Basin above Sioux City with 38.8 MAF, behind 1978 and 1997 which
Monthly Long Range Weather Commentary Issued: APRIL 18, 2017 Steven A. Root, CCM, Chief Analytics Officer, Sr. VP,
 Monthly Long Range Weather Commentary Issued: APRIL 18, 2017 Steven A. Root, CCM, Chief Analytics Officer, Sr. VP, sroot@weatherbank.com MARCH 2017 Climate Highlights The Month in Review The average contiguous
Operational Perspectives on Hydrologic Model Data Assimilation
 Operational Perspectives on Hydrologic Model Data Assimilation Rob Hartman Hydrologist in Charge NOAA / National Weather Service California-Nevada River Forecast Center Sacramento, CA USA Outline Operational
Arizona Climate Summary February 2012
 Arizona Climate Summary February 2012 Summary of conditions for January 2012 January 2012 Temperature and Precipitation Summary January 1 st 20 th : The New Year has started on a very dry note. The La
The hydrologic service area (HSA) for this office covers Central Kentucky and South Central Indiana.
 for this office covers Central Kentucky and South Central Indiana.") January 2012 February 13, 2012 An X inside this box indicates that no flooding occurred within this hydrologic service area. January 2012 continued the string of wet months this winter. Rainfall was generally
January 2012 February 13, 2012 An X inside this box indicates that no flooding occurred within this hydrologic service area. January 2012 continued the string of wet months this winter. Rainfall was generally
Bill Kappel. Doug Hultstrand. Applied Weather Associates
 Cool-Season PMP/PMF Meteorological Time Series for Snow Melt Calculations Bill Kappel Senior Meteorologist/Vice President Doug Hultstrand Hydrometeorologist Applied Weather Associates www.appliedweatherassociates.com
NIDIS Intermountain West Drought Early Warning System January 15, 2019
 NIDIS Drought and Water Assessment NIDIS Intermountain West Drought Early Warning System January 15, 2019 Precipitation The images above use daily precipitation statistics from NWS COOP, CoCoRaHS, and
NIDIS Intermountain West Drought Early Warning System February 12, 2019
 NIDIS Intermountain West Drought Early Warning System February 12, 2019 Precipitation The images above use daily precipitation statistics from NWS COOP, CoCoRaHS, and CoAgMet stations. From top to bottom,
WSWC/NOAA Workshops on S2S Precipitation Forecasting
 WSWC/NOAA Workshops on S2S Precipitation Forecasting San Diego, May 2015 Salt Lake City at NWS Western Region HQ, October 2015 Las Vegas at Colorado River Water Users Association, December 2015 College
The following information is provided for your use in describing climate and water supply conditions in the West as of April 1, 2003.
 Natural Resources Conservation Service National Water and Climate Center 101 SW Main Street, Suite 1600 Portland, OR 97204-3224 Date: April 8, 2003 Subject: April 1, 2003 Western Snowpack Conditions and
NIDIS Intermountain West Drought Early Warning System May 23, 2017
 NIDIS Drought and Water Assessment NIDIS Intermountain West Drought Early Warning System May 23, 2017 Precipitation The images above use daily precipitation statistics from NWS COOP, CoCoRaHS, and CoAgMet
Oregon Water Conditions Report April 17, 2017
 Oregon Water Conditions Report April 17, 2017 Mountain snowpack continues to maintain significant levels for mid-april. By late March, statewide snowpack had declined to 118 percent of normal after starting
Precipitation. Standardized Precipitation Index. NIDIS Intermountain West Regional Drought Early Warning System January 3, 2017
 1/3/2017 NIDIS Drought and Water Assessment NIDIS Intermountain West Regional Drought Early Warning System January 3, 2017 Precipitation The images above use daily precipitation statistics from NWS COOP,
Missouri River Basin Water Management
 Missouri River Basin Water Management US Army Corps of Engineers Missouri River Navigator s Meeting February 12, 2014 Bill Doan, P.E. Missouri River Basin Water Management US Army Corps of Engineers BUILDING
Novel Snotel Data Uses: Detecting Change in Snowpack Development Controls, and Remote Basin Snow Depth Modeling
 Novel Snotel Data Uses: Detecting Change in Snowpack Development Controls, and Remote Basin Snow Depth Modeling OVERVIEW Mark Losleben and Tyler Erickson INSTAAR, University of Colorado Mountain Research
NIDIS Weekly Climate, Water and Drought Assessment Summary. Upper Colorado River Basin
 NIDIS Weekly Climate, Water and Drought Assessment Summary Upper Colorado River Basin August 3, 2010 Precipitation and Snowpack Fig. 1: July precipitation in inches Fig. 2: July precip as percent of average
Prediction of Snow Water Equivalent in the Snake River Basin
 Hobbs et al. Seasonal Forecasting 1 Jon Hobbs Steve Guimond Nate Snook Meteorology 455 Seasonal Forecasting Prediction of Snow Water Equivalent in the Snake River Basin Abstract Mountainous regions of
FEMA Hazards Loss Modeling Task Force (MOTF) Situation Report #14. Colorado Spring Flood Risk ***FINAL REPORT***
 Situation Report #14. Colorado Spring Flood Risk ***FINAL REPORT***") FEMA Hazards Loss Modeling Task Force (MOTF) Situation Report #14 Colorado Spring Flood Risk FEMA Modeling Task Force (MOTF) Denver Federal Center, Building 710A Denver, Colorado 80225 Email: FEMA-MOTF@fema.dhs.gov
FEMA Hazards Loss Modeling Task Force (MOTF) Situation Report #14 Colorado Spring Flood Risk FEMA Modeling Task Force (MOTF) Denver Federal Center, Building 710A Denver, Colorado 80225 Email: FEMA-MOTF@fema.dhs.gov
HyMet Company. Streamflow and Energy Generation Forecasting Model Columbia River Basin
 HyMet Company Streamflow and Energy Generation Forecasting Model Columbia River Basin HyMet Inc. Courthouse Square 19001 Vashon Hwy SW Suite 201 Vashon Island, WA 98070 Phone: 206-463-1610 Columbia River
Upper Missouri River Basin January 2018 Calendar Year Runoff Forecast January 3, 2018
 Calendar Year Runoff Forecast Upper Missouri River Basin January 2018 Calendar Year Runoff Forecast January 3, 2018 Explanation and Purpose of Forecast U.S. Army Corps of Engineers, Northwestern Division
PRECIPITATION. Last Week Precipitation:
 2/24/2015 NIDIS Drought and Water Assessment PRECIPITATION The images above use daily precipitation statistics from NWS COOP, CoCoRaHS, and CoAgMet stations. From top to bottom, and left to right: most
Jessica Lundquist 1, Paul Neiman 3, Brooks Martner 2,3, Allen White 2,3, Dan Gottas 2,3, Marty Ralph 3
 PRELIMINARY STUDY RESULTS Rain versus Snow in the Sierra Nevada, CA: Comparing free-air observations of melting level with surface measurements Jessica Lundquist 1, Paul Neiman 3, Brooks Martner 2,3, Allen
NOAA Spring Flood Outlook for Iowa
 NOAA Spring Flood Outlook for Iowa Safeguard Iowa Partnership March 10, 2015 1 Agenda Orientation Maps Current Conditions Weather Outlook Spring Flood Outlook 2 1 Orientation Maps 3 4 2 5 Current Conditions
Highlights of the 2006 Water Year in Colorado
 Highlights of the 2006 Water Year in Colorado Nolan Doesken, State Climatologist Atmospheric Science Department Colorado State University http://ccc.atmos.colostate.edu Presented to 61 st Annual Meeting
Results of Intensity-Duration- Frequency Analysis for Precipitation and Runoff under Changing Climate
 Results of Intensity-Duration- Frequency Analysis for Precipitation and Runoff under Changing Climate Supporting Casco Bay Region Climate Change Adaptation RRAP Eugene Yan, Alissa Jared, Julia Pierce,
March 1, 2003 Western Snowpack Conditions and Water Supply Forecasts
 Natural Resources Conservation Service National Water and Climate Center 101 SW Main Street, Suite 1600 Portland, OR 97204-3224 Date: March 17, 2003 Subject: March 1, 2003 Western Snowpack Conditions and
Quenching the Valley s thirst: The connection between Sierra Nevada snowpack & regional water supply
 Quenching the Valley s thirst: The connection between Sierra Nevada snowpack & regional water supply Roger Bales, UC Merced Snow conditions Snow & climate change Research directions Sierra Nevada snow
NIDIS Intermountain West Drought Early Warning System November 14, 2017
 NIDIS Intermountain West Drought Early Warning System November 14, 2017 Precipitation The images above use daily precipitation statistics from NWS COOP, CoCoRaHS, and CoAgMet stations. From top to bottom,
Spatial and Temporal Variability in Snowpack Controls: Two Decades of SnoTel Data from the Western U.S.
 Spatial and Temporal Variability in Snowpack Controls: Two Decades of SnoTel Data from the Western U.S. Spatial and Temporal Variability in Snowpack Controls: Two Decades of SnoTel Data from the Western
Webinar and Weekly Summary February 15th, 2011
 Webinar and Weekly Summary February 15th, 2011 -Assessment of current water conditions - Precipitation Forecast - Recommendations for Drought Monitor Upper Colorado Normal Precipitation Upper Colorado
Missouri River Basin Water Management Monthly Update
 Missouri River Basin Water Management Monthly Update Participating Agencies 255 255 255 237 237 237 0 0 0 217 217 217 163 163 163 200 200 200 131 132 122 239 65 53 80 119 27 National Oceanic and Atmospheric
NIDIS Weekly Climate, Water and Drought Assessment Summary Upper Colorado River Basin Pilot Project 13 July 2010
 NIDIS Weekly Climate, Water and Drought Assessment Summary Upper Colorado River Basin Pilot Project 13 July 2010 Precipitation and Snowpack Over the past week, precipitation in the Upper Colorado River
INVISIBLE WATER COSTS
 Every Drop Every Counts... Drop Counts... INVISIBLE WATER COSTS Corn - 108.1 gallons per pound How much water it takes to produce... Apple - 18.5 gallons to grow Beef - 1,581 gallons per pound Oats - 122.7
Overview of a Changing Climate in Rhode Island
 Overview of a Changing Climate in Rhode Island David Vallee, Hydrologist in Charge, National Weather Service Northeast River Forecast Center, NOAA Lenny Giuliano, Air Quality Specialist, Rhode Island Department
NIDIS Intermountain West Drought Early Warning System April 18, 2017
 1 of 11 4/18/2017 3:42 PM Precipitation NIDIS Intermountain West Drought Early Warning System April 18, 2017 The images above use daily precipitation statistics from NWS COOP, CoCoRaHS, and CoAgMet stations.
RELATIONSHIP BETWEEN CLIMATIC CONDITIONS AND SOIL PROPERTIES AT SCAN AND SNOTEL SITES IN UTAH. Karen Vaughan 1 and Randy Julander 2 ABSTRACT
 RELATIONSHIP BETWEEN CLIMATIC CONDITIONS AND SOIL PROPERTIES AT SCAN AND SNOTEL SITES IN UTAH Karen Vaughan 1 and Randy Julander 2 ABSTRACT To improve our understanding of the influence of climatic conditions
El Niño, Climate Change and Water Supply Variability
 El Niño, Climate Change and Water Supply Variability Talk Overview El Niño and California California Climate Variability and Change Water Management in the Face of Change California s topography affects
-Assessment of current water conditions. - Precipitation Forecast. - Recommendations for Drought Monitor
 April 20 th, 2010 -Assessment of current water conditions - Precipitation Forecast - Recommendations for Drought Monitor 7 Day Precipitation 12-18 April 2010 Month-to-Date Precipitation 1-28 March 2010
ASSESSING THE SENSITIVITY OF WASATCH MOUNTAIN SNOWFALL TO TEMPERATURE VARIATIONS. Leigh P. Jones and John D. Horel 1 ABSTRACT INTRODUCTION
 ASSESSING THE SENSITIVITY OF WASATCH MOUNTAIN SNOWFALL TO TEMPERATURE VARIATIONS Leigh P. Jones and John D. Horel 1 ABSTRACT Three methods are employed in this study to estimate the sensitivity of snow
Memo. I. Executive Summary. II. ALERT Data Source. III. General System-Wide Reporting Summary. Date: January 26, 2009 To: From: Subject:
 Memo Date: January 26, 2009 To: From: Subject: Kevin Stewart Markus Ritsch 2010 Annual Legacy ALERT Data Analysis Summary Report I. Executive Summary The Urban Drainage and Flood Control District (District)
NIDIS Intermountain West Drought Early Warning System May 1, 2018
 NIDIS Intermountain West Drought Early Warning System May 1, 2018 Precipitation The images above use daily precipitation statistics from NWS COOP, CoCoRaHS, and CoAgMet stations. From top to bottom, and
2015 Fall Conditions Report
 2015 Fall Conditions Report Prepared by: Hydrologic Forecast Centre Date: December 21 st, 2015 Table of Contents Table of Figures... ii EXECUTIVE SUMMARY... 1 BACKGROUND... 2 SUMMER AND FALL PRECIPITATION...
How Will the Colorado Run? The Colorado River in a Warmer World
 How Will the Colorado Run? The Colorado River in a Warmer World The Future of the Colorado River October 13, 2018 Brad Udall Senior Scientist/Scholar Colorado State University Bradley.Udall@colostate.edu
PRECIPITATION. Last Week Precipitation:
 12/3/2014 NIDIS Drought and Water Assessment PRECIPITATION The images above use daily precipitation statistics from NWS COOP, CoCoRaHS, and CoAgMet stations. From top to bottom, and left to right: most
Upper Missouri River Basin May 2018 Calendar Year Runoff Forecast May 4, 2018
 Calendar Year Runoff Forecast Explanation and Purpose of Forecast Upper Missouri River Basin May 2018 Calendar Year Runoff Forecast May 4, 2018 U.S. Army Corps of Engineers, Northwestern Division Missouri
Presentation Overview. Southwestern Climate: Past, present and future. Global Energy Balance. What is climate?
 Southwestern Climate: Past, present and future Mike Crimmins Climate Science Extension Specialist Dept. of Soil, Water, & Env. Science & Arizona Cooperative Extension The University of Arizona Presentation
Lake Tahoe Watershed Model. Lessons Learned through the Model Development Process
 Lake Tahoe Watershed Model Lessons Learned through the Model Development Process Presentation Outline Discussion of Project Objectives Model Configuration/Special Considerations Data and Research Integration
Preliminary Runoff Outlook February 2018
 Preliminary Runoff Outlook February 2018 Prepared by: Flow Forecasting & Operations Planning Water Security Agency General Overview The Water Security Agency (WSA) is preparing for 2018 spring runoff including
Forecast Challenges for the Colorado Basin River Forecast Center
 Forecast Challenges for the Colorado Basin River Forecast Center John Lhotak, Development and Operations Hydrologist Improving Sub-Seasonal to Seasonal (S2S) Workshop May 16th, 2018 1 River Forecast Centers
NIDIS Intermountain West Drought Early Warning System November 21, 2017
 NIDIS Drought and Water Assessment NIDIS Intermountain West Drought Early Warning System November 21, 2017 Precipitation The images above use daily precipitation statistics from NWS COOP, CoCoRaHS, and
Water information system advances American River basin. Roger Bales, Martha Conklin, Steve Glaser, Bob Rice & collaborators UC: SNRI & CITRIS
 Water information system advances American River basin Roger Bales, Martha Conklin, Steve Glaser, Bob Rice & collaborators UC: SNRI & CITRIS Opportunities Unprecedented level of information from low-cost
2017 Fall Conditions Report
 2017 Fall Conditions Report Prepared by: Hydrologic Forecast Centre Date: November 15, 2017 Table of Contents TABLE OF FIGURES... ii EXECUTIVE SUMMARY... 1 BACKGROUND... 4 SUMMER AND FALL PRECIPITATION...
NIDIS Intermountain West Drought Early Warning System April 24, 2018
 NIDIS Intermountain West Drought Early Warning System April 24, 2018 Precipitation The images above use daily precipitation statistics from NWS COOP, CoCoRaHS, and CoAgMet stations. From top to bottom,
2016 Fall Conditions Report
 2016 Fall Conditions Report Prepared by: Hydrologic Forecast Centre Date: December 13, 2016 Table of Contents TABLE OF FIGURES... ii EXECUTIVE SUMMARY... 1 BACKGROUND... 5 SUMMER AND FALL PRECIPITATION...
David R. Vallee Hydrologist-in-Charge NOAA/NWS Northeast River Forecast Center
 David R. Vallee Hydrologist-in-Charge NOAA/NWS Northeast River Forecast Center Record flooding along the Shawsheen River during the 2006 Mother s Day Floods Calibrate and implement a variety of hydrologic
Presented by Jerry A. Gomez, P.E. National Hydropower Association Northeast Regional Meeting - September 17, 2009
 Presented by Jerry A. Gomez, P.E. National Hydropower Association Northeast Regional Meeting - September 17, 2009 Defining Probable Maximum Precipitation (PMP) PMP is the theoretically greatest depth of
STRUCTURAL ENGINEERS ASSOCIATION OF OREGON
 STRUCTURAL ENGINEERS ASSOCIATION OF OREGON P.O. Box 3285 PORTLAND, OR 97208 503.753.3075 www.seao.org E-mail: jane@seao.org 2010 OREGON SNOW LOAD MAP UPDATE AND INTERIM GUIDELINES FOR SNOW LOAD DETERMINATION
Souris River Basin Spring Runoff Outlook As of March 1, 2019
 Souris River Basin Spring Runoff Outlook As of March 1, 2019 Prepared by: Flow Forecasting & Operations Planning Water Security Agency Basin Conditions Summer rainfall in 2018 over the Saskatchewan portion
SEPTEMBER 2013 REVIEW
 Monthly Long Range Weather Commentary Issued: October 21, 2013 Steven A. Root, CCM, President/CEO sroot@weatherbank.com SEPTEMBER 2013 REVIEW Climate Highlights The Month in Review The average temperature
NOAA Water Resources Monitor and Outlook
 NOAA Water Resources Monitor and Outlook 1 Andrea J. Ray, NOAA/ESRL Physical Sciences Division, Michelle Stokes, NOAA Colorado Basin River Forecast Center, and the WRMO steering team: Robert Hartman -
Natural Variability in Annual Maximum Water Level and Outflow of Yellowstone Lake
 Natural Variability in Annual Maximum Water Level and Outflow of Yellowstone Lake Phillip E. Farnes Abstract The water level in Yellowstone Lake varies each year in response to differences in the winter
NIDIS Intermountain West Drought Early Warning System November 13, 2018
 NIDIS Intermountain West Drought Early Warning System November 13, 2018 Precipitation The images above use daily precipitation statistics from NWS COOP, CoCoRaHS, and CoAgMet stations. From top to bottom,
NIDIS Intermountain West Drought Early Warning System December 11, 2018
 NIDIS Drought and Water Assessment NIDIS Intermountain West Drought Early Warning System December 11, 2018 Precipitation The images above use daily precipitation statistics from NWS COOP, CoCoRaHS, and
Flood Forecasting Tools for Ungauged Streams in Alberta: Status and Lessons from the Flood of 2013
 Flood Forecasting Tools for Ungauged Streams in Alberta: Status and Lessons from the Flood of 2013 John Pomeroy, Xing Fang, Kevin Shook, Tom Brown Centre for Hydrology, University of Saskatchewan, Saskatoon
NIDIS Weekly Climate, Water and Drought Assessment Summary. Upper Colorado River Basin July 31, 2012
 NIDIS Weekly Climate, Water and Drought Assessment Summary Upper Colorado River Basin July 31, 2012 Fig. 1: July month-to-date precipitation in inches. Fig. 2: SNOTEL WYTD precipitation percentiles (50%
9. PROBABLE MAXIMUM PRECIPITATION AND PROBABLE MAXIMUM FLOOD
 9. PROBABLE MAXIMUM PRECIPITATION AND PROBABLE MAXIMUM FLOOD 9.1. Introduction Due to the size of Watana Dam and the economic importance of the Project to the Railbelt, the Probable Maximum Flood (PMF)
Gateway Trail Project
 Gateway Trail Project Debris Flow Hazard Assessment By: Juan de la Fuente April 30, 2010 Background- On April 22, 2010, the Shasta-Trinity National Forest (Mt. Shasta-McCloud Unit) requested a geologic
DK DM M EMORANDUM D ECEMBER 28, 2018 SUBJECT:
 TO: CC: FROM: SUBJECT: BOARD OF DIRECTORS M EMORANDUM D ECEMBER 28, 2018 ANDY MUELLER, GENERAL MANAGER DAVE DK KANZER, P.E. & DON MEYER, P.E. DK DM COLORADO RIVER BASIN WATER SUPPLY CONDITIONS UPDATE AND
Variability Across Space
 Variability and Vulnerability of Western US Snowpack Potential impacts of Climactic Change Mark Losleben, Kurt Chowanski Mountain Research Station, University of Colorado Introduction The Western United
Linking the Hydrologic and Atmospheric Communities Through Probabilistic Flash Flood Forecasting
 Linking the Hydrologic and Atmospheric Communities Through Probabilistic Flash Flood Forecasting Wallace Hogsett Science and Operations Officer NOAA/NWS/Weather Prediction Center with numerous contributions
A Synopsis of the December 1-4, 2007 Storm Events
 A Synopsis of the December 1-4, 27 Storm Events An aerial view of the flooded I-5 overpass looking south Flooding in Chehalis. (Associated Press ) Maryanne Reiter, Hydrologist Weyerhaeuser Co. The Wind
A Century of Meteorological Observations at Fort Valley Experimental Forest: A Cooperative Observer Program Success Story
 A Century of Meteorological Observations at Fort Valley Experimental Forest: A Cooperative Observer Program Success Story Daniel P. Huebner and Susan D. Olberding, U.S. Forest Service, Rocky Mountain Research
A Review of the 2007 Water Year in Colorado
 A Review of the 2007 Water Year in Colorado Nolan Doesken Colorado Climate Center, CSU Mike Gillespie Snow Survey Division, USDA, NRCS Presented at the 28 th Annual AGU Hydrology Days, March 26, 2008,
2011 National Seasonal Assessment Workshop for the Eastern, Southern, & Southwest Geographic Areas
 2011 National Seasonal Assessment Workshop for the Eastern, Southern, & Southwest Geographic Areas On January 11-13, 2011, wildland fire, weather, and climate met virtually for the ninth annual National
Drought and Future Water for Southern New Mexico
 Drought and Future Water for Southern New Mexico David S. Gutzler University of New Mexico gutzler@unm.edu * The big drought of 2018 * Longer term challenges for water supply * Forecasting streamflow Elephant
Basic Hydrologic Science Course Understanding the Hydrologic Cycle Section Six: Snowpack and Snowmelt Produced by The COMET Program
 Basic Hydrologic Science Course Understanding the Hydrologic Cycle Section Six: Snowpack and Snowmelt Produced by The COMET Program Snow and ice are critical parts of the hydrologic cycle, especially at
Souris River Basin Spring Runoff Outlook As of March 15, 2018
 Souris River Basin Spring Runoff Outlook As of March 15, 2018 Prepared by: Flow Forecasting & Operations Planning Water Security Agency Basin Conditions Summer rainfall in 2017 in the Saskatchewan portion
NWS FORM E-5 U.S. DEPARTMENT OF COMMERCE I HYDRO SERVICE AREA NOAA, NATIONAL WEATHER SERVICE I Indianapolis, IN MONTHLY REPORT
 NWS FORM E-5 U.S. DEPARTMENT OF COMMERCE I HYDRO SERVICE AREA NOAA, NATIONAL WEATHER SERVICE I Indianapolis, IN. 1-------------------- MONTHLY REPORT OF RIVER AND FLOOD CONDITIONSI REPORT FOR I November
Lake Tahoe. Response to Winter Rain Events. Dr. David Maidment University of Texas at Austin. Dr. David Tarboton Utah State University
 CE 394K GIS in Water Resources Fall 2017 University of Texas at Austin PREPARED FOR Dr. David Maidment University of Texas at Austin Dr. David Tarboton Utah State University PREPARED BY Joel Lagade Jr.,
4.3 Climate (6.3.3) Explore this Phenomena. The same sun shines on the entire Earth. Explain why these two areas have such different climates.
 Explore this Phenomena. The same sun shines on the entire Earth. Explain why these two areas have such different climates.") Explore this Phenomena The same sun shines on the entire Earth. 4.3 Climate (6.3.3) Explain why these two areas have such different climates. 89 6.3.3 Climate Develop and use a model to show how unequal
Explore this Phenomena The same sun shines on the entire Earth. 4.3 Climate (6.3.3) Explain why these two areas have such different climates. 89 6.3.3 Climate Develop and use a model to show how unequal
Areal Reduction Factors for the Colorado Front Range and Analysis of the September 2013 Colorado Storm
 Areal Reduction Factors for the Colorado Front Range and Analysis of the September 2013 Colorado Storm Doug Hultstrand, Bill Kappel, Geoff Muhlestein Applied Weather Associates, LLC - Monument, Colorado
May 2016 Volume 23 Number 5
 The Weather Wire May 2016 Volume 23 Number 5 Contents: Winter Summary Current Colorado and West-wide Snow Pack Drought Monitor April Summary/Statistics May Preview Snowfall Totals Winter Summary The Front
NIDIS Intermountain West Drought Early Warning System December 4, 2018
 12/4/2018 NIDIS Drought and Water Assessment NIDIS Intermountain West Drought Early Warning System December 4, 2018 Precipitation The images above use daily precipitation statistics from NWS COOP, CoCoRaHS,
Foundations of Earth Science, 6e Lutgens, Tarbuck, & Tasa
 Foundations of Earth Science, 6e Lutgens, Tarbuck, & Tasa Weather Patterns and Severe Weather Foundations, 6e - Chapter 14 Stan Hatfield Southwestern Illinois College Air masses Characteristics Large body
Filling Gaps in Water Supply Predictions: The RIO-SNO-FLOW Project
 Filling Gaps in Water Supply Predictions: The RIO-SNO-FLOW Project Project Team: Colorado Water Conservation Board NOAA National Severe Storms Laboratory (NSSL) National Center for Atmospheric Research
Investigation of the Arizona Severe Weather Event of August 8 th, 1997
 Investigation of the Arizona Severe Weather Event of August 8 th, 1997 Tim Hollfelder May 10 th, 2006 Abstract Synoptic scale forcings were very weak for these thunderstorms on August 7-8, 1997 over the
Water Year 2019 Wet or Dry?? Improving Sub-seasonal to Seasonal Precipitation Forecasting Jeanine Jones, Department of Water Resources
 Water Year 2019 Wet or Dry?? Improving Sub-seasonal to Seasonal Precipitation Forecasting Jeanine Jones, Department of Water Resources Sub-Seasonal to Seasonal (S2S) Precipitation Forecasting Operational
NIDIS Intermountain West Drought Early Warning System January 16, 2018
 NIDIS Drought and Water Assessment NIDIS Intermountain West Drought Early Warning System January 16, 2018 Precipitation The images above use daily precipitation statistics from NWS COOP, CoCoRaHS, and
An Overview of Operations at the West Gulf River Forecast Center Gregory Waller Service Coordination Hydrologist NWS - West Gulf River Forecast Center
 National Weather Service West Gulf River Forecast Center An Overview of Operations at the West Gulf River Forecast Center Gregory Waller Service Coordination Hydrologist NWS - West Gulf River Forecast
WWA Summer Tour. Tuesday, June 20, Lander, Wyoming. Contents. Final Water Forum for Snowcover & Stream flow Generation
 Issue Sixty Five, Volume Two 2017 WWA Officers WWA Summer Tour Tuesday, June 20, 2017 Lander, Wyoming Tour highlights include: Worthen Meadows. Sinks Canyon, Popo Agie River Restoration project, Popo Agie
Weather Outlook: 2015 Growing Season
 Weather Outlook: 2015 Growing Season Leon F. Osborne Chester Fritz Distinguished Professor Regional Weather Information Center University of North Dakota Grand Forks, North Dakota Why Should We Be Concerned?
What does the El Niño have in store for the Upper Colorado Basin?
 What does the 2015-16 El Niño have in store for the Upper Colorado Basin? Klaus Wolter NOAA-Earth System Research Lab & University of Colorado at Boulder-CIRES klaus.wolter@noaa.gov El Niño: Current situation