PO Box 680 Monument, Co / appliedweatherassociates.com. Probable Maximum Precipitation (PMP)
|
|
|
- Hugh Hubbard
- 6 years ago
- Views:
Transcription
1 PO Box 680 Monument, Co / appliedweatherassociates.com Probable Maximum Precipitation (PMP)
2 Probable Maximum Precipitation Introduction Concept of Probable Maximum Precipitation (PMP) Definition i. Theoretical values ii. Maximum depth of precipitation iii. Physically possible iv. Geographic region v. Certain time of year History of Hydrometeorological Reports (HMRs) Concept of Probable Maximum Precipitation (PMP) Concept of an upper limit to precipitation potential Corps of Engineers requested charts of Maximum Possible Precipitation, MPP (1946) HMR 23 (1947) provided subjectively derived estimates Derived from the most effective combination of factors controlling rainfall intensity MPP changed to Probable Maximum Precipitation (PMP) Better reflects the uncertainty of estimating maximum precipitation PMP values are generally considered estimates of the upper limit of precipitation production
3 Probable Maximum Precipitation Definition: The theoretically greatest depth of precipitation for a given duration that is physically possible over a given storm area at a particular geographic location at a certain time of year (HMR 59, 1999) Probable Maximum Precipitation Definition: The theoretically greatest depth of precipitation for a given duration that is physically possible over a given storm area at a particular geographic location at a certain time of year (HMR 59, 1999)
4 Probable Maximum Precipitation Theoretically - No technology exists to compute theoretical maximum precipitation values - Historic storms are used as the basis for computing maximum rainfall values - Procedures are used to adjust the observed rainfall from historic large rainfall events to determine the theoretical maximum rainfall - Meteorological computer models are providing useful tools for evaluating orographic effects = Spatial distribution are provided = Not useful for determing upper limit magnitudes Probable Maximum Precipitation Definition: The theoretically greatest depth of precipitation for a given duration that is physically possible over a given storm area at a particular geographic location at a certain time of year (HMR 59, 1999)
5 Probable Maximum Precipitation greatest depth of precipitation -Greatest depth for various area sizes and various durations = Area sizes: 1 to 20,000 square miles* = Durations: 1 to 72 hours* -Can be for all seasons (all season PMP) or for times of the year when there may be snow cover or frozen ground (cool season PMP) -Can vary by storm type = Local Storm = General Storm * PMP studies are not limited to 20,000 sq mi and/or 72-hour duration Probable Maximum Precipitation Definition: The theoretically greatest depth of precipitation for a given duration that is physically possible over a given storm area at a particular geographic location at a certain time of year (HMR 59, 1999)
6 Probable Maximum Precipitation physically possible - The PMP design storm must have characteristics that can combine naturally to produce an extreme rainfall storm - Many worst case storm characteristics cannot co-occur within an extreme rainfall storm - Some historic PMP analyses have inappropriately combined worst case storm characteristics Probable Maximum Precipitation Definition: The theoretically greatest depth of precipitation for a given duration that is physically possible over a given storm area at a particular geographic location at a certain time of year (HMR 59, 1999)
7 Probable Maximum Precipitation geographic location The PMP design storm type varies depending on the geographic location The PMP design storm type depends on basin characteristics In general small rapid response basins have the convective storm type as the PMP storm In general large basins with large lag times have the general storm type as the PMP storm Gradients of PMP values are not homogeneous for various geographic locations Probable Maximum Precipitation HMR 51


8 Probable Maximum Precipitation HMR 59 Probable Maximum Precipitation Break #1 Questions
9 Probable Maximum Precipitation
10 Probable Maximum Precipitation HMR 51
11
12 Method for Computing PMP Values No physically based theoretical method (yet) Observed extreme rainfall events are used Standard procedures are applied to the storm rainfall Primary steps Storm Search Identification of most significant storms Maximization procedures are applied Transpositioning procedures are applied Enveloping procedures are applied
13 Probable Maximum Precipitation Storm search Short list of significant storms Storm rainfall analyses (Depth-Area-Duration) Rainfall timing (mass curves) Storm in-place maximization Storm transposition Moisture transposition Elevation moisture adjustment Orographic transposition Depth-Area envelopment Depth-Duration envelopment Key Tasks for Site-Specific PMP Studies Identify extreme storms for the region Identify recent extreme storms Add 40 years of storms for HMR 51 region Review older rainfall data records HMRs may not have included all significant storms


14 Updated Storm Search Locations New Storms Analyzed for PMP Development


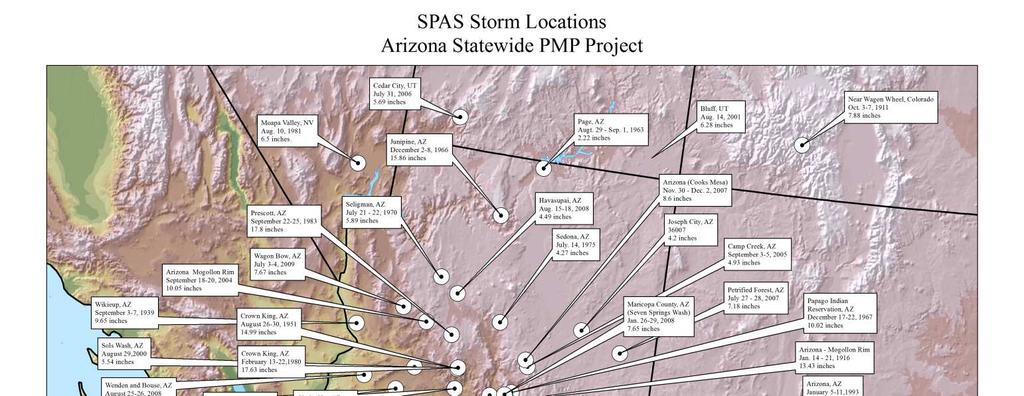
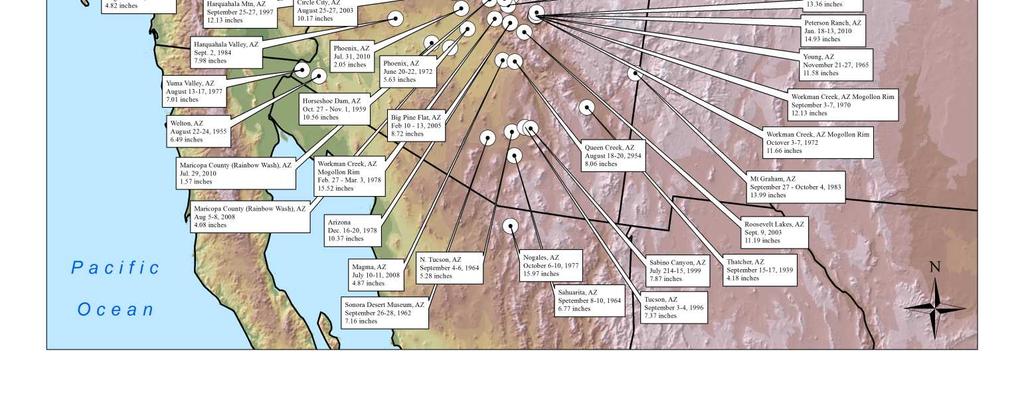
15 New Storms Analyzed for PMP Development New Storms Analyzed for PMP Development
16 Key Tasks for Site-Specific PMP Studies Identify extreme storm types Evaluate the use of HMR procedures for each storm type Identify unique topography Moisture depletion by upwind barriers Precipitation enhancement/decrease Effects on storm center location Review HMR procedures used for the basin location Identify inconsistent assumptions Probable Maximum Precipitation Break #2 Questions
17 Method for Computing PMP Values Maximization Storm rainfall production depends on Storm rainfall production efficiency Available atmospheric moisture Assumptions For a sufficiently long period of record, storms will be identified that have approached maximum rainfall production efficiencies The storm rainfall could have been greater is more atmospheric moisture had been available Procedure Determine the amount of atmospheric moisture that was available to the storm Determine the maximum amount of moisture that could have been available to the storm Increase the rainfall by a ratio of maximum moisture to actual moisture Called the storm maximization factor Use of a trajectory model

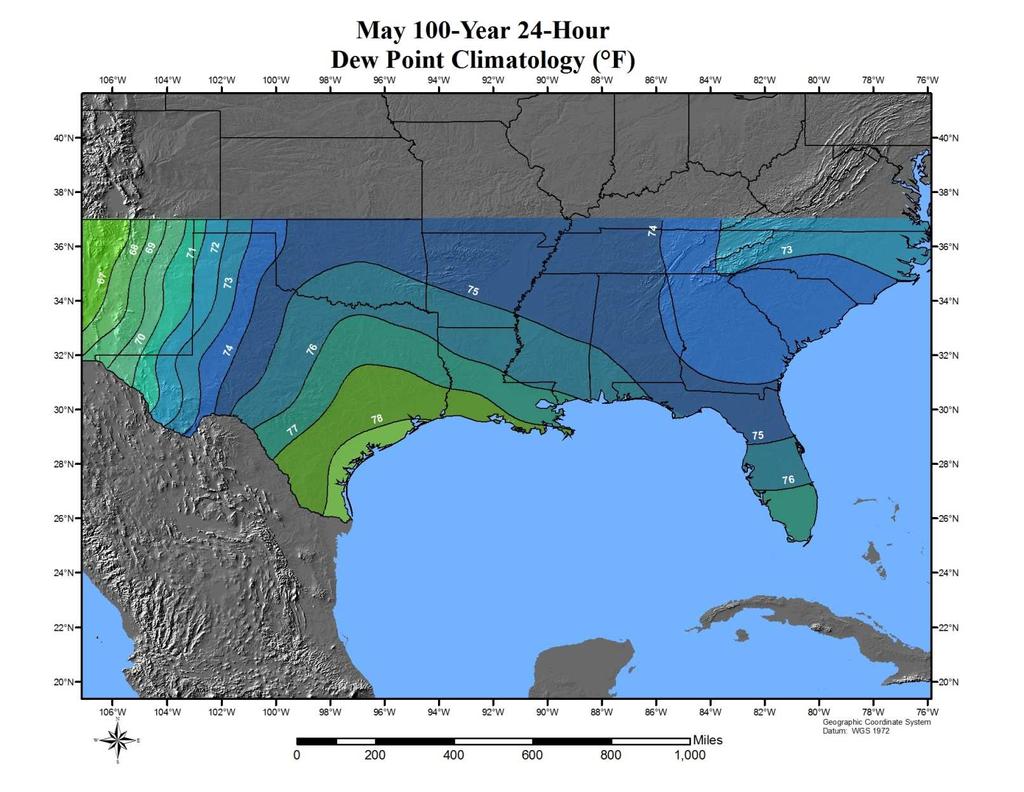
18 Updated Maximum Dew Point Climatology Updated Maximum Dew Point Climatology Map

19 Updated 2 Sigma SST Map Method for Computing PMP Values Transpositioning The largest storms over a region are identified The transposition region contains storm that are similar Meteorologically Climatologically Topographically The rainfall from each storm is adjusted to other parts of the region The adjustment is the transpositioning factor

20 Method for Computing PMP Values Enveloping For any location in a region The maximized and transpositioned Depth-Area (D-A) rainfall is plotted for each storm for each duration For each duration, an envelop curve is constructed that envelopes the rainfall values at each area size The D-A envelop curve procedure insures continuity in space i.e. The rainfall at each area size has continuity with smaller and larger area sizes The same procedure is followed for the Depth-Duration (D-D) rainfall plots The D-D envelop curve procedure insures continuity in time i.e. The rainfall at each duration has continuity with shorter and longer durations Area Enveloping

21 Duration Enveloping Probable Maximum Precipitation Break #3 Questions
22 Probable Maximum Precipitation Generalized PMP values (HMRs) Site-Specific PMP values Regional Statewide Individual basins Examples of Site-Specific PMP Study Findings Storm Maximization Storm representative dew point (SST) Historic analyses have selected dew points (SST) Hundreds of miles away Occurred during or after the rainfall event Time period of observations were not consistent with the rainfall duration Maximum dew point (SST) climatology used was unreliable Maximization ratios of 2.0 or greater were used
23 Examples of Site-Specific PMP Study Findings Storm Maximization, Dew point Analyses 12-hour vs 6-hour persisting dew points 12-hour persisting vs 6-hour average Observed dew point values Hour Td ! Rainfall Event! 12-hour persisting: 65 6-hour persisting: 72 6-hour average: 74 Examples of Site-Specific PMP Study Findings Maximum Dew point Climatology Published NOAA Climatology Combination of several analyses Not well documented Represented maximum observed values New climatology can be produced Long period of record of quality controlled data Return frequencies can be computed Climatologies of persisting and average values can be provided


24 Updated Dew Point Climatologies Examples of Site-Specific PMP Study Findings Homogeneous Climate Regions Select storms for each region Transposition Maximize Envelop


25 Probable Maximum Precipitation HMR 51 Recalculation of the Distance from the Coast curve in HMR 51

26 Statewide PMP Study Results vshmr 51 Statewide PMP Study Results vs HMR 51

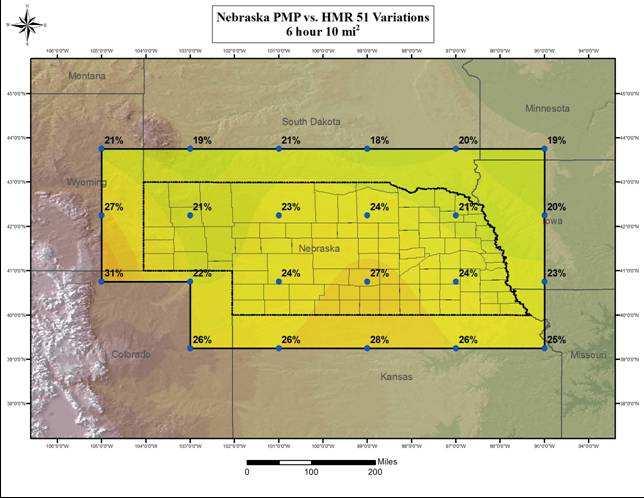
27 Statewide PMP Study Results vs HMR 51 Statewide PMP Study Results vs HMR 51
28 Probable Maximum Precipitation Types of PMP studies: Generalized (Hydrometeorological Reports) Regional (EPRI Michigan/Wisconsin 1993) Statewide (Nebraska 2008, Arizona, Ohio, Wyoming) Site-Specific Results from Selected Site-Specific PMP Studies Wisconsin/Michigan Accepted by FERC Great Miami River, Ohio Accepted by Ohio State Engineer Catawba-Wateree Rivers, Carolinas Not accepted by FERC Williams Fork River, Colorado Accepted by FERC & Colorado State Engineer
29 Results from Selected Site-Specific PMP Studies Muddy Creek, Colorado Accepted by Colorado State Engineer Elkhead Creek, Colorado Accepted by Colorado State Engineer Broomfield Reservoir, Colorado Accepted by Colorado State Engineer Chelan Reservoir, Washington Study suspended Results from Selected Site-Specific PMP Studies Nebraska Statewide Accepted by Nebraska Dam Safety office FERC acceptance pending Brassua Dam drainage basin, Maine Accepted by the FERC Bleinheim-Gilboa Reservoir, New York Accepted by the FERC Lewis River drainage basin, Washington Accepted by the FERC


30 Recently Completed PMP Studies Do Regional/Statewide/Site-Specific PMP Studies Provide Improved PMP Values? Attributes: More storms considered New technologies used Recognized problems in the HMRs corrected Topographic features addressed
31 Do Regional/Statewide/Site-Specific PMP Studies Provide Improved PMP Values? Primary Question: Do the PMP values resulting from a sitespecific/statewide PMP study better represent the upper physical limit of extreme rainfall as required by the definition of PMP? Should a Particular Regional/Statewide/Site- Specific PMP Study be Accepted by a Regulator? Problem: Most regulators do not have access to a staff hydrometeorologist Potential Solution: Review by a government hydrometeorology office Review by a peer reviewer Review by an independent Board of Consultants (BOC) FERC BOC Meteorologist Hydrologist Civil Engineer
32 ASDSO Webinar Probable Maximum Precipitation Questions Comments 719/ PO Box 680 Monument, Co Post Event Evaluation & Quiz Please click the following link to take the Seminar Evaluation and Quiz: p?id=8097 You must complete the Seminar Evaluation and Quiz to receive PDH credit hours
MIDWEST PROBABLE MAXIMUM PRECIPITATION STUDIES
 MIDWEST PROBABLE MAXIMUM PRECIPITATION STUDIES Bill Kappel Senior Meteorologist/Vice President Ed Tomlinson, PhD Chief Meteorologist/President Applied Weather Associates www.appliedweatherassociates.com
Updating Probable Maximum Precipitation for the Tennessee Valley Authority
 Updating Probable Maximum Precipitation for the Tennessee Valley Authority Bill Kappel, President/Senior Meteorologist Applied Weather Associates, Monument, CO www.appliedweatherassociates.com Mike Eiffe,
Probable Maximum Precipitation Study
 Probable Maximum Precipitation Study Virginia Floodplain Management Association Workshop Thursday, October 29, 2015 Robert T. Bennett, PE, RA, CFM DCR Dam Safety & Floodplain Management Definition (4VAC50-20-50.H)
Presented by Jerry A. Gomez, P.E. National Hydropower Association Northeast Regional Meeting - September 17, 2009
 Presented by Jerry A. Gomez, P.E. National Hydropower Association Northeast Regional Meeting - September 17, 2009 Defining Probable Maximum Precipitation (PMP) PMP is the theoretically greatest depth of
Dam Safety: Revisiting PMPs
 Dam Safety: Revisiting PMPs Many dam safety officials use probable maximum precipitation (PMP) for dam safety evaluations and design requirements. But the series of federal publications that provides PMP
Arizona Statewide Probable Maximum Precipitation (PMP), Improving HMR 49
, Improving HMR 49") Arizona Statewide Probable Maximum Precipitation (PMP), Improving HMR 49 Edward M. Tomlinson, Ph.D., Applied Weather Associates, LLC* William D. Kappel, Applied Weather Associates, LLC* Michael Johnson,
Arizona Statewide Probable Maximum Precipitation (PMP), Improving HMR 49 Edward M. Tomlinson, Ph.D., Applied Weather Associates, LLC* William D. Kappel, Applied Weather Associates, LLC* Michael Johnson,
Using PRISM Climate Grids and GIS for Extreme Precipitation Mapping
 Using PRISM Climate Grids and GIS for Extreme Precipitation Mapping George H. Taylor, State Climatologist Oregon Climate Service 316 Strand Ag Hall Oregon State University Corvallis OR 97331-2209 Tel:
Updating PMP to Provide Better Dam and Spillway Design
 Protections 2016 2 nd International Seminar on Dam Protection Against Overtopping ISBN: 978-1-1889143-27-9 DOI: Ft. Collins, Colorado, USA, 7-9 September 2016 Updating PMP to Provide Better Dam and Spillway
Bill Kappel. Doug Hultstrand. Applied Weather Associates
 Cool-Season PMP/PMF Meteorological Time Series for Snow Melt Calculations Bill Kappel Senior Meteorologist/Vice President Doug Hultstrand Hydrometeorologist Applied Weather Associates www.appliedweatherassociates.com
Site-Specific and Regional PMP Studies
 Site-Specific and Regional Probable Maximum Precipitation (PMP) Studies Ed Tomlinson, PhD 2009 Western Regional Dam Safety Forum San Francisco, California January 15, 2009 PO Box 680 Monument, Co 80132
The general procedure for estimating 24-hour PMP includes the following steps:
 14th Conference on Applied Climatology Abstract # 71520 Using PRISM Climate Grids and GIS for Extreme Precipitation Mapping George H. Taylor and Christopher Daly Oregon State University Corvallis Oregon
The NEXRAD Revolution: Scientific Basis for Updating the HMR-49 Statistical Storm Intensities and PMPs
 The NEXRAD Revolution: Scientific Basis for Updating the HMR-49 Statistical Storm Intensities and PMPs Bill Kappel, Senior Meteorologist/President Applied Weather Associates, Monument, CO www.appliedweatherassociates.com
Study 16.5 Probable Maximum Flood (PMF)
") Initial Study Report Meeting Study 16.5 Probable Maximum Flood (PMF) October 22, 2014 Prepared by 10/22/2014 1 Study 16.5 Objectives Develop a site-specific PMP to be used for the derivation of the PMF
Initial Study Report Meeting Study 16.5 Probable Maximum Flood (PMF) October 22, 2014 Prepared by 10/22/2014 1 Study 16.5 Objectives Develop a site-specific PMP to be used for the derivation of the PMF
TEMPORAL DISTIRUBTION OF PMP RAINFALL AS A FUNCTION OF AREA SIZE. Introduction
 TEMPORAL DISTIRUBTION OF PMP RAINFALL AS A FUNCTION OF AREA SIZE Bill D. Kappel, Applied Weather Associates, LLC Edward M. Tomlinson, Ph.D., Applied Weather Associates, LLC Tye W. Parzybok, Metstat, Inc.
Needs to Update Probable Maximum Precipitation for Determining Hydrologic Loading on Dams
 Needs to Update Probable Maximum Precipitation for Determining Hydrologic Loading on Dams USSD 2017 Annual Conference Anaheim, CA Chandra S. Pathak, PhD, PE, F.ASCE Engineering and Construction Branch
9. PROBABLE MAXIMUM PRECIPITATION AND PROBABLE MAXIMUM FLOOD
 9. PROBABLE MAXIMUM PRECIPITATION AND PROBABLE MAXIMUM FLOOD 9.1. Introduction Due to the size of Watana Dam and the economic importance of the Project to the Railbelt, the Probable Maximum Flood (PMF)
ALASKA ENERGY AUTHORITY AEA REP Appendix A. Probable Maximum Precipitation Study REP. Applied Weather Associates
 13-1402-REP-123114 Appendix A Probable Maximum Precipitation Study 14-07-REP by Applied Weather Associates Report 14-07-REP v1.0 Susitna-Watana Hydroelectric Project Probable Maximum Precipitation Study
This page left intentionally blank
 This page left intentionally blank Colorado New Mexico Regional Extreme Precipitation Study Summary Report Volume II Deterministic Regional Probable Maximum Precipitation Estimation Prepared by: Applied
Study 16.5 Probable Maximum Flood (PMF)
") Initial Study Report Meeting Study 16.5 Probable Maximum Flood (PMF) March 30, 2016 Prepared by 3/30/2016 1 Study 16.5 Status ISR documents (ISR Part D Overview): Status: Initial Study Report: Parts A,
Initial Study Report Meeting Study 16.5 Probable Maximum Flood (PMF) March 30, 2016 Prepared by 3/30/2016 1 Study 16.5 Status ISR documents (ISR Part D Overview): Status: Initial Study Report: Parts A,
Comparison of physical and statistical methods for estimating probable maximum precipitation in southwestern basins of Iran
 Fattahi et al. / DESERT 15 (2010) 127-132 DESERT DESERT Online at http://jdesert.ut.ac.ir DESERT 15 (2010) 127-132 Comparison of physical and statistical methods for estimating probable maximum precipitation
3B.3: Climate Controls on the Extreme Rainstorms in the Contiguous US:
 97 th AMS Annual Meeting 3B.3: Climate Controls on the Extreme Rainstorms in the Contiguous US: 1979-2015 Xiaodong Chen and Faisal Hossain Department of Civil and Environmental Engineering University of
NRC Workshop Probabilistic Flood Hazard Assessment (PFHA) Jan 29-31, Mel Schaefer Ph.D. P.E. MGS Engineering Consultants, Inc.
 Jan 29-31, Mel Schaefer Ph.D. P.E. MGS Engineering Consultants, Inc.") Stochastic Event Flood Model (SEFM) Stochastic Modeling of Extreme Floods A Hydrological Tool for Analysis of Extreme Floods Mel Schaefer Ph.D. P.E. MGS Engineering Consultants, Inc. Olympia, WA NRC Workshop
Stochastic Event Flood Model (SEFM) Stochastic Modeling of Extreme Floods A Hydrological Tool for Analysis of Extreme Floods Mel Schaefer Ph.D. P.E. MGS Engineering Consultants, Inc. Olympia, WA NRC Workshop
Changes to Extreme Precipitation Events: What the Historical Record Shows and What It Means for Engineers
 Changes to Extreme Precipitation Events: What the Historical Record Shows and What It Means for Engineers Geoffrey M Bonnin National Oceanic and Atmospheric Administration National Weather Service Office
Speakers: NWS Buffalo Dan Kelly and Sarah Jamison, NERFC Jeane Wallace. NWS Flood Services for the Black River Basin
 Speakers: NWS Buffalo Dan Kelly and Sarah Jamison, NERFC Jeane Wallace NWS Flood Services for the Black River Basin National Weather Service Who We Are The National Oceanic and Atmospheric Administration
Estimating Probable Maximum Precipitation for Linau River Basin in Sarawak
 Estimating Probable Maximum Precipitation for Linau River Basin in Sarawak M. Hussain, S. Nadya and F.J. Chia Hydropower Development Division, Sarawak Energy Berhad, 93050, Kuching, Sarawak, Malaysia Date
Estimation of the probable maximum precipitation in Barcelona (Spain)
") INTERNATIONAL JOURNAL OF CLIMATOLOGY Int. J. Climatol. 31: 1322 1327 (2011) Published online 14 April 2010 in Wiley Online Library (wileyonlinelibrary.com) DOI: 10.1002/joc.2149 Estimation of the probable
INTERNATIONAL JOURNAL OF CLIMATOLOGY Int. J. Climatol. 31: 1322 1327 (2011) Published online 14 April 2010 in Wiley Online Library (wileyonlinelibrary.com) DOI: 10.1002/joc.2149 Estimation of the probable
The Hydrologic Cycle: How Do River Forecast Centers Measure the Parts?
 The Hydrologic Cycle: How Do River Forecast Centers Measure the Parts? Greg Story Meteorologist National Weather Service Fort Worth, TX Overview n Introduction What is the mission of an RFC? n The Hydrologic
Folsom Dam Water Control Manual Update
 Folsom Dam Water Control Manual Update Public Workshop April 3, 2014 Location: Sterling Hotel Ballroom 1300 H Street, Sacramento US Army Corps of Engineers BUILDING STRONG WELCOME & INTRODUCTIONS 2 BUILDING
Upper Missouri River Basin December 2017 Calendar Year Runoff Forecast December 5, 2017
 Upper Missouri River Basin December 2017 Calendar Year Runoff Forecast December 5, 2017 Calendar Year Runoff Forecast Explanation and Purpose of Forecast U.S. Army Corps of Engineers, Northwestern Division
Talk Overview. Concepts. Climatology. Monitoring. Applications
 Atmospheric Rivers Talk Overview Concepts Climatology Monitoring Applications Satellite View Where is the storm? Where is the impact? Atmospheric Rivers Plume or fire hose of tropical moisture Heavy precipitation
Operational Hydrologic Ensemble Forecasting. Rob Hartman Hydrologist in Charge NWS / California-Nevada River Forecast Center
 Operational Hydrologic Ensemble Forecasting Rob Hartman Hydrologist in Charge NWS / California-Nevada River Forecast Center Mission of NWS Hydrologic Services Program Provide river and flood forecasts
APPENDIX B HYDROLOGY
 APPENDIX B HYDROLOGY TABLE OF CONTENTS 1.0 INTRODUCTION... 1 2.0 PROBABLE MAXIMUM PRECIPITATION (PMP)... 1 3.0 DESIGN FLOW CALCULATION... 1 4.0 DIVERSION CHANNEL SIZING... 2 5.0 REFERENCES... 4 LIST OF
sea levels 100 year/ payments. FIGURE 1
 MIAMI DADE COUNTY CLIMATE INDICATORS RAINFALL SUMMARY Much of Miami Dade County is susceptible to localized flooding, particularly during the rainy season of June through October. The County s flat terrain
Ed Tomlinson, PhD Bill Kappel Applied Weather Associates LLC. Tye Parzybok Metstat Inc. Bryan Rappolt Genesis Weather Solutions LLC
 Use of NEXRAD Weather Radar Data with the Storm Precipitation Analysis System (SPAS) to Provide High Spatial Resolution Hourly Rainfall Analyses for Runoff Model Calibration and Validation Ed Tomlinson,
An Overview of Operations at the West Gulf River Forecast Center Gregory Waller Service Coordination Hydrologist NWS - West Gulf River Forecast Center
 National Weather Service West Gulf River Forecast Center An Overview of Operations at the West Gulf River Forecast Center Gregory Waller Service Coordination Hydrologist NWS - West Gulf River Forecast
Areal Reduction Factors for the Colorado Front Range and Analysis of the September 2013 Colorado Storm
 Areal Reduction Factors for the Colorado Front Range and Analysis of the September 2013 Colorado Storm Doug Hultstrand, Bill Kappel, Geoff Muhlestein Applied Weather Associates, LLC - Monument, Colorado
The Stochastic Event Flood Model Applied to Minidoka Dam on the Snake River, Idaho
 The Stochastic Event Flood Model Applied to Minidoka Dam on the Snake River, Idaho K. L. Bullard 1, M. G. Schaeffer 2, B. A. Barker 3, D. Sutley 4, and V. Leverson 5 1 Bureau of Reclamation, Flood Hydrology
Colorado September Rainfall Analysis: Comparisons to the Calgary 2013 Rainfall and PMP Along the Rocky Mountain Front Range
 Colorado September Rainfall Analysis: Comparisons to the Calgary 2013 Rainfall and PMP Along the Rocky Mountain Front Range Bill Kappel, President/Senior Meteorologist, Applied Weather Associates, LLC
Module 11: Meteorology Topic 5 Content: Weather Maps Notes
 Introduction A variety of weather maps are produced by the National Weather Service and National Oceanographic Atmospheric Administration. These maps are used to help meteorologists accurately predict
National Wildland Significant Fire Potential Outlook
 National Wildland Significant Fire Potential Outlook National Interagency Fire Center Predictive Services Issued: September, 2007 Wildland Fire Outlook September through December 2007 Significant fire
Hydrologic Research Laboratory Department of Civil and Environmental Engineering University of California, Davis
 Physically-Based Estimation of Maximum Precipitation: Preliminary Results on Application to American River Basin for the December,1996-January,1997 Flood Event Hydrologic Research Laboratory Department
A 21st century HRRR-based approach to estimating probable maximum precipitation to enhance dam safety and community resilience
 30 May 2017 FIRO Science Task Group Workshop A 21st century HRRR-based approach to estimating probable maximum precipitation to enhance dam safety and community resilience Courtesy Bill McCormick, Chief,
Missouri River Basin Water Management Monthly Update
 Missouri River Basin Water Management Monthly Update Participating Agencies 255 255 255 237 237 237 0 0 0 217 217 217 163 163 163 200 200 200 131 132 122 239 65 53 80 119 27 National Oceanic and Atmospheric
Tutorial 10 - PMP Estimation
 Tutorial 10 - PMP Estimation In Australia, the Probable Maximum Precipitation (PMP) storms are estimated using three generalised methods: Generalised Short Duration Method (GSDM) for short durations. Generalised
Probable Maximum Precipitation Estimates, United States East of the 105th Meridian
 YDROMETEOROLOGICAL REPORT O. 51 Probable Maximum Precipitation Estimates, United States East of the 15th Meridian U.S. DEPARTMET OF COMMERCE ATIOAL OCEAIC AD ATMOSPERIC ADMIISTRATIO U.S. DEPARTMET OF TE
Upper Missouri River Basin February 2018 Calendar Year Runoff Forecast February 6, 2018
 Upper Missouri River Basin February 2018 Calendar Year Runoff Forecast February 6, 2018 Calendar Year Runoff Forecast Explanation and Purpose of Forecast U.S. Army Corps of Engineers, Northwestern Division
Operational Perspectives on Hydrologic Model Data Assimilation
 Operational Perspectives on Hydrologic Model Data Assimilation Rob Hartman Hydrologist in Charge NOAA / National Weather Service California-Nevada River Forecast Center Sacramento, CA USA Outline Operational
Another 100-Year Storm. October 26, 2016 Mark Dennis, PE, CFM
 Another 100-Year Storm October 26, 2016 Mark Dennis, PE, CFM Agenda Are severe rainfall events becoming more frequent? Is there confusion about the 100-year storm that makes it seem like they happen all
Areal Reduction Factors for the Colorado Front Range and Analysis of the September 2013 Colorado Storm
 Areal Reduction Factors for the Colorado Front Range and Analysis of the September 2013 Colorado Storm Doug Hultstrand, Bill Kappel, Geoff Muhlestein Applied Weather Associates, LLC - Monument, Colorado
2003 Moisture Outlook
 2003 Moisture Outlook Nolan Doesken and Roger Pielke, Sr. Colorado Climate Center Prepared by Tara Green and Odie Bliss http://climate.atmos.colostate.edu Through 1999 Through 1999 Fort Collins Total Water
Bill Kappel
 Bill Kappel 719-488-4311 billkappel@appliedweatherassociates.com Education and Training Broadcast Meteorology Degree, Mississippi State University, August 2001 B.S., Physical Science-Geology, Mesa State
Design Storms for Hydrologic Analysis
 Design Storms for Hydrologic Analysis Course Description This course is designed to fulfill two hours of continuing education credit for Professional Engineers. Its objective is to provide students with
FEMA Hazards Loss Modeling Task Force (MOTF) Situation Report #14. Colorado Spring Flood Risk ***FINAL REPORT***
 Situation Report #14. Colorado Spring Flood Risk ***FINAL REPORT***") FEMA Hazards Loss Modeling Task Force (MOTF) Situation Report #14 Colorado Spring Flood Risk FEMA Modeling Task Force (MOTF) Denver Federal Center, Building 710A Denver, Colorado 80225 Email: FEMA-MOTF@fema.dhs.gov
FEMA Hazards Loss Modeling Task Force (MOTF) Situation Report #14 Colorado Spring Flood Risk FEMA Modeling Task Force (MOTF) Denver Federal Center, Building 710A Denver, Colorado 80225 Email: FEMA-MOTF@fema.dhs.gov
Detailed Storm Rainfall Analysis for Hurricane Ivan Flooding in Georgia Using the Storm Precipitation Analysis System (SPAS) and NEXRAD Weather Radar
 and NEXRAD Weather Radar") Detailed Storm Rainfall Analysis for Hurricane Ivan Flooding in Georgia Using the Storm Precipitation Analysis System (SPAS) and NEXRAD Weather Radar Ed Tomlinson, PhD and Bill Kappel Applied Weather Associates
Detailed Storm Rainfall Analysis for Hurricane Ivan Flooding in Georgia Using the Storm Precipitation Analysis System (SPAS) and NEXRAD Weather Radar Ed Tomlinson, PhD and Bill Kappel Applied Weather Associates
David R. Vallee Hydrologist-in-Charge NOAA/NWS Northeast River Forecast Center
 David R. Vallee Hydrologist-in-Charge NOAA/NWS Northeast River Forecast Center Record flooding along the Shawsheen River during the 2006 Mother s Day Floods Calibrate and implement a variety of hydrologic
Results of Intensity-Duration- Frequency Analysis for Precipitation and Runoff under Changing Climate
 Results of Intensity-Duration- Frequency Analysis for Precipitation and Runoff under Changing Climate Supporting Casco Bay Region Climate Change Adaptation RRAP Eugene Yan, Alissa Jared, Julia Pierce,
NRC Workshop - Probabilistic Flood Hazard Assessment Jan 2013
 Regional Precipitation-Frequency Analysis And Extreme Storms Including PMP Current State of Understanding/Practice Mel Schaefer Ph.D. P.E. MGS Engineering Consultants, Inc. Olympia, WA NRC Workshop - Probabilistic
GENERALISED LONG DURATION PROBABLE MAXIMUM PRECIPITATION (PMP) ISOHYETAL MAP FOR PENINSULAR MALAYSIA
 ISOHYETAL MAP FOR PENINSULAR MALAYSIA") Journal of Spatial Hydrology Vol.4, No.1 Spring 2004 GENERALISED LONG DURATION PROBABLE MAXIMUM PRECIPITATION (PMP) ISOHYETAL MAP FOR PENINSULAR MALAYSIA Abdullah Al-Mamun and Alias Hashim Jurutera Perunding
Journal of Spatial Hydrology Vol.4, No.1 Spring 2004 GENERALISED LONG DURATION PROBABLE MAXIMUM PRECIPITATION (PMP) ISOHYETAL MAP FOR PENINSULAR MALAYSIA Abdullah Al-Mamun and Alias Hashim Jurutera Perunding
WWA Summer Tour. Tuesday, June 20, Lander, Wyoming. Contents. Final Water Forum for Snowcover & Stream flow Generation
 Issue Sixty Five, Volume Two 2017 WWA Officers WWA Summer Tour Tuesday, June 20, 2017 Lander, Wyoming Tour highlights include: Worthen Meadows. Sinks Canyon, Popo Agie River Restoration project, Popo Agie
Recent Updates to NOAA/NWS Precipitation Frequency Estimates
 Recent Updates to NOAA/NWS Precipitation Frequency Estimates Geoffrey M. Bonnin Director, Hydrometeorological Design Studies Center Chief, Hydrologic Data Systems Branch Office of Hydrologic Development
THE NEED FOR AN ADDITIONAL SPILLWAY AT THE SANFORD DAM BOILING SPRING LAKES, NC. Presentation for The Brunswick County Commissioners April 20, 2015
 THE NEED FOR AN ADDITIONAL SPILLWAY AT THE SANFORD DAM BOILING SPRING LAKES, NC Presentation for The Brunswick County Commissioners April 20, 2015 The Sanford Dam Earth Dam constructed in 1961 Drainage
Wyoming Pre-Workshop Survey Results August 27, 2015 Lander Wyoming
 Wyoming Pre-Workshop Survey Results August 27, 2015 Lander Wyoming WHAT AREA(S) DO YOU WORK IN?! PLANNING, MGT, OPS! DROUGHT! RESEARCH! PUBLIC LANDS MGT! AG OR RANCHING! RECREATION! ENERGY! 0! 3.5! 7!
National Wildland Significant Fire Potential Outlook
 National Wildland Significant Fire Potential Outlook National Interagency Fire Center Predictive Services Issued: April 1, 2008 Next Issue: May 1, 2008 Wildland Fire Outlook April 2008 through July 2008
Solution: The ratio of normal rainfall at station A to normal rainfall at station i or NR A /NR i has been calculated and is given in table below.
 3.6 ESTIMATION OF MISSING DATA Data for the period of missing rainfall data could be filled using estimation technique. The length of period up to which the data could be filled is dependent on individual
Doug Kluck NOAA Kansas City, MO National Center for Environmental Information (NCEI) National Integrated Drought Information System (NIDIS)
 National Integrated Drought Information System (NIDIS)") National Integrated Drought Information System (NIDIS) for the Missouri River Basin Drought Early Warning Information System (DEWS) & Runoff Trends in the Missouri Basin & Latest Flood Outlook Doug Kluck
National Integrated Drought Information System (NIDIS) for the Missouri River Basin Drought Early Warning Information System (DEWS) & Runoff Trends in the Missouri Basin & Latest Flood Outlook Doug Kluck
JEFF JOHNSON S Winter Weather Outlook
 JEFF JOHNSON S 2017-2018 Winter Weather Outlook TABLE OF CONTENTS ABOUT THE AUTHOR Components of the seasonal outlook... 2 ENSO state/ocean temperatures... 3 Sub-seasonal outlooks... 4 Forecast models...
Maximization of Historical Severe Precipitation Events over American, Yuba and Feather River Basins
 Maximization of Historical Severe Precipitation Events over merican, Yuba and Feather River Basins M. L. Kavvas 1, K. Ishida 1, S. Jang 1, N. Ohara 2, Z.Q.Chen 3, and M. nderson 3 1 University Of California,
Radar Analysis for Design Storm Application
 37th Conference on Radar Meteorology Norman Oklahoma 14 18 September 2015 Norman, OK Radar Analysis for Design Storm Application Baxter E. Vieux, Vieux & Associates, Inc. Annjanette Dodd, Kimley-Horn,
Storm Precipitation Analysis System (SPAS) Description. Introduction
 Description. Introduction") Storm Precipitation Analysis System (SPAS) Description Introduction The Weather Bureau (currently the National Weather Service, or NWS) and the Corps of Engineers routinely performed detailed storm precipitation
Storm Precipitation Analysis System (SPAS) Description Introduction The Weather Bureau (currently the National Weather Service, or NWS) and the Corps of Engineers routinely performed detailed storm precipitation
Webinar and Weekly Summary February 15th, 2011
 Webinar and Weekly Summary February 15th, 2011 -Assessment of current water conditions - Precipitation Forecast - Recommendations for Drought Monitor Upper Colorado Normal Precipitation Upper Colorado
Arizona Climate Summary
 Arizona Climate Summary April 2014 Summary of conditions for March 2014 March 2014 Temperature and Precipitation Summary March 1 st 16 th : We started off the month of March with a significant precipitation
DEVELOPMENT OF A LARGE-SCALE HYDROLOGIC PREDICTION SYSTEM
 JP3.18 DEVELOPMENT OF A LARGE-SCALE HYDROLOGIC PREDICTION SYSTEM Ji Chen and John Roads University of California, San Diego, California ABSTRACT The Scripps ECPC (Experimental Climate Prediction Center)
Model Output Statistics (MOS)
") Model Output Statistics (MOS) Numerical Weather Prediction (NWP) models calculate the future state of the atmosphere at certain points of time (forecasts). The calculation of these forecasts is based on
Model Output Statistics (MOS) Numerical Weather Prediction (NWP) models calculate the future state of the atmosphere at certain points of time (forecasts). The calculation of these forecasts is based on
Flooding in Western North Carolina: Some Spatial, Hydrologic, and Seasonal Characteristics CAUTION!! Outline. Basic Flood Facts.
 Flooding in Western North Carolina: Some Spatial, Hydrologic, and Seasonal Characteristics J. Greg Dobson CAUTION!! National Environmental Modeling and Analysis Center RENCI at UNC-Asheville Engagement
Benjamin J. Moore. Education. Professional experience
 Benjamin J. Moore Department of Atmospheric and Environmental Sciences University at Albany, State University of New York 1400 Washington Avenue Albany, New York, 12222 phone: +1 507 398 7427 email: bjmoore@albany.edu
MJO Discussion. Eric Maloney Colorado State University. Thanks: Matthew Wheeler, Adrian Matthews, WGNE MJOTF
 MJO Discussion Eric Maloney Colorado State University Thanks: Matthew Wheeler, Adrian Matthews, WGNE MJOTF Intraseasonal OLR and Precipitation Variance Sobel et al. (2010) Peatman et al. (2013) MJO cycle
NWS SERFC Hydrologic Vulnerability Assessment. Monday, March 9 th, 2015 NOAA, National Weather Service Southeast River Forecast Center
 NWS SERFC Hydrologic Vulnerability Assessment Monday, March 9 th, 2015 NOAA, National Weather Service Southeast River Forecast Center Current Weather Map Today s weather map shows a blossoming system in
Robert Shedd Northeast River Forecast Center National Weather Service Taunton, Massachusetts, USA
 Robert Shedd Northeast River Forecast Center National Weather Service Taunton, Massachusetts, USA Outline River Forecast Centers FEWS Implementation Status Forcing Data Ensemble Forecasting The Northeast
Climate Outlook through 2100 South Florida Ecological Services Office Vero Beach, FL September 9, 2014
 Climate Outlook through 2100 South Florida Ecological Services Office Vero Beach, FL September 9, 2014 Short Term Drought Map: Short-term (
Surface Processes Focus on Mass Wasting (Chapter 10)
") Surface Processes Focus on Mass Wasting (Chapter 10) 1. What is the distinction between weathering, mass wasting, and erosion? 2. What is the controlling force in mass wasting? What force provides resistance?
Surface Processes Focus on Mass Wasting (Chapter 10) 1. What is the distinction between weathering, mass wasting, and erosion? 2. What is the controlling force in mass wasting? What force provides resistance?
PRMS WHITE PAPER 2014 NORTH ATLANTIC HURRICANE SEASON OUTLOOK. June RMS Event Response
 PRMS WHITE PAPER 2014 NORTH ATLANTIC HURRICANE SEASON OUTLOOK June 2014 - RMS Event Response 2014 SEASON OUTLOOK The 2013 North Atlantic hurricane season saw the fewest hurricanes in the Atlantic Basin
TABLE OF CONTENTS. 3.1 Synoptic Patterns Precipitation and Topography Precipitation Regionalization... 11
 TABLE OF CONTENTS ABSTRACT... iii 1 INTRODUCTION... 1 2 DATA SOURCES AND METHODS... 2 2.1 Data Sources... 2 2.2 Frequency Analysis... 2 2.2.1 Precipitation... 2 2.2.2 Streamflow... 2 2.3 Calculation of
Trends in the Character of Hurricanes and their Impact on Heavy Rainfall across the Carolinas
 Trends in the Character of Hurricanes and their Impact on Heavy Rainfall across the Carolinas Chip Konrad Carolina Integrated Science and Assessments (CISA) The Southeast Regional Climate Center Department
Issue 44: Phase II & III H&H Issues Date: 07/03/2006 Page 1
 Background Phase I of the NCFMP studies have primarily focused on the coastal plain and sandhills physiographic regions in of the State. Phase II and III study areas will focus on the piedmont, foothills,
Area-Depth Studies for Thunderstorm Rainfall in Illinois
 Circular No. 39 1952 STATE OF ILLINOIS Area-Depth Studies for Thunderstorm Rainfall in Illinois by F. A. HUFF AND G. E. STOUT Issued by Department of Registration and Education C. HOBART ENGLE, Director
Stochastic Modeling of Extreme Floods on the American River at Folsom Dam
 US Army Corps of Engineers Hydrologic Engineering Center Stochastic Modeling of Extreme Floods on the American River at Folsom Dam Appendix D - Procedures Implemented for Conducting Storm Analyses in Support
How Will the Colorado Run? The Colorado River in a Warmer World
 How Will the Colorado Run? The Colorado River in a Warmer World The Future of the Colorado River October 13, 2018 Brad Udall Senior Scientist/Scholar Colorado State University Bradley.Udall@colostate.edu
JP 2.8 SPATIAL DISTRIBUTION OF TROPICAL CYCLONE INDUCED PRECIPITATION AND OPERATIONAL APPLICATIONS IN SOUTH CAROLINA
 JP 2.8 SPATIAL DISTRIBUTION OF TROPICAL CYCLONE INDUCED PRECIPITATION AND OPERATIONAL APPLICATIONS IN SOUTH CAROLINA R. Jason Caldwell *, Hope P. Mizzell, and Milt Brown South Carolina State Climatology
National Weather Service. Harold H. Opitz Hydrologist in Charge
 National Weather Service Harold H. Opitz Hydrologist in Charge Goals Organization Role of the River Forecast Center Describe Forecast System & Tools Other Details NWS River Forecast Centers Northwest River
Tropical Update. 5 AM EDT Tuesday, September 12, 2017 Post-Tropical Cyclone Irma, Hurricane Jose, & Tropical Wave (10%)
") Tropical Update 5 AM EDT Tuesday, September 12, 2017 Post-Tropical Cyclone Irma, Hurricane Jose, & Tropical Wave (10%) This update is intended for government and emergency response officials, and is provided
Tropical Update 5 AM EDT Tuesday, September 12, 2017 Post-Tropical Cyclone Irma, Hurricane Jose, & Tropical Wave (10%) This update is intended for government and emergency response officials, and is provided
C o p e r n i c u s E m e r g e n c y M a n a g e m e n t S e r v i c e f o r e c a s t i n g f l o o d s
 C o p e r n i c u s E m e r g e n c y M a n a g e m e n t S e r v i c e f o r e c a s t i n g f l o o d s Copernicus & Copernicus Services Copernicus EU Copernicus EU Copernicus EU www.copernicus.eu W
USSD Conference, Denver 2016
 USSD Conference, Denver 2016 M Schaefer, MGS Engineering Consultants K Neff, TVA River Operations C Jawdy, TVA River Operations S Carney, Riverside Technology B Barker, MGS Engineering Consultants G Taylor,
Ground Water Protection Council 2017 Annual Forum Boston, Massachusetts. Ben Binder (303)
") Ground Water Protection Council 2017 Annual Forum Boston, Massachusetts Protecting Groundwater Sources from Flood Borne Contamination Ben Binder (303) 860-0600 Digital Design Group, Inc. The Problem Houston
Ground Water Protection Council 2017 Annual Forum Boston, Massachusetts Protecting Groundwater Sources from Flood Borne Contamination Ben Binder (303) 860-0600 Digital Design Group, Inc. The Problem Houston
HyMet Company. Streamflow and Energy Generation Forecasting Model Columbia River Basin
 HyMet Company Streamflow and Energy Generation Forecasting Model Columbia River Basin HyMet Inc. Courthouse Square 19001 Vashon Hwy SW Suite 201 Vashon Island, WA 98070 Phone: 206-463-1610 Columbia River
Combining Deterministic and Probabilistic Methods to Produce Gridded Climatologies
 Combining Deterministic and Probabilistic Methods to Produce Gridded Climatologies Michael Squires Alan McNab National Climatic Data Center (NCDC - NOAA) Asheville, NC Abstract There are nearly 8,000 sites
NIDIS Intermountain West Drought Early Warning System December 11, 2018
 NIDIS Drought and Water Assessment NIDIS Intermountain West Drought Early Warning System December 11, 2018 Precipitation The images above use daily precipitation statistics from NWS COOP, CoCoRaHS, and
Operational water balance model for Siilinjärvi mine
 Operational water balance model for Siilinjärvi mine Vesa Kolhinen, Tiia Vento, Juho Jakkila, Markus Huttunen, Marie Korppoo, Bertel Vehviläinen Finnish Environment Institute (SYKE) Freshwater Centre/Watershed
David R. Vallee Hydrologist in Charge NWS/Northeast River Forecast Center
 David R. Vallee Hydrologist in Charge NWS/Northeast River Forecast Center http://weather.gov/nerfc Providence Street West Warwick, RI at 1030 am Wednesday 3/31/10 A bit about the Northeast River Forecast
Arizona Drought Monitoring Sensitivity and Verification Analyses
 Arizona Drought Monitoring Sensitivity and Verification Analyses A Water Sustainability Institute, Technology and Research Initiative Fund Project Christopher L. Castro, Francina Dominguez, Stephen Bieda
Arizona Cloud Seeding Efforts: A Salt River Project Perspective. James Walter SRP Surface Water Resources CPWAC/CPWP Joint Meeting March 30, 2018
 Arizona Cloud Seeding Efforts: A Salt River Project Perspective James Walter SRP Surface Water Resources Importance of Winter Precipitation Winter Cloud Seeding 101 Early Cloud Seeding Projects Questions