Presented by Jerry A. Gomez, P.E. National Hydropower Association Northeast Regional Meeting - September 17, 2009
|
|
|
- Polly Wilson
- 5 years ago
- Views:
Transcription


1 Presented by Jerry A. Gomez, P.E. National Hydropower Association Northeast Regional Meeting - September 17, 2009
2 Defining Probable Maximum Precipitation (PMP) PMP is the theoretically greatest depth of precipitation for a given duration that is physically possible over a particular drainage area at a certain time of year. American Meteorological Society, 1959 Values of PMP are always estimates based upon extreme storms that have occurred in the past. Estimates of PMP are typically made based upon guidelines given in the various Hydrometeorological Reports published by the National Weather Service.
3 Defining Probable Maximum Flood (PMF) Probable Maximum Flood (PMF): The flood that may be expected from the most severe combination of critical meteorological and hydrologic conditions that are reasonably possible in the drainage basin under study.
4 HMR No. 51 Values HMR No. 51 was published in 1978 and includes storm evaluations that are several decades old. Hurricane Agnes (June 1972) was the latest significant storm to be worked up for the northeast. Modern computer modeling methods are being used to develop more accurate PMP estimates Geographic Information System (GIS) software Improved understanding of the meteorological processes Estimates of PMP values within the stippled regions of HMR No. 51 might be deficient because detailed terrain effects have not been evaluated.
5 Areas of Uncertainty in HMR 51 Generalized Estimates of PMP
6 When to Consider a Site-Specific PMP Study You want to better assess the risk of your project. The current PMP does not have the required back-up The project discharge capacity is insufficient to pass the current PMF and expected remediation is costly. The project lies within the stippled area There is a significant topographic barrier between the drainage basin and the expected moisture sources.
7 Site-Specific PMP vs. HMR No. 51 Values Both use the same basic rainfall adjustment procedures. The July 17-18, 1942 Smethport, PA storm was included in HMR 51 and likely influenced values across NY and New England. MCCs were excluded from eastern NY and New England site-specific PMPs, as not considered transpositionable to this region. HMR 51 did not address topographic effects.
8 Site-Specific PMP vs. HMR No. 51 Values Site-Specific Studies Included: Barrier Moisture Depletion Storm Elevation Adjustments In Basin Orographic Adjustments Analysis of New Storms Re-analysis of Moisture Source/Storm Maximization for Select Storms NEXRAD Radar Used to Assist in Rainfall Evaluation
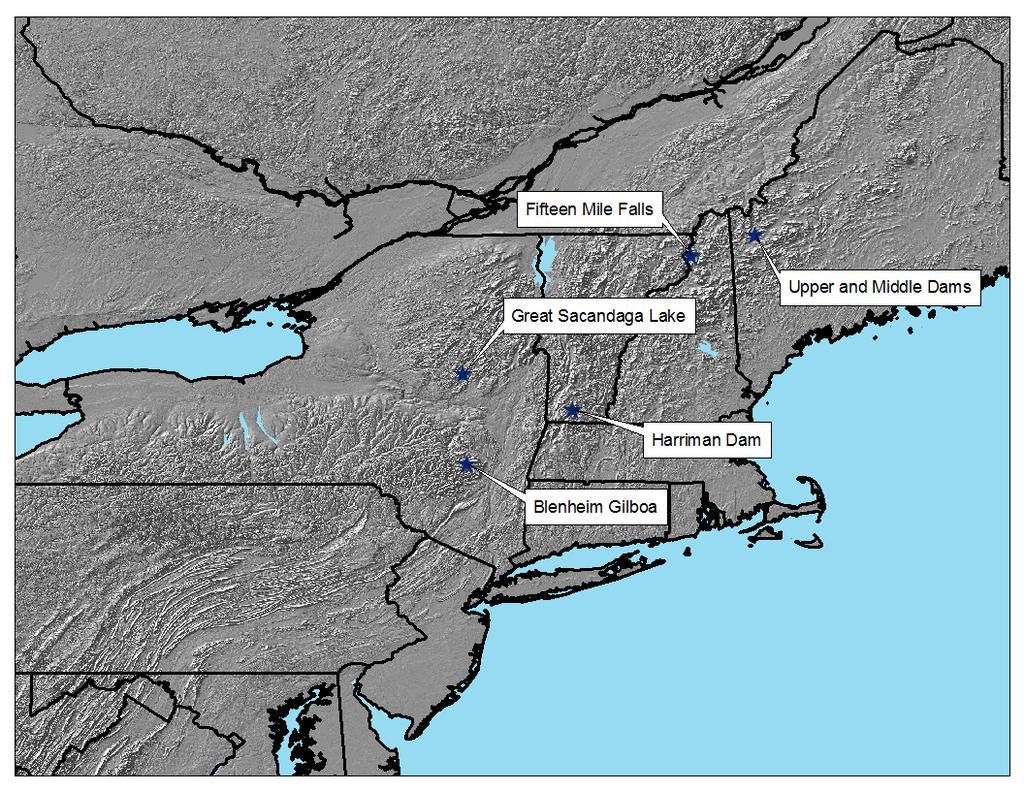
9 Site-Specific PMP Studies
10
11
12 Site-Specific PMP Estimation Identify historic extreme storms that could occur within basin of interest Identify topographic features which can dilute or enhance the moisture content of the storm Evaluate meteorological conditions for transposition and maximization of storm Envelope transposed and maximized storms
13 Storm Adjustments for PMP Estimation In-Place Maximization Transposition Elevation Adjustment Barrier Adjustment In-Basin Orographic Adjustment

14 Meteorological Storm Adjustments

15 Topographic Storm Adjustments
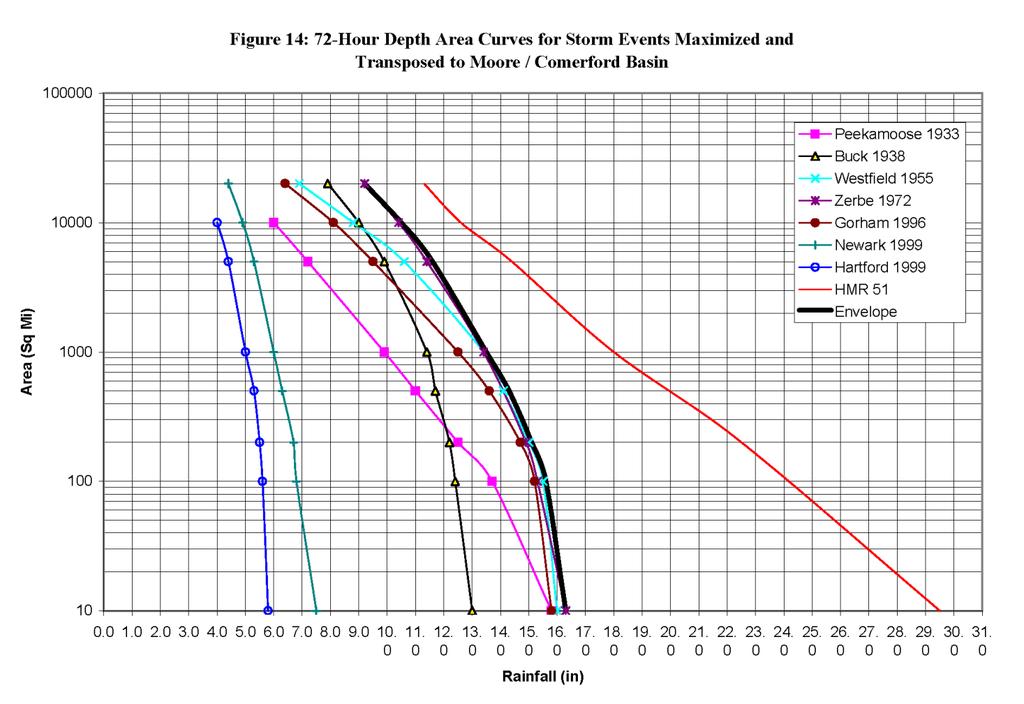
16 Depth-Area Envelope
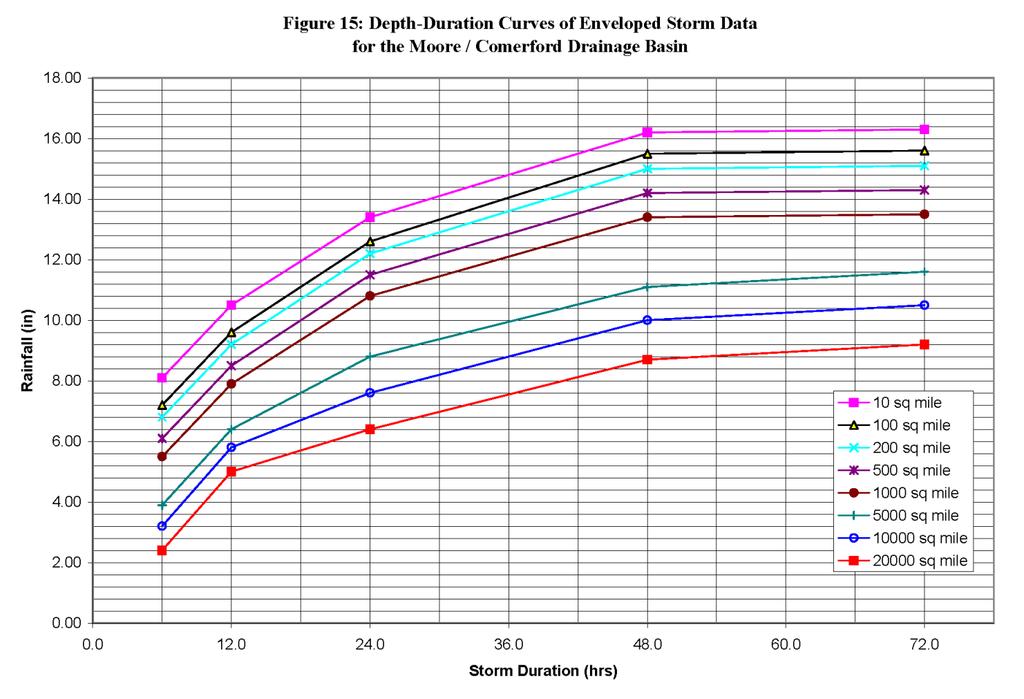
17 Depth-Duration Curves
18 Applying Site-Specific PMP for PMF Estimation Warm-Season Procedure Prepare/Calibrate hydrologic model Compile rain and flow gage records Evaluate existing project discharge curves Initial estimates of unit hydrograph and baseflow parameters Calibrate model for unit hydrograph parameters and loss rates Model PMF Estimate antecedent moisture, baseflow and reservoir stage
19 Applying Site-Specific PMP for PMF Estimation Cold-Season Procedure Screening level analysis Estimate 100-year snowpack Full rain on snow analysis Re-calibrate hydrologic model additional data needed Temperature, dewpoint, snow water content, wind, solar radiation, albedo Maximum wind and temperature series Seasonally adjusted PMP
20 Potential Challenges Data deficiencies Out of date data storage methods lack of equipment to read stream flow records Infrequent rainfall data daily recordings only Lack of snow water equivalence data lack of monitoring sites and low frequency of measurements Temperature measurements only taken once daily at most NOAA stations Dewpoint and windspeed only measured at first order NOAA stations typically only at airports data often recorded only during daylight hours
21 New Data Sources National Center for Environmental Prediction North American Regional Reanalysis (NCEP NARR) Estimates of environmental variables based on analysis/forecast model 4 hour frequency, 0.3 degree spatial grid (approximately 20 mi.) Temperature, wind, dewpoint, rainfall, snowpack, radiation, evaporation, pressure, etc. Most data available from 1979 to present
22 New Data Sources MesoWest University of Utah Similar to NOAA Cooperative Network stations Typically collect rainfall, temperature and dewpoint, may have wind pressure and solar radiation measurements Only recent data since early 2000 s at most stations in the northeast Add additional stations to traditional NOAA stations
23 Additional Considerations Incremental Dambreak/IDF Study Review/Update of Project Discharge Capacity Curves Review of Operational Procedures/Constraints
24 Follow-up Questions? Contact: Jerry Gomez, P.E. Gomez and Sullivan Engineers, P.C. 288 Genesee Street Utica, NY
25 July 17-18, 1942 Smethport, PA Storm For the northeast region of the United States, the controlling historical storm event is the July 17-18, 1942 Smethport, Pennsylvania storm During this storm, it was estimated that a world record 30.8 inches of rain fell in a 4.5 hour period This rainfall intensity is significantly more than all of the other hundreds of historical storms used to develop PMP estimates for the East Coast Therefore, this storm alone drives the PMP envelope for a large portion of the northeastern U.S. Recent investigations question the Depth-Area-Duration values for Smethport.
26 July 17-18, 1942 Smethport, PA Storm It is the current opinion of meteorologists that Smethport was the result of a Mesoscale Convective Complex (MCC) It is the current opinion of meteorologists that it is not appropriate to transposition strong MCCs north and/or east of western PA and possibly western NY.
MIDWEST PROBABLE MAXIMUM PRECIPITATION STUDIES
 MIDWEST PROBABLE MAXIMUM PRECIPITATION STUDIES Bill Kappel Senior Meteorologist/Vice President Ed Tomlinson, PhD Chief Meteorologist/President Applied Weather Associates www.appliedweatherassociates.com
Updating Probable Maximum Precipitation for the Tennessee Valley Authority
 Updating Probable Maximum Precipitation for the Tennessee Valley Authority Bill Kappel, President/Senior Meteorologist Applied Weather Associates, Monument, CO www.appliedweatherassociates.com Mike Eiffe,
PO Box 680 Monument, Co / appliedweatherassociates.com. Probable Maximum Precipitation (PMP)
") PO Box 680 Monument, Co 80132 719/488-9117 appliedweatherassociates.com Probable Maximum Precipitation (PMP) Probable Maximum Precipitation Introduction Concept of Probable Maximum Precipitation (PMP)
PO Box 680 Monument, Co 80132 719/488-9117 appliedweatherassociates.com Probable Maximum Precipitation (PMP) Probable Maximum Precipitation Introduction Concept of Probable Maximum Precipitation (PMP)
Study 16.5 Probable Maximum Flood (PMF)
") Initial Study Report Meeting Study 16.5 Probable Maximum Flood (PMF) October 22, 2014 Prepared by 10/22/2014 1 Study 16.5 Objectives Develop a site-specific PMP to be used for the derivation of the PMF
Initial Study Report Meeting Study 16.5 Probable Maximum Flood (PMF) October 22, 2014 Prepared by 10/22/2014 1 Study 16.5 Objectives Develop a site-specific PMP to be used for the derivation of the PMF
Probable Maximum Precipitation Study
 Probable Maximum Precipitation Study Virginia Floodplain Management Association Workshop Thursday, October 29, 2015 Robert T. Bennett, PE, RA, CFM DCR Dam Safety & Floodplain Management Definition (4VAC50-20-50.H)
Bill Kappel. Doug Hultstrand. Applied Weather Associates
 Cool-Season PMP/PMF Meteorological Time Series for Snow Melt Calculations Bill Kappel Senior Meteorologist/Vice President Doug Hultstrand Hydrometeorologist Applied Weather Associates www.appliedweatherassociates.com
Dam Safety: Revisiting PMPs
 Dam Safety: Revisiting PMPs Many dam safety officials use probable maximum precipitation (PMP) for dam safety evaluations and design requirements. But the series of federal publications that provides PMP
The general procedure for estimating 24-hour PMP includes the following steps:
 14th Conference on Applied Climatology Abstract # 71520 Using PRISM Climate Grids and GIS for Extreme Precipitation Mapping George H. Taylor and Christopher Daly Oregon State University Corvallis Oregon
Updating PMP to Provide Better Dam and Spillway Design
 Protections 2016 2 nd International Seminar on Dam Protection Against Overtopping ISBN: 978-1-1889143-27-9 DOI: Ft. Collins, Colorado, USA, 7-9 September 2016 Updating PMP to Provide Better Dam and Spillway
The NEXRAD Revolution: Scientific Basis for Updating the HMR-49 Statistical Storm Intensities and PMPs
 The NEXRAD Revolution: Scientific Basis for Updating the HMR-49 Statistical Storm Intensities and PMPs Bill Kappel, Senior Meteorologist/President Applied Weather Associates, Monument, CO www.appliedweatherassociates.com
Using PRISM Climate Grids and GIS for Extreme Precipitation Mapping
 Using PRISM Climate Grids and GIS for Extreme Precipitation Mapping George H. Taylor, State Climatologist Oregon Climate Service 316 Strand Ag Hall Oregon State University Corvallis OR 97331-2209 Tel:
Study 16.5 Probable Maximum Flood (PMF)
") Initial Study Report Meeting Study 16.5 Probable Maximum Flood (PMF) March 30, 2016 Prepared by 3/30/2016 1 Study 16.5 Status ISR documents (ISR Part D Overview): Status: Initial Study Report: Parts A,
Initial Study Report Meeting Study 16.5 Probable Maximum Flood (PMF) March 30, 2016 Prepared by 3/30/2016 1 Study 16.5 Status ISR documents (ISR Part D Overview): Status: Initial Study Report: Parts A,
Detailed Storm Rainfall Analysis for Hurricane Ivan Flooding in Georgia Using the Storm Precipitation Analysis System (SPAS) and NEXRAD Weather Radar
 and NEXRAD Weather Radar") Detailed Storm Rainfall Analysis for Hurricane Ivan Flooding in Georgia Using the Storm Precipitation Analysis System (SPAS) and NEXRAD Weather Radar Ed Tomlinson, PhD and Bill Kappel Applied Weather Associates
Detailed Storm Rainfall Analysis for Hurricane Ivan Flooding in Georgia Using the Storm Precipitation Analysis System (SPAS) and NEXRAD Weather Radar Ed Tomlinson, PhD and Bill Kappel Applied Weather Associates
Appendix D. Model Setup, Calibration, and Validation
 . Model Setup, Calibration, and Validation Lower Grand River Watershed TMDL January 1 1. Model Selection and Setup The Loading Simulation Program in C++ (LSPC) was selected to address the modeling needs
NRC Workshop - Probabilistic Flood Hazard Assessment Jan 2013
 Regional Precipitation-Frequency Analysis And Extreme Storms Including PMP Current State of Understanding/Practice Mel Schaefer Ph.D. P.E. MGS Engineering Consultants, Inc. Olympia, WA NRC Workshop - Probabilistic
Heavy Rainfall Event of June 2013
 Heavy Rainfall Event of 10-11 June 2013 By Richard H. Grumm National Weather Service State College, PA 1. Overview A 500 hpa short-wave moved over the eastern United States (Fig. 1) brought a surge of
Ed Tomlinson, PhD Bill Kappel Applied Weather Associates LLC. Tye Parzybok Metstat Inc. Bryan Rappolt Genesis Weather Solutions LLC
 Use of NEXRAD Weather Radar Data with the Storm Precipitation Analysis System (SPAS) to Provide High Spatial Resolution Hourly Rainfall Analyses for Runoff Model Calibration and Validation Ed Tomlinson,
9. PROBABLE MAXIMUM PRECIPITATION AND PROBABLE MAXIMUM FLOOD
 9. PROBABLE MAXIMUM PRECIPITATION AND PROBABLE MAXIMUM FLOOD 9.1. Introduction Due to the size of Watana Dam and the economic importance of the Project to the Railbelt, the Probable Maximum Flood (PMF)
ALASKA ENERGY AUTHORITY AEA REP Appendix A. Probable Maximum Precipitation Study REP. Applied Weather Associates
 13-1402-REP-123114 Appendix A Probable Maximum Precipitation Study 14-07-REP by Applied Weather Associates Report 14-07-REP v1.0 Susitna-Watana Hydroelectric Project Probable Maximum Precipitation Study
Minor Winter Flooding Event in northwestern Pennsylvania January 2017
 1. Overview Minor Winter Flooding Event in northwestern Pennsylvania 12-13 January 2017 By Richard H. Grumm National Weather Service State College, PA A combination of snow melt, frozen ground, and areas
Near Real-Time Runoff Estimation Using Spatially Distributed Radar Rainfall Data. Jennifer Hadley 22 April 2003
 Near Real-Time Runoff Estimation Using Spatially Distributed Radar Rainfall Data Jennifer Hadley 22 April 2003 Introduction Water availability has become a major issue in Texas in the last several years,
The Stochastic Event Flood Model Applied to Minidoka Dam on the Snake River, Idaho
 The Stochastic Event Flood Model Applied to Minidoka Dam on the Snake River, Idaho K. L. Bullard 1, M. G. Schaeffer 2, B. A. Barker 3, D. Sutley 4, and V. Leverson 5 1 Bureau of Reclamation, Flood Hydrology
An Overview of Operations at the West Gulf River Forecast Center Gregory Waller Service Coordination Hydrologist NWS - West Gulf River Forecast Center
 National Weather Service West Gulf River Forecast Center An Overview of Operations at the West Gulf River Forecast Center Gregory Waller Service Coordination Hydrologist NWS - West Gulf River Forecast
Chapter 5 CALIBRATION AND VERIFICATION
 Chapter 5 CALIBRATION AND VERIFICATION This chapter contains the calibration procedure and data used for the LSC existing conditions model. The goal of the calibration effort was to develop a hydraulic
Module 11: Meteorology Topic 5 Content: Weather Maps Notes
 Introduction A variety of weather maps are produced by the National Weather Service and National Oceanographic Atmospheric Administration. These maps are used to help meteorologists accurately predict
Lake Tahoe Watershed Model. Lessons Learned through the Model Development Process
 Lake Tahoe Watershed Model Lessons Learned through the Model Development Process Presentation Outline Discussion of Project Objectives Model Configuration/Special Considerations Data and Research Integration
Hydrologic Research Laboratory Department of Civil and Environmental Engineering University of California, Davis
 Physically-Based Estimation of Maximum Precipitation: Preliminary Results on Application to American River Basin for the December,1996-January,1997 Flood Event Hydrologic Research Laboratory Department
CARFFG System Development and Theoretical Background
 CARFFG Steering Committee Meeting 15 SEPTEMBER 2015 Astana, KAZAKHSTAN CARFFG System Development and Theoretical Background Theresa M. Modrick, PhD Hydrologic Research Center Key Technical Components -
Estimating Probable Maximum Precipitation for Linau River Basin in Sarawak
 Estimating Probable Maximum Precipitation for Linau River Basin in Sarawak M. Hussain, S. Nadya and F.J. Chia Hydropower Development Division, Sarawak Energy Berhad, 93050, Kuching, Sarawak, Malaysia Date
Hydrologic Overview & Quantities
 Hydrologic Overview & Quantities It is important to understand the big picture when attempting to forecast. This includes the interactive components and hydrologic quantities. Hydrologic Cycle The complexity
NIDIS Intermountain West Regional Drought Early Warning System February 7, 2017
 NIDIS Drought and Water Assessment NIDIS Intermountain West Regional Drought Early Warning System February 7, 2017 Precipitation The images above use daily precipitation statistics from NWS COOP, CoCoRaHS,
NRC Workshop Probabilistic Flood Hazard Assessment (PFHA) Jan 29-31, Mel Schaefer Ph.D. P.E. MGS Engineering Consultants, Inc.
 Jan 29-31, Mel Schaefer Ph.D. P.E. MGS Engineering Consultants, Inc.") Stochastic Event Flood Model (SEFM) Stochastic Modeling of Extreme Floods A Hydrological Tool for Analysis of Extreme Floods Mel Schaefer Ph.D. P.E. MGS Engineering Consultants, Inc. Olympia, WA NRC Workshop
Stochastic Event Flood Model (SEFM) Stochastic Modeling of Extreme Floods A Hydrological Tool for Analysis of Extreme Floods Mel Schaefer Ph.D. P.E. MGS Engineering Consultants, Inc. Olympia, WA NRC Workshop
The Hydrologic Cycle: How Do River Forecast Centers Measure the Parts?
 The Hydrologic Cycle: How Do River Forecast Centers Measure the Parts? Greg Story Meteorologist National Weather Service Fort Worth, TX Overview n Introduction What is the mission of an RFC? n The Hydrologic
Oregon Water Conditions Report May 1, 2017
 Oregon Water Conditions Report May 1, 2017 Mountain snowpack in the higher elevations has continued to increase over the last two weeks. Statewide, most low and mid elevation snow has melted so the basin
Speakers: NWS Buffalo Dan Kelly and Sarah Jamison, NERFC Jeane Wallace. NWS Flood Services for the Black River Basin
 Speakers: NWS Buffalo Dan Kelly and Sarah Jamison, NERFC Jeane Wallace NWS Flood Services for the Black River Basin National Weather Service Who We Are The National Oceanic and Atmospheric Administration
The Documentation of Extreme Hydrometeorlogical Events: Two Case Studies in Utah, Water Year 2005
 The Documentation of Extreme Hydrometeorlogical Events: Two Case Studies in Utah, Water Year 2005 Tim Bardsley1*, Mark Losleben2, Randy Julander1 1. USDA, NRCS, Snow Survey Program, Salt Lake City, Utah.
TEMPORAL DISTIRUBTION OF PMP RAINFALL AS A FUNCTION OF AREA SIZE. Introduction
 TEMPORAL DISTIRUBTION OF PMP RAINFALL AS A FUNCTION OF AREA SIZE Bill D. Kappel, Applied Weather Associates, LLC Edward M. Tomlinson, Ph.D., Applied Weather Associates, LLC Tye W. Parzybok, Metstat, Inc.
Oregon Water Conditions Report April 17, 2017
 Oregon Water Conditions Report April 17, 2017 Mountain snowpack continues to maintain significant levels for mid-april. By late March, statewide snowpack had declined to 118 percent of normal after starting
SAMPLE. SITE SPECIFIC WEATHER ANALYSIS Rainfall Report. Bevens Engineering, Inc. Susan M. Benedict REFERENCE:
 SAMPLE SITE SPECIFIC WEATHER ANALYSIS Rainfall Report PREPARED FOR: Bevens Engineering, Inc. Susan M. Benedict REFERENCE: DUBOWSKI RESIDENCE / FILE# 11511033 CompuWeather Sample Report Please note that
Lessons Learned and Shared
 Lessons Learned and Shared Plan for the worst. Hope for the best. Remember that hope is not a strategy. Agnes 8 Lessons 1. Identify Susceptible Communities 2. Develop a Plan 3. Threat Recognition 4. Review
NIDIS Intermountain West Drought Early Warning System September 4, 2018
 NIDIS Drought and Water Assessment NIDIS Intermountain West Drought Early Warning System September 4, 2018 Precipitation The images above use daily precipitation statistics from NWS COOP, CoCoRaHS, and
Climatic Change Implications for Hydrologic Systems in the Sierra Nevada
 Climatic Change Implications for Hydrologic Systems in the Sierra Nevada Part Two: The HSPF Model: Basis For Watershed Yield Calculator Part two presents an an overview of why the hydrologic yield calculator
NIDIS Intermountain West Drought Early Warning System May 23, 2017
 NIDIS Drought and Water Assessment NIDIS Intermountain West Drought Early Warning System May 23, 2017 Precipitation The images above use daily precipitation statistics from NWS COOP, CoCoRaHS, and CoAgMet
Overview of a Changing Climate in Rhode Island
 Overview of a Changing Climate in Rhode Island David Vallee, Hydrologist in Charge, National Weather Service Northeast River Forecast Center, NOAA Lenny Giuliano, Air Quality Specialist, Rhode Island Department
Heavy Rainfall and Flooding of 23 July 2009 By Richard H. Grumm And Ron Holmes National Weather Service Office State College, PA 16803
 Heavy Rainfall and Flooding of 23 July 2009 By Richard H. Grumm And Ron Holmes National Weather Service Office State College, PA 16803 1. INTRODUCTION Heavy rains fall over Pennsylvania and eastern New
This page left intentionally blank
 This page left intentionally blank Colorado New Mexico Regional Extreme Precipitation Study Summary Report Volume II Deterministic Regional Probable Maximum Precipitation Estimation Prepared by: Applied
NIDIS Intermountain West Drought Early Warning System November 14, 2017
 NIDIS Intermountain West Drought Early Warning System November 14, 2017 Precipitation The images above use daily precipitation statistics from NWS COOP, CoCoRaHS, and CoAgMet stations. From top to bottom,
Pompton Lakes Dam Downstream Effects of the Floodgate Facility. Joseph Ruggeri Brian Cahill Michael Mak Andy Bonner
 Pompton Lakes Dam Downstream Effects of the Joseph Ruggeri Brian Cahill Michael Mak Andy Bonner ASFPM 2013: Overview Page 2 Overview Page 3 Overview Page 4 Overview Page 5 Overview - Historical Pompton
Indiana County Flash Flood of 22 June 2017
 Indiana County Flash Flood of 22 June 2017 By Richard H. Grumm National Weather Service State College, PA 1. Overview Slow moving thunderstorms brought 3 to 4 inches of rainfall to Indiana County, PA during
Arizona Statewide Probable Maximum Precipitation (PMP), Improving HMR 49
, Improving HMR 49") Arizona Statewide Probable Maximum Precipitation (PMP), Improving HMR 49 Edward M. Tomlinson, Ph.D., Applied Weather Associates, LLC* William D. Kappel, Applied Weather Associates, LLC* Michael Johnson,
Arizona Statewide Probable Maximum Precipitation (PMP), Improving HMR 49 Edward M. Tomlinson, Ph.D., Applied Weather Associates, LLC* William D. Kappel, Applied Weather Associates, LLC* Michael Johnson,
5A.3 THE USE OF ENSEMBLE AND ANOMALY DATA TO ANTICIPATE EXTREME FLOOD EVENTS IN THE NORTHEASTERN U.S.
 5A.3 THE USE OF ENSEMBLE AND ANOMALY DATA TO ANTICIPATE EXTREME FLOOD EVENTS IN THE NORTHEASTERN U.S. Neil A. Stuart(1), Richard H. Grumm(2), John Cannon(3), and Walt Drag(4) (1)NOAA/National Weather Service,
David R. Vallee Hydrologist-in-Charge NOAA/NWS Northeast River Forecast Center
 David R. Vallee Hydrologist-in-Charge NOAA/NWS Northeast River Forecast Center Record flooding along the Shawsheen River during the 2006 Mother s Day Floods Calibrate and implement a variety of hydrologic
Page 1. Name: 4) State the actual air pressure, in millibars, shown at Miami, Florida on the given weather map.
 State the actual air pressure, in millibars, shown at Miami, Florida on the given weather map.") Name: Questions 1 and 2 refer to the following: A partial station model and meteorological conditions table, as reported by the weather bureau in the city of Oswego, New York, are shown below. 1) Using
Name: Questions 1 and 2 refer to the following: A partial station model and meteorological conditions table, as reported by the weather bureau in the city of Oswego, New York, are shown below. 1) Using
Weather Briefing. Coastal Storm Monday-Wednesday Dec 8-10, National Weather Service. Prepared 12/8/14 6:30 AM
 Weather Briefing Coastal Storm Monday-Wednesday Dec 8-10, 2014 National Weather Service http://www.weather.gov/nyc Prepared 12/8/14 6:30 AM Overview of Potential Hazards A strong low pressure system will
3B.3: Climate Controls on the Extreme Rainstorms in the Contiguous US:
 97 th AMS Annual Meeting 3B.3: Climate Controls on the Extreme Rainstorms in the Contiguous US: 1979-2015 Xiaodong Chen and Faisal Hossain Department of Civil and Environmental Engineering University of
JP 2.8 SPATIAL DISTRIBUTION OF TROPICAL CYCLONE INDUCED PRECIPITATION AND OPERATIONAL APPLICATIONS IN SOUTH CAROLINA
 JP 2.8 SPATIAL DISTRIBUTION OF TROPICAL CYCLONE INDUCED PRECIPITATION AND OPERATIONAL APPLICATIONS IN SOUTH CAROLINA R. Jason Caldwell *, Hope P. Mizzell, and Milt Brown South Carolina State Climatology
NIDIS Weekly Climate, Water and Drought Assessment Summary. Upper Colorado River Basin
 NIDIS Weekly Climate, Water and Drought Assessment Summary Upper Colorado River Basin August 3, 2010 Precipitation and Snowpack Fig. 1: July precipitation in inches Fig. 2: July precip as percent of average
National Weather Service-Pennsylvania State University Weather Events
 National Weather Service-Pennsylvania State University Weather Events Heavy Rain 7-8 December 2011 by Richard H. Grumm National Weather Service State College PA 16803 Abstract:. A mid-level short-wave
Pre-Christmas Warm-up December 2013-Draft
 Pre-Christmas Warm-up 21-23 December 2013-Draft By Richard H. Grumm National Weather Service State College, PA 1. Overview A large ridge over the west-central Atlantic (Fig.1) and trough moving into eastern
NWS FORM E-5 U.S. DEPARTMENT OF COMMERCE I HYDRO SERVICE AREA NOAA, NATIONAL WEATHER SERVICE I Indianapolis, IN MONTHLY REPORT
 NWS FORM E-5 U.S. DEPARTMENT OF COMMERCE I HYDRO SERVICE AREA NOAA, NATIONAL WEATHER SERVICE I Indianapolis, IN. 1-------------------- MONTHLY REPORT OF RIVER AND FLOOD CONDITIONSI REPORT FOR I November
CHAPTER 13 WEATHER ANALYSIS AND FORECASTING MULTIPLE CHOICE QUESTIONS
 CHAPTER 13 WEATHER ANALYSIS AND FORECASTING MULTIPLE CHOICE QUESTIONS 1. The atmosphere is a continuous fluid that envelops the globe, so that weather observation, analysis, and forecasting require international
HyMet Company. Streamflow and Energy Generation Forecasting Model Columbia River Basin
 HyMet Company Streamflow and Energy Generation Forecasting Model Columbia River Basin HyMet Inc. Courthouse Square 19001 Vashon Hwy SW Suite 201 Vashon Island, WA 98070 Phone: 206-463-1610 Columbia River
6/9/2014. Software Overview. System Overview
 Future Rainfall 6/9/2014 Curtis Beitel, PE, CFM, Anthony Henry and Wayne Tschirhart, PE, CFM, PMP TFMA Spring 2014 Conference Software Overview 2 Processes Hydrometric DB Event Manager Automatic Low =
Leon Creek Watershed October 17-18, 1998 Rainfall Analysis Examination of USGS Gauge Helotes Creek at Helotes, Texas
 Leon Creek Watershed October 17-18, 1998 Rainfall Analysis Examination of USGS Gauge 8181400 Helotes Creek at Helotes, Texas Terrance Jackson MSCE Candidate University of Texas San Antonio Abstract The
SAMPLE. SITE SPECIFIC WEATHER ANALYSIS Slip and Fall on Snow/Ice. Robinson, Smith & Walsh. John Smith. July 1, 2017 REFERENCE:
 SAMPLE SITE SPECIFIC WEATHER ANALYSIS Slip and Fall on Snow/Ice PREPARED FOR: Robinson, Smith & Walsh John Smith July 1, 2017 REFERENCE: MARIE DAVIDSON / 202301 1 Jackson Drive, Hicksville, NY 11801 CompuWeather
Impacts of the April 2013 Mean trough over central North America
 Impacts of the April 2013 Mean trough over central North America By Richard H. Grumm National Weather Service State College, PA Abstract: The mean 500 hpa flow over North America featured a trough over
Flood Forecasting Tools for Ungauged Streams in Alberta: Status and Lessons from the Flood of 2013
 Flood Forecasting Tools for Ungauged Streams in Alberta: Status and Lessons from the Flood of 2013 John Pomeroy, Xing Fang, Kevin Shook, Tom Brown Centre for Hydrology, University of Saskatchewan, Saskatoon
Results of Intensity-Duration- Frequency Analysis for Precipitation and Runoff under Changing Climate
 Results of Intensity-Duration- Frequency Analysis for Precipitation and Runoff under Changing Climate Supporting Casco Bay Region Climate Change Adaptation RRAP Eugene Yan, Alissa Jared, Julia Pierce,
Current Water Conditions in Massachusetts January 11, 2008
 Current Water Conditions in Massachusetts January 11, 2008 December precipitation was above normal December streamflows were below normal and normal December ground-water levels were below normal and normal
1. Which weather map symbol is associated with extremely low air pressure? A) B) C) D) 2. The diagram below represents a weather instrument.
 B) C) D) 2. The diagram below represents a weather instrument.") 1. Which weather map symbol is associated with extremely low air pressure? 2. The diagram below represents a weather instrument. Which weather variable was this instrument designed to measure? A) air pressure
1. Which weather map symbol is associated with extremely low air pressure? 2. The diagram below represents a weather instrument. Which weather variable was this instrument designed to measure? A) air pressure
A Cloud-Based Flood Warning System For Forecasting Impacts to Transportation Infrastructure Systems
 A Cloud-Based Flood Warning System For Forecasting Impacts to Transportation Infrastructure Systems Jon Goodall Associate Professor, Civil and Environmental Engineering Associate Director, Link Lab April
EFFICIENCY OF THE INTEGRATED RESERVOIR OPERATION FOR FLOOD CONTROL IN THE UPPER TONE RIVER OF JAPAN CONSIDERING SPATIAL DISTRIBUTION OF RAINFALL
 EFFICIENCY OF THE INTEGRATED RESERVOIR OPERATION FOR FLOOD CONTROL IN THE UPPER TONE RIVER OF JAPAN CONSIDERING SPATIAL DISTRIBUTION OF RAINFALL Dawen YANG, Eik Chay LOW and Toshio KOIKE Department of
Maximization of Historical Severe Precipitation Events over American, Yuba and Feather River Basins
 Maximization of Historical Severe Precipitation Events over merican, Yuba and Feather River Basins M. L. Kavvas 1, K. Ishida 1, S. Jang 1, N. Ohara 2, Z.Q.Chen 3, and M. nderson 3 1 University Of California,
NIDIS Weekly Climate, Water and Drought Assessment Summary Upper Colorado River Basin Pilot Project 13 July 2010
 NIDIS Weekly Climate, Water and Drought Assessment Summary Upper Colorado River Basin Pilot Project 13 July 2010 Precipitation and Snowpack Over the past week, precipitation in the Upper Colorado River
Meteorology Curriculum Maps Unit 1: Basic Concepts of Meteorology Unit 2: The Atmosphere in Motion
 Meteorology Curriculum Maps Unit 1: Basic Concepts of Meteorology Unit 2: The Atmosphere in Motion NOTE: Meteorology is a one semester course designed for students interested in understanding the complex
Talk Overview. Concepts. Climatology. Monitoring. Applications
 Atmospheric Rivers Talk Overview Concepts Climatology Monitoring Applications Satellite View Where is the storm? Where is the impact? Atmospheric Rivers Plume or fire hose of tropical moisture Heavy precipitation
NIDIS Intermountain West Drought Early Warning System October 17, 2017
 NIDIS Drought and Water Assessment NIDIS Intermountain West Drought Early Warning System October 17, 2017 Precipitation The images above use daily precipitation statistics from NWS COOP, CoCoRaHS, and
Prediction of Snow Water Equivalent in the Snake River Basin
 Hobbs et al. Seasonal Forecasting 1 Jon Hobbs Steve Guimond Nate Snook Meteorology 455 Seasonal Forecasting Prediction of Snow Water Equivalent in the Snake River Basin Abstract Mountainous regions of
Site-Specific and Regional PMP Studies
 Site-Specific and Regional Probable Maximum Precipitation (PMP) Studies Ed Tomlinson, PhD 2009 Western Regional Dam Safety Forum San Francisco, California January 15, 2009 PO Box 680 Monument, Co 80132
Improving Situational Awareness of Flash Flooding in a Small Urban Catchment by Integrating Meteorological Analysis into a Geospatial Framework
 Improving Situational Awareness of Flash Flooding in a Small Urban Catchment by Integrating Meteorological Analysis into a Geospatial Framework John M. Goff 1, Lesley-Ann Dupigny-Giroux 2, John Kilbride
USSD Conference, Denver 2016
 USSD Conference, Denver 2016 M Schaefer, MGS Engineering Consultants K Neff, TVA River Operations C Jawdy, TVA River Operations S Carney, Riverside Technology B Barker, MGS Engineering Consultants G Taylor,
Forecast Challenges for the Colorado Basin River Forecast Center
 Forecast Challenges for the Colorado Basin River Forecast Center John Lhotak, Development and Operations Hydrologist Improving Sub-Seasonal to Seasonal (S2S) Workshop May 16th, 2018 1 River Forecast Centers
Impact of climate change on Australian flood risk: A review of recent evidence
 Impact of climate change on Australian flood risk: A review of recent evidence 30/5/2018 FMA Conference, Gold Coast S Westra 1, B Bennett 1, J Evans 2, F Johnson 3, M Leonard 1, A Sharma 3, C Wasko 4,
January 25, Summary
 January 25, 2013 Summary Precipitation since the December 17, 2012, Drought Update has been slightly below average in parts of central and northern Illinois and above average in southern Illinois. Soil
Precipitation. Standardized Precipitation Index. NIDIS Intermountain West Regional Drought Early Warning System January 3, 2017
 1/3/2017 NIDIS Drought and Water Assessment NIDIS Intermountain West Regional Drought Early Warning System January 3, 2017 Precipitation The images above use daily precipitation statistics from NWS COOP,
Northeastern United States Snowstorm of 9 February 2017
 Northeastern United States Snowstorm of 9 February 2017 By Richard H. Grumm and Charles Ross National Weather Service State College, PA 1. Overview A strong shortwave produced a stripe of precipitation
13.2 USING VIRTUAL GLOBES TO IMPROVE SITUATIONAL AWARENESS IN THE NATIONAL WEATHER SERVICE
 13.2 USING VIRTUAL GLOBES TO IMPROVE SITUATIONAL AWARENESS IN THE NATIONAL WEATHER SERVICE Andy Foster* National Weather Service Springfield, Missouri* Keith Stellman National Weather Service Shreveport,
Estimating the Spatial Distribution of Power Outages during Hurricanes for Risk Management
 Estimating the Spatial Distribution of Power Outages during Hurricanes for Risk Management Marco Palmeri Independent Consultant Master s Candidate, San Francisco State University Dept. of Geography September
NIDIS Intermountain West Drought Early Warning System December 11, 2018
 NIDIS Drought and Water Assessment NIDIS Intermountain West Drought Early Warning System December 11, 2018 Precipitation The images above use daily precipitation statistics from NWS COOP, CoCoRaHS, and
Flooding in Western North Carolina: Some Spatial, Hydrologic, and Seasonal Characteristics CAUTION!! Outline. Basic Flood Facts.
 Flooding in Western North Carolina: Some Spatial, Hydrologic, and Seasonal Characteristics J. Greg Dobson CAUTION!! National Environmental Modeling and Analysis Center RENCI at UNC-Asheville Engagement
Flood Risk Assessment
 Flood Risk Assessment February 14, 2008 Larry Schick Army Corps of Engineers Seattle District Meteorologist General Assessment As promised, La Nina caused an active winter with above to much above normal
Solution: The ratio of normal rainfall at station A to normal rainfall at station i or NR A /NR i has been calculated and is given in table below.
 3.6 ESTIMATION OF MISSING DATA Data for the period of missing rainfall data could be filled using estimation technique. The length of period up to which the data could be filled is dependent on individual
The Pennsylvania Observer
 The Pennsylvania Observer April 2, 2009 March 2009 Pennsylvania Weather Recap Prepared by Curt Harpster For the month of March the saying, In like a lion and out like a lamb really fit the pattern quite
Comparison of physical and statistical methods for estimating probable maximum precipitation in southwestern basins of Iran
 Fattahi et al. / DESERT 15 (2010) 127-132 DESERT DESERT Online at http://jdesert.ut.ac.ir DESERT 15 (2010) 127-132 Comparison of physical and statistical methods for estimating probable maximum precipitation
DETECTION AND FORECASTING - THE CZECH EXPERIENCE
 1 STORM RAINFALL DETECTION AND FORECASTING - THE CZECH EXPERIENCE J. Danhelka * Czech Hydrometeorological Institute, Prague, Czech Republic Abstract Contribution presents the state of the art of operational
2013 Summer Weather Outlook. Temperatures, Precipitation, Drought, Hurricanes and why we care
 2013 Summer Weather Outlook Temperatures, Precipitation, Drought, Hurricanes and why we care Role of the ERCOT Meteorologist Forecasts Develop temperature input for hourly load forecasts (next day, days
Assessment of extreme flood characteristics based on a dynamic-stochastic model of runoff generation and the probable maximum discharge
 Risk in Water Resources Management (Proceedings of Symposium H3 held during IUGG211 in Melbourne, Australia, July 211) (IAHS Publ. 347, 211). 29 Assessment of extreme flood characteristics based on a dynamic-stochastic
Climate. Annual Temperature (Last 30 Years) January Temperature. July Temperature. Average Precipitation (Last 30 Years)
 January Temperature. July Temperature. Average Precipitation (Last 30 Years)") Climate Annual Temperature (Last 30 Years) Average Annual High Temp. (F)70, (C)21 Average Annual Low Temp. (F)43, (C)6 January Temperature Average January High Temp. (F)48, (C)9 Average January Low Temp.
Climate Annual Temperature (Last 30 Years) Average Annual High Temp. (F)70, (C)21 Average Annual Low Temp. (F)43, (C)6 January Temperature Average January High Temp. (F)48, (C)9 Average January Low Temp.
NEW SCHEME TO IMPROVE THE DETECTION OF RAINY CLOUDS IN PUERTO RICO
 NEW SCHEME TO IMPROVE THE DETECTION OF RAINY CLOUDS IN PUERTO RICO Joan Manuel Castro Sánchez Advisor Dr. Nazario Ramirez UPRM NOAA CREST PRYSIG 2016 October 7, 2016 Introduction A cloud rainfall event
A Synopsis of the December 1-4, 2007 Storm Events
 A Synopsis of the December 1-4, 27 Storm Events An aerial view of the flooded I-5 overpass looking south Flooding in Chehalis. (Associated Press ) Maryanne Reiter, Hydrologist Weyerhaeuser Co. The Wind