Gridded observation data for Climate Services
|
|
|
- Logan Hill
- 5 years ago
- Views:
Transcription
1 Gridded observation data for Climate Services Ole Einar Tveito, Inger Hanssen Bauer, Eirik J. Førland and Cristian Lussana Norwegian Meteorological Institute
2 Norwegian annual temperatures
3 Norwegian annual temperatures
4 Norwegian annual temperatures
5 Norwegian annual temperatures
6
7
8 Gridding of observation - aims to Provide fine scale climate information at any location or area of interest Provide data at relevant scales for various applications and purposes: - Hydrology - Agriculture and forestry - Infrastructure (roads, railways, electricity grids, municipalities) - Energy - Tourism -. Provide a observation basis for understanding and adapting to climate change Truth for calibrating post-processing (bias adjustment) of RCM / Dyn.Downscaling climate projection data. Given robust gridding methods provide space-time consistent and homogeneous information. (Local anomalies will often occur due to network changes though)
9 Gridded observation data sets at Met Norway. Monthly, seasonal and annual data - Period: 1900-present - Variables: Temperature, Precipitation - Methods: Spline interpolation of monthly anomalies. - Derived products: Degree day grids. Daily values (two parallell datasets) - Period: present - Variables: Temperature, Precipitation, Wind (in development) - Methods: Ver.1: Residual Kriging (temperature), Triangulation with terrain dependence (precipitation) Ver. 2: Bayesian spatial optimum interpolation (under operalization) Wind: Downcaling/post-processing of Hindcast data - Datasets covering Fennoscandia based on both ver.1 and 2 are in progress as a part of the FP7 UERRA project. Hourly values - Period: 2010-present - Variables: Temperature and precipitation - Bayesian spatial optimum interpolation (under operalization) Spatial resolution: 1x1 km
10 Precipitation
11 Days with precipitation
12 Number of days > p(0.99)

13 Trends in 1-day precipiation exceeding 10 mm A.V. Dyrrdal et al 2012 Dyrrdal, A.V., Isaksen, K., Hygen, H.O., and Meyer, N.K., 2012: Changes in meteorological variables that can trigger natural hazards in Norway. Climate Research, 55:
14 Heating degree days HDD = (17 TAM) TAM < 10
15 Heating degree days HDD = (17 TAM) TAM < 10
16 Growing degreedays in Oslo-Blindern
17 Change of the growing season, HadA GDD = (TAM 5) TAM > Norwegian Meteorological Institute


18 Change of the growing season, HadA GDD = (TAM 5) TAM > Norwegian Meteorological Institute
19 Days > 20 C
20 Days > 20 C
21 Days > 20 C
22 Days > 20 C, Western Norway

23 Days > 20 C, Western Norway
24 Days > 20 C

25 RCP 4.5 RCP 8.5

26 Shorter winters! Norwegian less dominant in cross-country skiing? - We will still have areas with winter conditions though..
27 Area averaged maps Municipality level MET is developing a area averaged data set on municipality level for temperature, precipitation and snow for the purpose of societal planning. Challenge: what is the most relevant area in a municipality? The entire municipality? The part with developed infrastructure?
28 Mean annual temperature ( ) Covering the whole area of the municipality

29 Mean annual temperature ( ) Covering the infrastructural area of the municipality
30 Observation gridding How we are doing it
 senorge: gridded datasets; Norwegian mainland +parts of Sweden and Finland; 1Km resolution source: Observations from MET")
 Temperature hourly (TA) Precipitation daily (RR) Temperature daily mean (TAM) Periods: Hourly datasets 2010")
31 Klimagrid v 2.0 Replace the current Klimagrid1.1 (SeNorge1.1) senorge: gridded datasets; Norwegian mainland +parts of Sweden and Finland; 1Km resolution source: Observations from MET Norway Climate database (manual + automatic weather station data) Precipitation 1h (RR_1) Precipitation 3h (based on hourly observations) Temperature hourly (TA) Precipitation daily (RR) Temperature daily mean (TAM) Periods: Hourly datasets onwards (hourly updated) Daily datasets onwards (updated daily)
32 Daily mean temperature 16.March 2015 Klimagrid 1.1 Temperature and precipitation Daily precipitation 29.October 2014 Period: present Resolution: 1x1 km Cover mainland Norway.
33 Klimagrid v1.1 Temperature Residual interpolation: ) u ( ) u ( ) u ( ) t(u ) u ( t m m n i i i ^ λ
34 Klimagrid v1.1 Temperature Residual interpolation: ) u ( ) u ( ) u ( ) t(u ) u ( t m m n i i i ^ λ Kriging (or any spatial interpolation method)
35 Klimagrid v1.1 Temperature Residual interpolation: ) u ( ) u ( ) u ( ) t(u ) u ( t m m n i i i ^ λ External trend/drift (linear regression) Kriging (or any spatial interpolation method)
36 Klimagrid v1.1 Temperature Residual interpolation: ) u ( ) u ( ) u ( ) t(u ) u ( t m m n i i i ^ λ External trend/drift (linear regression) Kriging (or any spatial interpolation method)
 λ t(ui ) ( u ) ( u ) m m( i 0 11 0 22")
 0.400 0.004 0.2 0.200 0.002 0.1 0.000 0 0-0.200-0.002-0.1-0.400-0.004-0.2-0.600-0.")

37 Correlation coefficients Coefficients terrain Coefficients position Klimagrid v1.1 Temperature Residual interpolation: ^ n t ( u0 ) λ t(ui ) ( u ) ( u ) m m( i u0 i1 ) Kriging (or any spatial interpolation method) External trend/drift (linear regression) Jan Feb Mar Apr May Jun Jul Aug Sep Oct Nov Dec LAT Month LONG ALT DEM_MEAN DEM_MIN Month ALT DEM_MEAN DEM_MIN LAT LONG -0.5


38 Trend climatological first guess

39 MET Norway TEMP1d - Evaluation Norwegian Meteorological Institute

 scale Norwegian")
40 Large(coarser) scale trend estimation Klimagrid 2.0 TEMP1d: OI + OI introduces the Local(finer) scale Norwegian Meteorological Institute
 Spatial Interpolation method: hourly temperature Large scale after")
41 Temperature Spatial interpolation method is the same both for hourly and daily (in the future, it is possible that a post-processing of 24 hourly temperature fields will be used a first guess for the daily spatial interpolation) Spatial Interpolation method: hourly temperature Large scale after de-trending
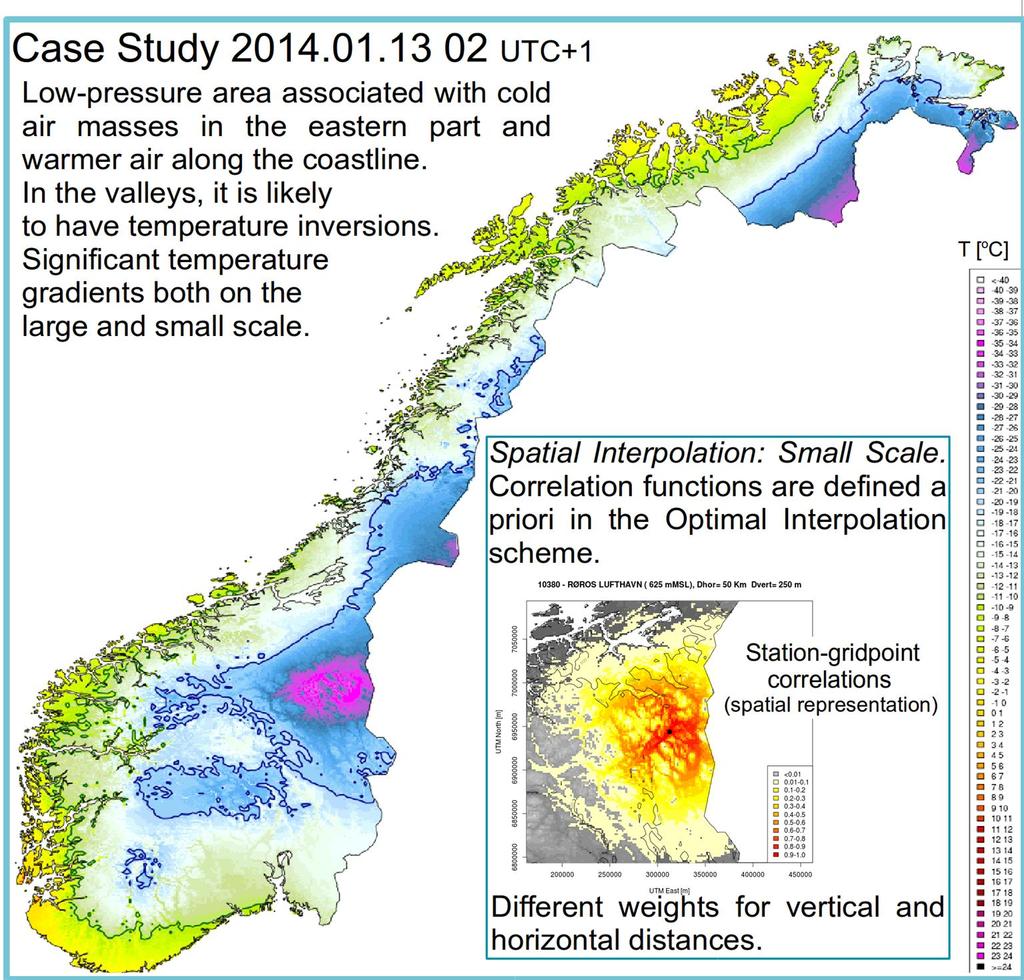
42 Temperature: local scale


43 Old method New method New method reduce estimation error. (RMSE, independent cross-validation) Norwegian Meteorological Institute


44 Precipitation v1.1 Triangulation. Includes elevation dependence. Correction for wind-loss. - = x =
 from")
45 Precip v approach 1. Identification of Events a) Precipitation yes/no distinction (gridpoints) b) Contiguous Precipitation Areas (CPAs) identification and labeling 2. Iterative loop over Events - Multiscale Optimal Interpolation Event coarser scale At coarser spatial scales, precipitation events have a less Cascade of spatial scales: complex (smoother) from coarser to finer levels representation.... Event finer scale information At finer spatial scales, the measured precipitation shows a greater variability.... Prec Intensity strong weak
 (given the Station distribution) Event A Event B Event C Events D,.")
46 Spatial Interpolation Method based on Multi-scale Optimal Interpolation (Prec) Step 0: Identification of Precipitation Events (Observed Areas of Precipitation) (given the Station distribution) Event A Event B Event C Events D,... Norwegian Meteorological Institute

47 Multi-Scale Optimal Interpolation Step-by-step: from coarser to local scale Norwegian Meteorological Institute
48 Multi-Scale Optimal Interpolation Step-by-step: predicted field Norwegian Meteorological Institute


49 Challenges & limitations (i) Observation gridding is basically based on statistical relations - Quality depends on station density and representativity of the station network. The choice of external predictor should be based on a good understanding of the physical processes of the predictand (on a local scale).
50 Challenges & limitations (ii) Combine datasources? - Observations - Radar - Model fields (NWP, RA) Ensemble gridding? - Conditional stochastic simulations - Bayesian statistical analysis (OI) in «an ensemble» mode - Analogue techniques - Atm. circulation as conditional input? - Observations itself set the conditions?
51 Challenges & limitations (iii) High resolution timeseries are more «noisy» than long-term data series spatial covariance is lower (estimates are more uncertain) and the «signal» is weaker. Physical concistency between elements (precip, temperature) will not be retained. For long-term data with «low» (daily, monthly.) resolution observation gridding provide useful and precise information. For historical dataseries (> 50 years) it is probably the best (only) reference.
52 Future NWP, RCM and RRA models are «chasing» the spatial resolution of observation gridding. - Provide physical consistent data - Spatial scale is an issue. 4-5 x the resolution. The gap between observation gridding and atmospheric model approaches for providing climatological data are ready be closed. - Apply gridding concepts in postprocessing of NWP/RA - Apply NWP/RA fields as first guess - Independent validation


53 Thank you Norwegian Meteorological Institute
Observation based gridded climate data in Norway motivations, experiences, challenges, considerations..
 Observation based gridded climate data in Norway motivations, experiences, challenges, considerations.. Ole Einar Tveito and Cristian Lussana Norwegian Meteorological Institute Foto: MORTEN AAKRE, FOTOGRAFEN
Spatial Interpolation of daily Temperature and Precipitation for the Fennoscandia
 Spatial Interpolation of daily Temperature and Precipitation for the Fennoscandia Cristian Lussana and Ole Einar Tveito (1) Norwegian Meteorological Institute, Oslo 30.10.2015 10th EUMETNET Data Management
The Norwegian Centre for Climate Services - NCCS
 The Norwegian Centre for Climate Services - NCCS Extremes Products - Dissemination Eirik J. Førland, Norwegian Meteorological Institute, Oslo, Norway Impact assessment consultation workshop, Budapest,
Standardized Anomaly Model Output Statistics Over Complex Terrain.
 Standardized Anomaly Model Output Statistics Over Complex Terrain Reto.Stauffer@uibk.ac.at Outline statistical ensemble postprocessing introduction to SAMOS new snow amount forecasts in Tyrol sub-seasonal
Gridding of precipitation and air temperature observations in Belgium. Michel Journée Royal Meteorological Institute of Belgium (RMI)
") Gridding of precipitation and air temperature observations in Belgium Michel Journée Royal Meteorological Institute of Belgium (RMI) Gridding of meteorological data A variety of hydrologic, ecological,
Gridding of precipitation and air temperature observations in Belgium Michel Journée Royal Meteorological Institute of Belgium (RMI) Gridding of meteorological data A variety of hydrologic, ecological,
Climatography of the United States No
 Climate Division: CA 5 NWS Call Sign: Elevation: 6 Feet Lat: 37 Month (1) Min (2) Month(1) Extremes Lowest (2) Temperature ( F) Lowest Month(1) Degree s (1) Base Temp 65 Heating Cooling 1 Number of s (3)
Climatography of the United States No
 Climate Division: CA 4 NWS Call Sign: Elevation: 2 Feet Lat: 37 Month (1) Min (2) Month(1) Extremes Lowest (2) Temperature ( F) Lowest Month(1) Degree s (1) Base Temp 65 Heating Cooling 1 Number of s (3)
Climatography of the United States No
 Climate Division: CA 4 NWS Call Sign: Elevation: 13 Feet Lat: 36 Month (1) Min (2) Month(1) Extremes Lowest (2) Temperature ( F) Lowest Month(1) Degree s (1) Base Temp 65 Heating Cooling 1 Number of s
Climatography of the United States No
 Climate Division: CA 5 NWS Call Sign: Elevation: 1,14 Feet Lat: 36 Month (1) Min (2) Month(1) Extremes Lowest (2) Temperature ( F) Lowest Month(1) Degree s (1) Base Temp 65 Heating Cooling 1 Number of
Quantification of energy losses caused by blade icing and the development of an Icing Loss Climatology
 Quantification of energy losses caused by blade icing and the development of an Icing Loss Climatology Using SCADA data from Scandinavian wind farms Staffan Lindahl Winterwind 201 1 SAFER, SMARTER, GREENER
Climatography of the United States No
 Climate Division: CA 6 NWS Call Sign: LAX Elevation: 1 Feet Lat: 33 Month (1) Min (2) Month(1) Extremes Lowest (2) Temperature ( F) Lowest Month(1) Degree s (1) Base Temp 65 Heating Cooling 1 Number of
Climatography of the United States No
 Climate Division: CA 6 NWS Call Sign: TOA Elevation: 11 Feet Lat: 33 2W Temperature ( F) Month (1) Min (2) Month(1) Extremes Lowest (2) Lowest Month(1) Degree s (1) Base Temp 65 Heating Cooling 1 Number
Climatography of the United States No
 Climate Division: AK 5 NWS Call Sign: ANC Month (1) Min (2) Month(1) Extremes Lowest (2) Temperature ( F) Lowest Month(1) Degree s (1) Base Temp 65 Heating Cooling 90 Number of s (3) Jan 22.2 9.3 15.8
Presentation of met.no s experience and expertise related to high resolution reanalysis
 Presentation of met.no s experience and expertise related to high resolution reanalysis Oyvind Saetra, Ole Einar Tveito, Harald Schyberg and Lars Anders Breivik Norwegian Meteorological Institute Daily
2003 Water Year Wrap-Up and Look Ahead
 2003 Water Year Wrap-Up and Look Ahead Nolan Doesken Colorado Climate Center Prepared by Odie Bliss http://ccc.atmos.colostate.edu Colorado Average Annual Precipitation Map South Platte Average Precipitation
Characterization of the solar irradiation field for the Trentino region in the Alps
 Characterization of the solar irradiation field for the Trentino region in the Alps L. Laiti*, L. Giovannini and D. Zardi Atmospheric Physics Group University of Trento - Italy outline of the talk Introduction
Met Éireann Climatological Note No. 15 Long-term rainfall averages for Ireland,
 Met Éireann Climatological Note No. 15 Long-term rainfall averages for Ireland, 1981-2010 Séamus Walsh Glasnevin Hill, Dublin 9 2016 Disclaimer Although every effort has been made to ensure the accuracy
APPLICATIONS OF DOWNSCALING: HYDROLOGY AND WATER RESOURCES EXAMPLES
 APPLICATIONS OF DOWNSCALING: HYDROLOGY AND WATER RESOURCES EXAMPLES Dennis P. Lettenmaier Department of Civil and Environmental Engineering For presentation at Workshop on Regional Climate Research NCAR
Climatography of the United States No
 No. 2 1971-2 Asheville, North Carolina 2881 COOP ID: 46175 Climate Division: CA 6 NWS Call Sign: 3L3 Elevation: 1 Feet Lat: 33 Month (1) Min (2) Month(1) Extremes Lowest (2) Temperature ( F) Lowest Month(1)
Climatography of the United States No
 No. 2 1971-2 Asheville, North Carolina 2881 COOP ID: 42713 Climate Division: CA 7 NWS Call Sign: Elevation: -3 Feet Lat: 32 Month (1) Min (2) Month(1) Extremes Lowest (2) Temperature ( F) Lowest Month(1)
Seasonal Climate Watch June to October 2018
 Seasonal Climate Watch June to October 2018 Date issued: May 28, 2018 1. Overview The El Niño-Southern Oscillation (ENSO) has now moved into the neutral phase and is expected to rise towards an El Niño
GAMINGRE 8/1/ of 7
 FYE 09/30/92 JULY 92 0.00 254,550.00 0.00 0 0 0 0 0 0 0 0 0 254,550.00 0.00 0.00 0.00 0.00 254,550.00 AUG 10,616,710.31 5,299.95 845,656.83 84,565.68 61,084.86 23,480.82 339,734.73 135,893.89 67,946.95
Drought in Southeast Colorado
 Drought in Southeast Colorado Nolan Doesken and Roger Pielke, Sr. Colorado Climate Center Prepared by Tara Green and Odie Bliss http://climate.atmos.colostate.edu 1 Historical Perspective on Drought Tourism
Changing Hydrology under a Changing Climate for a Coastal Plain Watershed
 Changing Hydrology under a Changing Climate for a Coastal Plain Watershed David Bosch USDA-ARS, Tifton, GA Jeff Arnold ARS Temple, TX and Peter Allen Baylor University, TX SEWRU Objectives 1. Project changes
Combining Deterministic and Probabilistic Methods to Produce Gridded Climatologies
 Combining Deterministic and Probabilistic Methods to Produce Gridded Climatologies Michael Squires Alan McNab National Climatic Data Center (NCDC - NOAA) Asheville, NC Abstract There are nearly 8,000 sites
Variability and trends in daily minimum and maximum temperatures and in diurnal temperature range in Lithuania, Latvia and Estonia
 Variability and trends in daily minimum and maximum temperatures and in diurnal temperature range in Lithuania, Latvia and Estonia Jaak Jaagus Dept. of Geography, University of Tartu Agrita Briede Dept.
Climate Change Impact Assessment on Long Term Water Budget for Maitland Catchment in Southern Ontario
 215 SWAT CONFERENCE, PURDUE Climate Change Impact Assessment on Long Term Water Budget for Maitland Catchment in Southern Ontario By Vinod Chilkoti Aakash Bagchi Tirupati Bolisetti Ram Balachandar Contents
Climatography of the United States No
 Month (1) Min (2) Month(1) Extremes Lowest (2) Temperature ( F) Lowest Month(1) Degree s (1) Base Temp 65 Heating Cooling 100 Number of s (3) Jan 63.9 39.3 51.6 86 1976 16 56.6 1986 20 1976 2 47.5 1973
Climatography of the United States No
 Temperature ( F) Month (1) Min (2) Month(1) Extremes Lowest (2) Lowest Month(1) Degree s (1) Base Temp 65 Heating Cooling 100 Number of s (3) Jan 32.8 21.7 27.3 62 1918 1 35.8 1983-24 1950 29 10.5 1979
Past and future climate development in Longyearbyen, Svalbard
 Past and future climate development in Longyearbyen, Svalbard Eirik J. Førland 1,2 and Ketil Isaksen 1 1). Norwegian Meteorological Institute 2). Norwegian Centre for Climate Services Svalbard Science
Country Presentation-Nepal
 Country Presentation-Nepal Mt.Everest, Shiva Pd. Nepal, DHM South Asia Drought Monitor Workshop Dhaka Bangladesh 2 th April 215 Overview Brief Climatology Climate activities- DHM PPCR (Pilot Program for
Climatography of the United States No
 Climate Division: CA 4 NWS Call Sign: Month (1) Min (2) Month(1) Extremes Lowest (2) Temperature ( F) Lowest Month(1) Degree s (1) Base Temp 65 Heating Cooling 100 Number of s (3) Jan 55.6 39.3 47.5 77
Climatography of the United States No
 Climate Division: CA 5 NWS Call Sign: Month (1) Min (2) Month(1) Extremes Lowest (2) Temperature ( F) Lowest Month(1) Degree s (1) Base Temp 65 Heating Cooling 100 Number of s (3) Jan 56.6 36.5 46.6 81
Climatography of the United States No
 Climate Division: CA 1 NWS Call Sign: Month (1) Min (2) Month(1) Extremes Lowest (2) Temperature ( F) Lowest Month(1) Degree s (1) Base Temp 65 Heating Cooling 100 Number of s (3) Jan 57.9 38.9 48.4 85
Climatography of the United States No
 Climate Division: CA 5 NWS Call Sign: Month (1) Min (2) Month(1) Extremes Lowest (2) Temperature ( F) Lowest Month(1) Degree s (1) Base Temp 65 Heating Cooling 100 Number of s (3) Jan 44.8 25.4 35.1 72
Climatography of the United States No
 Climate Division: CA 4 NWS Call Sign: Month (1) Min (2) Month(1) Extremes Lowest (2) Temperature ( F) Lowest Month(1) Degree s (1) Base Temp 65 Heating Cooling 100 Number of s (3) Jan 49.4 37.5 43.5 73
Climatography of the United States No
 Climate Division: CA 6 NWS Call Sign: Month (1) Min (2) Month(1) Extremes Lowest (2) Temperature ( F) Lowest Month(1) Degree s (1) Base Temp 65 Heating Cooling 100 Number of s (3) Jan 69.4 46.6 58.0 92
Climatography of the United States No
 Climate Division: CA 4 NWS Call Sign: Month (1) Min (2) Month(1) Extremes Lowest (2) Temperature ( F) Lowest Month(1) Degree s (1) Base Temp 65 Heating Cooling 1 Number of s (3) Jan 58.5 38.8 48.7 79 1962
Climatography of the United States No
 Climate Division: CA 6 NWS Call Sign: Month (1) Min (2) Month(1) Extremes Lowest (2) Temperature ( F) Lowest Month(1) Degree s (1) Base Temp 65 Heating Cooling 1 Number of s (3) Jan 67.5 42. 54.8 92 1971
Climatography of the United States No
 Climate Division: CA 1 NWS Call Sign: Month (1) Min (2) Month(1) Extremes Lowest (2) Temperature ( F) Lowest Month(1) Degree s (1) Base Temp 65 Heating Cooling 1 Number of s (3) Jan 57.8 39.5 48.7 85 1962
Climatography of the United States No
 Climate Division: ND 8 NWS Call Sign: BIS Month (1) Min (2) Month(1) Extremes Lowest (2) Temperature ( F) Lowest Month(1) Degree s (1) Base Temp 65 Heating Cooling 100 Number of s (3) Jan 21.1 -.6 10.2
Climatography of the United States No
 Climate Division: TN 1 NWS Call Sign: Month (1) Min (2) Month(1) Extremes Lowest (2) Temperature ( F) Lowest Month(1) Degree s (1) Base Temp 65 Heating Cooling 100 Number of s (3) Jan 47.6 24.9 36.3 81
Climatography of the United States No
 Climate Division: CA 5 NWS Call Sign: FAT Month (1) Min (2) Month(1) Extremes Lowest (2) Temperature ( F) Lowest Month(1) Degree s (1) Base Temp 65 Heating Cooling 1 Number of s (3) Jan 53.6 38.4 46. 78
Climatography of the United States No
 Climate Division: CA 6 NWS Call Sign: 1L2 N Lon: 118 3W Month (1) Min (2) Month(1) Extremes Lowest (2) Temperature ( F) Lowest Month(1) Degree s (1) Base Temp 65 Heating Cooling 1 Number of s (3) Jan 63.7
Impacts of climate change on flooding in the river Meuse
 Impacts of climate change on flooding in the river Meuse Martijn Booij University of Twente,, The Netherlands m.j.booij booij@utwente.nlnl 2003 in the Meuse basin Model appropriateness Appropriate model
Climatography of the United States No
 Climate Division: CA 5 NWS Call Sign: BFL Month (1) Min (2) Month(1) Extremes Lowest (2) Temperature ( F) Lowest Month(1) Degree s (1) Base Temp 65 Heating Cooling 1 Number of s (3) Jan 56.3 39.3 47.8
Applications/Users for Improved S2S Forecasts
 Applications/Users for Improved S2S Forecasts Nolan Doesken Colorado Climate Center Colorado State University WSWC Precipitation Forecasting Workshop June 7-9, 2016 San Diego, CA First -- A short background
Seasonal Climate Watch April to August 2018
 Seasonal Climate Watch April to August 2018 Date issued: Mar 23, 2018 1. Overview The El Niño-Southern Oscillation (ENSO) is expected to weaken from a moderate La Niña phase to a neutral phase through
Fig.3.1 Dispersion of an isolated source at 45N using propagating zonal harmonics. The wave speeds are derived from a multiyear 500 mb height daily
 Fig.3.1 Dispersion of an isolated source at 45N using propagating zonal harmonics. The wave speeds are derived from a multiyear 500 mb height daily data set in January. The four panels show the result
Climatography of the United States No
 Climate Division: TN 3 NWS Call Sign: BNA Month (1) Min (2) Month(1) Extremes Lowest (2) Temperature ( F) Lowest Month(1) Degree s (1) Base Temp 65 Heating Cooling 100 Number of s (3) Jan 45.6 27.9 36.8
Regional climate-change downscaling for hydrological applications using a nonhomogeneous hidden Markov model
 Regional climate-change downscaling for hydrological applications using a nonhomogeneous hidden Markov model Water for a Healthy Country Flagship Steve Charles IRI Seminar, September 3, 21 Talk outline
Climatography of the United States No
 Month (1) Min (2) Month(1) Extremes Lowest (2) Temperature ( F) Lowest Month(1) Degree s (1) Base Temp 65 Heating Cooling 100 Number of s (3) 42.6 24.2 33.4 79 1950 25 44.2 1974-16 1994 19 18.8 1977 977
Climatography of the United States No
 No. 2 1971-2 Asheville, North Carolina 2881 COOP ID: 46646 Climate Division: CA 4 NWS Call Sign: 8W Month (1) Min (2) Month(1) Extremes Lowest (2) Temperature ( F) Lowest Month(1) Degree s (1) Base Temp
Climatography of the United States No
 No. 2 1971-2 Asheville, North Carolina 2881 COOP ID: 4792 Climate Division: CA 6 NWS Call Sign: Month (1) Min (2) Month(1) Extremes Lowest (2) Temperature ( F) Lowest Month(1) Degree s (1) Base Temp 65
Climatography of the United States No
 Month (1) Min (2) Month(1) Extremes Lowest (2) Temperature ( F) Lowest Month(1) Degree s (1) Base Temp 65 Heating Cooling 100 Number of s (3) Jan 54.3 40.1 47.2 75 1998 17 53.0 1995 18 1949 11 41.7 1972
COUNTRY REPORT. Jakarta. July, th National Directorate of Meteorology and Geophysics of Timor-Leste (DNMG)
") The Southeastern Asia-Oceania Flash Flood COUNTRY REPORT Jakarta. July, 10-12 th 2017 National Directorate of Meteorology and Geophysics of Timor-Leste (DNMG) Carla Feritas and Crisostimo Lobato Democratic
The Southeastern Asia-Oceania Flash Flood COUNTRY REPORT Jakarta. July, 10-12 th 2017 National Directorate of Meteorology and Geophysics of Timor-Leste (DNMG) Carla Feritas and Crisostimo Lobato Democratic
Technical note on seasonal adjustment for M0
 Technical note on seasonal adjustment for M0 July 1, 2013 Contents 1 M0 2 2 Steps in the seasonal adjustment procedure 3 2.1 Pre-adjustment analysis............................... 3 2.2 Seasonal adjustment.................................
Champaign-Urbana 2000 Annual Weather Summary
 Champaign-Urbana 2000 Annual Weather Summary ILLINOIS STATE WATER SURVEY 2204 Griffith Dr. Champaign, IL 61820 wxobsrvr@sws.uiuc.edu Maria Peters, Weather Observer January: January started on a mild note,
Climatography of the United States No
 Climate Division: CA 6 NWS Call Sign: Month (1) Min (2) Month(1) Extremes Lowest (2) Temperature ( F) Lowest Month(1) Degree s (1) Base Temp 65 Heating Cooling 100 Number of s (3) Jan 51.5 35.0 43.3 80
Climatography of the United States No
 Climate Division: CA 5 NWS Call Sign: Month (1) Min (2) Month(1) Extremes Lowest (2) Temperature ( F) Lowest Month(1) Degree s (1) Base Temp 65 Heating Cooling 100 Number of s (3) 59.3 31.5 45.4 80 1976
Climatography of the United States No
 Climate Division: CA 7 NWS Call Sign: Month (1) Min (2) Month(1) Extremes Lowest (2) Temperature ( F) Lowest Month(1) Degree s (1) Base Temp 65 Heating Cooling 100 Number of s (3) 44.5 29.3 36.9 69 1951
Climatography of the United States No
 Climate Division: CA 2 NWS Call Sign: Month (1) Min (2) Month(1) Extremes Lowest (2) Temperature ( F) Lowest Month(1) Degree s (1) Base Temp 65 Heating Cooling 100 Number of s (3) 53.3 37.1 45.2 77 1962
Climatography of the United States No
 Climate Division: CA 2 NWS Call Sign: Month (1) Min (2) Month(1) Extremes Lowest (2) Temperature ( F) Lowest Month(1) Degree s (1) Base Temp 65 Heating Cooling 100 Number of s (3) 53.3 31.8 42.6 74+ 1975
Climatography of the United States No
 Climate Division: CA 2 NWS Call Sign: Month (1) Min (2) Month(1) Extremes Lowest (2) Temperature ( F) Lowest Month(1) Degree s (1) Base Temp 65 Heating Cooling 100 Number of s (3) 53.7 32.7 43.2 79 1962
Climatography of the United States No
 Climate Division: CA 6 NWS Call Sign: Month (1) Min (2) Month(1) Extremes Lowest (2) Temperature ( F) Lowest Month(1) Degree s (1) Base Temp 65 Heating Cooling 100 Number of s (3) 68.5 45.7 57.1 90 1971
Climatography of the United States No
 No. 2 1971-2 Asheville, North Carolina 2881 COOP ID: 43417 Climate Division: CA 4 NWS Call Sign: N Lon: 121 Month (1) Min (2) Month(1) Extremes Lowest (2) Temperature ( F) Lowest Month(1) Degree s (1)
Climatography of the United States No
 Climate Division: CA 7 NWS Call Sign: Month (1) Min (2) Month(1) Extremes Lowest (2) Temperature ( F) Lowest Month(1) Degree s (1) Base Temp 65 Heating Cooling 100 Number of s (3) 56.0 35.7 45.9 83 1975
Climatography of the United States No
 Climate Division: CA 7 NWS Call Sign: Month (1) Min (2) Month(1) Extremes Lowest (2) Temperature ( F) Lowest Month(1) Degree s (1) Base Temp 65 Heating Cooling 1 Number of s (3) 64.8 45.4 55.1 85 1971
Climatography of the United States No
 Climate Division: CA 7 NWS Call Sign: Month (1) Min (2) Month(1) Extremes Lowest (2) Temperature ( F) Lowest Month(1) Degree s (1) Base Temp 65 Heating Cooling 1 Number of s (3) 65.5 38.7 52.1 87 1962
Climatography of the United States No
 Climate Division: CA 7 NWS Call Sign: Month (1) Min (2) Month(1) Extremes Lowest (2) Temperature ( F) Lowest Month(1) Degree s (1) Base Temp 65 Heating Cooling 100 Number of s (3) 58.8 34.3 46.6 81+ 1948
Climatography of the United States No
 Climate Division: CA 7 NWS Call Sign: Month (1) Min (2) Month(1) Extremes Lowest (2) Temperature ( F) Lowest Month(1) Degree s (1) Base Temp 65 Heating Cooling 100 Number of s (3) 70.4 44.2 57.3 95 1971
METreport Climate indicators for Norwegian travel behaviour; - in present and future climate
 METreport No. 2/2018 ISSN 2387-4201 Climate Climate indicators for Norwegian travel behaviour; - in present and future climate Anne Solveig H. Andersen Eirik J. Førland Hans Olav Hygen Jostein Mamen METreport
Climatography of the United States No
 Climate Division: CA 1 NWS Call Sign: Month (1) Min (2) Month(1) Extremes Lowest (2) Temperature ( F) Lowest Month(1) Degree s (1) Base Temp 65 Heating Cooling 100 Number of s (3) Jan 52.4 35.4 43.9 69
Sierra Weather and Climate Update
 Sierra Weather and Climate Update 2014-15 Kelly Redmond Western Regional Climate Center Desert Research Institute Reno Nevada Yosemite Hydroclimate Workshop Yosemite Valley, 2015 October 8-9 Percent of
Climatography of the United States No
 Climate Division: CA 4 NWS Call Sign: Month (1) Min (2) Month(1) Extremes Lowest (2) Temperature ( F) Lowest Month(1) Degree s (1) Base Temp 65 Heating Cooling 100 Number of s (3) Jan 61.9 42.0 52.0 89
Climatography of the United States No
 Climate Division: CA 2 NWS Call Sign: Month (1) Min (2) Month(1) Extremes Lowest (2) Temperature ( F) Lowest Month(1) Degree s (1) Base Temp 65 Heating Cooling 100 Number of s (3) Jan 55.6 38.8 47.2 81
Climatography of the United States No
 Climate Division: CA 2 NWS Call Sign: Month (1) Min (2) Month(1) Extremes Lowest (2) Temperature ( F) Lowest Month(1) Degree s (1) Base Temp 65 Heating Cooling 100 Number of s (3) Jan 53.5 37.6 45.6 78
Climatography of the United States No
 Climate Division: CA 6 NWS Call Sign: Month (1) Min (2) Month(1) Extremes Lowest (2) Temperature ( F) Lowest Month(1) Degree s (1) Base Temp 65 Heating Cooling 100 Number of s (3) Jan 66.1 38.3 52.2 91
Climatography of the United States No
 Climate Division: CA 1 NWS Call Sign: Month (1) Min (2) Month(1) Extremes Lowest (2) Temperature ( F) Lowest Month(1) Degree s (1) Base Temp 65 Heating Cooling 1 Number of s (3) Jan 56.2 4.7 48.5 79 1962
Climatography of the United States No
 Climate Division: CA 1 NWS Call Sign: Month (1) Min (2) Month(1) Extremes Lowest (2) Temperature ( F) Lowest Month(1) Degree s (1) Base Temp 65 Heating Cooling 100 Number of s (3) Jan 50.2 31.2 40.7 65+
Climatography of the United States No
 Climate Division: CA 4 NWS Call Sign: Month (1) Min (2) Month(1) Extremes Lowest (2) Temperature ( F) Lowest Month(1) Degree s (1) Base Temp 65 Heating Cooling 100 Number of s (3) Jan 61.4 33.1 47.3 82+
Climatography of the United States No
 No. 2 1971-2 Asheville, North Carolina 2881 COOP ID: 4795 Climate Division: CA 6 NWS Call Sign: SBA Month (1) Min (2) Month(1) Extremes Lowest (2) Temperature ( F) Lowest Month(1) Degree s (1) Base Temp
Climatography of the United States No
 Climate Division: CA 7 NWS Call Sign: Month (1) Min (2) Month(1) Extremes Lowest (2) Temperature ( F) Lowest Month(1) Degree s (1) Base Temp 65 Heating Cooling 100 Number of s (3) Jan 54.4 36.9 45.7 77+
Climatography of the United States No
 Climate Division: CA 4 NWS Call Sign: Month (1) Min (2) Month(1) Extremes Lowest (2) Temperature ( F) Lowest Month(1) Degree s (1) Base Temp 65 Heating Cooling 100 Number of s (3) Jan 56.4 43.6 50.0 77
APPENDIX G-7 METEROLOGICAL DATA
 APPENDIX G-7 METEROLOGICAL DATA METEOROLOGICAL DATA FOR AIR AND NOISE SAMPLING DAYS AT MMR Monthly Normals and Extremes for Honolulu International Airport Table G7-1 MMR RAWS Station Hourly Data Tables
TEMPERATURE AND PRECIPITATION CHANGES IN TÂRGU- MURES (ROMANIA) FROM PERIOD
 FROM PERIOD") TEMPERATURE AND PRECIPITATION CHANGES IN TÂRGU- MURES (ROMANIA) FROM PERIOD 1951-2010 O.RUSZ 1 ABSTRACT. Temperature and precipitation changes in Târgu Mures (Romania) from period 1951-2010. The analysis
TEMPERATURE AND PRECIPITATION CHANGES IN TÂRGU- MURES (ROMANIA) FROM PERIOD 1951-2010 O.RUSZ 1 ABSTRACT. Temperature and precipitation changes in Târgu Mures (Romania) from period 1951-2010. The analysis
Supplementary appendix
 Supplementary appendix This appendix formed part of the original submission and has been peer reviewed. We post it as supplied by the authors. Supplement to: Lowe R, Stewart-Ibarra AM, Petrova D, et al.
Climatography of the United States No
 Climate Division: SC 7 NWS Call Sign: CHS Month (1) Min (2) Month(1) Extremes Lowest (2) Temperature ( F) Lowest Month(1) Degree s (1) Base Temp 65 Heating Cooling 100 Number of s (3) Jan 58.9 36.9 47.9
Funding provided by NOAA Sectoral Applications Research Project CLIMATE. Basic Climatology Colorado Climate Center
 Funding provided by NOAA Sectoral Applications Research Project CLIMATE Basic Climatology Colorado Climate Center Remember These? Factor 1: Our Energy Source Factor 2: Revolution & Tilt Factor 3: Rotation!
WHEN IS IT EVER GOING TO RAIN? Table of Average Annual Rainfall and Rainfall For Selected Arizona Cities
 WHEN IS IT EVER GOING TO RAIN? Table of Average Annual Rainfall and 2001-2002 Rainfall For Selected Arizona Cities Phoenix Tucson Flagstaff Avg. 2001-2002 Avg. 2001-2002 Avg. 2001-2002 October 0.7 0.0
The Climate of Oregon Climate Zone 4 Northern Cascades
 /05 E55 Unbound issue No. 9/ is Does not circulate Special Report 916 May 1993 The Climate of Oregon Climate Zone 4 Property of OREGON STATE UNIVERSITY Library Serials Corvallis, OR 97331-4503 Agricultural
GPC Exeter forecast for winter Crown copyright Met Office
 GPC Exeter forecast for winter 2015-2016 Global Seasonal Forecast System version 5 (GloSea5) ensemble prediction system the source for Met Office monthly and seasonal forecasts uses a coupled model (atmosphere
Seasonal Climate Watch July to November 2018
 Seasonal Climate Watch July to November 2018 Date issued: Jun 25, 2018 1. Overview The El Niño-Southern Oscillation (ENSO) is now in a neutral phase and is expected to rise towards an El Niño phase through
At the start of the talk will be a trivia question. Be prepared to write your answer.
 Operational hydrometeorological forecasting activities of the Australian Bureau of Meteorology Thomas Pagano At the start of the talk will be a trivia question. Be prepared to write your answer. http://scottbridle.com/
The Climate of Marshall County
 The Climate of Marshall County Marshall County is part of the Crosstimbers. This region is a transition region from the Central Great Plains to the more irregular terrain of southeastern Oklahoma. Average
Some details about the theoretical background of CarpatClim DanubeClim gridded databases and their practical consequences
 Some details about the theoretical background of CarpatClim DanubeClim gridded databases and their practical consequences Zita Bihari, Tamás Szentimrey, Andrea Kircsi Hungarian Meteorological Service Outline
Evaluation of senorge2, a conventional climatological datasets for snow- and hydrological modeling in Norway
 Earth Syst. Sci. Discuss., https://doi.org/10.5194/essd-2017-64 Manuscript under review for journal Earth Syst. Sci. Evaluation of senorge2, a conventional climatological datasets for snow- and hydrological
Adjustment of dynamically downscaled temperature and precipitation data in Norway
 RegClim: Regional Climate Development Under Global Warming Adjustment of dynamically downscaled temperature and precipitation data in Norway Report 20/02 T. E. Skaugen, I. Hanssen-Bauer and E. J. Førland
BAYESIAN PROCESSOR OF OUTPUT FOR PROBABILISTIC FORECASTING OF PRECIPITATION OCCURRENCE. Coire J. Maranzano. Department of Systems Engineering
 BAYESIAN PROCESSOR OF OUTPUT FOR PROBABILISTIC FORECASTING OF PRECIPITATION OCCURRENCE By Coire J. Maranzano Department of Systems Engineering University of Virginia P.O. Box 400747 Charlottesville, VA
Champaign-Urbana 2001 Annual Weather Summary
 Champaign-Urbana 2001 Annual Weather Summary ILLINOIS STATE WATER SURVEY 2204 Griffith Dr. Champaign, IL 61820 wxobsrvr@sws.uiuc.edu Maria Peters, Weather Observer January: After a cold and snowy December,