Characterization of the solar irradiation field for the Trentino region in the Alps
|
|
|
- Elizabeth Morrison
- 5 years ago
- Views:
Transcription
1 Characterization of the solar irradiation field for the Trentino region in the Alps L. Laiti*, L. Giovannini and D. Zardi Atmospheric Physics Group University of Trento - Italy
2 outline of the talk Introduction The Solar Atlas of Trentino The radiometric network of Trentino Quality control of radiation data Homogeneity analysis of radiation data The gap-filling procedure The selected dataset Clear-sky radiation estimate All-sky radiation mapping Results clear-sky index maps Results radiation maps Comparison with available datasets Conclusions
3 introduction Characterization of the solar irradiation field for the Trentino region in the Alps Onset time, duration, speed and depth of thermally-driven wind systems and associated ABL structures and evolution depend on the (local) surface energy budget, i.e. on: solar irradiation terrain shape (orientation, slope, height, shadowing) ground cover land use soil moisture
4 introduction Characterization of the solar irradiation field for the Trentino region in the Alps Onset time, duration, speed and depth of thermally-driven wind systems and associated ABL structures and evolution depend on the (local) surface energy budget, i.e. on: solar irradiation terrain shape (orientation, slope, height, shadowing) ground cover land use soil moisture astronomical + orographic + atmospheric factors
 symmetric insolation symmetric slope winds + valley wind simultaneous morning/evening")
5 introduction Characterization of the solar irradiation field for the Trentino region in the Alps conceptual model of Defant (1949) symmetric insolation symmetric slope winds + valley wind simultaneous morning/evening transitions


: cross-valley")
6 introduction Characterization of the solar irradiation field for the Trentino region in the Alps real valleys: asymmetric insolation, irregular valley shapes, asymmetric slope winds and cross-valley winds modified transition times Hennemuth and Schmidt (1985): cross-valley winds in the Dischma Valley
7 introduction Characterization of the solar irradiation field for the Trentino region in the Alps Whiteman et al. (1989): Brush Creek Valley (ASCOT program, 1984) strong spatial/temporal variability of solar irradiation on fair-weather days direct radiation dominates (orientation, shadows, slope) cross-valley winds are observed Matzinger et al. (2003): Riviera Valley (Mesoscale Alpine Programme, 1999) relevant site-to-site differences in global irradiation valley-floor vs. ridge-top contrasts and contrasts between opposite slopes are largest on valley wind days on overcast days solar irradiation variability is strongly reduced direct radiation dominates (orientation, shadows, slope)
: modeling of the morning break-up of the nocturnal SBL in an idealized valley orographic shadowing may modify significantly the timing of the inversion break-up Rotach and Zardi (2007): in")
8 introduction Characterization of the solar irradiation field for the Trentino region in the Alps Colette et al. (2003): modeling of the morning break-up of the nocturnal SBL in an idealized valley orographic shadowing may modify significantly the timing of the inversion break-up Rotach and Zardi (2007): in complex terrain sensible heat flux and global irradiation spatial variability are strictly associated
9 introduction Characterization of the solar irradiation field for the Trentino region in the Alps Leukauf et al. (2014): influence of the incoming solar radiation on the ABL of an idealized valley by means of LES with WRF model with increasing solar forcing the depth of the slope wind layer grows, the nocturnal inversion is dissolved earlier and only one double circulation cell for weak solar forcing additional cross circulation patterns appear and the vertical export of heat, moisture and momentum is reduced
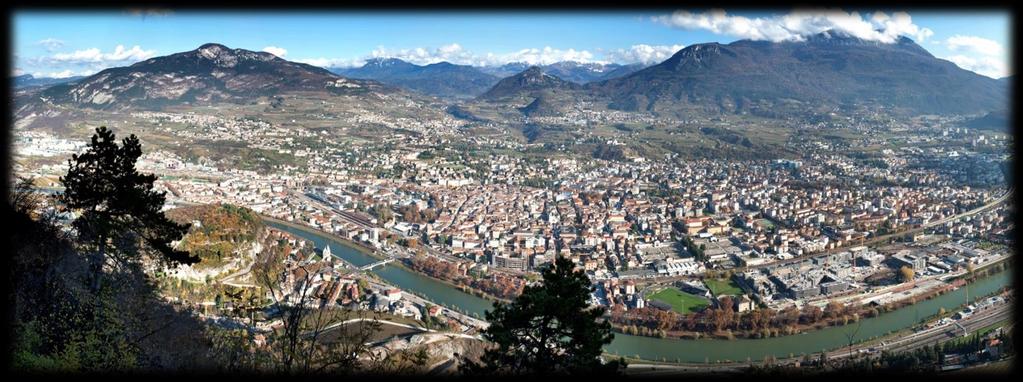
10 introduction Characterization of the solar irradiation field for the Trentino region in the Alps the spatial and temporal distribution of solar irradiation is a key factor in the determination of the characteristics of thermally-driven winds and associated ABL structures this talk presents a characterization of the climatological spatial distribution of the solar irradiation field for the Trentino region in the Italian Alps, i.e. the Solar Atlas of Trentino
 Currently available datasets: uncertain in mountainous areas (e.g. PVGIS over the Alps, cf. Huld et al.")
11 the Solar Atlas of Trentino Project: Climate Atlas of Trentino (Trentino Climate Observatory Autonomous Province of Trento) Applications: meteorology, climatology, hydrology, agriculture energy sector (PV systems, energy-efficient buildings etc.) Currently available datasets: uncertain in mountainous areas (e.g. PVGIS over the Alps, cf. Huld et al. 2012)
12 the Solar Atlas of Trentino Project: Climate Atlas of Trentino (Trentino Climate Observatory Autonomous Province of Trento) Applications: meteorology, climatology, hydrology, agriculture energy sector (PV systems, energy-efficient buildings etc.) Currently available datasets: uncertain in mountainous areas (e.g. PVGIS over the Alps, cf. Huld et al. 2012) insufficient resolution for complex terrain regions (1-2 km) based on sparse local ground observations
13 the Solar Atlas of Trentino Requirements: accuracy of database and results high-spatial resolution (modeling of orographic effects) Methodology: clear-sky radiation model digital terrain model (DTM) maximum irradiation estimate hourly data of horizontal global irradiation from local stations maps of monthly and annual mean horizontal global irradiation missing data estimate all-sky irradiation estimate satellite data DTM interpolation
14 the radiometric network of Trentino 104 active stations Meteotrentino (26) E. Mach Foundation (77) Trento University (1) 10 min 15 min 1 h global irradiation data starting from 1987 Courtesy of D. Andreis and F. Zottele
15 the radiometric network of Trentino spatial and temporal coverage of the database
16 quality control of radiation data after Journée and Bertrand (2011): physical thresholds (ESRA clear-sky radiation model; Rigollier et al. 2002) step test temporal persistence test spatial consistency test Each hourly record: error code and quality code night-time zero offset (-20 to 5 W m -2 )
17 quality control of radiation data after Journée and Bertrand (2011): physical thresholds (ESRA clear-sky radiation model; Rigollier et al. 2002) step test temporal persistence test spatial consistency test Each hourly record: error code and quality code shading by a tree, a building,
18 quality control of radiation data after Journée and Bertrand (2011): physical thresholds (ESRA clear-sky radiation model; Rigollier et al. 2002) step test temporal persistence test spatial consistency test Each hourly record: error code and quality code pyranometer s dome covered with snow
 step test temporal persistence test spatial consistency test Each hourly record: error code and quality code spatial consistency test")
19 quality control of radiation data after Journée and Bertrand (2011): physical thresholds (ESRA clear-sky radiation model; Rigollier et al. 2002) step test temporal persistence test spatial consistency test Each hourly record: error code and quality code spatial consistency test failure
: based on observed-to-estimated irradiation ratio during peak hours of clear-sky days ESRA clear-sky radiation")
20 homogeneity analysis of radiation data after Longman et al. (2013): based on observed-to-estimated irradiation ratio during peak hours of clear-sky days ESRA clear-sky radiation model (Rigollier et al. 2002) homogenization of inhomogeneous series
21 the gap-filling procedure HelioMont satellite dataset (years: , Δx = 2 km, Δt = 15 min; Stöckli 2013) monthly linear regressions of daily irradiation data error: 3-15% (cross-validation)

22 the selected dataset 25 stations period monthly mean daily irradiation
23 clear-sky radiation estimate Modeling of clear-sky daily irradiation (= maximum irradiation) GRASS GIS r.sun module (astronomical + orographic effects; Hofierka and Suri, 2002) Input data: DTM (Δx = 200 m) 12 monthly maps of Linke turbidity factor (from observations, after Polo et al. 2009) 12 monthly maps of albedo (from WRF simulations, Δx = 2 km) Output maps: 365 daily maps of global, direct, diffuse clear-sky irradiation (Δx = 200 m) 12 monthly maps of mean global, direct, diffuse clear-sky irradiation (Δx = 200 m) 1 annual map of mean global, direct, diffuse clear-sky irradiation (Δx = 200 m)
24 clear-sky radiation estimate Monthly mean daily clear-sky irradiation JAN FEB MAR APR MAY JUN
25 all-sky radiation mapping Calculation of monthly mean clear-sky index (K c ) selected stations K c = G G c
26 all-sky radiation mapping Mapping of monthly mean K c over the Trentino region: interpolation method? Inverse Squared Distance (ISD) Ordinary Kriging (OK; Goovaerts 1997) Residual Kriging with linear drift with height (RK; Odeh et al. 1994, 1995) Cross-validation results ass(mbe) MAE RMSE ISD OK RK ISD OK RK ISD OK RK JAN 1.42E E E E E E E E E-02 FEB 2.92E E E E E E E E E-02 MAR 9.91E E E E E E E E E-02 APR 3.72E E E E E E E E E-02 MAY 8.28E E E E E E E E E-02 JUN 9.94E E E E E E E E E-02 JUL 1.08E E E E E E E E E-02 AUG 7.18E E E E E E E E E-02 SEP 5.55E E E E E E E E E-02 OCT 2.36E E E E E E E E E-02 NOV 1.55E E E E E E E E E-02 DEC 1.35E E E E E E E E E-02
27 all-sky radiation mapping Mapping of monthly mean K c over the Trentino region: interpolation method? Inverse Squared Distance (ISD) Ordinary Kriging (OK; Goovaerts 1997) Residual Kriging with linear drift with height (RK; Odeh et al. 1994, 1995) Cross-validation results ass(mbe) MAE RMSE ISD OK RK ISD OK RK ISD OK RK JAN 1.42E E E E E E E E E-02 FEB 2.92E E E E E E E E E-02 MAR 9.91E E E E E E E E E-02 APR 3.72E E E E E E E E E-02 MAY 8.28E E E E E E E E E-02 JUN 9.94E E E E E E E E E-02 JUL 1.08E E E E E E E E E-02 AUG 7.18E E E E E E E E E-02 SEP 5.55E E E E E E E E E-02 OCT 2.36E E E E E E E E E-02 NOV 1.55E E E E E E E E E-02 DEC 1.35E E E E E E E E E-02
28 all-sky radiation mapping RK with linear drift with height: estimate of interpolation accuracy through cross-validation analysis Kc error G error (MJ m -2 ) G error (%) month MBE MAE RMSE MBE MAE RMSE MBE MAE RMSE JAN -1.72E E E FEB 2.16E E E MAR -1.37E E E APR 3.16E E E MAY -4.74E E E JUN -1.13E E E JUL -1.87E E E AUG -8.16E E E SEP -5.10E E E OCT -1.82E E E NOV -1.65E E E DEC -4.00E E E Annual mean -5.93E E E
29 results - clear-sky index maps Monthly mean daily clear-sky index JAN FEB MAR APR MAY JUN
30 results - clear-sky index maps Monthly mean daily clear-sky index JUL AUG SEP OCT NOV DEC
31 results - radiation maps Monthly mean daily irradiation (MJ m -2 ) JAN FEB MAR APR MAY JUN
32 results - radiation maps Monthly mean daily irradiation (MJ m -2 ) JUL AUG SEP OCT NOV DEC
33 results - radiation maps Mean annual irradiation (MJ m -2 )
34 comparison with available datasets Mean annual irradiation 1) PVGIS classic Δx = 1 km (Suri et al. 2007) 2) PVGIS CMSAF Δx 2 km (Huld et al. 2012) 3) HelioMont Δx 2 km (Stöckli 2012) PVGIS classic PVGIS CMSAF HelioMont MJ m -2
 2) PVGIS CMSAF 1998-2011 Δx 2 km (Huld et al.")
35 comparison with available datasets Mean annual irradiation 1) PVGIS classic Δx = 1 km (Suri et al. 2007) 2) PVGIS CMSAF Δx 2 km (Huld et al. 2012) 3) HelioMont Δx 2 km (Stöckli 2012) PVGIS CMSAF PVGIS classic (%) HelioMont differences in absolute values: -30% to +30% MJ m -2
 2) PVGIS CMSAF 1998-2011 Δx 2 km (Huld et al.")

36 comparison with available datasets Mean annual irradiation 1) PVGIS classic Δx = 1 km (Suri et al. 2007) 2) PVGIS CMSAF Δx 2 km (Huld et al. 2012) 3) HelioMont Δx 2 km (Stöckli 2012) PVGIS classic PVGIS CMSAF HelioMont differences in absolute values: -30% to +30% very different spatial distributions ground-data weaknesses vs. satellite-data weaknesses HelioMont: specifically developed for complex terrain and bright surfaces MJ m -2
 3) HelioMont 2004-2012 Δx 2 km (Stöckli 2012) TSA PVGIS classic (%) TSA PVGIS CMSAF (%) TSA HelioMont (%) TSA PVGIS classic TSA PVGIS CMSAF TSA HelioMont MBE (MJ m -2 ) -266.44-317.04-460.")
37 comparison with available datasets Mean annual irradiation 1) PVGIS classic Δx = 1 km (Suri et al. 2007) 2) PVGIS CMSAF Δx 2 km (Huld et al. 2012) 3) HelioMont Δx 2 km (Stöckli 2012) TSA PVGIS classic (%) TSA PVGIS CMSAF (%) TSA HelioMont (%) TSA PVGIS classic TSA PVGIS CMSAF TSA HelioMont MBE (MJ m -2 ) rmbe (%) MAE (MJ m -2 ) rmae (%)
38 comparison with available datasets Mean annual irradiation 1) PVGIS classic Δx = 1 km (Suri et al. 2007) 2) PVGIS CMSAF Δx 2 km (Huld et al. 2012) 3) HelioMont Δx 2 km (Stöckli 2012) TSA PVGIS classic (%) TSA PVGIS CMSAF (%) TSA vs. HelioMont (%) TSA PVGIS classic TSA PVGIS CMSAF TSA HelioMont MBE (MJ m -2 ) rmbe (%) MAE (MJ m -2 ) rmae (%)
 July: TSA HelioMont")
 -25.94-19.53-11.58-8.83-8.93-7.42-7.08-3.09-5.41-9.91-10.78-18.")
39 comparison with available datasets Monthly mean daily irradiation HelioMont Δx = 2 km Trentino Solar Atlas Δx = 200 m January: TSA HelioMont (%) July: TSA HelioMont (%) spatial resolution G c under orographic shadowing conditions JAN FEB MAR APR MAY JUN JUL AUG SEP OCT NOV DEC rmbe (%)
40 conclusions Characterization of the solar irradiation field for the Trentino region in the Alps Results and considerations: 12 maps of monthly mean daily global irradiation on horizontal surface (Δx = 200 m) 1 map of mean annual global irradiation on horizontal surface (Δx = 200 m) interpolation accuracy 5% (better in summer months) better accuracies at valley floors and over «flat» areas comparison with other datasets highlights slight systematic underestimate
41 conclusions Characterization of the solar irradiation field for the Trentino region in the Alps Results and considerations: 12 maps of monthly mean daily global irradiation on horizontal surface (Δx = 200 m) 1 map of mean annual global irradiation on horizontal surface (Δx = 200 m) interpolation accuracy 5% (better in summer months) better accuracies at valley floors and over «flat» areas comparison with other datasets highlights slight systematic underestimate Future developments different mapping methods (e.g. co-kriging with satellite data) application of decomposition models and separate mapping of D and B maps of monthly mean hourly global irradiation on horizontal surface maps for inclined surfaces (terrain slope and orientation, ) Test Reference Years comparison with WRF model high-resolution simulations
42 Thank you
Sunshine duration climate maps of Belgium and Luxembourg based on Meteosat and in-situ observations
 Open Sciences doi:1.5194/asr-1-15-213 Author(s) 213. CC Attribution 3. License. Advances in Science & Research Open Access Proceedings Drinking Water Engineering and Science Sunshine duration climate maps
from airborne and surface measurements
 Analysis of the thermal structure of the Ora del Garda wind from airborne and surface measurements Lavinia Laiti, Dino Zardi and Massimiliano de Franceschi Atmospheric Physics Group Department of Civil
Direct Normal Radiation from Global Radiation for Indian Stations
 RESEARCH ARTICLE OPEN ACCESS Direct Normal Radiation from Global Radiation for Indian Stations Jaideep Rohilla 1, Amit Kumar 2, Amit Tiwari 3 1(Department of Mechanical Engineering, Somany Institute of
P1.34 MULTISEASONALVALIDATION OF GOES-BASED INSOLATION ESTIMATES. Jason A. Otkin*, Martha C. Anderson*, and John R. Mecikalski #
 P1.34 MULTISEASONALVALIDATION OF GOES-BASED INSOLATION ESTIMATES Jason A. Otkin*, Martha C. Anderson*, and John R. Mecikalski # *Cooperative Institute for Meteorological Satellite Studies, University of
VALIDATION OF MSG DERIVED SURFACE INCOMING GLOBAL SHORT-WAVE RADIATION PRODUCTS OVER BELGIUM
 VALIDATION OF MSG DERIVED SURFACE INCOMING GLOBAL SHORT-WAVE RADIATION PRODUCTS OVER BELGIUM C. Bertrand 1, R. Stöckli 2, M. Journée 1 1 Royal Meteorological Institute of Belgium (RMIB), Brussels, Belgium
Creation of a 30 years-long high resolution homogenized solar radiation data set over the
 Creation of a 30 years-long high resolution homogenized solar radiation data set over the Benelux C. Bertrand in collaboration with M. Urbainand M. Journée Operational Directorate: Weather forecasting
Temporal and spatial variations in radiation and energy fluxes across Lake Taihu
 Temporal and spatial variations in radiation and energy fluxes across Lake Taihu Wang Wei YNCenter Video Conference May 10, 2012 Outline 1. Motivation 2. Hypothesis 3. Methodology 4. Preliminary results
Climatography of the United States No
 Climate Division: AK 5 NWS Call Sign: ANC Month (1) Min (2) Month(1) Extremes Lowest (2) Temperature ( F) Lowest Month(1) Degree s (1) Base Temp 65 Heating Cooling 90 Number of s (3) Jan 22.2 9.3 15.8
The Climate of Oregon Climate Zone 4 Northern Cascades
 /05 E55 Unbound issue No. 9/ is Does not circulate Special Report 916 May 1993 The Climate of Oregon Climate Zone 4 Property of OREGON STATE UNIVERSITY Library Serials Corvallis, OR 97331-4503 Agricultural
GAMINGRE 8/1/ of 7
 FYE 09/30/92 JULY 92 0.00 254,550.00 0.00 0 0 0 0 0 0 0 0 0 254,550.00 0.00 0.00 0.00 0.00 254,550.00 AUG 10,616,710.31 5,299.95 845,656.83 84,565.68 61,084.86 23,480.82 339,734.73 135,893.89 67,946.95
Exercise 6. Solar Panel Orientation EXERCISE OBJECTIVE DISCUSSION OUTLINE. Introduction to the importance of solar panel orientation DISCUSSION
 Exercise 6 Solar Panel Orientation EXERCISE OBJECTIVE When you have completed this exercise, you will understand how the solar illumination at any location on Earth varies over the course of a year. You
Gridded observation data for Climate Services
 Gridded observation data for Climate Services Ole Einar Tveito, Inger Hanssen Bauer, Eirik J. Førland and Cristian Lussana Norwegian Meteorological Institute Norwegian annual temperatures Norwegian annual
COUPLING A DISTRIBUTED HYDROLOGICAL MODEL TO REGIONAL CLIMATE MODEL OUTPUT: AN EVALUATION OF EXPERIMENTS FOR THE RHINE BASIN IN EUROPE
 P.1 COUPLING A DISTRIBUTED HYDROLOGICAL MODEL TO REGIONAL CLIMATE MODEL OUTPUT: AN EVALUATION OF EXPERIMENTS FOR THE RHINE BASIN IN EUROPE Jan Kleinn*, Christoph Frei, Joachim Gurtz, Pier Luigi Vidale,
Journal of Asian Scientific Research
 Journal of Asian Scientific Research journal homepage: http://aessweb.com/journal-detail.php?id=5003 ESTIMATION OF GLOBAL SOLAR RADIATION ON HORIZONTAL SURFACE FROM SUNSHINE HOURS AND OTHER METEOROLOGICAL
2003 Water Year Wrap-Up and Look Ahead
 2003 Water Year Wrap-Up and Look Ahead Nolan Doesken Colorado Climate Center Prepared by Odie Bliss http://ccc.atmos.colostate.edu Colorado Average Annual Precipitation Map South Platte Average Precipitation
Climatography of the United States No
 Month (1) Min (2) Month(1) Extremes Lowest (2) Temperature ( F) Lowest Month(1) Degree s (1) Base Temp 65 Heating Cooling 100 Number of s (3) Jan 63.9 39.3 51.6 86 1976 16 56.6 1986 20 1976 2 47.5 1973
Climatography of the United States No
 Temperature ( F) Month (1) Min (2) Month(1) Extremes Lowest (2) Lowest Month(1) Degree s (1) Base Temp 65 Heating Cooling 100 Number of s (3) Jan 32.8 21.7 27.3 62 1918 1 35.8 1983-24 1950 29 10.5 1979
An Empirical Method for Estimating Global Solar Radiation over Egypt S. A. Khalil, A. M. Fathy
 An Empirical Method for Estimating Global Solar Radiation over Egypt S. A. Khalil, A. M. Fathy Global solar radiation has been estimated on the basis of measurements of sunshine duration for different
Promoting Rainwater Harvesting in Caribbean Small Island Developing States Water Availability Mapping for Grenada Preliminary findings
 Promoting Rainwater Harvesting in Caribbean Small Island Developing States Water Availability Mapping for Grenada Preliminary findings National Workshop Pilot Project funded by The United Nations Environment
Climatography of the United States No
 Climate Division: CA 4 NWS Call Sign: Month (1) Min (2) Month(1) Extremes Lowest (2) Temperature ( F) Lowest Month(1) Degree s (1) Base Temp 65 Heating Cooling 100 Number of s (3) Jan 55.6 39.3 47.5 77
Climatography of the United States No
 Climate Division: CA 5 NWS Call Sign: Month (1) Min (2) Month(1) Extremes Lowest (2) Temperature ( F) Lowest Month(1) Degree s (1) Base Temp 65 Heating Cooling 100 Number of s (3) Jan 56.6 36.5 46.6 81
Climatography of the United States No
 Climate Division: CA 1 NWS Call Sign: Month (1) Min (2) Month(1) Extremes Lowest (2) Temperature ( F) Lowest Month(1) Degree s (1) Base Temp 65 Heating Cooling 100 Number of s (3) Jan 57.9 38.9 48.4 85
Climatography of the United States No
 Climate Division: CA 5 NWS Call Sign: Month (1) Min (2) Month(1) Extremes Lowest (2) Temperature ( F) Lowest Month(1) Degree s (1) Base Temp 65 Heating Cooling 100 Number of s (3) Jan 44.8 25.4 35.1 72
Climatography of the United States No
 Climate Division: CA 4 NWS Call Sign: Month (1) Min (2) Month(1) Extremes Lowest (2) Temperature ( F) Lowest Month(1) Degree s (1) Base Temp 65 Heating Cooling 100 Number of s (3) Jan 49.4 37.5 43.5 73
Climatography of the United States No
 Climate Division: CA 6 NWS Call Sign: Month (1) Min (2) Month(1) Extremes Lowest (2) Temperature ( F) Lowest Month(1) Degree s (1) Base Temp 65 Heating Cooling 100 Number of s (3) Jan 69.4 46.6 58.0 92
Climatography of the United States No
 Climate Division: CA 4 NWS Call Sign: Month (1) Min (2) Month(1) Extremes Lowest (2) Temperature ( F) Lowest Month(1) Degree s (1) Base Temp 65 Heating Cooling 1 Number of s (3) Jan 58.5 38.8 48.7 79 1962
Climatography of the United States No
 Climate Division: CA 6 NWS Call Sign: Month (1) Min (2) Month(1) Extremes Lowest (2) Temperature ( F) Lowest Month(1) Degree s (1) Base Temp 65 Heating Cooling 1 Number of s (3) Jan 67.5 42. 54.8 92 1971
Climatography of the United States No
 Climate Division: CA 1 NWS Call Sign: Month (1) Min (2) Month(1) Extremes Lowest (2) Temperature ( F) Lowest Month(1) Degree s (1) Base Temp 65 Heating Cooling 1 Number of s (3) Jan 57.8 39.5 48.7 85 1962
Met Éireann Climatological Note No. 15 Long-term rainfall averages for Ireland,
 Met Éireann Climatological Note No. 15 Long-term rainfall averages for Ireland, 1981-2010 Séamus Walsh Glasnevin Hill, Dublin 9 2016 Disclaimer Although every effort has been made to ensure the accuracy
Climatography of the United States No
 Climate Division: ND 8 NWS Call Sign: BIS Month (1) Min (2) Month(1) Extremes Lowest (2) Temperature ( F) Lowest Month(1) Degree s (1) Base Temp 65 Heating Cooling 100 Number of s (3) Jan 21.1 -.6 10.2
Climatography of the United States No
 Climate Division: TN 1 NWS Call Sign: Month (1) Min (2) Month(1) Extremes Lowest (2) Temperature ( F) Lowest Month(1) Degree s (1) Base Temp 65 Heating Cooling 100 Number of s (3) Jan 47.6 24.9 36.3 81
Climatography of the United States No
 Climate Division: CA 5 NWS Call Sign: FAT Month (1) Min (2) Month(1) Extremes Lowest (2) Temperature ( F) Lowest Month(1) Degree s (1) Base Temp 65 Heating Cooling 1 Number of s (3) Jan 53.6 38.4 46. 78
Climatography of the United States No
 Climate Division: CA 6 NWS Call Sign: 1L2 N Lon: 118 3W Month (1) Min (2) Month(1) Extremes Lowest (2) Temperature ( F) Lowest Month(1) Degree s (1) Base Temp 65 Heating Cooling 1 Number of s (3) Jan 63.7
Climatography of the United States No
 Climate Division: CA 5 NWS Call Sign: BFL Month (1) Min (2) Month(1) Extremes Lowest (2) Temperature ( F) Lowest Month(1) Degree s (1) Base Temp 65 Heating Cooling 1 Number of s (3) Jan 56.3 39.3 47.8
Characterization of the Present-Day Arctic Atmosphere in CCSM4
 Characterization of the Present-Day Arctic Atmosphere in CCSM4 Gijs de Boer 1, Bill Chapman 2, Jennifer Kay 3, Brian Medeiros 3, Matthew Shupe 4, Steve Vavrus, and John Walsh 6 (1) (2) (3) (4) ESRL ()
Climatography of the United States No
 Climate Division: TN 3 NWS Call Sign: BNA Month (1) Min (2) Month(1) Extremes Lowest (2) Temperature ( F) Lowest Month(1) Degree s (1) Base Temp 65 Heating Cooling 100 Number of s (3) Jan 45.6 27.9 36.8
Climatography of the United States No
 Climate Division: CA 5 NWS Call Sign: Elevation: 6 Feet Lat: 37 Month (1) Min (2) Month(1) Extremes Lowest (2) Temperature ( F) Lowest Month(1) Degree s (1) Base Temp 65 Heating Cooling 1 Number of s (3)
Colorado s 2003 Moisture Outlook
 Colorado s 2003 Moisture Outlook Nolan Doesken and Roger Pielke, Sr. Colorado Climate Center Prepared by Tara Green and Odie Bliss http://climate.atmos.colostate.edu How we got into this drought! Fort
Climatography of the United States No
 Climate Division: CA 4 NWS Call Sign: Elevation: 2 Feet Lat: 37 Month (1) Min (2) Month(1) Extremes Lowest (2) Temperature ( F) Lowest Month(1) Degree s (1) Base Temp 65 Heating Cooling 1 Number of s (3)
Climatography of the United States No
 Climate Division: CA 4 NWS Call Sign: Elevation: 13 Feet Lat: 36 Month (1) Min (2) Month(1) Extremes Lowest (2) Temperature ( F) Lowest Month(1) Degree s (1) Base Temp 65 Heating Cooling 1 Number of s
Climatography of the United States No
 Climate Division: CA 5 NWS Call Sign: Elevation: 1,14 Feet Lat: 36 Month (1) Min (2) Month(1) Extremes Lowest (2) Temperature ( F) Lowest Month(1) Degree s (1) Base Temp 65 Heating Cooling 1 Number of
The Climate of Payne County
 The Climate of Payne County Payne County is part of the Central Great Plains in the west, encompassing some of the best agricultural land in Oklahoma. Payne County is also part of the Crosstimbers in the
Interannual variation of MODIS NDVI in Lake Taihu and its relation to climate in submerged macrophyte region
 Yale-NUIST Center on Atmospheric Environment Interannual variation of MODIS NDVI in Lake Taihu and its relation to climate in submerged macrophyte region ZhangZhen 2015.07.10 1 Outline Introduction Data
Solar Radiation Measurements and Model Calculations at Inclined Surfaces
 Solar Radiation Measurements and Model Calculations at Inclined Surfaces Kazadzis S. 1*, Raptis I.P. 1, V. Psiloglou 1, Kazantzidis A. 2, Bais A. 3 1 Institute for Environmental Research and Sustainable
Climatography of the United States No
 Climate Division: CA 6 NWS Call Sign: LAX Elevation: 1 Feet Lat: 33 Month (1) Min (2) Month(1) Extremes Lowest (2) Temperature ( F) Lowest Month(1) Degree s (1) Base Temp 65 Heating Cooling 1 Number of
Climatography of the United States No
 Climate Division: CA 6 NWS Call Sign: TOA Elevation: 11 Feet Lat: 33 2W Temperature ( F) Month (1) Min (2) Month(1) Extremes Lowest (2) Lowest Month(1) Degree s (1) Base Temp 65 Heating Cooling 1 Number
The Climate of Seminole County
 The Climate of Seminole County Seminole County is part of the Crosstimbers. This region is a transition region from the Central Great Plains to the more irregular terrain of southeastern Oklahoma. Average
Climatography of the United States No
 Month (1) Min (2) Month(1) Extremes Lowest (2) Temperature ( F) Lowest Month(1) Degree s (1) Base Temp 65 Heating Cooling 100 Number of s (3) 42.6 24.2 33.4 79 1950 25 44.2 1974-16 1994 19 18.8 1977 977
The Climate of Oregon Climate Zone 3 Southwest Interior
 .k) 105 Unbound issue " " 1 4oes not circulate C4P. Special Report 915 May 1993 The Climate of Oregon Climate Zone 3 Southwest Interior Property of OREGON STATE UNIVERSITY Library Serials Corvallis, OR
The Climate of Marshall County
 The Climate of Marshall County Marshall County is part of the Crosstimbers. This region is a transition region from the Central Great Plains to the more irregular terrain of southeastern Oklahoma. Average
2003 Moisture Outlook
 2003 Moisture Outlook Nolan Doesken and Roger Pielke, Sr. Colorado Climate Center Prepared by Tara Green and Odie Bliss http://climate.atmos.colostate.edu Through 1999 Through 1999 Fort Collins Total Water
Climatography of the United States No
 No. 2 1971-2 Asheville, North Carolina 2881 COOP ID: 46646 Climate Division: CA 4 NWS Call Sign: 8W Month (1) Min (2) Month(1) Extremes Lowest (2) Temperature ( F) Lowest Month(1) Degree s (1) Base Temp
Climatography of the United States No
 No. 2 1971-2 Asheville, North Carolina 2881 COOP ID: 4792 Climate Division: CA 6 NWS Call Sign: Month (1) Min (2) Month(1) Extremes Lowest (2) Temperature ( F) Lowest Month(1) Degree s (1) Base Temp 65
SOLAR POWER FORECASTING BASED ON NUMERICAL WEATHER PREDICTION, SATELLITE DATA, AND POWER MEASUREMENTS
 BASED ON NUMERICAL WEATHER PREDICTION, SATELLITE DATA, AND POWER MEASUREMENTS Detlev Heinemann, Elke Lorenz Energy Meteorology Group, Institute of Physics, Oldenburg University Workshop on Forecasting,
Climatography of the United States No
 Month (1) Min (2) Month(1) Extremes Lowest (2) Temperature ( F) Lowest Month(1) Degree s (1) Base Temp 65 Heating Cooling 100 Number of s (3) Jan 54.3 40.1 47.2 75 1998 17 53.0 1995 18 1949 11 41.7 1972
Modeling of the Optimum Tilt of a Solar Collector to Receive Maximum Radiation
 Nigerian Journal of Solar Energy, Vol. 25, 14. Solar Energy Society of Nigeria (SESN) 14. All rights reserved. Modeling of the Optimum Tilt of a Solar Collector to Receive Maximum Radiation 1 Garba, I.
Climatography of the United States No
 No. 2 1971-2 Asheville, North Carolina 2881 COOP ID: 43417 Climate Division: CA 4 NWS Call Sign: N Lon: 121 Month (1) Min (2) Month(1) Extremes Lowest (2) Temperature ( F) Lowest Month(1) Degree s (1)
Climate Variability in South Asia
 Climate Variability in South Asia V. Niranjan, M. Dinesh Kumar, and Nitin Bassi Institute for Resource Analysis and Policy Contents Introduction Rainfall variability in South Asia Temporal variability
Climatography of the United States No
 Climate Division: CA 6 NWS Call Sign: Month (1) Min (2) Month(1) Extremes Lowest (2) Temperature ( F) Lowest Month(1) Degree s (1) Base Temp 65 Heating Cooling 100 Number of s (3) Jan 51.5 35.0 43.3 80
Climatography of the United States No
 Climate Division: CA 5 NWS Call Sign: Month (1) Min (2) Month(1) Extremes Lowest (2) Temperature ( F) Lowest Month(1) Degree s (1) Base Temp 65 Heating Cooling 100 Number of s (3) 59.3 31.5 45.4 80 1976
Climatography of the United States No
 No. 2 1971-2 Asheville, North Carolina 2881 COOP ID: 4795 Climate Division: CA 6 NWS Call Sign: SBA Month (1) Min (2) Month(1) Extremes Lowest (2) Temperature ( F) Lowest Month(1) Degree s (1) Base Temp
Climatography of the United States No
 Climate Division: CA 7 NWS Call Sign: Month (1) Min (2) Month(1) Extremes Lowest (2) Temperature ( F) Lowest Month(1) Degree s (1) Base Temp 65 Heating Cooling 100 Number of s (3) 44.5 29.3 36.9 69 1951
Climatography of the United States No
 Climate Division: CA 2 NWS Call Sign: Month (1) Min (2) Month(1) Extremes Lowest (2) Temperature ( F) Lowest Month(1) Degree s (1) Base Temp 65 Heating Cooling 100 Number of s (3) 53.3 37.1 45.2 77 1962
Climatography of the United States No
 Climate Division: CA 2 NWS Call Sign: Month (1) Min (2) Month(1) Extremes Lowest (2) Temperature ( F) Lowest Month(1) Degree s (1) Base Temp 65 Heating Cooling 100 Number of s (3) 53.3 31.8 42.6 74+ 1975
Climatography of the United States No
 Climate Division: CA 2 NWS Call Sign: Month (1) Min (2) Month(1) Extremes Lowest (2) Temperature ( F) Lowest Month(1) Degree s (1) Base Temp 65 Heating Cooling 100 Number of s (3) 53.7 32.7 43.2 79 1962
Climatography of the United States No
 Climate Division: CA 6 NWS Call Sign: Month (1) Min (2) Month(1) Extremes Lowest (2) Temperature ( F) Lowest Month(1) Degree s (1) Base Temp 65 Heating Cooling 100 Number of s (3) 68.5 45.7 57.1 90 1971
Climatography of the United States No
 Climate Division: CA 7 NWS Call Sign: Month (1) Min (2) Month(1) Extremes Lowest (2) Temperature ( F) Lowest Month(1) Degree s (1) Base Temp 65 Heating Cooling 100 Number of s (3) 56.0 35.7 45.9 83 1975
Climatography of the United States No
 Climate Division: CA 7 NWS Call Sign: Month (1) Min (2) Month(1) Extremes Lowest (2) Temperature ( F) Lowest Month(1) Degree s (1) Base Temp 65 Heating Cooling 1 Number of s (3) 64.8 45.4 55.1 85 1971
Climatography of the United States No
 Climate Division: CA 7 NWS Call Sign: Month (1) Min (2) Month(1) Extremes Lowest (2) Temperature ( F) Lowest Month(1) Degree s (1) Base Temp 65 Heating Cooling 1 Number of s (3) 65.5 38.7 52.1 87 1962
Climatography of the United States No
 Climate Division: CA 7 NWS Call Sign: Month (1) Min (2) Month(1) Extremes Lowest (2) Temperature ( F) Lowest Month(1) Degree s (1) Base Temp 65 Heating Cooling 100 Number of s (3) 58.8 34.3 46.6 81+ 1948
Climatography of the United States No
 Climate Division: CA 7 NWS Call Sign: Month (1) Min (2) Month(1) Extremes Lowest (2) Temperature ( F) Lowest Month(1) Degree s (1) Base Temp 65 Heating Cooling 100 Number of s (3) 70.4 44.2 57.3 95 1971
Climatography of the United States No
 Climate Division: CA 1 NWS Call Sign: Month (1) Min (2) Month(1) Extremes Lowest (2) Temperature ( F) Lowest Month(1) Degree s (1) Base Temp 65 Heating Cooling 100 Number of s (3) Jan 52.4 35.4 43.9 69
Climatography of the United States No
 Climate Division: CA 4 NWS Call Sign: Month (1) Min (2) Month(1) Extremes Lowest (2) Temperature ( F) Lowest Month(1) Degree s (1) Base Temp 65 Heating Cooling 100 Number of s (3) Jan 61.9 42.0 52.0 89
Climatography of the United States No
 Climate Division: CA 2 NWS Call Sign: Month (1) Min (2) Month(1) Extremes Lowest (2) Temperature ( F) Lowest Month(1) Degree s (1) Base Temp 65 Heating Cooling 100 Number of s (3) Jan 55.6 38.8 47.2 81
Climatography of the United States No
 Climate Division: CA 2 NWS Call Sign: Month (1) Min (2) Month(1) Extremes Lowest (2) Temperature ( F) Lowest Month(1) Degree s (1) Base Temp 65 Heating Cooling 100 Number of s (3) Jan 53.5 37.6 45.6 78
Climatography of the United States No
 Climate Division: CA 6 NWS Call Sign: Month (1) Min (2) Month(1) Extremes Lowest (2) Temperature ( F) Lowest Month(1) Degree s (1) Base Temp 65 Heating Cooling 100 Number of s (3) Jan 66.1 38.3 52.2 91
Climatography of the United States No
 Climate Division: CA 1 NWS Call Sign: Month (1) Min (2) Month(1) Extremes Lowest (2) Temperature ( F) Lowest Month(1) Degree s (1) Base Temp 65 Heating Cooling 1 Number of s (3) Jan 56.2 4.7 48.5 79 1962
Climatography of the United States No
 Climate Division: CA 1 NWS Call Sign: Month (1) Min (2) Month(1) Extremes Lowest (2) Temperature ( F) Lowest Month(1) Degree s (1) Base Temp 65 Heating Cooling 100 Number of s (3) Jan 50.2 31.2 40.7 65+
Climatography of the United States No
 Climate Division: CA 4 NWS Call Sign: Month (1) Min (2) Month(1) Extremes Lowest (2) Temperature ( F) Lowest Month(1) Degree s (1) Base Temp 65 Heating Cooling 100 Number of s (3) Jan 61.4 33.1 47.3 82+
Site Description: Tower Site
 Resource Summary for Elizabeth Site Final Report Colorado Anemometer Loan Program Monitoring Period: 7/3/06 /26/07 Report Date: January, 0 Site Description: The site is.6 miles northeast of the town of
Characteristics of the night and day time atmospheric boundary layer at Dome C, Antarctica
 Characteristics of the night and day time atmospheric boundary layer at Dome C, Antarctica S. Argentini, I. Pietroni,G. Mastrantonio, A. Viola, S. Zilitinchevich ISAC-CNR Via del Fosso del Cavaliere 100,
The Climate of Pontotoc County
 The Climate of Pontotoc County Pontotoc County is part of the Crosstimbers. This region is a transition region from the Central Great Plains to the more irregular terrain of southeast Oklahoma. Average
Climatography of the United States No
 Climate Division: CA 7 NWS Call Sign: Month (1) Min (2) Month(1) Extremes Lowest (2) Temperature ( F) Lowest Month(1) Degree s (1) Base Temp 65 Heating Cooling 100 Number of s (3) Jan 54.4 36.9 45.7 77+
Climatography of the United States No
 Climate Division: CA 4 NWS Call Sign: Month (1) Min (2) Month(1) Extremes Lowest (2) Temperature ( F) Lowest Month(1) Degree s (1) Base Temp 65 Heating Cooling 100 Number of s (3) Jan 56.4 43.6 50.0 77
Climatography of the United States No
 No. 2 1971-2 Asheville, North Carolina 2881 COOP ID: 46175 Climate Division: CA 6 NWS Call Sign: 3L3 Elevation: 1 Feet Lat: 33 Month (1) Min (2) Month(1) Extremes Lowest (2) Temperature ( F) Lowest Month(1)
Climatography of the United States No
 No. 2 1971-2 Asheville, North Carolina 2881 COOP ID: 42713 Climate Division: CA 7 NWS Call Sign: Elevation: -3 Feet Lat: 32 Month (1) Min (2) Month(1) Extremes Lowest (2) Temperature ( F) Lowest Month(1)
Climatography of the United States No
 Climate Division: SC 7 NWS Call Sign: CHS Month (1) Min (2) Month(1) Extremes Lowest (2) Temperature ( F) Lowest Month(1) Degree s (1) Base Temp 65 Heating Cooling 100 Number of s (3) Jan 58.9 36.9 47.9
Appendix C. AMEC Evaluation of Zuni PPIW. Appendix C. Page C-1 of 34
 AMEC s Independent Estimate of PPIW Crop Water Use Using the ASCE Standardized Reference Evapotranspiration via Gridded Meteorological Data, and Estimation of Crop Coefficients, and Net Annual Diversions
The Climate of Kiowa County
 The Climate of Kiowa County Kiowa County is part of the Central Great Plains, encompassing some of the best agricultural land in Oklahoma. Average annual precipitation ranges from about 24 inches in northwestern
Introduction to Climate ~ Part I ~
 2015/11/16 TCC Seminar JMA Introduction to Climate ~ Part I ~ Shuhei MAEDA (MRI/JMA) Climate Research Department Meteorological Research Institute (MRI/JMA) 1 Outline of the lecture 1. Climate System (
Outline. The Path of the Sun. Emissivity and Absorptivity. Average Radiation Properties II. Average Radiation Properties
 The Path of the Sun Larry Caretto Mechanical Engineering 83 Alternative Energy Engineering II March, 2 Outline Review radiation properties for solar collectors Orientation of earth and sun Earth-based
The Arctic Energy Budget
 The Arctic Energy Budget The global heat engine [courtesy Kevin Trenberth, NCAR]. Differential solar heating between low and high latitudes gives rise to a circulation of the atmosphere and ocean that
Time Series Analysis
 Time Series Analysis A time series is a sequence of observations made: 1) over a continuous time interval, 2) of successive measurements across that interval, 3) using equal spacing between consecutive
Snowcover interaction with climate, topography & vegetation in mountain catchments
 Snowcover interaction with climate, topography & vegetation in mountain catchments DANNY MARKS Northwest Watershed Research Center USDA-Agricultural Agricultural Research Service Boise, Idaho USA RCEW
Gridding of precipitation and air temperature observations in Belgium. Michel Journée Royal Meteorological Institute of Belgium (RMI)
") Gridding of precipitation and air temperature observations in Belgium Michel Journée Royal Meteorological Institute of Belgium (RMI) Gridding of meteorological data A variety of hydrologic, ecological,
Gridding of precipitation and air temperature observations in Belgium Michel Journée Royal Meteorological Institute of Belgium (RMI) Gridding of meteorological data A variety of hydrologic, ecological,
The Climate of Texas County
 The Climate of Texas County Texas County is part of the Western High Plains in the north and west and the Southwestern Tablelands in the east. The Western High Plains are characterized by abundant cropland
ENHANCING THE GEOGRAPHICAL AND TIME RESOLUTION OF NASA SSE TIME SERIES USING MICROSTRUCTURE PATTERNING
 ENHANCING THE GEOGRAPHICAL AND TIME RESOLUTION OF NASA TIME SERIES USING MICROSTRUCTURE PATTERNING Richard Perez and Marek Kmiecik, Atmospheric Sciences Research Center 251 Fuller Rd Albany, NY, 1223 Perez@asrc.cestm.albany,edu
PV 2012/2013. Radiation from the Sun Atmospheric effects Insolation maps Tracking the Sun PV in urban environment
 SOLAR RESOURCE Radiation from the Sun Atmospheric effects Insolation maps Tracking the Sun PV in urban environment 1 is immense Human energy use: 4.0x10 14 kwh/year on Earth s surface: 5.5x10 17 kwh/year
Climate Change and Arizona s Rangelands: Management Challenges and Opportunities
 Climate Change and Arizona s Rangelands: Management Challenges and Opportunities Mike Crimmins Climate Science Extension Specialist Dept. of Soil, Water, & Env. Science & Arizona Cooperative Extension
Agricultural Science Climatology Semester 2, Anne Green / Richard Thompson
 Agricultural Science Climatology Semester 2, 2006 Anne Green / Richard Thompson http://www.physics.usyd.edu.au/ag/agschome.htm Course Coordinator: Mike Wheatland Course Goals Evaluate & interpret information,