Climate Variability in South Asia
|
|
|
- Jeffrey Jones
- 5 years ago
- Views:
Transcription
1 Climate Variability in South Asia V. Niranjan, M. Dinesh Kumar, and Nitin Bassi Institute for Resource Analysis and Policy
2 Contents Introduction Rainfall variability in South Asia Temporal variability in rainfall Variability in climate in South Asia Spatial variability in climate How South Asian rainfall has been changing over time? Conclusions
3 Introduction It is well understood that from a utilitarian perspective, climate variability has significant implications for the way climate change predictions need to be made Understanding of climate variability (spatial and temporal) and its impact on hydrological systems would also help understand the likely impact of the change in climate over time on the hydrological system and water resources Unfortunately, these concerns were very narrowly addressed by the advocates of climate change, with the key contention being the variability in precipitation would increase with greater frequency of extreme events such as floods and droughts.
4 Introduction There are several other important climate parameters one needs to deal with for analyzing climate variability issues which include the following number of rainy days; wind speed; wind directions; humidity; temperature and solar radiation
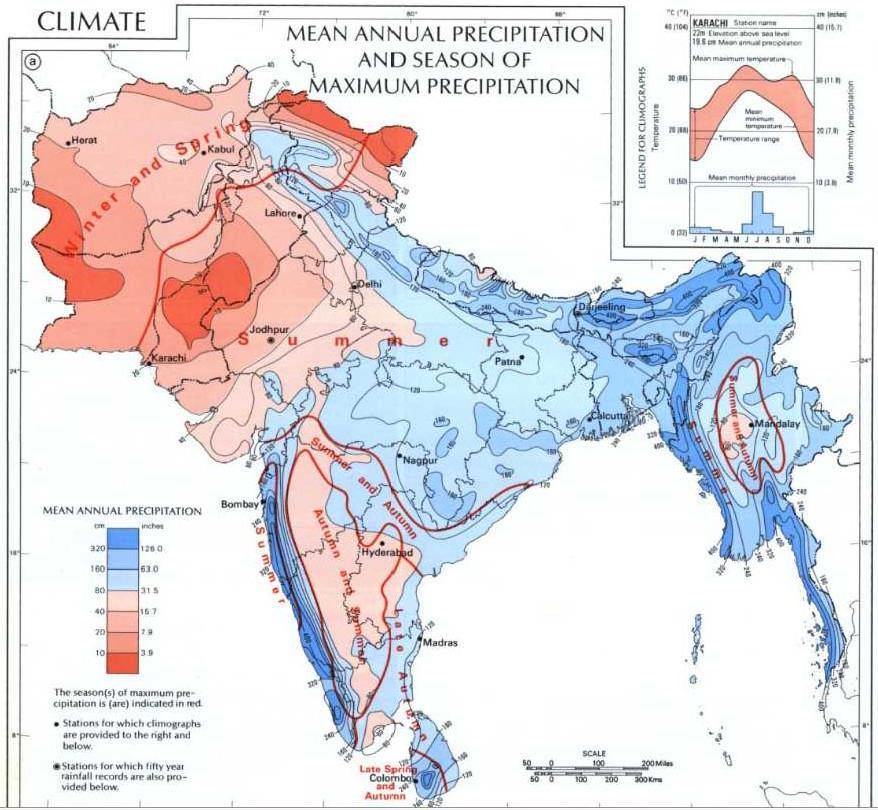
5 Rainfall variability in South Asia The mean annual rainfall across South Asia varies from 1mm to 32mm India has diverse climates (hyper-arid to arid to semi arid to sub-humid to humid) Srilanka being an island country, has coastal climate in many parts Pakistan has true humid conditions after the rainfall increases to 75mm in plains and 625mm in highlands
6 Rainfall variability in South Asia (Contd..) Nepal (Alpine to sub-alpine in higher Himalayas to temperate in lesser Himalayan region to sub-tropical in the Terai and Siwalik regions Afghanistan has the central highlands, which are part of the Hindukhush Himalayan range, northern plains and south western plateau, which consists of sandy desert and semi desert. Bangladesh has tropical monsoon climate characterized by high seasonal rainfall, high temperature and high humidity.
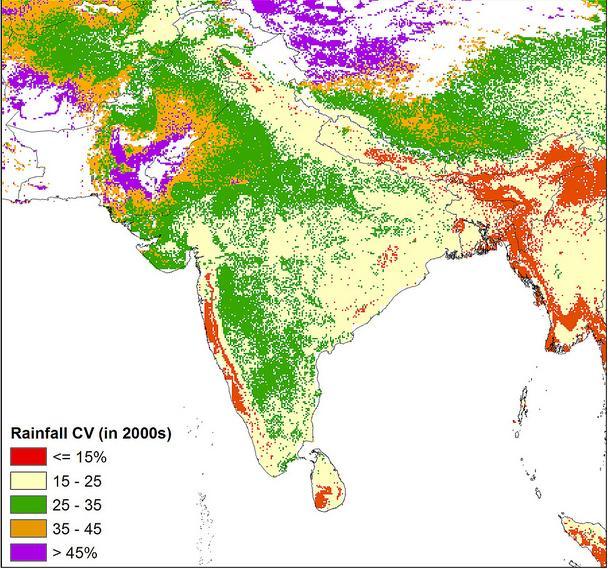
7 Temporal variability in rainfall Analysis of monsoon rainfall carried out by Physical Research Laboratories shows that the inter-annual variability (expressed in terms of CV) in annual rainfall is high in regions of low rainfall and low in regions of high rainfall In regions such as western Rajasthan and Kachchh, the CV in the rainfall is as high as 5 per cent and above. In the northeastern and western Ghat regions the CV in rainfall is very low, meaning high dependability
8 Variability in climate in South Asia Climate is the net effect of the interplay of precipitation, humidity, temperature of the atmosphere and winds (speed) and rainfall Humidity is a measure of the amount of vapor in the air, and is measured in terms of vapor pressure of the air (measured in KPa/m 2 ) The relative humidity (RH) is the measure of the vapor pressure of the air measured as a percentage of the saturated vapor pressure and this RH ranges from <25% to 1% across South Asia
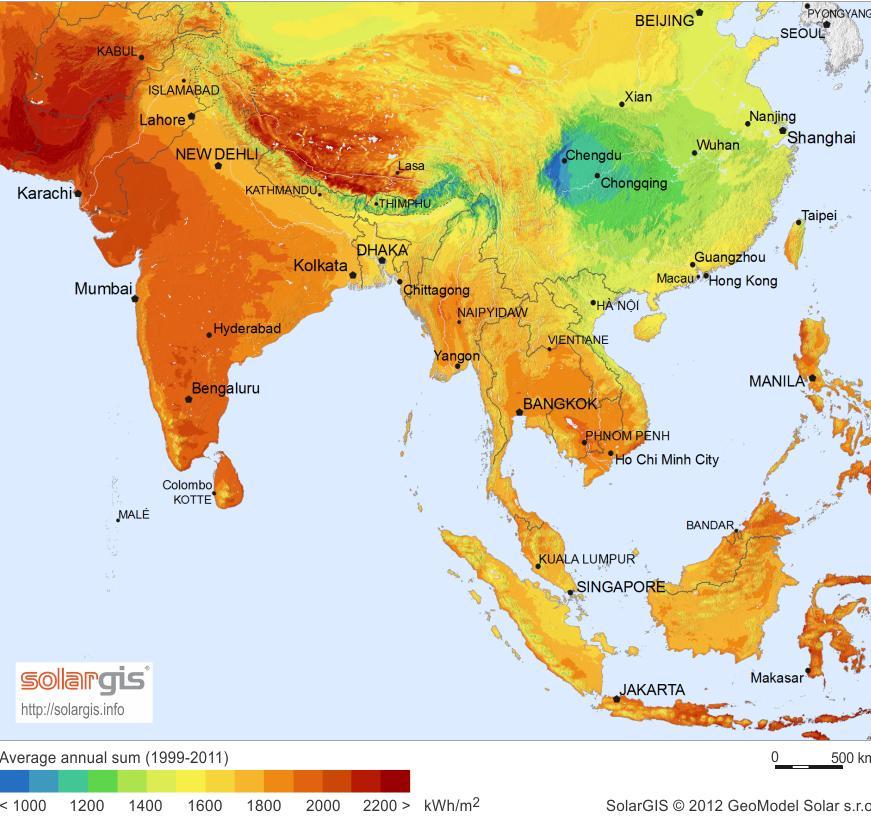
9 Variability in climate in South Asia (Contd..) Atmospheric temperature change is a result of change in energy balance, which is the net effect of the incident and reflected solar radiations Speed of winds, which occur as a result of atmospheric pressure gradients, is an important climate parameter as it can change the humidity of an area. There is significant variation in solar radiation flux across South Asia
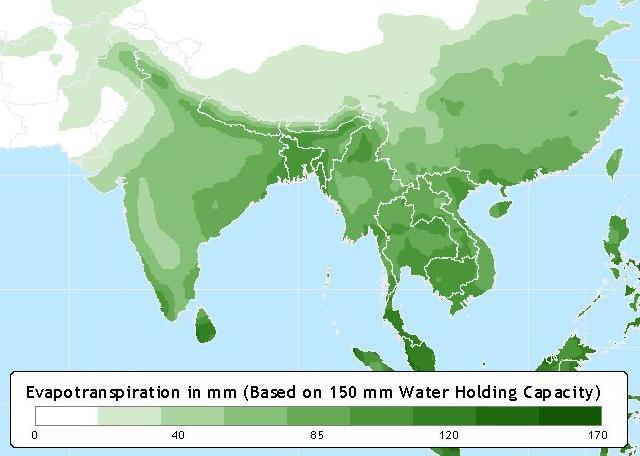
10 Spatial variability in climate Potential evaporation (expressed in mm), the amount of water an open water body can evaporate in a year, for a particular location is a net result of the solar radiation flux, wind speed and relative humidity experienced in that location and to a lesser extent the temperature, and is a strong indicator of the location s climate, along with rainfall. The variations in solar radiation, air temperature, wind speed and relative humidity across space ultimately results in significant variation in potential evaporation (PE).
11 How South Asian rainfall has been changing over time? Understanding how the monsoon will change in the face of global warming is a challenge for climate science The general circulation models still have difficulty simulating the regional distribution of monsoon rainfall Historical and Projection of South Asia monsoon rainfall (186 21) The analysis by IITM is the only work which comprehensively examines the long term variations in Physiographic rainfall across India
12 Conclusions We have seen that there is substantial inter-annual and interregional variations rainfall. There is also substantial variation in the annual potential evaporation rates, which is the result of variations in key climate variables with respect to space. We have also seen that there is significant variation in climate variable such as relative humidity, temperature and wind speed across seasons and years.
13 Conclusions These together can induce major changes in the physical and biophysical processes such as evaporation from soils and water bodies, and evapo-transpiration from plants, grass and trees. Understanding these characteristics is important as it has significant implications for the way climate change predictions need to be made for the sub-continent. Understanding of the impact of climate variability on water resources and water demand would also help understand the likely impact of the change in climate over time on the hydrological system and water resources
14 THANK YOU
15
16 Rainfall in mm Temperature in o C Rainfall in mm Temperature in o C Rainfall in mm Temperature in o C Rainfall in mm Temperature in o C Rainfall in mm Temperature in o C Rainfall in mm Temperature in o C Figure1: Monthly Mean Rainfall and Temperature in India (19-29) Jan Feb Mar Apr May Jun Jul Aug Sep Oct Nov Dec Monthly Mean Rainfall Monthly Mean Temperature Figure2: Monthly Mean Rainfall and Temperature in Srilanka (19-29) Jan Feb Mar Apr May Jun Jul Aug Sep Oct Nov Dec Monthly Mean Rainfall Monthly Average Temperature Figure3: Monthly Mean Rainfall and Temperature in Pakistan (19-29) Jan Feb Mar Apr May Jun Jul Aug Sep Oct Nov Dec Monthly Mean Rainfall Monthly Mean Temperature Figure4: Monthly Mean Rainfall and Temperature in Nepal (19-29) Jan Feb Mar Apr May Jun Jul Aug Sep Oct Nov Dec Monthly Mean Rainfall Monthly Mean Temperature Figure5: Monthly Mean Rainfall and Temperature in Afghanistan (19-29) Jan Feb Mar Apr May Jun Jul Aug Sep Oct Nov Dec Monthly Mean Rainfall Monthly Mean Temperature Figure6: Monthly Mean Rainfall and Temperature in Bangladesh (19-29) Jan Feb Mar Apr May Jun Jul Aug Sep Oct Nov Dec Monthly Mean Rainfall Monthly Mean Temperature
17
 9 8 7 6 5 4 3 2 1 RH%-AM-29 RH%-AM-21 RH%-PM-29")
18 Relative Humidity % 1 Relative Humidity: Aurangabad (29 and 21) RH%-AM-29 RH%-AM-21 RH%-PM-29 RH%-PM-21
19 Temperature in degrees C Rainfall in mm Temperature and Rainfall of Aurangabad (29 and 21) Daily Max Temp-29 Daily Max Temp-21 Daily Min Temp-29 Daily Min Temp-21 Daily Rainfall-29 Daily Rainfall-21
20
21
22
Average temperature ( F) World Climate Zones. very cold all year with permanent ice and snow. very cold winters, cold summers, and little rain or snow
 World Climate Zones. very cold all year with permanent ice and snow. very cold winters, cold summers, and little rain or snow") P r e v i e w Look carefully at the climagraph of Mumbai, India. What is the wettest month (or months) in Mumbai? What is the driest month (or months) in Mumbai? What effects might this city s climate
P r e v i e w Look carefully at the climagraph of Mumbai, India. What is the wettest month (or months) in Mumbai? What is the driest month (or months) in Mumbai? What effects might this city s climate
GAMINGRE 8/1/ of 7
 FYE 09/30/92 JULY 92 0.00 254,550.00 0.00 0 0 0 0 0 0 0 0 0 254,550.00 0.00 0.00 0.00 0.00 254,550.00 AUG 10,616,710.31 5,299.95 845,656.83 84,565.68 61,084.86 23,480.82 339,734.73 135,893.89 67,946.95
Analysis of Historical Pattern of Rainfall in the Western Region of Bangladesh
 24 25 April 214, Asian University for Women, Bangladesh Analysis of Historical Pattern of Rainfall in the Western Region of Bangladesh Md. Tanvir Alam 1*, Tanni Sarker 2 1,2 Department of Civil Engineering,
Chiang Rai Province CC Threat overview AAS1109 Mekong ARCC
 Chiang Rai Province CC Threat overview AAS1109 Mekong ARCC This threat overview relies on projections of future climate change in the Mekong Basin for the period 2045-2069 compared to a baseline of 1980-2005.
Physical Features of Monsoon Asia. 192 Unit 7 Teachers Curriculum Institute 60 N 130 E 140 E 150 E 60 E 50 N 160 E 40 N 30 N 150 E.
 50 N 60 E 70 E 80 E 90 E 100 E 60 N 110 E 120 E 130 E 140 E 150 E 50 N 160 E 40 N 40 N 30 N 60 E 30 N 150 E Tropic of Cancer 20 N Tropic of Cancer 20 N 10 N 10 N 0 Equator 0 Equator 10 S 10 S 0 500 1,000
Variability of Reference Evapotranspiration Across Nebraska
 Know how. Know now. EC733 Variability of Reference Evapotranspiration Across Nebraska Suat Irmak, Extension Soil and Water Resources and Irrigation Specialist Kari E. Skaggs, Research Associate, Biological
Presentation Overview. Southwestern Climate: Past, present and future. Global Energy Balance. What is climate?
 Southwestern Climate: Past, present and future Mike Crimmins Climate Science Extension Specialist Dept. of Soil, Water, & Env. Science & Arizona Cooperative Extension The University of Arizona Presentation
Global Climates. Name Date
 Global Climates Name Date No investigation of the atmosphere is complete without examining the global distribution of the major atmospheric elements and the impact that humans have on weather and climate.
2003 Water Year Wrap-Up and Look Ahead
 2003 Water Year Wrap-Up and Look Ahead Nolan Doesken Colorado Climate Center Prepared by Odie Bliss http://ccc.atmos.colostate.edu Colorado Average Annual Precipitation Map South Platte Average Precipitation
Changing Hydrology under a Changing Climate for a Coastal Plain Watershed
 Changing Hydrology under a Changing Climate for a Coastal Plain Watershed David Bosch USDA-ARS, Tifton, GA Jeff Arnold ARS Temple, TX and Peter Allen Baylor University, TX SEWRU Objectives 1. Project changes
Study of Hydrometeorology in a Hard Rock Terrain, Kadirischist Belt Area, Anantapur District, Andhra Pradesh
 Open Journal of Geology, 2012, 2, 294-300 http://dx.doi.org/10.4236/ojg.2012.24028 Published Online October 2012 (http://www.scirp.org/journal/ojg) Study of Hydrometeorology in a Hard Rock Terrain, Kadirischist
Inter-linkage case study in Pakistan
 7 th GEOSS Asia Pacific Symposium GEOSS AWCI Parallel Session: 26-28 May, 2014, Tokyo, Japan Inter-linkage case study in Pakistan Snow and glaciermelt runoff modeling in Upper Indus Basin of Pakistan Maheswor
Climate Change or Climate Variability?
 Climate Change or Climate Variability? Key Concepts: Greenhouse Gas Climate Climate change Climate variability Climate zones Precipitation Temperature Water cycle Weather WHAT YOU WILL LEARN 1. You will
Hydro-meteorological Analysis of Langtang Khola Catchment, Nepal
 Hydro-meteorological Analysis of Langtang Khola Catchment, Nepal Tirtha R. Adhikari 1, Lochan P. Devkota 1, Suresh.C Pradhan 2, Pradeep K. Mool 3 1 Central Department of Hydrology and Meteorology Tribhuvan
Analysis of Rainfall and Other Weather Parameters under Climatic Variability of Parbhani ( )
") International Journal of Current Microbiology and Applied Sciences ISSN: 2319-7706 Volume 7 Number 06 (2018) Journal homepage: http://www.ijcmas.com Original Research Article https://doi.org/10.20546/ijcmas.2018.706.295
International Journal of Current Microbiology and Applied Sciences ISSN: 2319-7706 Volume 7 Number 06 (2018) Journal homepage: http://www.ijcmas.com Original Research Article https://doi.org/10.20546/ijcmas.2018.706.295
On the presence of tropical vortices over the Southeast Asian Sea- Maritime Continent region
 Technical Conference of 50 th Annual Session of Typhoon Committee 2018 On the presence of tropical vortices over the Southeast Asian Sea- Maritime Continent region Nguyen Dang-Quang 1, James Renwick 2,
Decadal Changes of Rainfall and Temperature Extremes over the different Agro Economical Zones (AEZ) of Bangladesh
 of Bangladesh") Decadal Changes of Rainfall and Temperature Extremes over the different Agro Economical Zones (AEZ) of Bangladesh Professor A.K.M. Saiful Islam Md. Alfi Hasan Institute of Water and Flood Management Bangladesh
Decadal Changes of Rainfall and Temperature Extremes over the different Agro Economical Zones (AEZ) of Bangladesh Professor A.K.M. Saiful Islam Md. Alfi Hasan Institute of Water and Flood Management Bangladesh
Drought in Southeast Colorado
 Drought in Southeast Colorado Nolan Doesken and Roger Pielke, Sr. Colorado Climate Center Prepared by Tara Green and Odie Bliss http://climate.atmos.colostate.edu 1 Historical Perspective on Drought Tourism
Jackson County 2014 Weather Data
 Jackson County 2014 Weather Data 62 Years of Weather Data Recorded at the UF/IFAS Marianna North Florida Research and Education Center Doug Mayo Jackson County Extension Director 1952-2008 Rainfall Data
Climate Change: bridging scientific knowledge and public policy. Forum Parliament House, Canberra 18 March 2010
 Climate Change: bridging scientific knowledge and public policy Forum Parliament House, Canberra 18 March 2010 Opening Comments Prof. Peter Coaldrake Chair Universities Australia Session 1 Climate change
BMKG Research on Air sea interaction modeling for YMC
 BMKG Research on Air sea interaction modeling for YMC Prof. Edvin Aldrian Director for Research and Development - BMKG First Scientific and Planning Workshop on Year of Maritime Continent, Singapore 27-3
Climate Change Impact Assessment on Indian Water Resources. Ashvin Gosain, Sandhya Rao, Debajit Basu Ray
 Climate Change Impact Assessment on Indian Water Resources Ashvin Gosain, Sandhya Rao, Debajit Basu Ray Objectives of the Study To quantify the impact of the climate change on the water resources of the
Our climate system is based on the location of hot and cold air mass regions and the atmospheric circulation created by trade winds and westerlies.
 CLIMATE REGIONS Have you ever wondered why one area of the world is a desert, another a grassland, and another a rainforest? Or have you wondered why are there different types of forests and deserts with
Key Finding: Long Term Trend During 2014: Rain in Indian Tradition Measuring Rain
 Chapter 34 RAINFALL Key Finding: Long Term Trend Despite of theories suggesting increase in rainfall in Asian Region due to global warming, no significant trend has been observed at all India level (confirmed
Climate Change and Arizona s Rangelands: Management Challenges and Opportunities
 Climate Change and Arizona s Rangelands: Management Challenges and Opportunities Mike Crimmins Climate Science Extension Specialist Dept. of Soil, Water, & Env. Science & Arizona Cooperative Extension
United States Climate
 25-1 Alabama Annual Average Temperature Data Source: http://www.wrcc.dri.edu/cgi-bin/divplot1_form.pl?0106 25-2 How does climate vary as we traverse the U.S. along 40 N? 25-3 Average Temperature Along
Science Standard 1: Students analyze monthly precipitation and temperature records, displayed in bar charts, collected in metric units (mm).
.") Title: Precipitation Patterns across the Globe NSF GK-12 Fellow: Terry Legg Type of Lesson: STEM Grade Level(s): 4 th - 7 th grade This activity can be tailored to older, more advanced students by having
Title: Precipitation Patterns across the Globe NSF GK-12 Fellow: Terry Legg Type of Lesson: STEM Grade Level(s): 4 th - 7 th grade This activity can be tailored to older, more advanced students by having
Energy Systems, Structures and Processes Essential Standard: Analyze patterns of global climate change over time Learning Objective: Differentiate
 Energy Systems, Structures and Processes Essential Standard: Analyze patterns of global climate change over time Learning Objective: Differentiate between weather and climate Global Climate Focus Question
Country Presentation-Nepal
 Country Presentation-Nepal Mt.Everest, Shiva Pd. Nepal, DHM South Asia Drought Monitor Workshop Dhaka Bangladesh 2 th April 215 Overview Brief Climatology Climate activities- DHM PPCR (Pilot Program for
2003 Moisture Outlook
 2003 Moisture Outlook Nolan Doesken and Roger Pielke, Sr. Colorado Climate Center Prepared by Tara Green and Odie Bliss http://climate.atmos.colostate.edu Through 1999 Through 1999 Fort Collins Total Water
Temporal and spatial variations in radiation and energy fluxes across Lake Taihu
 Temporal and spatial variations in radiation and energy fluxes across Lake Taihu Wang Wei YNCenter Video Conference May 10, 2012 Outline 1. Motivation 2. Hypothesis 3. Methodology 4. Preliminary results
Chapter-3 GEOGRAPHICAL LOCATION, CLIMATE AND SOIL CHARACTERISTICS OF THE STUDY SITE
 Chapter-3 GEOGRAPHICAL LOCATION, CLIMATE AND SOIL CHARACTERISTICS OF THE STUDY SITE Chapter-3 GEOGRAPHICAL LOCATION, CLIMATE AND SOIL CHARACTERISTICS OF THE STUDY SITE Assam, the eastern most state of
a) Name the features marked P,Q, and R b) Differentiate between a normal faulty and a reverse fault. 2. Use the diagram below to answer question (a)
 Name the features marked P,Q, and R b) Differentiate between a normal faulty and a reverse fault. 2. Use the diagram below to answer question (a)") GEOGRAPHY PAPER 312 / 1 K.C.S.E 2002 SECTION A Answer all the questions in this section 1. The diagram below represents features produced by faulting. Use it to answer questions that follow. a) Name the
GEOGRAPHY PAPER 312 / 1 K.C.S.E 2002 SECTION A Answer all the questions in this section 1. The diagram below represents features produced by faulting. Use it to answer questions that follow. a) Name the
Climate Dynamics (PCC 587): Hydrologic Cycle and Global Warming
: Hydrologic Cycle and Global Warming") Climate Dynamics (PCC 587): Hydrologic Cycle and Global Warming D A R G A N M. W. F R I E R S O N U N I V E R S I T Y O F W A S H I N G T O N, D E P A R T M E N T O F A T M O S P H E R I C S C I E N C
Climate Dynamics (PCC 587): Hydrologic Cycle and Global Warming D A R G A N M. W. F R I E R S O N U N I V E R S I T Y O F W A S H I N G T O N, D E P A R T M E N T O F A T M O S P H E R I C S C I E N C
2016 Meteorology Summary
 2016 Meteorology Summary New Jersey Department of Environmental Protection AIR POLLUTION AND METEOROLOGY Meteorology plays an important role in the distribution of pollution throughout the troposphere,
Temporal variability in the isotopic composition of meteoric water in Christchurch, New Zealand; Can we create reliable isoscapes?
 1 2 3 4 5 6 7 8 9 10 11 12 13 14 15 16 17 18 19 20 21 22 23 24 25 26 27 28 29 30 31 Temporal variability in the isotopic composition of meteoric water in Christchurch, New Zealand; Can we create reliable
Colorado s 2003 Moisture Outlook
 Colorado s 2003 Moisture Outlook Nolan Doesken and Roger Pielke, Sr. Colorado Climate Center Prepared by Tara Green and Odie Bliss http://climate.atmos.colostate.edu How we got into this drought! Fort
Jackson County 2019 Weather Data 68 Years of Weather Data Recorded at the UF/IFAS Marianna North Florida Research and Education Center
 Jackson County 2019 Weather Data 68 Years of Weather Data Recorded at the UF/IFAS Marianna North Florida Research and Education Center Doug Mayo Jackson County Extension Director 1952-2008 Rainfall Data
What Does It Take to Get Out of Drought?
 What Does It Take to Get Out of Drought? Nolan J. Doesken Colorado Climate Center Colorado State University http://ccc.atmos.colostate.edu Presented at the Insects, Diseases and Drought Workshop, May 19,
1.0 Implications of using daily climatological wind speed prior to 1948
 Supplemental Material 1.0 Implications of using daily climatological wind speed prior to 1948 As detailed in the manuscript, NCEP-NCAR reanalysis wind data were used for the period 1948/01/01-2011/12/31.
CAVE CLIMATE COMPARISON ACTIVITY BETWEEN THE SURFACE AND THE CAVERN
 CAVE CLIMATE COMPARISON ACTIVITY BETWEEN THE SURFACE AND THE CAVERN Created by Ray Bowers For the Virtual Center for the Environment (VCE) A part of the Institute of Natural Resources Analysis and Management
Jackson County 2018 Weather Data 67 Years of Weather Data Recorded at the UF/IFAS Marianna North Florida Research and Education Center
 Jackson County 2018 Weather Data 67 Years of Weather Data Recorded at the UF/IFAS Marianna North Florida Research and Education Center Doug Mayo Jackson County Extension Director 1952-2008 Rainfall Data
Climate Change Scenarios 2030s
 Climate Change Scenarios 2030s Ashwini Kulkarni ashwini@tropmet.res.in K Krishna Kumar, Ashwini Kulkarni, Savita Patwardhan, Nayana Deshpande, K Kamala, Koteswara Rao Indian Institute of Tropical Meteorology,
Elements of weather and climate Temperature Range of temperature Seasonal temperature pattern Rainfall
 Climate Earth Science Chapter 20 Pages 560-573 Elements of weather and climate Temperature Range of temperature Seasonal temperature pattern Rainfall Overall rainfall Seasonal distribution of rainfall
CHAPTER-11 CLIMATE AND RAINFALL
 CHAPTER-11 CLIMATE AND RAINFALL 2.1 Climate Climate in a narrow sense is usually defined as the "average weather", or more rigorously, as the statistical description in terms of the mean and variability
Variability and trends in daily minimum and maximum temperatures and in diurnal temperature range in Lithuania, Latvia and Estonia
 Variability and trends in daily minimum and maximum temperatures and in diurnal temperature range in Lithuania, Latvia and Estonia Jaak Jaagus Dept. of Geography, University of Tartu Agrita Briede Dept.
Spatiotemporal variations of alpine climate, snow cover and phenology
 Spatiotemporal variations of alpine climate, snow cover and phenology S. Asam, M. Callegari, M. Matiu, G. Fiore, L. De Gregorio, A. Jacob, A. Menzel, C. Notarnicola, M. Zebisch Asam et al., Spatiotemporal
SYSTEM BRIEF DAILY SUMMARY
 SYSTEM BRIEF DAILY SUMMARY * ANNUAL MaxTemp NEL (MWH) Hr Ending Hr Ending LOAD (PEAK HOURS 7:00 AM TO 10:00 PM MON-SAT) ENERGY (MWH) INCREMENTAL COST DAY DATE Civic TOTAL MAXIMUM @Max MINIMUM @Min FACTOR
JOINT BRIEFING TO THE MEMBERS. El Niño 2018/19 Likelihood and potential impact
 JOINT BRIEFING TO THE MEMBERS El Niño 2018/19 Likelihood and potential impact CURRENT EL NIÑO OUTLOOK (SEPTEMBER 2018) CPC/IRI ENSO Forecast from September. Red bars denote probability of an El Nino developing
Jackson County 2013 Weather Data
 Jackson County 2013 Weather Data 61 Years of Weather Data Recorded at the UF/IFAS Marianna North Florida Research and Education Center Doug Mayo Jackson County Extension Director 1952-2008 Rainfall Data
Tracking the Climate Of Northern Colorado Nolan Doesken State Climatologist Colorado Climate Center Colorado State University
 Tracking the Climate Of Northern Colorado Nolan Doesken State Climatologist Colorado Climate Center Colorado State University Northern Colorado Business Innovations November 20, 2013 Loveland, Colorado
Promoting Rainwater Harvesting in Caribbean Small Island Developing States Water Availability Mapping for Grenada Preliminary findings
 Promoting Rainwater Harvesting in Caribbean Small Island Developing States Water Availability Mapping for Grenada Preliminary findings National Workshop Pilot Project funded by The United Nations Environment
A STUDY ON EVAPORATION IN IOANNINA, NW GREECE
 Proceedings of the 9 th International Conference on Environmental Science and Technology Rhodes island, Greece, 1 3 September 25 A STUDY ON EVAPORATION IN IOANNINA, NW GREECE A. V. KONTOGIANNI and A. BARTZOKAS
Hurricanes: Their physics and relationship to climate. Kerry Emanuel Massachusetts Institute of Technology
 Hurricanes: Their physics and relationship to climate Kerry Emanuel Massachusetts Institute of Technology Topics Overview of Tropical Cyclones Tropical Cyclone Physics What have TCs been like in the past,
Annual Average NYMEX Strip Comparison 7/03/2017
 Annual Average NYMEX Strip Comparison 7/03/2017 To Year to Year Oil Price Deck ($/bbl) change Year change 7/3/2017 6/1/2017 5/1/2017 4/3/2017 3/1/2017 2/1/2017-2.7% 2017 Average -10.4% 47.52 48.84 49.58
Seasonal Climate Outlook for South Asia (June to September) Issued in May 2014
 Issued in May 2014") Ministry of Earth Sciences Earth System Science Organization India Meteorological Department WMO Regional Climate Centre (Demonstration Phase) Pune, India Seasonal Climate Outlook for South Asia (June
Ministry of Earth Sciences Earth System Science Organization India Meteorological Department WMO Regional Climate Centre (Demonstration Phase) Pune, India Seasonal Climate Outlook for South Asia (June
DROUGHT ASSESSMENT USING SATELLITE DERIVED METEOROLOGICAL PARAMETERS AND NDVI IN POTOHAR REGION
 DROUGHT ASSESSMENT USING SATELLITE DERIVED METEOROLOGICAL PARAMETERS AND NDVI IN POTOHAR REGION Researcher: Saad-ul-Haque Supervisor: Dr. Badar Ghauri Department of RS & GISc Institute of Space Technology
SYSTEM BRIEF DAILY SUMMARY
 SYSTEM BRIEF DAILY SUMMARY * ANNUAL MaxTemp NEL (MWH) Hr Ending Hr Ending LOAD (PEAK HOURS 7:00 AM TO 10:00 PM MON-SAT) ENERGY (MWH) INCREMENTAL COST DAY DATE Civic TOTAL MAXIMUM @Max MINIMUM @Min FACTOR
Constructing a typical meteorological year -TMY for Voinesti fruit trees region and the effects of global warming on the orchard ecosystem
 Constructing a typical meteorological year -TMY for Voinesti fruit trees region and the effects of global warming on the orchard ecosystem ARMEANU ILEANA*, STĂNICĂ FLORIN**, PETREHUS VIOREL*** *University
Plant Water Stress Frequency and Periodicity in Western North Dakota
 Plant Water Stress Frequency and Periodicity in Western North Dakota Llewellyn L. Manske PhD, Sheri Schneider, John A. Urban, and Jeffery J. Kubik Report DREC 10-1077 Range Research Program Staff North
Water Stress, Droughts under Changing Climate
 Water Stress, Droughts under Changing Climate Professor A.K.M. Saiful Islam Institute of Water and Flood Management Bangladesh University of Engineering and Technology (BUET) Outline of the presentation
July, International SWAT Conference & Workshops
 July, 212 212 International SWAT Conference & Workshops Hydrological Modelling of Kosi and Gandak Basins using SWAT Model S. Dutta, Pritam Biswas, Sangita Devi, Suresh A Karth and Bimlesh kumar, Ganga
The Climate of Marshall County
 The Climate of Marshall County Marshall County is part of the Crosstimbers. This region is a transition region from the Central Great Plains to the more irregular terrain of southeastern Oklahoma. Average
APPLICATIONS OF DOWNSCALING: HYDROLOGY AND WATER RESOURCES EXAMPLES
 APPLICATIONS OF DOWNSCALING: HYDROLOGY AND WATER RESOURCES EXAMPLES Dennis P. Lettenmaier Department of Civil and Environmental Engineering For presentation at Workshop on Regional Climate Research NCAR
UWM Field Station meteorological data
 University of Wisconsin Milwaukee UWM Digital Commons Field Station Bulletins UWM Field Station Spring 992 UWM Field Station meteorological data James W. Popp University of Wisconsin - Milwaukee Follow
Verification of the Seasonal Forecast for the 2005/06 Winter
 Verification of the Seasonal Forecast for the 2005/06 Winter Shingo Yamada Tokyo Climate Center Japan Meteorological Agency 2006/11/02 7 th Joint Meeting on EAWM Contents 1. Verification of the Seasonal
Geostatistical Analysis of Rainfall Temperature and Evaporation Data of Owerri for Ten Years
 Atmospheric and Climate Sciences, 2012, 2, 196-205 http://dx.doi.org/10.4236/acs.2012.22020 Published Online April 2012 (http://www.scirp.org/journal/acs) Geostatistical Analysis of Rainfall Temperature
Tropical Moist Rainforest
 Tropical or Lowlatitude Climates: Controlled by equatorial tropical air masses Tropical Moist Rainforest Rainfall is heavy in all months - more than 250 cm. (100 in.). Common temperatures of 27 C (80 F)
Technical Note: Hydrology of the Lake Chilwa wetland, Malawi
 Technical Note: Hydrology of the Lake Chilwa wetland, Malawi Matthew McCartney June 27 Description Lake Chilwa is located in the Southern region of Malawi on the country s eastern boarder with Mozambique
SPECIMEN. Date Morning/Afternoon. A Level Geography H481/01 Physical systems Sample Question Paper. Time allowed: 1 hour 30 minutes PMT
 Oxford Cambridge and RSA A Level Geography H481/01 Physical systems Sample Question Paper Date Morning/Afternoon Time allowed: 1 hour 30 minutes You must have: the Resource Booklet the OCR 12-page Answer
Interannual variation of MODIS NDVI in Lake Taihu and its relation to climate in submerged macrophyte region
 Yale-NUIST Center on Atmospheric Environment Interannual variation of MODIS NDVI in Lake Taihu and its relation to climate in submerged macrophyte region ZhangZhen 2015.07.10 1 Outline Introduction Data
Climatography of the United States No
 Month (1) Min (2) Month(1) Extremes Lowest (2) Temperature ( F) Lowest Month(1) Degree s (1) Base Temp 65 Heating Cooling 100 Number of s (3) Jan 63.9 39.3 51.6 86 1976 16 56.6 1986 20 1976 2 47.5 1973
Climatography of the United States No
 Temperature ( F) Month (1) Min (2) Month(1) Extremes Lowest (2) Lowest Month(1) Degree s (1) Base Temp 65 Heating Cooling 100 Number of s (3) Jan 32.8 21.7 27.3 62 1918 1 35.8 1983-24 1950 29 10.5 1979
Introduction to Climate ~ Part I ~
 2015/11/16 TCC Seminar JMA Introduction to Climate ~ Part I ~ Shuhei MAEDA (MRI/JMA) Climate Research Department Meteorological Research Institute (MRI/JMA) 1 Outline of the lecture 1. Climate System (
Using Reanalysis SST Data for Establishing Extreme Drought and Rainfall Predicting Schemes in the Southern Central Vietnam
 Using Reanalysis SST Data for Establishing Extreme Drought and Rainfall Predicting Schemes in the Southern Central Vietnam Dr. Nguyen Duc Hau 1, Dr. Nguyen Thi Minh Phuong 2 National Center For Hydrometeorological
The Climate of Pontotoc County
 The Climate of Pontotoc County Pontotoc County is part of the Crosstimbers. This region is a transition region from the Central Great Plains to the more irregular terrain of southeast Oklahoma. Average
Seasonal and spatial variation of solar radiation in Nepal Himalayas
 1 Seasonal and spatial variation of solar radiation in Nepal Himalayas Sunil Adhikary Department of Meteorology Tri-Chandra Multiple Campus, Tribhuvan University, Kathmandu, Nepal. ABSTRACT Solar radiation
Climatography of the United States No
 Climate Division: AK 5 NWS Call Sign: ANC Month (1) Min (2) Month(1) Extremes Lowest (2) Temperature ( F) Lowest Month(1) Degree s (1) Base Temp 65 Heating Cooling 90 Number of s (3) Jan 22.2 9.3 15.8
Statistical Analysis of Temperature and Rainfall Trend in Raipur District of Chhattisgarh
 Current World Environment Vol. 10(1), 305-312 (2015) Statistical Analysis of Temperature and Rainfall Trend in Raipur District of Chhattisgarh R. Khavse*, R. Deshmukh, N. Manikandan, J. L Chaudhary and
Study of Changes in Climate Parameters at Regional Level: Indian Scenarios
 Study of Changes in Climate Parameters at Regional Level: Indian Scenarios S K Dash Centre for Atmospheric Sciences Indian Institute of Technology Delhi Climate Change and Animal Populations - The golden
The Climate of Payne County
 The Climate of Payne County Payne County is part of the Central Great Plains in the west, encompassing some of the best agricultural land in Oklahoma. Payne County is also part of the Crosstimbers in the
Climatography of the United States No
 Climate Division: CA 4 NWS Call Sign: Month (1) Min (2) Month(1) Extremes Lowest (2) Temperature ( F) Lowest Month(1) Degree s (1) Base Temp 65 Heating Cooling 100 Number of s (3) Jan 55.6 39.3 47.5 77
Climatography of the United States No
 Climate Division: CA 5 NWS Call Sign: Month (1) Min (2) Month(1) Extremes Lowest (2) Temperature ( F) Lowest Month(1) Degree s (1) Base Temp 65 Heating Cooling 100 Number of s (3) Jan 56.6 36.5 46.6 81
Climatography of the United States No
 Climate Division: CA 1 NWS Call Sign: Month (1) Min (2) Month(1) Extremes Lowest (2) Temperature ( F) Lowest Month(1) Degree s (1) Base Temp 65 Heating Cooling 100 Number of s (3) Jan 57.9 38.9 48.4 85
Climatography of the United States No
 Climate Division: CA 5 NWS Call Sign: Month (1) Min (2) Month(1) Extremes Lowest (2) Temperature ( F) Lowest Month(1) Degree s (1) Base Temp 65 Heating Cooling 100 Number of s (3) Jan 44.8 25.4 35.1 72
Climatography of the United States No
 Climate Division: CA 4 NWS Call Sign: Month (1) Min (2) Month(1) Extremes Lowest (2) Temperature ( F) Lowest Month(1) Degree s (1) Base Temp 65 Heating Cooling 100 Number of s (3) Jan 49.4 37.5 43.5 73
Climatography of the United States No
 Climate Division: CA 6 NWS Call Sign: Month (1) Min (2) Month(1) Extremes Lowest (2) Temperature ( F) Lowest Month(1) Degree s (1) Base Temp 65 Heating Cooling 100 Number of s (3) Jan 69.4 46.6 58.0 92
REGIONAL CLIMATE SIMULATION OVER ASIA UNDER THE GLOBAL WARMING NESTED IN THE CCSR/NIES AGCM
 REGIONAL CLIMATE SIMULATION OVER ASIA UNDER THE GLOBAL WARMING NESTED IN THE CCSR/NIES AGCM KOJI DAIRAKU Atmospheric Environment Division, National Institute for Environmental Studies, 16-2 Onogawa Tsukuba,
Climatography of the United States No
 Climate Division: CA 4 NWS Call Sign: Month (1) Min (2) Month(1) Extremes Lowest (2) Temperature ( F) Lowest Month(1) Degree s (1) Base Temp 65 Heating Cooling 1 Number of s (3) Jan 58.5 38.8 48.7 79 1962
Climatography of the United States No
 Climate Division: CA 6 NWS Call Sign: Month (1) Min (2) Month(1) Extremes Lowest (2) Temperature ( F) Lowest Month(1) Degree s (1) Base Temp 65 Heating Cooling 1 Number of s (3) Jan 67.5 42. 54.8 92 1971
Climatography of the United States No
 Climate Division: CA 1 NWS Call Sign: Month (1) Min (2) Month(1) Extremes Lowest (2) Temperature ( F) Lowest Month(1) Degree s (1) Base Temp 65 Heating Cooling 1 Number of s (3) Jan 57.8 39.5 48.7 85 1962
American International Journal of Research in Science, Technology, Engineering & Mathematics
 American International Journal of Research in Science, Technology, Engineering & Mathematics Available online at http://www.iasir.net ISSN (Print): 2328-3491, ISSN (Online): 2328-3580, ISSN (CD-ROM): 2328-3629
Regents Earth Science Unit 7: Water Cycle and Climate
 Regents Earth Science Unit 7: Water Cycle and Climate Name Section Coastal and Continental Temperature Ranges Lab # Introduction: There are large variations in average monthly temperatures among cities
SEPTEMBER 2013 REVIEW
 Monthly Long Range Weather Commentary Issued: October 21, 2013 Steven A. Root, CCM, President/CEO sroot@weatherbank.com SEPTEMBER 2013 REVIEW Climate Highlights The Month in Review The average temperature
The Climate of Seminole County
 The Climate of Seminole County Seminole County is part of the Crosstimbers. This region is a transition region from the Central Great Plains to the more irregular terrain of southeastern Oklahoma. Average
Investigation of Rainfall Trend in Jorhat Town, Assam, India
 EUROPEAN ACADEMIC RESEARCH Vol. II, Issue 7/ October 2014 ISSN 2286-4822 www.euacademic.org Impact Factor: 3.1 (UIF) DRJI Value: 5.9 (B+) Investigation of Rainfall Trend in Jorhat Town, MAYURAKSHI BHUYAN
The Global Scope of Climate. The Global Scope of Climate. Keys to Climate. Chapter 8
 The Global Scope of Climate Chapter 8 The Global Scope of Climate In its most general sense, climate is the average weather of a region, but except where conditions change very little during the course
Funding provided by NOAA Sectoral Applications Research Project CLIMATE. Basic Climatology Colorado Climate Center
 Funding provided by NOAA Sectoral Applications Research Project CLIMATE Basic Climatology Colorado Climate Center Remember These? Factor 1: Our Energy Source Factor 2: Revolution & Tilt Factor 3: Rotation!
Climatography of the United States No
 Climate Division: ND 8 NWS Call Sign: BIS Month (1) Min (2) Month(1) Extremes Lowest (2) Temperature ( F) Lowest Month(1) Degree s (1) Base Temp 65 Heating Cooling 100 Number of s (3) Jan 21.1 -.6 10.2
Climatography of the United States No
 Climate Division: TN 1 NWS Call Sign: Month (1) Min (2) Month(1) Extremes Lowest (2) Temperature ( F) Lowest Month(1) Degree s (1) Base Temp 65 Heating Cooling 100 Number of s (3) Jan 47.6 24.9 36.3 81