Observation based gridded climate data in Norway motivations, experiences, challenges, considerations..
|
|
|
- Jocelin Fletcher
- 6 years ago
- Views:
Transcription


1 Observation based gridded climate data in Norway motivations, experiences, challenges, considerations.. Ole Einar Tveito and Cristian Lussana Norwegian Meteorological Institute
2 Foto: MORTEN AAKRE, FOTOGRAFEN AS EGERSUND Photo:Tor Magne Gausdal Foto: CARINA JOHANSEN, VG Kilde: NRK Foto: Svanhill Eilertsen Lervik

3 Foto: MORTEN AAKRE, FOTOGRAFEN AS EGERSUND Photo:Tor Magne Gausdal Foto: CARINA JOHANSEN, VG Kilde: NRK Foto: Svanhill Eilertsen Lervik
4 Precipitation

5 Days with precipitation
6 Number of days > p(0.99)


7 Trends in 1-day precipitation exceeding 10 mm A.V. Dyrrdal et al 2012 Dyrrdal, A.V., Isaksen, K., Hygen, H.O., and Meyer, N.K., 2012: Changes in meteorological variables that can trigger natural hazards in Norway. Climate Research, 55:
8 Norwegian annual temperatures
9 Norwegian annual temperatures
10 Norwegian annual temperatures
11
12 Gridding of observation - aims to Provide climate information at any location or area of interest Provide data at relevant scales for various applications and purposes: - Hydrology - Agriculture and forestry - Infrastructure (roads, railways, electricity grids, municipalities) - Dam safety - Energy - Tourism -. Design values Provide a observation basis for understanding and adapting to climate change Truth for calibrating post-processing (bias adjustment) of RCM / Dyn.Downscaling of climate projection data.
13 Gridded observation data sets at Met Norway. Monthly, seasonal and annual data - Period: 1900-present - Variables: Temperature, Precipitation - Methods: Spline interpolation of monthly anomalies. - Derived products: Degree day grids. Daily values (two parallel datasets) - Period: present - Variables: Temperature, Precipitation, Wind (in development) - Methods: Ver.1: Residual Kriging (temperature), Triangulation with terrain dependence (precipitation) Ver. 2: Bayesian spatial optimum interpolation (under operationalization) Wind: Downcaling/post-processing of Hindcast data applying analogues from high res NWPmodel and smart neighbour weighting - Datasets covering Fennoscandia based on both ver.1 and 2 are in progress as a part of the FP7 UERRA project. Hourly values - Period: 2010-present - Variables: Temperature and precipitation - Bayesian spatial optimum interpolation (under operationalization) Spatial resolution: 1x1 km Access: Open data
14 What makes observation gridding challenging? Resolution - Spatial sampling problem. - Temporal signal to noise ratio. Observation density and representativity Networks are - Sparse - Biased Elevation zones Environment/Land Use: Are the environments of the observation stations representative for all types of environments? (Open field vs. forests or cities?) Statistical assumption vs physical processes - Assume stationarity (2.order spatial ) - Assume isotropy

15 Elevation Standard deviation of terrain ~10 km influence area
16 The distribution of elevation Frequency Elevation
17 The distribution of elevation Frequency Elevation
18 The distribution of elevation & temperature stations Frequency Elevation
19 The distribution of elevation & temperature stations 57/195 masl 480/554 masl Frequency Elevation


20 Gridding challenges (i) Observation gridding is basically based on statistical relations - Quality depends on station density and representativity of the station network. The choice of external predictor should be based on a good understanding of the physical processes of the predictand (on a local scale).
21 Spatial covariance! γγ (h) = 1 2NN(hh) nn xx ii xx jj 2 jj,ii h iiii NN(hh)
22 Spatial covariance Long term monthly mean (normal)
23 Spatial covariance Monthly mean
24 Spatial covariance Daily mean
25 Normal Monthly Daily

26 Distances Euclidean? 2D


27 Distances multi-dimensional 3D 10 m vertical = 1 km horizontal 3D 1 m vertical = 1 km horizontal
28 Concept Include e.g. elevation in the distance function 3D distance. Put stations at same (elevation) level closer to each other. Include a elevation coefficient; k z Weight the impact of elevation differences May vary in time and space h = xx 2 + yy 2 + (kk zz zz) 2 Different k s are applied (λ s in examples from Switzerland) based on a priori first guess choices and a c-v selection of the best fit. (OI approach). Could be further extended to include anisotropy and more location dependent parameters: h = aaxx 2 + bbyy 2 + (κκ ii Ζ ii ) 2 nn ii=1

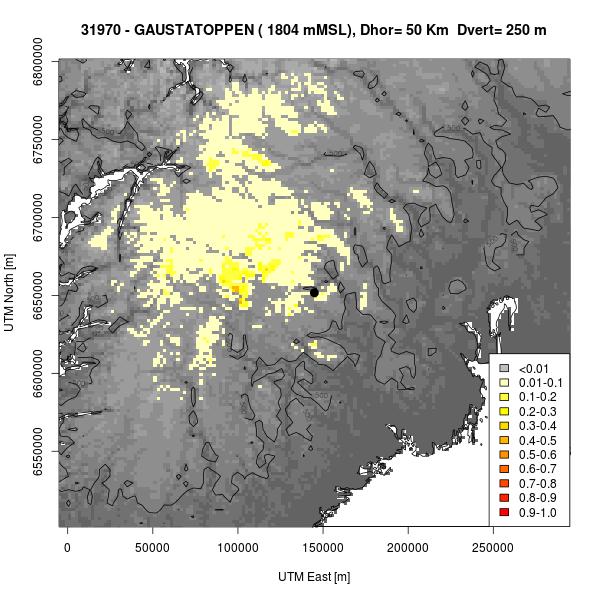


29 Gaustatoppen (1883 masl), λ=0 λ=50 Ove Bergersen, λ=100 λ=200
 λ=10 λ=30 λ=100 Courtesy of Christoph Frei (Frei 2014 (Int. J. Climatol.")
30 Non-Eucledian Spatial Representativity Distance from Visp in km (valley-floor) λ=10 km λ=30 λ=100 Distance from Pilatus in km (mountain peak) λ=10 λ=30 λ=100 Courtesy of Christoph Frei (Frei 2014 (Int. J. Climatol.))
31 Operational observation gridding in Norway
32 Daily mean temperature 16.March 2015 Klimagrid 1.1 Temperature and precipitation Daily precipitation 29.October 2014 Period: present Resolution: 1x1 km Cover mainland Norway.
 + α β ( ) + + α ( )} t ( u0 ) = λ t(ui )")
 Predictor fields: External")

33 Klimagrid v1.1 Temperature Residual interpolation: ^ n { α + α β ( ) + α β ( ) + + α ( )} t ( u0 ) = λ t(ui ) + i u0 2 2 u0... mβm u0 i= 1 Kriging (or any spatial interpolation method) Predictor fields: External trend/drift (linear regression) Correlation coefficients Jan Feb Mar Apr May Jun Jul Aug Sep Oct Nov Dec LAT Month LONG ALT DEM_MEAN DEM_MIN Coefficients terrain Month ALT DEM_MEAN DEM_MIN LAT LONG Coefficients position

34 Trend climatological first guess (monthly)

35 MET Norway TEMP1d - Evaluation Norwegian Meteorological Institute
 senorge: gridded datasets; Norwegian mainland +parts of Sweden and Finland; 1Km resolution source: Observations from MET")
 Temperature hourly (TA) Precipitation daily (RR) Temperature daily mean (TAM) Periods: Hourly datasets 2010")
36 Klimagrid v 2.0 Replace the current Klimagrid1.1 (SeNorge1.1) senorge: gridded datasets; Norwegian mainland +parts of Sweden and Finland; 1Km resolution source: Observations from MET Norway Climate database (manual + automatic weather station data) Precipitation 1h (RR_1) Precipitation 3h (based on hourly observations) Temperature hourly (TA) Precipitation daily (RR) Temperature daily mean (TAM) Periods: Hourly datasets onwards (hourly updated) Daily datasets onwards (updated daily)


37 Large(coarser) scale trend estimation Klimagrid 2.0 TEMP1d: OI + OI introduces the Local(finer) scale


38 Old method New method New method reduce estimation error. (RMSE, independent cross-validation)
 indicator interpolation.")
39 Precipitation gridding Non-continuous, in time and space Skew distribution, with lower boundary. A two-step procedure normally applied: - Define areas with precipitation (above a certain threshold) indicator interpolation. - Define precipitation amounts in those grid cells.


40 Precipitation v1.1 Triangulation. Includes elevation dependence. Correction for wind-loss. - = x =
 - Contiguous Precipitation Areas (CPAs) identification and labeling Iterative loop over Events - Multiscale")
41 Precip v procedure Identification of Events - Precipitation yes/no distinction (gridpoints) - Contiguous Precipitation Areas (CPAs) identification and labeling Iterative loop over Events - Multiscale Optimal Interpolation Event coarser scale At coarser spatial scales, precipitation events have a less Cascade of spatial scales: complex (smoother) from coarser to finer levels representation.... Event finer scale information At finer spatial scales, the measured precipitation shows a greater variability.... Prec Intensity strong weak
42 Multiscale modified OI 520 Km 260 Km 520 Km 260 Km 120 Km 120 Km 60 Km 60 Km Final result

43 Multiscale modified OI
 (given the Station distribution) Event A Event B Event C")
44 Spatial Interpolation Method based on Multi-scale Optimal Interpolation (Prec) Step 0: Identification of Precipitation Events (Observed Areas of Precipitation) (given the Station distribution) Event A Event B Event C Events D,...

45 Multi-Scale Optimal Interpolation Step-by-step: from coarser to local scale Norwegian Meteorological Institute
46 Multi-Scale Optimal Interpolation Step-by-step: predicted field Norwegian Meteorological Institute
 525 stations, daily precipitation Old")
47 The importance of Station density 150 stations, 1h precipitation, (Figure shows 24h Prec) 525 stations, daily precipitation Old method
48 Convective rainstorm in Norway (7.July 2014) Radar Automatic weather stations Combination radar+raingauges Norwegian Meteorological Institute
 in «an ensemble» mode - Analogue techniques - Atm. circulation as conditional input?")
49 Gridding challenges Daily Hourly - Sub-hourly needed for city planning Combine datasources - In-situ observations - Radar - Satellite data - Model fields (NWP, RA) Ensemble gridding/uncertainty assessment - Conditional stochastic simulations - Bayesian statistical analysis (OI) in «an ensemble» mode - Analogue techniques - Atm. circulation as conditional input? - Observations itself set the conditions?

50 Atmospheric circulation & precipitation Precipitation distribution depends on the circulation, and small changes in the atm. circulation will have large impact on the precipitation patterns. Weather types/circulation indices can therefore be used to give conditional parameterisation of spatial interpolation algorithms of precipitation as well as temperature and other climatic elements.


51 Gridded climate indicators
52 Mean annual precipitation Gridded climate indicators Climate indicators are condensed climate information to meet specific user demands. Mean annual temperature Degree days and degree day sums - Growing - Heating Nr of days or aggregated sums above/under given thresholds. Seasons Presented as maps, or as point or area averaged time series.
53 Norwegian annual temperatures
54 Heating degree days HHHHHH = (17 TTTTTT) TTTTTT < 10

55 Growing season, length
56 Growing degreedays in Oslo-Blindern


57 Change of the growing season, HadA GDDDD = (TTTTTT 5) TTTTTT > Norwegian Meteorological Institute
58 Days > 20 C
59 Days > 20 C
60 Days > 20 C

61 Days > 20 C, Western Norway
62 Days > 20 C

63 RCP 4.5 RCP 8.5
64 Shorter winters! Norwegian less dominant in cross-country skiing? - We will still have areas with winter conditions though..
65 Gridding challenges/conclusions High resolution timeseries are more «noisy» than long-term data series spatial covariance is lower (estimates are more uncertain) and the «signal» is weaker. Physical consistency between elements (precip, temperature) will not be retained. That s also an issue with atmospheric models that include parametrizations For long-term data with «low» (daily, monthly.) resolution observation gridding provide useful and precise information. For historical dataseries (> 50 years) it is probably the best (only) reference.
66 Future? NWP, RCM and RRA models are «chasing» the spatial resolution of observation gridding. - Provide more physical consistent data - Wind, humidity, in complex terrain - Spatial scale is an issue. 4-5 x the resolution. The gap between observation gridding and atmospheric model approaches for providing climatological data are ready be closed. - Apply gridding concepts in post processing of NWP/RA - Apply NWP/RA fields as first guess - Gridded observations needed for independent validation and bias adjustments of physical atmospheric models Apply radar and satellite data. (How to) Apply soft information (and citizen data)? - Lower quality, higher density, - complementary data, in addition (and not instead of) regular observations. - How to utilize less reliable (fuzzy) information


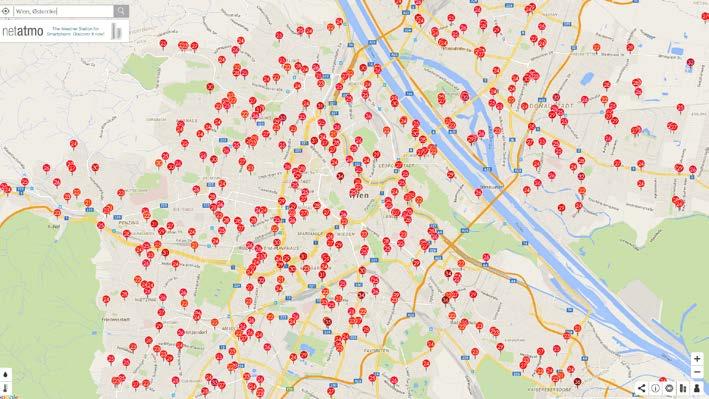
67 Citizen data, example NetAtmo
68 Access to data & algorithms Openess!!! Open source software and algorithms - R - GitHub Open access data - MET Norway have a open data policy since Europe is opening up Stimulate partnerships & cooperations


69 Thank you Norwegian Meteorological Institute


70 Norwegian Meteorological Institute
Gridded observation data for Climate Services
 Gridded observation data for Climate Services Ole Einar Tveito, Inger Hanssen Bauer, Eirik J. Førland and Cristian Lussana Norwegian Meteorological Institute Norwegian annual temperatures Norwegian annual
Spatial Interpolation of daily Temperature and Precipitation for the Fennoscandia
 Spatial Interpolation of daily Temperature and Precipitation for the Fennoscandia Cristian Lussana and Ole Einar Tveito (1) Norwegian Meteorological Institute, Oslo 30.10.2015 10th EUMETNET Data Management
The Norwegian Centre for Climate Services - NCCS
 The Norwegian Centre for Climate Services - NCCS Extremes Products - Dissemination Eirik J. Førland, Norwegian Meteorological Institute, Oslo, Norway Impact assessment consultation workshop, Budapest,
Characterization of the solar irradiation field for the Trentino region in the Alps
 Characterization of the solar irradiation field for the Trentino region in the Alps L. Laiti*, L. Giovannini and D. Zardi Atmospheric Physics Group University of Trento - Italy outline of the talk Introduction
Presentation of met.no s experience and expertise related to high resolution reanalysis
 Presentation of met.no s experience and expertise related to high resolution reanalysis Oyvind Saetra, Ole Einar Tveito, Harald Schyberg and Lars Anders Breivik Norwegian Meteorological Institute Daily
COUPLING A DISTRIBUTED HYDROLOGICAL MODEL TO REGIONAL CLIMATE MODEL OUTPUT: AN EVALUATION OF EXPERIMENTS FOR THE RHINE BASIN IN EUROPE
 P.1 COUPLING A DISTRIBUTED HYDROLOGICAL MODEL TO REGIONAL CLIMATE MODEL OUTPUT: AN EVALUATION OF EXPERIMENTS FOR THE RHINE BASIN IN EUROPE Jan Kleinn*, Christoph Frei, Joachim Gurtz, Pier Luigi Vidale,
2003 Water Year Wrap-Up and Look Ahead
 2003 Water Year Wrap-Up and Look Ahead Nolan Doesken Colorado Climate Center Prepared by Odie Bliss http://ccc.atmos.colostate.edu Colorado Average Annual Precipitation Map South Platte Average Precipitation
Gridding of precipitation and air temperature observations in Belgium. Michel Journée Royal Meteorological Institute of Belgium (RMI)
") Gridding of precipitation and air temperature observations in Belgium Michel Journée Royal Meteorological Institute of Belgium (RMI) Gridding of meteorological data A variety of hydrologic, ecological,
Gridding of precipitation and air temperature observations in Belgium Michel Journée Royal Meteorological Institute of Belgium (RMI) Gridding of meteorological data A variety of hydrologic, ecological,
Global Climates. Name Date
 Global Climates Name Date No investigation of the atmosphere is complete without examining the global distribution of the major atmospheric elements and the impact that humans have on weather and climate.
Seasonal Climate Watch June to October 2018
 Seasonal Climate Watch June to October 2018 Date issued: May 28, 2018 1. Overview The El Niño-Southern Oscillation (ENSO) has now moved into the neutral phase and is expected to rise towards an El Niño
Quantification of energy losses caused by blade icing and the development of an Icing Loss Climatology
 Quantification of energy losses caused by blade icing and the development of an Icing Loss Climatology Using SCADA data from Scandinavian wind farms Staffan Lindahl Winterwind 201 1 SAFER, SMARTER, GREENER
Met Éireann Climatological Note No. 15 Long-term rainfall averages for Ireland,
 Met Éireann Climatological Note No. 15 Long-term rainfall averages for Ireland, 1981-2010 Séamus Walsh Glasnevin Hill, Dublin 9 2016 Disclaimer Although every effort has been made to ensure the accuracy
A re-sampling based weather generator
 A re-sampling based weather generator Sara Martino 1 Joint work with T. Nipen 2 and C. Lussana 2 1 Sintef Energy Resources 2 Norwegian Metereologic Institute Stockholm 7th Dec. 2017 Sara Martino Joint
APPLICATIONS OF DOWNSCALING: HYDROLOGY AND WATER RESOURCES EXAMPLES
 APPLICATIONS OF DOWNSCALING: HYDROLOGY AND WATER RESOURCES EXAMPLES Dennis P. Lettenmaier Department of Civil and Environmental Engineering For presentation at Workshop on Regional Climate Research NCAR
Model Output Statistics (MOS)
") Model Output Statistics (MOS) Numerical Weather Prediction (NWP) models calculate the future state of the atmosphere at certain points of time (forecasts). The calculation of these forecasts is based on
Model Output Statistics (MOS) Numerical Weather Prediction (NWP) models calculate the future state of the atmosphere at certain points of time (forecasts). The calculation of these forecasts is based on
BAYESIAN PROCESSOR OF OUTPUT FOR PROBABILISTIC FORECASTING OF PRECIPITATION OCCURRENCE. Coire J. Maranzano. Department of Systems Engineering
 BAYESIAN PROCESSOR OF OUTPUT FOR PROBABILISTIC FORECASTING OF PRECIPITATION OCCURRENCE By Coire J. Maranzano Department of Systems Engineering University of Virginia P.O. Box 400747 Charlottesville, VA
Variability and trends in daily minimum and maximum temperatures and in diurnal temperature range in Lithuania, Latvia and Estonia
 Variability and trends in daily minimum and maximum temperatures and in diurnal temperature range in Lithuania, Latvia and Estonia Jaak Jaagus Dept. of Geography, University of Tartu Agrita Briede Dept.
Drought in Southeast Colorado
 Drought in Southeast Colorado Nolan Doesken and Roger Pielke, Sr. Colorado Climate Center Prepared by Tara Green and Odie Bliss http://climate.atmos.colostate.edu 1 Historical Perspective on Drought Tourism
Smoothed Prediction of the Onset of Tree Stem Radius Increase Based on Temperature Patterns
 Smoothed Prediction of the Onset of Tree Stem Radius Increase Based on Temperature Patterns Mikko Korpela 1 Harri Mäkinen 2 Mika Sulkava 1 Pekka Nöjd 2 Jaakko Hollmén 1 1 Helsinki
The Climate of Oregon Climate Zone 4 Northern Cascades
 /05 E55 Unbound issue No. 9/ is Does not circulate Special Report 916 May 1993 The Climate of Oregon Climate Zone 4 Property of OREGON STATE UNIVERSITY Library Serials Corvallis, OR 97331-4503 Agricultural
Technical note on seasonal adjustment for M0
 Technical note on seasonal adjustment for M0 July 1, 2013 Contents 1 M0 2 2 Steps in the seasonal adjustment procedure 3 2.1 Pre-adjustment analysis............................... 3 2.2 Seasonal adjustment.................................
Regional climate-change downscaling for hydrological applications using a nonhomogeneous hidden Markov model
 Regional climate-change downscaling for hydrological applications using a nonhomogeneous hidden Markov model Water for a Healthy Country Flagship Steve Charles IRI Seminar, September 3, 21 Talk outline
Combining Deterministic and Probabilistic Methods to Produce Gridded Climatologies
 Combining Deterministic and Probabilistic Methods to Produce Gridded Climatologies Michael Squires Alan McNab National Climatic Data Center (NCDC - NOAA) Asheville, NC Abstract There are nearly 8,000 sites
Climatography of the United States No
 Climate Division: CA 5 NWS Call Sign: Elevation: 6 Feet Lat: 37 Month (1) Min (2) Month(1) Extremes Lowest (2) Temperature ( F) Lowest Month(1) Degree s (1) Base Temp 65 Heating Cooling 1 Number of s (3)
Climatography of the United States No
 Climate Division: CA 4 NWS Call Sign: Elevation: 2 Feet Lat: 37 Month (1) Min (2) Month(1) Extremes Lowest (2) Temperature ( F) Lowest Month(1) Degree s (1) Base Temp 65 Heating Cooling 1 Number of s (3)
Climatography of the United States No
 Climate Division: CA 4 NWS Call Sign: Elevation: 13 Feet Lat: 36 Month (1) Min (2) Month(1) Extremes Lowest (2) Temperature ( F) Lowest Month(1) Degree s (1) Base Temp 65 Heating Cooling 1 Number of s
Climatography of the United States No
 Climate Division: CA 5 NWS Call Sign: Elevation: 1,14 Feet Lat: 36 Month (1) Min (2) Month(1) Extremes Lowest (2) Temperature ( F) Lowest Month(1) Degree s (1) Base Temp 65 Heating Cooling 1 Number of
Specialist rainfall scenarios and software package
 Building Knowledge for a Changing Climate Specialist rainfall scenarios and software package Chris Kilsby Ahmad Moaven-Hashemi Hayley Fowler Andrew Smith Aidan Burton Michael Murray University of Newcastle
Applications/Users for Improved S2S Forecasts
 Applications/Users for Improved S2S Forecasts Nolan Doesken Colorado Climate Center Colorado State University WSWC Precipitation Forecasting Workshop June 7-9, 2016 San Diego, CA First -- A short background
Standardized Anomaly Model Output Statistics Over Complex Terrain.
 Standardized Anomaly Model Output Statistics Over Complex Terrain Reto.Stauffer@uibk.ac.at Outline statistical ensemble postprocessing introduction to SAMOS new snow amount forecasts in Tyrol sub-seasonal
Changing Hydrology under a Changing Climate for a Coastal Plain Watershed
 Changing Hydrology under a Changing Climate for a Coastal Plain Watershed David Bosch USDA-ARS, Tifton, GA Jeff Arnold ARS Temple, TX and Peter Allen Baylor University, TX SEWRU Objectives 1. Project changes
Climatography of the United States No
 Climate Division: CA 6 NWS Call Sign: LAX Elevation: 1 Feet Lat: 33 Month (1) Min (2) Month(1) Extremes Lowest (2) Temperature ( F) Lowest Month(1) Degree s (1) Base Temp 65 Heating Cooling 1 Number of
Climatography of the United States No
 Climate Division: CA 6 NWS Call Sign: TOA Elevation: 11 Feet Lat: 33 2W Temperature ( F) Month (1) Min (2) Month(1) Extremes Lowest (2) Lowest Month(1) Degree s (1) Base Temp 65 Heating Cooling 1 Number
Climatography of the United States No
 Climate Division: AK 5 NWS Call Sign: ANC Month (1) Min (2) Month(1) Extremes Lowest (2) Temperature ( F) Lowest Month(1) Degree s (1) Base Temp 65 Heating Cooling 90 Number of s (3) Jan 22.2 9.3 15.8
Trends in floods in small Norwegian catchments instantaneous vs daily peaks
 42 Hydrology in a Changing World: Environmental and Human Dimensions Proceedings of FRIEND-Water 2014, Montpellier, France, October 2014 (IAHS Publ. 363, 2014). Trends in floods in small Norwegian catchments
APPENDIX G-7 METEROLOGICAL DATA
 APPENDIX G-7 METEROLOGICAL DATA METEOROLOGICAL DATA FOR AIR AND NOISE SAMPLING DAYS AT MMR Monthly Normals and Extremes for Honolulu International Airport Table G7-1 MMR RAWS Station Hourly Data Tables
Sunshine duration climate maps of Belgium and Luxembourg based on Meteosat and in-situ observations
 Open Sciences doi:1.5194/asr-1-15-213 Author(s) 213. CC Attribution 3. License. Advances in Science & Research Open Access Proceedings Drinking Water Engineering and Science Sunshine duration climate maps
S e a s o n a l F o r e c a s t i n g f o r t h e E u r o p e a n e n e r g y s e c t o r
 S e a s o n a l F o r e c a s t i n g f o r t h e E u r o p e a n e n e r g y s e c t o r C3S European Climatic Energy Mixes (ECEM) Webinar 18 th Oct 2017 Philip Bett, Met Office Hadley Centre S e a s
4.5 Comparison of weather data from the Remote Automated Weather Station network and the North American Regional Reanalysis
 4.5 Comparison of weather data from the Remote Automated Weather Station network and the North American Regional Reanalysis Beth L. Hall and Timothy. J. Brown DRI, Reno, NV ABSTRACT. The North American
Seasonal Climate Watch April to August 2018
 Seasonal Climate Watch April to August 2018 Date issued: Mar 23, 2018 1. Overview The El Niño-Southern Oscillation (ENSO) is expected to weaken from a moderate La Niña phase to a neutral phase through
At the start of the talk will be a trivia question. Be prepared to write your answer.
 Operational hydrometeorological forecasting activities of the Australian Bureau of Meteorology Thomas Pagano At the start of the talk will be a trivia question. Be prepared to write your answer. http://scottbridle.com/
statistical methods for tailoring seasonal climate forecasts Andrew W. Robertson, IRI
 statistical methods for tailoring seasonal climate forecasts Andrew W. Robertson, IRI tailored seasonal forecasts why do we make probabilistic forecasts? to reduce our uncertainty about the (unknown) future
The Australian Operational Daily Rain Gauge Analysis
 The Australian Operational Daily Rain Gauge Analysis Beth Ebert and Gary Weymouth Bureau of Meteorology Research Centre, Melbourne, Australia e.ebert@bom.gov.au Daily rainfall data and analysis procedure
Climatography of the United States No
 No. 2 1971-2 Asheville, North Carolina 2881 COOP ID: 46175 Climate Division: CA 6 NWS Call Sign: 3L3 Elevation: 1 Feet Lat: 33 Month (1) Min (2) Month(1) Extremes Lowest (2) Temperature ( F) Lowest Month(1)
Climatography of the United States No
 No. 2 1971-2 Asheville, North Carolina 2881 COOP ID: 42713 Climate Division: CA 7 NWS Call Sign: Elevation: -3 Feet Lat: 32 Month (1) Min (2) Month(1) Extremes Lowest (2) Temperature ( F) Lowest Month(1)
Climate Change Impact Assessment on Long Term Water Budget for Maitland Catchment in Southern Ontario
 215 SWAT CONFERENCE, PURDUE Climate Change Impact Assessment on Long Term Water Budget for Maitland Catchment in Southern Ontario By Vinod Chilkoti Aakash Bagchi Tirupati Bolisetti Ram Balachandar Contents
NRCSE. Misalignment and use of deterministic models
 NRCSE Misalignment and use of deterministic models Work with Veronica Berrocal Peter Craigmile Wendy Meiring Paul Sampson Gregory Nikulin The choice of spatial scale some questions 1. Which spatial scale
Comparing the SEKF with the DEnKF on a land surface model
 Comparing the SEKF with the DEnKF on a land surface model David Fairbairn, Alina Barbu, Emiliano Gelati, Jean-Francois Mahfouf and Jean-Christophe Caret CNRM - Meteo France Partly funded by European Union
Some details about the theoretical background of CarpatClim DanubeClim gridded databases and their practical consequences
 Some details about the theoretical background of CarpatClim DanubeClim gridded databases and their practical consequences Zita Bihari, Tamás Szentimrey, Andrea Kircsi Hungarian Meteorological Service Outline
The Climate of Oregon Climate Zone 3 Southwest Interior
 .k) 105 Unbound issue " " 1 4oes not circulate C4P. Special Report 915 May 1993 The Climate of Oregon Climate Zone 3 Southwest Interior Property of OREGON STATE UNIVERSITY Library Serials Corvallis, OR
UPPLEMENT A COMPARISON OF THE EARLY TWENTY-FIRST CENTURY DROUGHT IN THE UNITED STATES TO THE 1930S AND 1950S DROUGHT EPISODES
 UPPLEMENT A COMPARISON OF THE EARLY TWENTY-FIRST CENTURY DROUGHT IN THE UNITED STATES TO THE 1930S AND 1950S DROUGHT EPISODES Richard R. Heim Jr. This document is a supplement to A Comparison of the Early
Current and Future Impacts of Wildfires on PM 2.5, Health, and Policy in the Rocky Mountains
 Current and Future Impacts of Wildfires on PM 2.5, Health, and Policy in the Rocky Mountains Yang Liu, Ph.D. STAR Grants Kick-off Meeting Research Triangle Park, NC April 5, 2017 Motivation The Rocky Mountains
A re-sampling based weather generator
 A re-sampling based weather generator Sara Martino 1 Joint work with T. Nipen 2 and C. Lussana 2 1 Sintef Energy Resources 2 Norwegian Metereologic Institute Berlin 19th Sept. 2017 Sara Martino Joint work
Utilization of seasonal climate predictions for application fields Yonghee Shin/APEC Climate Center Busan, South Korea
 The 20 th AIM International Workshop January 23-24, 2015 NIES, Japan Utilization of seasonal climate predictions for application fields Yonghee Shin/APEC Climate Center Busan, South Korea Background Natural
peak half-hourly New South Wales
 Forecasting long-term peak half-hourly electricity demand for New South Wales Dr Shu Fan B.S., M.S., Ph.D. Professor Rob J Hyndman B.Sc. (Hons), Ph.D., A.Stat. Business & Economic Forecasting Unit Report
Climate Change Impact Analysis
 Climate Change Impact Analysis Patrick Breach M.E.Sc Candidate pbreach@uwo.ca Outline July 2, 2014 Global Climate Models (GCMs) Selecting GCMs Downscaling GCM Data KNN-CAD Weather Generator KNN-CADV4 Example
GAMINGRE 8/1/ of 7
 FYE 09/30/92 JULY 92 0.00 254,550.00 0.00 0 0 0 0 0 0 0 0 0 254,550.00 0.00 0.00 0.00 0.00 254,550.00 AUG 10,616,710.31 5,299.95 845,656.83 84,565.68 61,084.86 23,480.82 339,734.73 135,893.89 67,946.95
Fig.3.1 Dispersion of an isolated source at 45N using propagating zonal harmonics. The wave speeds are derived from a multiyear 500 mb height daily
 Fig.3.1 Dispersion of an isolated source at 45N using propagating zonal harmonics. The wave speeds are derived from a multiyear 500 mb height daily data set in January. The four panels show the result
Adaptation for global application of calibration and downscaling methods of medium range ensemble weather forecasts
 Adaptation for global application of calibration and downscaling methods of medium range ensemble weather forecasts Nathalie Voisin Hydrology Group Seminar UW 11/18/2009 Objective Develop a medium range
ECMWF: Weather and Climate Dynamical Forecasts
 ECMWF: Weather and Climate Dynamical Forecasts Medium-Range (0-day) Partial coupling Extended + Monthly Fully coupled Seasonal Forecasts Fully coupled Atmospheric model Atmospheric model Wave model Wave
Land Data Assimilation at NCEP NLDAS Project Overview, ECMWF HEPEX 2004
 Dag.Lohmann@noaa.gov, Land Data Assimilation at NCEP NLDAS Project Overview, ECMWF HEPEX 2004 Land Data Assimilation at NCEP: Strategic Lessons Learned from the North American Land Data Assimilation System
Seasonal Climate Watch July to November 2018
 Seasonal Climate Watch July to November 2018 Date issued: Jun 25, 2018 1. Overview The El Niño-Southern Oscillation (ENSO) is now in a neutral phase and is expected to rise towards an El Niño phase through
Climatography of the United States No
 Month (1) Min (2) Month(1) Extremes Lowest (2) Temperature ( F) Lowest Month(1) Degree s (1) Base Temp 65 Heating Cooling 100 Number of s (3) Jan 63.9 39.3 51.6 86 1976 16 56.6 1986 20 1976 2 47.5 1973
Climatography of the United States No
 Temperature ( F) Month (1) Min (2) Month(1) Extremes Lowest (2) Lowest Month(1) Degree s (1) Base Temp 65 Heating Cooling 100 Number of s (3) Jan 32.8 21.7 27.3 62 1918 1 35.8 1983-24 1950 29 10.5 1979
Country Presentation-Nepal
 Country Presentation-Nepal Mt.Everest, Shiva Pd. Nepal, DHM South Asia Drought Monitor Workshop Dhaka Bangladesh 2 th April 215 Overview Brief Climatology Climate activities- DHM PPCR (Pilot Program for
Prairie Climate Centre Prairie Climate Atlas. Visualizing Climate Change Projections for the Canadian Prairie Provinces
 Prairie Climate Centre Prairie Climate Atlas Visualizing Climate Change Projections for the Canadian Prairie Provinces Acknowledgements About Us Dr. Danny Blair Dr. Ian Mauro Ryan Smith, MSc Dr. Hank Venema
8-km Historical Datasets for FPA
 Program for Climate, Ecosystem and Fire Applications 8-km Historical Datasets for FPA Project Report John T. Abatzoglou Timothy J. Brown Division of Atmospheric Sciences. CEFA Report 09-04 June 2009 8-km
Hail and the Climate System: Large Scale Environment Relationships for the Continental United States
 Hail and the Climate System: Large Scale Environment Relationships for the Continental United States 1979-2012 John T. Allen jallen@iri.columbia.edu Co-author: Michael K. Tippett WWOSC 2014, Thursday August
Application and verification of ECMWF products in Austria
 Application and verification of ECMWF products in Austria Central Institute for Meteorology and Geodynamics (ZAMG), Vienna Alexander Kann, Klaus Stadlbacher 1. Summary of major highlights Medium range
The Climate of Oregon Climate Zone 5 High Plateau
 105 E55 Unbound issue i". 9 13oes not circulate CZe Special Report 917 May 1993 The Climate of Oregon Climate Zone 5 Property of OREGON STATE UNIVERSITY Library Serials Corvallis, OR 97331-4503 Agricultural
5.0 WHAT IS THE FUTURE ( ) WEATHER EXPECTED TO BE?
 WEATHER EXPECTED TO BE?") 5.0 WHAT IS THE FUTURE (2040-2049) WEATHER EXPECTED TO BE? This chapter presents some illustrative results for one station, Pearson Airport, extracted from the hour-by-hour simulations of the future period
5.0 WHAT IS THE FUTURE (2040-2049) WEATHER EXPECTED TO BE? This chapter presents some illustrative results for one station, Pearson Airport, extracted from the hour-by-hour simulations of the future period
METinfo Verification of Operational Weather Prediction Models December 2017 to February 2018 Mariken Homleid and Frank Thomas Tveter
 METinfo No. /8 ISSN 89-79X Meteorology Verification of Operational Weather Prediction Models December 7 to February 8 Mariken Homleid and Frank Thomas Tveter Photo: Jan Erik Haugen Contents Introduction
The Canadian ADAGIO Project for Mapping Total Atmospheric Deposition
 The Canadian ADAGIO Project for Mapping Total Atmospheric Deposition Amanda S. Cole Environment & Climate Change Canada (ECCC) MMF-GTAD Workshop Geneva, Switzerland February 28, 2017 ADAGIO team Amanda
Funding provided by NOAA Sectoral Applications Research Project CLIMATE. Basic Climatology Colorado Climate Center
 Funding provided by NOAA Sectoral Applications Research Project CLIMATE Basic Climatology Colorado Climate Center Remember These? Factor 1: Our Energy Source Factor 2: Revolution & Tilt Factor 3: Rotation!
Climatography of the United States No
 Climate Division: CA 4 NWS Call Sign: Month (1) Min (2) Month(1) Extremes Lowest (2) Temperature ( F) Lowest Month(1) Degree s (1) Base Temp 65 Heating Cooling 100 Number of s (3) Jan 55.6 39.3 47.5 77
Climatography of the United States No
 Climate Division: CA 5 NWS Call Sign: Month (1) Min (2) Month(1) Extremes Lowest (2) Temperature ( F) Lowest Month(1) Degree s (1) Base Temp 65 Heating Cooling 100 Number of s (3) Jan 56.6 36.5 46.6 81
Climatography of the United States No
 Climate Division: CA 1 NWS Call Sign: Month (1) Min (2) Month(1) Extremes Lowest (2) Temperature ( F) Lowest Month(1) Degree s (1) Base Temp 65 Heating Cooling 100 Number of s (3) Jan 57.9 38.9 48.4 85
Climatography of the United States No
 Climate Division: CA 5 NWS Call Sign: Month (1) Min (2) Month(1) Extremes Lowest (2) Temperature ( F) Lowest Month(1) Degree s (1) Base Temp 65 Heating Cooling 100 Number of s (3) Jan 44.8 25.4 35.1 72
Climatography of the United States No
 Climate Division: CA 4 NWS Call Sign: Month (1) Min (2) Month(1) Extremes Lowest (2) Temperature ( F) Lowest Month(1) Degree s (1) Base Temp 65 Heating Cooling 100 Number of s (3) Jan 49.4 37.5 43.5 73
How reliable are selected methods of projections of future thermal conditions? A case from Poland
 How reliable are selected methods of projections of future thermal conditions? A case from Poland Joanna Wibig Department of Meteorology and Climatology, University of Łódź, Outline 1. Motivation Requirements
Climatography of the United States No
 Climate Division: CA 6 NWS Call Sign: Month (1) Min (2) Month(1) Extremes Lowest (2) Temperature ( F) Lowest Month(1) Degree s (1) Base Temp 65 Heating Cooling 100 Number of s (3) Jan 69.4 46.6 58.0 92
Climatography of the United States No
 Climate Division: CA 4 NWS Call Sign: Month (1) Min (2) Month(1) Extremes Lowest (2) Temperature ( F) Lowest Month(1) Degree s (1) Base Temp 65 Heating Cooling 1 Number of s (3) Jan 58.5 38.8 48.7 79 1962
Climatography of the United States No
 Climate Division: CA 6 NWS Call Sign: Month (1) Min (2) Month(1) Extremes Lowest (2) Temperature ( F) Lowest Month(1) Degree s (1) Base Temp 65 Heating Cooling 1 Number of s (3) Jan 67.5 42. 54.8 92 1971
Climatography of the United States No
 Climate Division: CA 1 NWS Call Sign: Month (1) Min (2) Month(1) Extremes Lowest (2) Temperature ( F) Lowest Month(1) Degree s (1) Base Temp 65 Heating Cooling 1 Number of s (3) Jan 57.8 39.5 48.7 85 1962
WHEN IS IT EVER GOING TO RAIN? Table of Average Annual Rainfall and Rainfall For Selected Arizona Cities
 WHEN IS IT EVER GOING TO RAIN? Table of Average Annual Rainfall and 2001-2002 Rainfall For Selected Arizona Cities Phoenix Tucson Flagstaff Avg. 2001-2002 Avg. 2001-2002 Avg. 2001-2002 October 0.7 0.0
Supplementary appendix
 Supplementary appendix This appendix formed part of the original submission and has been peer reviewed. We post it as supplied by the authors. Supplement to: Lowe R, Stewart-Ibarra AM, Petrova D, et al.
Climatography of the United States No
 Climate Division: ND 8 NWS Call Sign: BIS Month (1) Min (2) Month(1) Extremes Lowest (2) Temperature ( F) Lowest Month(1) Degree s (1) Base Temp 65 Heating Cooling 100 Number of s (3) Jan 21.1 -.6 10.2
Climatography of the United States No
 Climate Division: TN 1 NWS Call Sign: Month (1) Min (2) Month(1) Extremes Lowest (2) Temperature ( F) Lowest Month(1) Degree s (1) Base Temp 65 Heating Cooling 100 Number of s (3) Jan 47.6 24.9 36.3 81
Climatography of the United States No
 Climate Division: CA 5 NWS Call Sign: FAT Month (1) Min (2) Month(1) Extremes Lowest (2) Temperature ( F) Lowest Month(1) Degree s (1) Base Temp 65 Heating Cooling 1 Number of s (3) Jan 53.6 38.4 46. 78
Climatography of the United States No
 Climate Division: CA 6 NWS Call Sign: 1L2 N Lon: 118 3W Month (1) Min (2) Month(1) Extremes Lowest (2) Temperature ( F) Lowest Month(1) Degree s (1) Base Temp 65 Heating Cooling 1 Number of s (3) Jan 63.7
COUNTRY REPORT. Jakarta. July, th National Directorate of Meteorology and Geophysics of Timor-Leste (DNMG)
") The Southeastern Asia-Oceania Flash Flood COUNTRY REPORT Jakarta. July, 10-12 th 2017 National Directorate of Meteorology and Geophysics of Timor-Leste (DNMG) Carla Feritas and Crisostimo Lobato Democratic
The Southeastern Asia-Oceania Flash Flood COUNTRY REPORT Jakarta. July, 10-12 th 2017 National Directorate of Meteorology and Geophysics of Timor-Leste (DNMG) Carla Feritas and Crisostimo Lobato Democratic
Impacts of climate change on flooding in the river Meuse
 Impacts of climate change on flooding in the river Meuse Martijn Booij University of Twente,, The Netherlands m.j.booij booij@utwente.nlnl 2003 in the Meuse basin Model appropriateness Appropriate model
STATISTICAL ESTIMATION AND RE- ANALYSIS OF PRECIPITATIONS OVER FRENCH MOUNTAIN RANGES
 STATISTICAL ESTIMATION AND RE- ANALYSIS OF PRECIPITATIONS OVER FRENCH MOUNTAIN RANGES USING WEATHER PATTERNS, WATER BALANCES AND SNOW MEASUREMENTS ASSIMILATION Frederic GOTTARDI EDF frederic.gottardi@edf.fr
Climatography of the United States No
 Climate Division: CA 5 NWS Call Sign: BFL Month (1) Min (2) Month(1) Extremes Lowest (2) Temperature ( F) Lowest Month(1) Degree s (1) Base Temp 65 Heating Cooling 1 Number of s (3) Jan 56.3 39.3 47.8
Sierra Weather and Climate Update
 Sierra Weather and Climate Update 2014-15 Kelly Redmond Western Regional Climate Center Desert Research Institute Reno Nevada Yosemite Hydroclimate Workshop Yosemite Valley, 2015 October 8-9 Percent of
Investigation on the use of NCEP/NCAR, MERRA and NCEP/CFSR reanalysis data in wind resource analysis
 Investigation on the use of NCEP/NCAR, MERRA and NCEP/CFSR reanalysis data in wind resource analysis Sónia Liléo, PhD Wind resource analyst - R&D manager O2 Vind AB Stockholm, Sweden sonia.lileo@o2.se
Climate Variability in South Asia
 Climate Variability in South Asia V. Niranjan, M. Dinesh Kumar, and Nitin Bassi Institute for Resource Analysis and Policy Contents Introduction Rainfall variability in South Asia Temporal variability
Time Series Analysis
 Time Series Analysis A time series is a sequence of observations made: 1) over a continuous time interval, 2) of successive measurements across that interval, 3) using equal spacing between consecutive
QualiMET 2.0. The new Quality Control System of Deutscher Wetterdienst
 QualiMET 2.0 The new Quality Control System of Deutscher Wetterdienst Reinhard Spengler Deutscher Wetterdienst Department Observing Networks and Data Quality Assurance of Meteorological Data Michendorfer
Atmospheric circulation analysis for seasonal forecasting
 Training Seminar on Application of Seasonal Forecast GPV Data to Seasonal Forecast Products 18 21 January 2011 Tokyo, Japan Atmospheric circulation analysis for seasonal forecasting Shotaro Tanaka Climate