NRCSE. Misalignment and use of deterministic models
|
|
|
- Marilynn Hodge
- 5 years ago
- Views:
Transcription

1 NRCSE Misalignment and use of deterministic models
2 Work with Veronica Berrocal Peter Craigmile Wendy Meiring Paul Sampson Gregory Nikulin
3 The choice of spatial scale some questions 1. Which spatial scale is correct? 2. What if there is spatial misalignment? 3. How do we change from one spatial scale to another? 4. What if we have different spatial datasets that come to us on different spatial scales? 5. How do we combine data sources? We need to be careful not to be misled in our inferences.
4 Changes of support Observed Inference Method point point kriging point line contouring point area block kriging area point ecological inference area area misalignment
5 Some issues in model assessment Spatiotemporal misalignment Grid boxes vs observations Types of error Measurement error and bias Model error Approximation error Manipulate data or model output?

6 Assessing the SARMAP model 60 days of hourly observations at 32 sites in Sacramento region Hourly model runs for three episodes
7 Task Estimate from data the ozone level in a grid square. Issues: Transformation Diurnal cycle Temporal dependence Spatial dependence Space-time interaction
8 Transformation Heterogeneous variability mean and variance positively related Square root transformation All modeling now on square root scale approximately normal
9 Diurnal cycle

10 Spatial dependence
11 V t (s) = Estimate Estimating a grid square average Z t (s) V t (s) = µ t (s) + W t (s) W t (s) = α 1 (s)w t 1 (s) + α 2 (s)w t 2 (s) + Y t (s) 1 A A V 2 t (s)ds using 1 M E { V (s t j )2 data from 1,...,t } (not averages of squares of kriging estimates on the square root scale)

12 Afternoon comparison

13 Nighttime comparison
14 Regional climate models Not possible to do long runs of global models at fine resolution Regional models (dynamic downscaling) use global model as boundary conditions and runs on finer resolution Output is averaged over land use classes Weather prediction mode uses reanalysis as boundary conditions
15 Comparison of model to data Model output daily averaged 3hr predictions on (12.5 km) 2 grid Use open air predictions only RCA3 driven by ERA 40/ERA Interim Data daily averages point measurements (actually weighted average of three hourly measurements, min and max) Aggregate model and data to seasonal averages
 (66 missing) (14 missing) (129 missing) (30 missing) (1 missing) (2 missing) 12 14 16 18 20 22 24 Latitude 1960 1970 1980 1990 2000 2010")
16 Data SMHI synoptic stations in south central Sweden, (61 missing) Longitude Sundsvall Borlänge 7 * 8 10 Stockholm 9, Göteborg Lund Sweden Site ID (6 missing) (66 missing) (14 missing) (129 missing) (30 missing) (1 missing) (2 missing) Latitude Year
17 Upscaling Geostatistics: predicting grid square averages from data Difficulties: Trends Seasonal variation Long term memory features Short term memory features
18 Long term memory models Realization ACS vs. lag Log SDF vs. log freq d= ACS d= ACS d= ACS
19 A simple model Y t (s) = µ t (s) + ϕ t (s) + exp(α t (s))η t (s) space-time trend noise periodic seasonal component seasonal variability
20 Seasonal part φ t (s) = A(s)cos(2πt / θ(s)) (a) Latitude Estimated seasonality Jan Feb Mar Apr May Jun Jul Aug Sep Oct Nov Dec (b) 9.71 Sundsvall Borlänge Stockholm Göteborg Latitude Month (c) 0.31 Sundsvall Borlänge Stockholm Göteborg Longitude Longitude
21 Seasonal variability Log standard deviation Sundsvalls Flygplats Målilla Films Kyrkby A Kilsbergen Suttarboda Jan Apr Jul Oct Month Jan Apr Jul Oct Month Jan Apr Jul Oct Month Jan Apr Jul Oct Month Modulate noise ζ t (s) = exp(α t (s))η t (s) α t (s) two term Fourier series
22 Both long and short memory Consider a stationary Gaussian process with spectral density Short term memory Examples: S η (f) = B(f) 4sin 2 (πf) δ Long term memory B(f) constant: fractionally differenced process (FD) B(f) exponential: fractional exponential process (FEXP) (log B truncated Fourier series)
23 Estimated SDFs of standardized noise Log SDF Sundsvalls Flygplats FEXP FD Målilla Log SDF Films Kyrkby A Kilsbergen Suttarboda A Log frequency Log frequency Clear evidence of both short and long memory parts
24 Space-time model Gaussian white measurement error Process model in wavelet space scaling coefficients have mean linear in time and latitude separable space-time covariance Gaussian spatially varying parameters
25 Dependence parameters LTM post. mean d post. stdev d post. mean theta post. stdev theta Short term post. mean theta post. stdev theta post. mean theta post. stdev theta Figure 8: Posterior predicted means (left panel) and standard deviations (right panel) for the parameters characterizing the spatially-varying FEXP process. 25
26 Trend estimates
27 Estimating grid squares Pick q locations systematically in the grid square Draw sample from posterior distribution of Y(s,t) for s in the locations and t in the season Compute seasonal average Compute grid square average
28 Downscaling Climatology terms: Dynamic downscaling Stochastic downscaling Statistical downscaling Here we are using the term to allow data assimilation for RCM point prediction using RCM
 = β 0 (t) + β(s,t) smoothed RCM Winter Spring Beta_0,t 4 2 0 2 Beta_0,t 1 0 1 2 1965 1975 1985 1995 2005 Year 1965 1975 1985 1995 2005 Year Summer Autumn Beta_0,t 1")
29 Downscaling model (0.91,0.95) Y(s,t) =! β 0 (s,t) + β 1!x(s,t) + ε(s,t)!β 0 (s,t) = β 0 (t) + β(s,t) smoothed RCM Winter Spring Beta_0,t Beta_0,t Year Year Summer Autumn Beta_0,t Year Beta_0,t Year
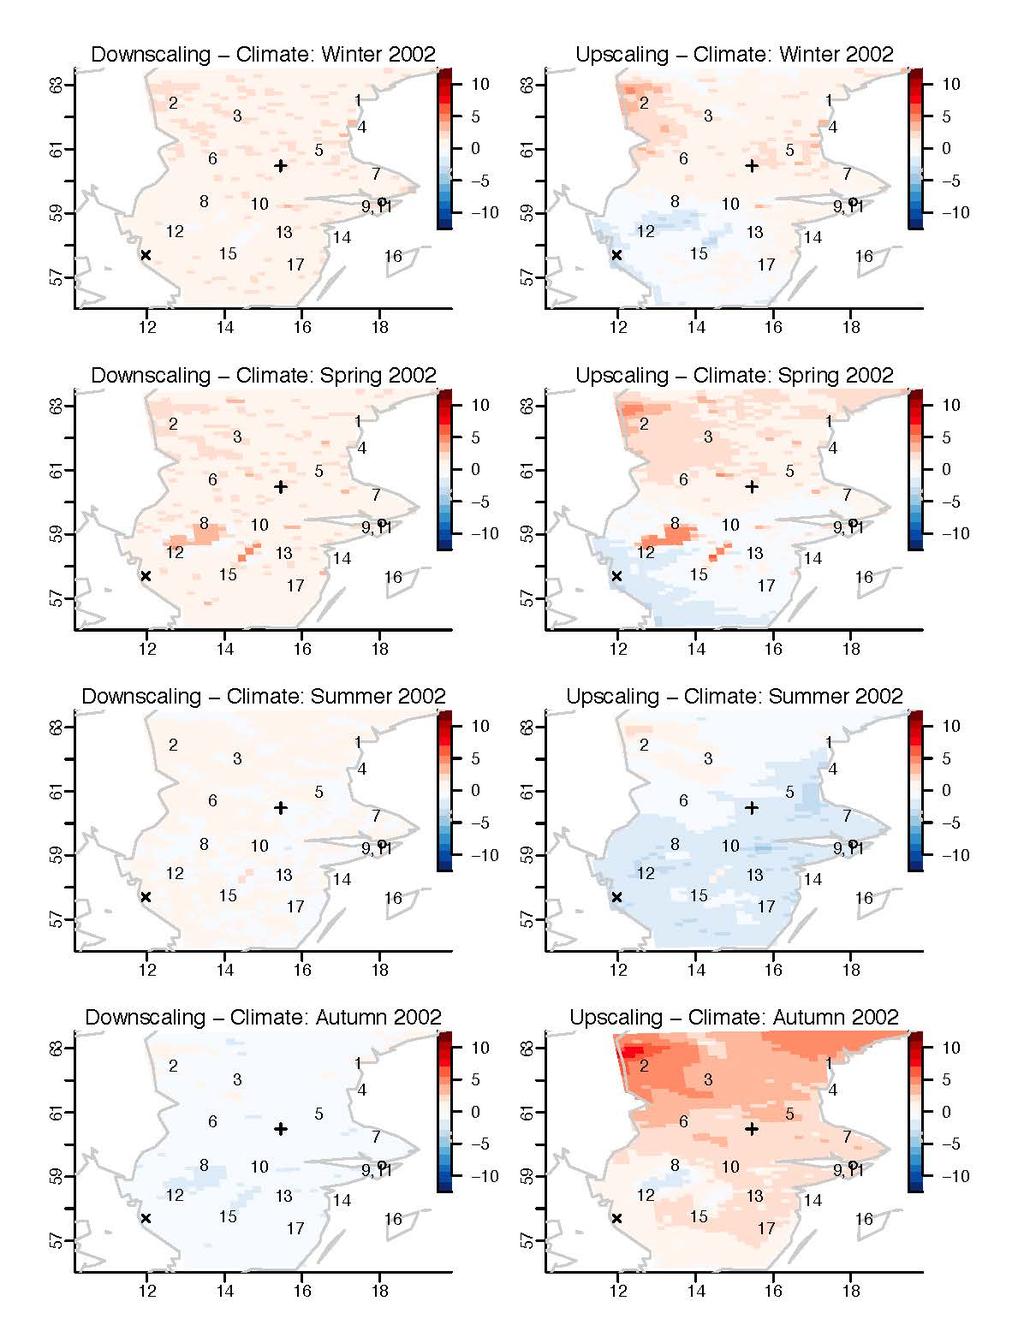
30 Comparisons
31
32 Reserved stations Borlänge: Airport that has changed ownership, lots of missing data Stockholm: One of the longest temperature series in the world. Located in urban park. Göteborg: Urban site, located just outside the grid of model output
33 Predictions and data
34 Annual scale Downscaling Upscaling Borlänge Stockholm Göteborg
35 Comments Nonstationarity in mean in covariance Uncertainty in model output Extreme seasons where down-and upscaling agree with each other but not with the model output Model correction approaches
36
37 Statistical analysis of computer code output Often the process model is expensive to run (in time, at least), especially if different runs needed for MCMC Need to develop real-time approximation to process model Kalman filter is a dynamic linear model approximation SACCO is an alternative Bayesian approach
38 Basic framework An emulator is a random (Gaussian) process η(x) approximating the process model for input x in R m. Prior mean m(x) = h(x) T β Prior covariance v(x 1,x 2 ) = σ 2 c(x 1,x 2 ) Run the model at n input values to get n output values, so (d β,σ 2 ) N(Hβ,σ 2 C) (η( i) β,σ 2,d) N(m,Σ )
39 The emulator Integrating out β and σ 2 we get η(x) m (x) t ˆσc (x,x) 1 2 n q where q = dim(β) and m (x) = h(x) T ˆβ + t(x) T C 1 (d Hˆβ) where t(x) T = (c(x,x 1 ),,c(x,x n )) m** is the emulator, and we can also calculate its variance
40 y=7+x+cos(2x) q=1, h T (x)=(1 x) n=5 An example
41 Conclusions Model assessment constraints: amount of data data quality ease of producing model runs degree of misalignment Ideally the model should have similar first and second order properties to the data similar peaks and troughs to data (or simulations based on the data)
My research interests
 My research interests Peter F. Craigmile http://www.stat.osu.edu/~pfc/ Stat 8010 Department of Statistics The Ohio State University 22 January 2016 1 Being a graduate student Notes on the PhD Degree by
NRCSE. Statistics, data, and deterministic models
 NRCSE Statistics, data, and deterministic models Some issues in model assessment Spatiotemporal misalignment Grid boxes vs observations Types of error Measurement error and bias Model error Approximation
GAMINGRE 8/1/ of 7
 FYE 09/30/92 JULY 92 0.00 254,550.00 0.00 0 0 0 0 0 0 0 0 0 254,550.00 0.00 0.00 0.00 0.00 254,550.00 AUG 10,616,710.31 5,299.95 845,656.83 84,565.68 61,084.86 23,480.82 339,734.73 135,893.89 67,946.95
Impacts of climate change on flooding in the river Meuse
 Impacts of climate change on flooding in the river Meuse Martijn Booij University of Twente,, The Netherlands m.j.booij booij@utwente.nlnl 2003 in the Meuse basin Model appropriateness Appropriate model
Space-time downscaling under error in computer model output
 Space-time downscaling under error in computer model output University of Michigan Department of Biostatistics joint work with Alan E. Gelfand, David M. Holland, Peter Guttorp and Peter Craigmile Introduction
Climatography of the United States No
 Climate Division: AK 5 NWS Call Sign: ANC Month (1) Min (2) Month(1) Extremes Lowest (2) Temperature ( F) Lowest Month(1) Degree s (1) Base Temp 65 Heating Cooling 90 Number of s (3) Jan 22.2 9.3 15.8
Time Series Analysis
 Time Series Analysis A time series is a sequence of observations made: 1) over a continuous time interval, 2) of successive measurements across that interval, 3) using equal spacing between consecutive
INDIAN INSTITUTE OF SCIENCE STOCHASTIC HYDROLOGY. Lecture -12 Course Instructor : Prof. P. P. MUJUMDAR Department of Civil Engg., IISc.
 INDIAN INSTITUTE OF SCIENCE STOCHASTIC HYDROLOGY Lecture -12 Course Instructor : Prof. P. P. MUJUMDAR Department of Civil Engg., IISc. Summary of the previous lecture Data Extension & Forecasting Moving
Gridded observation data for Climate Services
 Gridded observation data for Climate Services Ole Einar Tveito, Inger Hanssen Bauer, Eirik J. Førland and Cristian Lussana Norwegian Meteorological Institute Norwegian annual temperatures Norwegian annual
Bayesian dynamic modeling for large space-time weather datasets using Gaussian predictive processes
 Bayesian dynamic modeling for large space-time weather datasets using Gaussian predictive processes Sudipto Banerjee 1 and Andrew O. Finley 2 1 Biostatistics, School of Public Health, University of Minnesota,
COUPLING A DISTRIBUTED HYDROLOGICAL MODEL TO REGIONAL CLIMATE MODEL OUTPUT: AN EVALUATION OF EXPERIMENTS FOR THE RHINE BASIN IN EUROPE
 P.1 COUPLING A DISTRIBUTED HYDROLOGICAL MODEL TO REGIONAL CLIMATE MODEL OUTPUT: AN EVALUATION OF EXPERIMENTS FOR THE RHINE BASIN IN EUROPE Jan Kleinn*, Christoph Frei, Joachim Gurtz, Pier Luigi Vidale,
Supplementary appendix
 Supplementary appendix This appendix formed part of the original submission and has been peer reviewed. We post it as supplied by the authors. Supplement to: Lowe R, Stewart-Ibarra AM, Petrova D, et al.
Can a regional climate model reproduce observed extreme temperatures? Peter F. Craigmile
 Can a regional climate model reproduce observed extreme temperatures? Peter F. Craigmile http://www.stat.osu.edu/~pfc/ Workshop on the analysis of environmental extremes, The Pennsylvania State University,
Investigation on the use of NCEP/NCAR, MERRA and NCEP/CFSR reanalysis data in wind resource analysis
 Investigation on the use of NCEP/NCAR, MERRA and NCEP/CFSR reanalysis data in wind resource analysis Sónia Liléo, PhD Wind resource analyst - R&D manager O2 Vind AB Stockholm, Sweden sonia.lileo@o2.se
Bayesian dynamic modeling for large space-time weather datasets using Gaussian predictive processes
 Bayesian dynamic modeling for large space-time weather datasets using Gaussian predictive processes Andrew O. Finley 1 and Sudipto Banerjee 2 1 Department of Forestry & Department of Geography, Michigan
Technical note on seasonal adjustment for M0
 Technical note on seasonal adjustment for M0 July 1, 2013 Contents 1 M0 2 2 Steps in the seasonal adjustment procedure 3 2.1 Pre-adjustment analysis............................... 3 2.2 Seasonal adjustment.................................
Faisal S. Syed, Shahbaz M.,Nadia R.,Siraj I. K., M. Adnan Abid, M. Ashfaq, F. Giorgi, J. Pal, X. Bi
 ICTP NCP International Conference on Global Change 15-19 November, 2006, Islamabad Climate Change Studies over South Asia Region Using Regional Climate Model RegCM3 (Preliminary Results) Faisal S. Syed,
Fusing point and areal level space-time data. data with application to wet deposition
 Fusing point and areal level space-time data with application to wet deposition Alan Gelfand Duke University Joint work with Sujit Sahu and David Holland Chemical Deposition Combustion of fossil fuel produces
Technical note on seasonal adjustment for Capital goods imports
 Technical note on seasonal adjustment for Capital goods imports July 1, 2013 Contents 1 Capital goods imports 2 1.1 Additive versus multiplicative seasonality..................... 2 2 Steps in the seasonal
Bayesian dynamic modeling for large space-time weather datasets using Gaussian predictive processes
 Bayesian dynamic modeling for large space-time weather datasets using Gaussian predictive processes Andrew O. Finley Department of Forestry & Department of Geography, Michigan State University, Lansing
Specialist rainfall scenarios and software package
 Building Knowledge for a Changing Climate Specialist rainfall scenarios and software package Chris Kilsby Ahmad Moaven-Hashemi Hayley Fowler Andrew Smith Aidan Burton Michael Murray University of Newcastle
Local Ctimatotogical Data Summary White Hall, Illinois
 SWS Miscellaneous Publication 98-5 STATE OF ILLINOIS DEPARTMENT OF ENERGY AND NATURAL RESOURCES Local Ctimatotogical Data Summary White Hall, Illinois 1901-1990 by Audrey A. Bryan and Wayne Armstrong Illinois
Global climate predictions: forecast drift and bias adjustment issues
 www.bsc.es Ispra, 23 May 2017 Global climate predictions: forecast drift and bias adjustment issues Francisco J. Doblas-Reyes BSC Earth Sciences Department and ICREA Many of the ideas in this presentation
Climatography of the United States No
 No. 2 1971-2 Asheville, North Carolina 2881 COOP ID: 46646 Climate Division: CA 4 NWS Call Sign: 8W Month (1) Min (2) Month(1) Extremes Lowest (2) Temperature ( F) Lowest Month(1) Degree s (1) Base Temp
Climatography of the United States No
 No. 2 1971-2 Asheville, North Carolina 2881 COOP ID: 4792 Climate Division: CA 6 NWS Call Sign: Month (1) Min (2) Month(1) Extremes Lowest (2) Temperature ( F) Lowest Month(1) Degree s (1) Base Temp 65
Standardized Anomaly Model Output Statistics Over Complex Terrain.
 Standardized Anomaly Model Output Statistics Over Complex Terrain Reto.Stauffer@uibk.ac.at Outline statistical ensemble postprocessing introduction to SAMOS new snow amount forecasts in Tyrol sub-seasonal
Climatography of the United States No
 Month (1) Min (2) Month(1) Extremes Lowest (2) Temperature ( F) Lowest Month(1) Degree s (1) Base Temp 65 Heating Cooling 100 Number of s (3) Jan 63.9 39.3 51.6 86 1976 16 56.6 1986 20 1976 2 47.5 1973
Climatography of the United States No
 Temperature ( F) Month (1) Min (2) Month(1) Extremes Lowest (2) Lowest Month(1) Degree s (1) Base Temp 65 Heating Cooling 100 Number of s (3) Jan 32.8 21.7 27.3 62 1918 1 35.8 1983-24 1950 29 10.5 1979
Synoptic and mesoscale analysis of waterspouts in the Adriatic ( preliminary climatology)
") Synoptic and mesoscale analysis of waterspouts in the Adriatic (2001-2011 preliminary climatology) Josipa Kuzmić 1, Tanja Renko 1, Nataša Strelec Mahović 1 1 Meteorological and Hydrological Service of
Synoptic and mesoscale analysis of waterspouts in the Adriatic (2001-2011 preliminary climatology) Josipa Kuzmić 1, Tanja Renko 1, Nataša Strelec Mahović 1 1 Meteorological and Hydrological Service of
Comparing the SEKF with the DEnKF on a land surface model
 Comparing the SEKF with the DEnKF on a land surface model David Fairbairn, Alina Barbu, Emiliano Gelati, Jean-Francois Mahfouf and Jean-Christophe Caret CNRM - Meteo France Partly funded by European Union
Climatography of the United States No
 No. 2 1971-2 Asheville, North Carolina 2881 COOP ID: 43417 Climate Division: CA 4 NWS Call Sign: N Lon: 121 Month (1) Min (2) Month(1) Extremes Lowest (2) Temperature ( F) Lowest Month(1) Degree s (1)
Yellow Sea Thermohaline and Acoustic Variability
 Yellow Sea Thermohaline and Acoustic Variability Peter C Chu, Carlos J. Cintron Naval Postgraduate School, USA Steve Haeger Naval Oceanographic Office, USA Yellow Sea Bottom Sediment Chart Four Bottom
Climatography of the United States No
 No. 2 1971-2 Asheville, North Carolina 2881 COOP ID: 4795 Climate Division: CA 6 NWS Call Sign: SBA Month (1) Min (2) Month(1) Extremes Lowest (2) Temperature ( F) Lowest Month(1) Degree s (1) Base Temp
Buenos días. Perdón - Hablo un poco de español!
 Buenos días Perdón - Hablo un poco de español! Introduction to different downscaling tools Rob Wilby Climate Change Science Manager rob.wilby@environment-agency.gov.uk Source: http://culter.colorado.edu/nwt/site_info/site_info.html
Climatography of the United States No
 Climate Division: CA 4 NWS Call Sign: Month (1) Min (2) Month(1) Extremes Lowest (2) Temperature ( F) Lowest Month(1) Degree s (1) Base Temp 65 Heating Cooling 100 Number of s (3) Jan 55.6 39.3 47.5 77
Climatography of the United States No
 Climate Division: CA 5 NWS Call Sign: Month (1) Min (2) Month(1) Extremes Lowest (2) Temperature ( F) Lowest Month(1) Degree s (1) Base Temp 65 Heating Cooling 100 Number of s (3) Jan 56.6 36.5 46.6 81
Climatography of the United States No
 Climate Division: CA 1 NWS Call Sign: Month (1) Min (2) Month(1) Extremes Lowest (2) Temperature ( F) Lowest Month(1) Degree s (1) Base Temp 65 Heating Cooling 100 Number of s (3) Jan 57.9 38.9 48.4 85
Climatography of the United States No
 Climate Division: CA 5 NWS Call Sign: Month (1) Min (2) Month(1) Extremes Lowest (2) Temperature ( F) Lowest Month(1) Degree s (1) Base Temp 65 Heating Cooling 100 Number of s (3) Jan 44.8 25.4 35.1 72
Climatography of the United States No
 Climate Division: CA 4 NWS Call Sign: Month (1) Min (2) Month(1) Extremes Lowest (2) Temperature ( F) Lowest Month(1) Degree s (1) Base Temp 65 Heating Cooling 100 Number of s (3) Jan 49.4 37.5 43.5 73
Climatography of the United States No
 Climate Division: CA 6 NWS Call Sign: Month (1) Min (2) Month(1) Extremes Lowest (2) Temperature ( F) Lowest Month(1) Degree s (1) Base Temp 65 Heating Cooling 100 Number of s (3) Jan 69.4 46.6 58.0 92
Climatography of the United States No
 Climate Division: CA 1 NWS Call Sign: Month (1) Min (2) Month(1) Extremes Lowest (2) Temperature ( F) Lowest Month(1) Degree s (1) Base Temp 65 Heating Cooling 1 Number of s (3) Jan 57.8 39.5 48.7 85 1962
Climatography of the United States No
 Climate Division: CA 4 NWS Call Sign: Month (1) Min (2) Month(1) Extremes Lowest (2) Temperature ( F) Lowest Month(1) Degree s (1) Base Temp 65 Heating Cooling 1 Number of s (3) Jan 58.5 38.8 48.7 79 1962
Climatography of the United States No
 Climate Division: CA 6 NWS Call Sign: Month (1) Min (2) Month(1) Extremes Lowest (2) Temperature ( F) Lowest Month(1) Degree s (1) Base Temp 65 Heating Cooling 1 Number of s (3) Jan 67.5 42. 54.8 92 1971
Regional climate model assessment via spatio-temporal modeling. Peter F. Craigmile
 Regional climate model assessment via spatio-temporal modeling Peter F. Craigmile http://www.stat.osu.edu/~pfc/ Symposium on Data Science and Statistics, Reston, VA May 16-19, 2018. Adapted from research
Climatography of the United States No
 No. 2 1971-2 Asheville, North Carolina 2881 COOP ID: 42713 Climate Division: CA 7 NWS Call Sign: Elevation: -3 Feet Lat: 32 Month (1) Min (2) Month(1) Extremes Lowest (2) Temperature ( F) Lowest Month(1)
Climatography of the United States No
 No. 2 1971-2 Asheville, North Carolina 2881 COOP ID: 46175 Climate Division: CA 6 NWS Call Sign: 3L3 Elevation: 1 Feet Lat: 33 Month (1) Min (2) Month(1) Extremes Lowest (2) Temperature ( F) Lowest Month(1)
Climatography of the United States No
 Climate Division: ND 8 NWS Call Sign: BIS Month (1) Min (2) Month(1) Extremes Lowest (2) Temperature ( F) Lowest Month(1) Degree s (1) Base Temp 65 Heating Cooling 100 Number of s (3) Jan 21.1 -.6 10.2
Climatography of the United States No
 Climate Division: TN 1 NWS Call Sign: Month (1) Min (2) Month(1) Extremes Lowest (2) Temperature ( F) Lowest Month(1) Degree s (1) Base Temp 65 Heating Cooling 100 Number of s (3) Jan 47.6 24.9 36.3 81
On the presence of tropical vortices over the Southeast Asian Sea- Maritime Continent region
 Technical Conference of 50 th Annual Session of Typhoon Committee 2018 On the presence of tropical vortices over the Southeast Asian Sea- Maritime Continent region Nguyen Dang-Quang 1, James Renwick 2,
Climatography of the United States No
 Climate Division: CA 5 NWS Call Sign: FAT Month (1) Min (2) Month(1) Extremes Lowest (2) Temperature ( F) Lowest Month(1) Degree s (1) Base Temp 65 Heating Cooling 1 Number of s (3) Jan 53.6 38.4 46. 78
Dust storm variability over EGYPT By Fathy M ELashmawy Egyptian Meteorological Authority
 WMO WORKSHOP ON CLIMATE MONITORING INCLUDING THE IMPLEMENTATION OF CLIMATE WATCH SYSTEMS FOR ARAB COUNTRIES IN WEST ASIA, AMMAN, JORDAN, 27-29 MAY 2013 Dust storm variability over EGYPT By Fathy M ELashmawy
Climatography of the United States No
 Climate Division: CA 6 NWS Call Sign: 1L2 N Lon: 118 3W Month (1) Min (2) Month(1) Extremes Lowest (2) Temperature ( F) Lowest Month(1) Degree s (1) Base Temp 65 Heating Cooling 1 Number of s (3) Jan 63.7
Current and Future Impacts of Wildfires on PM 2.5, Health, and Policy in the Rocky Mountains
 Current and Future Impacts of Wildfires on PM 2.5, Health, and Policy in the Rocky Mountains Yang Liu, Ph.D. STAR Grants Kick-off Meeting Research Triangle Park, NC April 5, 2017 Motivation The Rocky Mountains
Climatography of the United States No
 Climate Division: CA 5 NWS Call Sign: BFL Month (1) Min (2) Month(1) Extremes Lowest (2) Temperature ( F) Lowest Month(1) Degree s (1) Base Temp 65 Heating Cooling 1 Number of s (3) Jan 56.3 39.3 47.8
Fig.3.1 Dispersion of an isolated source at 45N using propagating zonal harmonics. The wave speeds are derived from a multiyear 500 mb height daily
 Fig.3.1 Dispersion of an isolated source at 45N using propagating zonal harmonics. The wave speeds are derived from a multiyear 500 mb height daily data set in January. The four panels show the result
Variability and trends in daily minimum and maximum temperatures and in diurnal temperature range in Lithuania, Latvia and Estonia
 Variability and trends in daily minimum and maximum temperatures and in diurnal temperature range in Lithuania, Latvia and Estonia Jaak Jaagus Dept. of Geography, University of Tartu Agrita Briede Dept.
Climatography of the United States No
 Climate Division: TN 3 NWS Call Sign: BNA Month (1) Min (2) Month(1) Extremes Lowest (2) Temperature ( F) Lowest Month(1) Degree s (1) Base Temp 65 Heating Cooling 100 Number of s (3) Jan 45.6 27.9 36.8
Climatography of the United States No
 Climate Division: CA 5 NWS Call Sign: Elevation: 6 Feet Lat: 37 Month (1) Min (2) Month(1) Extremes Lowest (2) Temperature ( F) Lowest Month(1) Degree s (1) Base Temp 65 Heating Cooling 1 Number of s (3)
Climatography of the United States No
 Climate Division: CA 4 NWS Call Sign: Elevation: 2 Feet Lat: 37 Month (1) Min (2) Month(1) Extremes Lowest (2) Temperature ( F) Lowest Month(1) Degree s (1) Base Temp 65 Heating Cooling 1 Number of s (3)
Climatography of the United States No
 Climate Division: CA 4 NWS Call Sign: Elevation: 13 Feet Lat: 36 Month (1) Min (2) Month(1) Extremes Lowest (2) Temperature ( F) Lowest Month(1) Degree s (1) Base Temp 65 Heating Cooling 1 Number of s
Climatography of the United States No
 Climate Division: CA 5 NWS Call Sign: Elevation: 1,14 Feet Lat: 36 Month (1) Min (2) Month(1) Extremes Lowest (2) Temperature ( F) Lowest Month(1) Degree s (1) Base Temp 65 Heating Cooling 1 Number of
TILT, DAYLIGHT AND SEASONS WORKSHEET
 TILT, DAYLIGHT AND SEASONS WORKSHEET Activity Description: Students will use a data table to make a graph for the length of day and average high temperature in Utah. They will then answer questions based
Satellite-derived environmental drivers for top predator hotspots
 Satellite-derived environmental drivers for top predator hotspots Peter Miller @PeterM654 South West Marine Ecosystems 2017 21 Apr. 2017, Plymouth University Satellite environmental drivers for hotspots
Regional climate-change downscaling for hydrological applications using a nonhomogeneous hidden Markov model
 Regional climate-change downscaling for hydrological applications using a nonhomogeneous hidden Markov model Water for a Healthy Country Flagship Steve Charles IRI Seminar, September 3, 21 Talk outline
Climatography of the United States No
 Climate Division: CA 6 NWS Call Sign: LAX Elevation: 1 Feet Lat: 33 Month (1) Min (2) Month(1) Extremes Lowest (2) Temperature ( F) Lowest Month(1) Degree s (1) Base Temp 65 Heating Cooling 1 Number of
Climatography of the United States No
 Climate Division: CA 6 NWS Call Sign: TOA Elevation: 11 Feet Lat: 33 2W Temperature ( F) Month (1) Min (2) Month(1) Extremes Lowest (2) Lowest Month(1) Degree s (1) Base Temp 65 Heating Cooling 1 Number
Time Series Analysis -- An Introduction -- AMS 586
 Time Series Analysis -- An Introduction -- AMS 586 1 Objectives of time series analysis Data description Data interpretation Modeling Control Prediction & Forecasting 2 Time-Series Data Numerical data
Statistical Models for Rainfall with Applications to Index Insura
 Statistical Models for Rainfall with Applications to April 21, 2008 Overview The idea: Insure farmers against the risk of crop failure, like drought, instead of crop failure itself. It reduces moral hazard
particular regional weather extremes
 SUPPLEMENTARY INFORMATION DOI: 1.138/NCLIMATE2271 Amplified mid-latitude planetary waves favour particular regional weather extremes particular regional weather extremes James A Screen and Ian Simmonds
Three main areas of work:
 Task 2: Climate Information 1 Task 2: Climate Information Three main areas of work: Collect historical and projected weather and climate data Conduct storm surge and wave modeling, sea-level rise (SLR)
Climatography of the United States No
 Month (1) Min (2) Month(1) Extremes Lowest (2) Temperature ( F) Lowest Month(1) Degree s (1) Base Temp 65 Heating Cooling 100 Number of s (3) 42.6 24.2 33.4 79 1950 25 44.2 1974-16 1994 19 18.8 1977 977
Climatography of the United States No
 Month (1) Min (2) Month(1) Extremes Lowest (2) Temperature ( F) Lowest Month(1) Degree s (1) Base Temp 65 Heating Cooling 100 Number of s (3) Jan 54.3 40.1 47.2 75 1998 17 53.0 1995 18 1949 11 41.7 1972
Time Series and Forecasting
 Time Series and Forecasting Introduction to Forecasting n What is forecasting? n Primary Function is to Predict the Future using (time series related or other) data we have in hand n Why are we interested?
The Effects of Weather on Urban Trail Use: A National Study
 The Effects of Weather on Urban Trail Use: A National Study Alireza Ermagun, Tracy Haden-Loh, Greg Lindsey May 3, 2016 Rails to Trails Conservancy Trail Modeling and Assessment Platform Objectives Monitor
SYSTEM BRIEF DAILY SUMMARY
 SYSTEM BRIEF DAILY SUMMARY * ANNUAL MaxTemp NEL (MWH) Hr Ending Hr Ending LOAD (PEAK HOURS 7:00 AM TO 10:00 PM MON-SAT) ENERGY (MWH) INCREMENTAL COST DAY DATE Civic TOTAL MAXIMUM @Max MINIMUM @Min FACTOR
statistical methods for tailoring seasonal climate forecasts Andrew W. Robertson, IRI
 statistical methods for tailoring seasonal climate forecasts Andrew W. Robertson, IRI tailored seasonal forecasts why do we make probabilistic forecasts? to reduce our uncertainty about the (unknown) future
Weather History on the Bishop Paiute Reservation
 Weather History on the Bishop Paiute Reservation -211 For additional information contact Toni Richards, Air Quality Specialist 76 873 784 toni.richards@bishoppaiute.org Updated 2//214 3:14 PM Weather History
Spatio-temporal modeling of fine particulate matter
 Spatio-temporal modeling of fine particulate matter Sujit Sahu a University of Southampton http://www.maths.soton.ac.uk/staff/sahu/ Lisbon: March 2004 a Joint work with Alan Gelfand and David Holland Fine
Climatography of the United States No
 Climate Division: CA 6 NWS Call Sign: Month (1) Min (2) Month(1) Extremes Lowest (2) Temperature ( F) Lowest Month(1) Degree s (1) Base Temp 65 Heating Cooling 100 Number of s (3) Jan 51.5 35.0 43.3 80
Climatography of the United States No
 Climate Division: CA 1 NWS Call Sign: Month (1) Min (2) Month(1) Extremes Lowest (2) Temperature ( F) Lowest Month(1) Degree s (1) Base Temp 65 Heating Cooling 100 Number of s (3) Jan 52.4 35.4 43.9 69
Climatography of the United States No
 Climate Division: CA 4 NWS Call Sign: Month (1) Min (2) Month(1) Extremes Lowest (2) Temperature ( F) Lowest Month(1) Degree s (1) Base Temp 65 Heating Cooling 100 Number of s (3) Jan 61.9 42.0 52.0 89
Climatography of the United States No
 Climate Division: CA 2 NWS Call Sign: Month (1) Min (2) Month(1) Extremes Lowest (2) Temperature ( F) Lowest Month(1) Degree s (1) Base Temp 65 Heating Cooling 100 Number of s (3) Jan 55.6 38.8 47.2 81
Estimating Design Rainfalls Using Dynamical Downscaling Data
 Estimating Design Rainfalls Using Dynamical Downscaling Data Ke-Sheng Cheng Department of Bioenvironmental Systems Engineering Mater Program in Statistics National Taiwan University Introduction Outline
Climatography of the United States No
 Climate Division: CA 2 NWS Call Sign: Month (1) Min (2) Month(1) Extremes Lowest (2) Temperature ( F) Lowest Month(1) Degree s (1) Base Temp 65 Heating Cooling 100 Number of s (3) Jan 53.5 37.6 45.6 78
Climatography of the United States No
 Climate Division: CA 6 NWS Call Sign: Month (1) Min (2) Month(1) Extremes Lowest (2) Temperature ( F) Lowest Month(1) Degree s (1) Base Temp 65 Heating Cooling 100 Number of s (3) Jan 66.1 38.3 52.2 91
Climatography of the United States No
 Climate Division: CA 1 NWS Call Sign: Month (1) Min (2) Month(1) Extremes Lowest (2) Temperature ( F) Lowest Month(1) Degree s (1) Base Temp 65 Heating Cooling 1 Number of s (3) Jan 56.2 4.7 48.5 79 1962
Climatography of the United States No
 Climate Division: CA 1 NWS Call Sign: Month (1) Min (2) Month(1) Extremes Lowest (2) Temperature ( F) Lowest Month(1) Degree s (1) Base Temp 65 Heating Cooling 100 Number of s (3) Jan 50.2 31.2 40.7 65+
Climatography of the United States No
 Climate Division: CA 4 NWS Call Sign: Month (1) Min (2) Month(1) Extremes Lowest (2) Temperature ( F) Lowest Month(1) Degree s (1) Base Temp 65 Heating Cooling 100 Number of s (3) Jan 61.4 33.1 47.3 82+
5.0 WHAT IS THE FUTURE ( ) WEATHER EXPECTED TO BE?
 WEATHER EXPECTED TO BE?") 5.0 WHAT IS THE FUTURE (2040-2049) WEATHER EXPECTED TO BE? This chapter presents some illustrative results for one station, Pearson Airport, extracted from the hour-by-hour simulations of the future period
5.0 WHAT IS THE FUTURE (2040-2049) WEATHER EXPECTED TO BE? This chapter presents some illustrative results for one station, Pearson Airport, extracted from the hour-by-hour simulations of the future period
Climatography of the United States No
 Climate Division: CA 5 NWS Call Sign: Month (1) Min (2) Month(1) Extremes Lowest (2) Temperature ( F) Lowest Month(1) Degree s (1) Base Temp 65 Heating Cooling 100 Number of s (3) 59.3 31.5 45.4 80 1976
Climatography of the United States No
 Climate Division: CA 2 NWS Call Sign: Month (1) Min (2) Month(1) Extremes Lowest (2) Temperature ( F) Lowest Month(1) Degree s (1) Base Temp 65 Heating Cooling 100 Number of s (3) 53.3 37.1 45.2 77 1962
Climatography of the United States No
 Climate Division: CA 7 NWS Call Sign: Month (1) Min (2) Month(1) Extremes Lowest (2) Temperature ( F) Lowest Month(1) Degree s (1) Base Temp 65 Heating Cooling 100 Number of s (3) 44.5 29.3 36.9 69 1951
Climatography of the United States No
 Climate Division: CA 2 NWS Call Sign: Month (1) Min (2) Month(1) Extremes Lowest (2) Temperature ( F) Lowest Month(1) Degree s (1) Base Temp 65 Heating Cooling 100 Number of s (3) 53.3 31.8 42.6 74+ 1975
Climatography of the United States No
 Climate Division: CA 6 NWS Call Sign: Month (1) Min (2) Month(1) Extremes Lowest (2) Temperature ( F) Lowest Month(1) Degree s (1) Base Temp 65 Heating Cooling 100 Number of s (3) 68.5 45.7 57.1 90 1971
Climatography of the United States No
 Climate Division: CA 2 NWS Call Sign: Month (1) Min (2) Month(1) Extremes Lowest (2) Temperature ( F) Lowest Month(1) Degree s (1) Base Temp 65 Heating Cooling 100 Number of s (3) 53.7 32.7 43.2 79 1962
Climatography of the United States No
 Climate Division: CA 7 NWS Call Sign: Month (1) Min (2) Month(1) Extremes Lowest (2) Temperature ( F) Lowest Month(1) Degree s (1) Base Temp 65 Heating Cooling 100 Number of s (3) 56.0 35.7 45.9 83 1975
Climatography of the United States No
 Climate Division: CA 7 NWS Call Sign: Month (1) Min (2) Month(1) Extremes Lowest (2) Temperature ( F) Lowest Month(1) Degree s (1) Base Temp 65 Heating Cooling 1 Number of s (3) 65.5 38.7 52.1 87 1962
Climatography of the United States No
 Climate Division: CA 7 NWS Call Sign: Month (1) Min (2) Month(1) Extremes Lowest (2) Temperature ( F) Lowest Month(1) Degree s (1) Base Temp 65 Heating Cooling 1 Number of s (3) 64.8 45.4 55.1 85 1971
Climatography of the United States No
 Climate Division: CA 7 NWS Call Sign: Month (1) Min (2) Month(1) Extremes Lowest (2) Temperature ( F) Lowest Month(1) Degree s (1) Base Temp 65 Heating Cooling 100 Number of s (3) 58.8 34.3 46.6 81+ 1948
Climatography of the United States No
 Climate Division: CA 7 NWS Call Sign: Month (1) Min (2) Month(1) Extremes Lowest (2) Temperature ( F) Lowest Month(1) Degree s (1) Base Temp 65 Heating Cooling 100 Number of s (3) 70.4 44.2 57.3 95 1971