Yellow Sea Thermohaline and Acoustic Variability
|
|
|
- Amelia Hancock
- 5 years ago
- Views:
Transcription
1 Yellow Sea Thermohaline and Acoustic Variability Peter C Chu, Carlos J. Cintron Naval Postgraduate School, USA Steve Haeger Naval Oceanographic Office, USA

2 Yellow Sea Bottom Sediment Chart Four Bottom Sediment types 1. Mud 2. Sand 3. Gravel 4. Rock

3 Yellow Sea Bottom Topography Water depth in most of the region is less than 50 m. m Within 50 km of the Korean coastline the average water depth is 20 m. m
4 Water Mass Distribution (Kondo 1985)
5 Oceanographic Data Sets Master Oceanographic Observational Data Set (MOODS) Generalized Digital Environmental Model (GDEM) Modular Ocean Data Assimilation System (MODAS)
6 Master Oceanographic Observational Data Set (MOODS) Historical world wide observational oceanographic profile data base dating back to Consist of: Temperature only profiles Both Temperature and Salinity Profiles Sound Speed profiles Surface Temperatures Biggest limitation is its irregular distribution over time and space.
7 MOODS (T, S) Stations More than 50,000 profiles
8 Seasonal Temperature Profile Structures (a) Winter and Fall Temperature Profile Structure. Isothermal (b) Spring and Summer Temperature Profile Structure. Multi-layer layer Mixed layer Thermocline Deep Layer

9 Mixed Layer Depth (One Layer from Dec to April)

10 Generalized Digital Environmental Model (GDEM) Gridded Climatological Data derived from MOODS. Global GDEM has a 30 resolution U.S. Navy s Operationally important areas contain resolutions of 20 and 10.

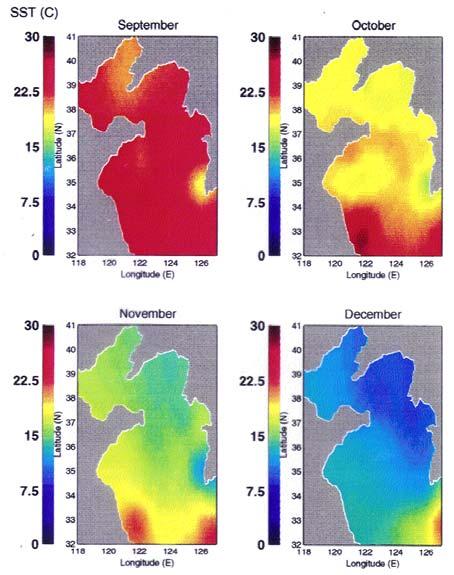
11 Monthly Mean SST from GDEM

12 Thermocline Temperature Difference
13 Sound Speed Profile Mixed layer Surface duct may be generated with a negative shift in SST Main Thermocline Deep Sound Channel Axis Deep Isothermal Layer
14 Comprehensive Acoustic Simulation System/Guassian Ray Bundle (CASS/GRAB) CASS/GRAB is an active and passive range dependent propagation, reverberation, and signal excess acoustic model that has been accepted as a Navy Standard for the frequency bands of 600 Hz to 100 khz.
15 CASS/GRAB Model Description The CASS model is the range dependent improvement of the Generic Sonar Model (GSM). CASS performs signal excess calculations. The Grab model is a subset of the CASS model and its main function is to compute eigenrays and propagation loss as inputs in the CASS signal excess calculations. CASS Comprehensive Acoustic System Simulation Propagation Model 1: FAME Propagation Model 2: GRAB Gaussian Ray Bundle OAML GRAB v1.0 Environmental Interpolations Environmental Model Interpolations Surface and Bottom Forward Loss Volume Attenuation Sound Speed Algorithms Call GRAB Propagation Model 3: COLOSSUS Propagation Model 4: AMOS equations Backscatter Models Reverberation Noise Models Signal to Noise Signal Excess Graphic Displays System Parameters (Beamforming)
16 Comprehensive Acoustic Simulation System/Guassian Ray Bundle (CASS/GRAB) In the GRAB model, the travel time, source angle, target angle, and phase of the ray bundles are equal to those values for the classic ray path. GRAB calculates amplitude globally by distributing the amplitudes according to the Gaussian equation Ψ ν 2 βν, 0Γν = exp. ( ) / 2πσ p r ν r, ν { [ ] 2 05 z z } ν σν
17 Monthly and Annual Mean Sound Speed Comparison Sound Speed profiles transition from Isotherm in the winter to Multi-layer in the Summer Jan/ Depth (m) Sound Speed versus Depth (Sand Bottom) 0 Monthly Annual Mean Feb Sound Speed versus Depth (Sand Bottom) Mar Sound Speed versus Depth (Sand Bottom) Apr/ Depth (m) May Jun Jul/ Depth (m) Aug Sep Oct/ Depth (m) Nov Dec SPEED (m/s) SPEED (m/s) SPEED (m/s)


18 GDEM Seasonal Variability for Signal Excess GDEM /January/ Sand/ SD = 25 ft GDEM /June/ Sand/ SD = 25 ft


19 GDEM Seasonal Variability for Signal Excess GDEM /January/ Sand/ SD = 125 ft GDEM /June/ Sand/ SD = 125 ft

20 Acoustic Transmission Under Severe Track of Tropical Depression Kai-Tak over the Yellow Sea for July 2000 Weather Events


21 Satellite Images of Tropical Depression Kai-Tak July 8, 2000 Tropical Cyclone over the East China Sea July 10, 2000 Tropical Depression over the Yellow Sea July 9, 2000 Tropical Cyclone over the Northern East China Sea July 11, 2000 Tropical Depression over the Northern Yellow Sea
22 Synoptic T, S Data Set (MODAS) Modular Ocean Data Assimilation System (MODAS) 3 D T, S Fields Twice Daily
23 Sound Speed and Maximum Detection Range Differences for a Mud Bottom region and a Source Depth of 25 ft
24 Sound Speed and Maximum Detection Range Differences for a Mud Bottom region and a Source Depth of 125 ft
25 Sound Speed and Maximum Detection Range Differences for a Sand Bottom region and a Source Depth of 25 ft
26 Sound Speed and Maximum Detection Range Differences for a Sand Bottom region and a Source Depth of 125 ft
27 Maximum Significant Acoustic Difference in Detection Ranges Before and After the Tropical Depression Target Depth Target Depth = 25 ft Source Depth = 25 ft Mud Sand July 10 July 7 July 15 July 10 July 10 July 7 July 15 July 10 July 10 July 7 July 15 July 10 July 10 July 7 July 15 July ft Lat Lat 36.5N 36.5N Lon Lon 124.0E 124.0E 26 ft 490 yds Figure 62 and yds Lat 36.5N Lon Lon 124.0E 124.0E 490 yds Figure 62 and yds None None None None Bottom Bottom None None None None None None None None
28 Maximum Significant Acoustic Difference in Detection Ranges Before and After the Tropical Depression Target Depth Target Depth Mud = 125 ft Source Depth = 125 ft Sand July 10 July 77 July 15 July July 10 July 77 July July July ft 26 ft None None None None Bottom Lat 36.5N Lon Lon 124.0E 124.0E 790 yds Figure 64 and 65 Bottom 790 yds Lat 36.5N Lon Lon 124.0E 124.0E 810 yds Figure 66 and yds None None None None


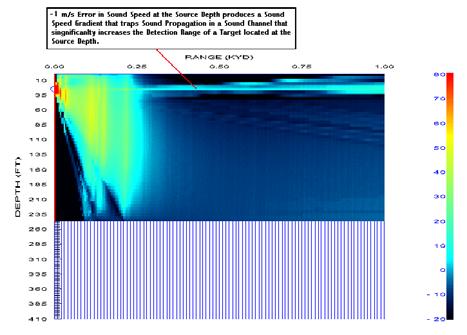
29 Effect of Sound Speed Error at Source Depth No Error +1 m/s Error -1 m/s Error
30 Conclusion Strong seasonal variability in thermohaline structure Strong seasonal variability in acoustic transmission (detection range, signal excess) Effect of the tropical cyclone on acoustic transmission Error propagation from sound speed profile to signal excess
Changes in spatial distribution of chub mackerel under climate change: the case study using Japanese purse seine fisheries data in the East China Sea
 Changes in spatial distribution of chub mackerel under climate change: the case study using Japanese purse seine fisheries data in the East China Sea Tohya Yasuda, Ryuji Yukami, Seiji Ohshimo Seikai National
Eddy and Chlorophyll-a Structure in the Kuroshio Extension Detected from Altimeter and SeaWiFS
 14th Symposium on Integrated Observing and Assimilation Systems for the Atmosphere, Oceans, and Land Surface (IOAS-AOLS), AMS Atlanta, January 17-21, 21 Eddy and Chlorophyll-a Structure in the Kuroshio
GAMINGRE 8/1/ of 7
 FYE 09/30/92 JULY 92 0.00 254,550.00 0.00 0 0 0 0 0 0 0 0 0 254,550.00 0.00 0.00 0.00 0.00 254,550.00 AUG 10,616,710.31 5,299.95 845,656.83 84,565.68 61,084.86 23,480.82 339,734.73 135,893.89 67,946.95
South China Sea Circulation and Thermohaline Structure. Peter C Chu Naval Postgraduate School http//
 South China Sea Circulation and Thermohaline Structure Peter C Chu Naval Postgraduate School pcchu@nps.edu http//www.oc.nps.navy.mil/~chu Contributors NPS: C.P. Chang, J.M Chen, N. L. Edmon, C.W. Fan,
Chiang Rai Province CC Threat overview AAS1109 Mekong ARCC
 Chiang Rai Province CC Threat overview AAS1109 Mekong ARCC This threat overview relies on projections of future climate change in the Mekong Basin for the period 2045-2069 compared to a baseline of 1980-2005.
Evidence of a Barrier Layer in the Sulu and Celebes Seas
 3299 Evidence of a Barrier Layer in the Sulu and Celebes Seas PETER C. CHU Naval Ocean Analysis and Prediction Laboratory, Department of Oceanography, Naval Postgraduate School, Monterey, California QINYU
8.1 Attachment 1: Ambient Weather Conditions at Jervoise Bay, Cockburn Sound
 8.1 Attachment 1: Ambient Weather Conditions at Jervoise Bay, Cockburn Sound Cockburn Sound is 20km south of the Perth-Fremantle area and has two features that are unique along Perth s metropolitan coast
Satellite-derived environmental drivers for top predator hotspots
 Satellite-derived environmental drivers for top predator hotspots Peter Miller @PeterM654 South West Marine Ecosystems 2017 21 Apr. 2017, Plymouth University Satellite environmental drivers for hotspots
Atmospheric circulation analysis for seasonal forecasting
 Training Seminar on Application of Seasonal Forecast GPV Data to Seasonal Forecast Products 18 21 January 2011 Tokyo, Japan Atmospheric circulation analysis for seasonal forecasting Shotaro Tanaka Climate
Sensitivity of Satellite Altimetry Data Assimilation on a Naval Anti-Submarine Warfare Weapon System
 Sensitivity of Satellite Altimetry Data Assimilation on a Naval Anti-Submarine Warfare Weapon System Steven Mancini LCDR, USN Advisor: Prof. Peter Chu Second Readers: Dr. Charlie Barron Eric Gottshall,
Variability and trends in daily minimum and maximum temperatures and in diurnal temperature range in Lithuania, Latvia and Estonia
 Variability and trends in daily minimum and maximum temperatures and in diurnal temperature range in Lithuania, Latvia and Estonia Jaak Jaagus Dept. of Geography, University of Tartu Agrita Briede Dept.
WIND EFFECTS ON CHEMICAL SPILL IN ST ANDREW BAY SYSTEM
 WIND EFFECTS ON CHEMICAL SPILL IN ST ANDREW BAY SYSTEM PETER C. CHU, PATRICE PAULY Naval Postgraduate School, Monterey, CA93943 STEVEN D. HAEGER Naval Oceanographic Office, Stennis Space Center MATHEW
Climatography of the United States No
 Climate Division: CA 6 NWS Call Sign: 1L2 N Lon: 118 3W Month (1) Min (2) Month(1) Extremes Lowest (2) Temperature ( F) Lowest Month(1) Degree s (1) Base Temp 65 Heating Cooling 1 Number of s (3) Jan 63.7
P7.7 A CLIMATOLOGICAL STUDY OF CLOUD TO GROUND LIGHTNING STRIKES IN THE VICINITY OF KENNEDY SPACE CENTER, FLORIDA
 P7.7 A CLIMATOLOGICAL STUDY OF CLOUD TO GROUND LIGHTNING STRIKES IN THE VICINITY OF KENNEDY SPACE CENTER, FLORIDA K. Lee Burns* Raytheon, Huntsville, Alabama Ryan K. Decker NASA, Marshall Space Flight
Proceedings of Meetings on Acoustics
 Proceedings of Meetings on Acoustics Volume 19, 2013 http://acousticalsociety.org/ ICA 2013 Montreal Montreal, Canada 2-7 June 2013 Acoustical Oceanography Session 2aAO: Seismic Oceanography 2aAO1. Uncertainty
Climatography of the United States No
 Climate Division: AK 5 NWS Call Sign: ANC Month (1) Min (2) Month(1) Extremes Lowest (2) Temperature ( F) Lowest Month(1) Degree s (1) Base Temp 65 Heating Cooling 90 Number of s (3) Jan 22.2 9.3 15.8
What is the difference between Weather and Climate?
 What is the difference between Weather and Climate? Objective Many people are confused about the difference between weather and climate. This makes understanding the difference between weather forecasts
Jackson County 2018 Weather Data 67 Years of Weather Data Recorded at the UF/IFAS Marianna North Florida Research and Education Center
 Jackson County 2018 Weather Data 67 Years of Weather Data Recorded at the UF/IFAS Marianna North Florida Research and Education Center Doug Mayo Jackson County Extension Director 1952-2008 Rainfall Data
Climatography of the United States No
 Climate Division: CA 5 NWS Call Sign: Elevation: 6 Feet Lat: 37 Month (1) Min (2) Month(1) Extremes Lowest (2) Temperature ( F) Lowest Month(1) Degree s (1) Base Temp 65 Heating Cooling 1 Number of s (3)
Climatography of the United States No
 Climate Division: CA 4 NWS Call Sign: Elevation: 2 Feet Lat: 37 Month (1) Min (2) Month(1) Extremes Lowest (2) Temperature ( F) Lowest Month(1) Degree s (1) Base Temp 65 Heating Cooling 1 Number of s (3)
Climatography of the United States No
 Climate Division: CA 4 NWS Call Sign: Elevation: 13 Feet Lat: 36 Month (1) Min (2) Month(1) Extremes Lowest (2) Temperature ( F) Lowest Month(1) Degree s (1) Base Temp 65 Heating Cooling 1 Number of s
Climatography of the United States No
 Climate Division: CA 5 NWS Call Sign: Elevation: 1,14 Feet Lat: 36 Month (1) Min (2) Month(1) Extremes Lowest (2) Temperature ( F) Lowest Month(1) Degree s (1) Base Temp 65 Heating Cooling 1 Number of
Global climate predictions: forecast drift and bias adjustment issues
 www.bsc.es Ispra, 23 May 2017 Global climate predictions: forecast drift and bias adjustment issues Francisco J. Doblas-Reyes BSC Earth Sciences Department and ICREA Many of the ideas in this presentation
Climatography of the United States No
 Climate Division: CA 6 NWS Call Sign: LAX Elevation: 1 Feet Lat: 33 Month (1) Min (2) Month(1) Extremes Lowest (2) Temperature ( F) Lowest Month(1) Degree s (1) Base Temp 65 Heating Cooling 1 Number of
Climatography of the United States No
 Climate Division: CA 6 NWS Call Sign: TOA Elevation: 11 Feet Lat: 33 2W Temperature ( F) Month (1) Min (2) Month(1) Extremes Lowest (2) Lowest Month(1) Degree s (1) Base Temp 65 Heating Cooling 1 Number
Jackson County 2013 Weather Data
 Jackson County 2013 Weather Data 61 Years of Weather Data Recorded at the UF/IFAS Marianna North Florida Research and Education Center Doug Mayo Jackson County Extension Director 1952-2008 Rainfall Data
TILT, DAYLIGHT AND SEASONS WORKSHEET
 TILT, DAYLIGHT AND SEASONS WORKSHEET Activity Description: Students will use a data table to make a graph for the length of day and average high temperature in Utah. They will then answer questions based
OVERVIEW OF IMPROVED USE OF RS INDICATORS AT INAM. Domingos Mosquito Patricio
 OVERVIEW OF IMPROVED USE OF RS INDICATORS AT INAM Domingos Mosquito Patricio domingos.mosquito@gmail.com Introduction to Mozambique /INAM Introduction to AGRICAB/SPIRITS Objectives Material & Methods Results
Climatography of the United States No
 No. 2 1971-2 Asheville, North Carolina 2881 COOP ID: 43417 Climate Division: CA 4 NWS Call Sign: N Lon: 121 Month (1) Min (2) Month(1) Extremes Lowest (2) Temperature ( F) Lowest Month(1) Degree s (1)
"STUDY ON THE VARIABILITY OF SOUTHWEST MONSOON RAINFALL AND TROPICAL CYCLONES FOR "
 "STUDY ON THE VARIABILITY OF SOUTHWEST MONSOON RAINFALL AND TROPICAL CYCLONES FOR 2001 2010" ESPERANZA O. CAYANAN, Ph.D. Chief, Climatology & Agrometeorology R & D Section Philippine Atmospheric Geophysical
Responding to the 2016 and 2017 Mass Coral Bleaching events on the Great Barrier Reef: from Observations to Modelling
 Responding to the 2016 and 2017 Mass Coral Bleaching events on the Great Barrier Reef: from Observations to Modelling EMatson@aims Craig Steinberg & Claire Spillman N. Cantin, J. Benthuysen, H. Tonin,
The Climate of Marshall County
 The Climate of Marshall County Marshall County is part of the Crosstimbers. This region is a transition region from the Central Great Plains to the more irregular terrain of southeastern Oklahoma. Average
Life Cycle of Convective Systems over Western Colombia
 Life Cycle of Convective Systems over Western Colombia Meiry Sakamoto Uiversidade de São Paulo, São Paulo, Brazil Colombia Life Cycle of Convective Systems over Western Colombia Convective System (CS)
Changing Hydrology under a Changing Climate for a Coastal Plain Watershed
 Changing Hydrology under a Changing Climate for a Coastal Plain Watershed David Bosch USDA-ARS, Tifton, GA Jeff Arnold ARS Temple, TX and Peter Allen Baylor University, TX SEWRU Objectives 1. Project changes
Climatography of the United States No
 No. 2 1971-2 Asheville, North Carolina 2881 COOP ID: 46175 Climate Division: CA 6 NWS Call Sign: 3L3 Elevation: 1 Feet Lat: 33 Month (1) Min (2) Month(1) Extremes Lowest (2) Temperature ( F) Lowest Month(1)
Climatography of the United States No
 No. 2 1971-2 Asheville, North Carolina 2881 COOP ID: 42713 Climate Division: CA 7 NWS Call Sign: Elevation: -3 Feet Lat: 32 Month (1) Min (2) Month(1) Extremes Lowest (2) Temperature ( F) Lowest Month(1)
Interannual variation of MODIS NDVI in Lake Taihu and its relation to climate in submerged macrophyte region
 Yale-NUIST Center on Atmospheric Environment Interannual variation of MODIS NDVI in Lake Taihu and its relation to climate in submerged macrophyte region ZhangZhen 2015.07.10 1 Outline Introduction Data
Climatography of the United States No
 Month (1) Min (2) Month(1) Extremes Lowest (2) Temperature ( F) Lowest Month(1) Degree s (1) Base Temp 65 Heating Cooling 100 Number of s (3) Jan 63.9 39.3 51.6 86 1976 16 56.6 1986 20 1976 2 47.5 1973
Climatography of the United States No
 Temperature ( F) Month (1) Min (2) Month(1) Extremes Lowest (2) Lowest Month(1) Degree s (1) Base Temp 65 Heating Cooling 100 Number of s (3) Jan 32.8 21.7 27.3 62 1918 1 35.8 1983-24 1950 29 10.5 1979
Government of Sultanate of Oman Public Authority of Civil Aviation Directorate General of Meteorology. National Report To
 Government of Sultanate of Oman Public Authority of Civil Aviation Directorate General of Meteorology National Report To Panel on Tropical Cyclones in the Bay of Bengal And Arabian Sea 43rd Session, India
ENSO Outlook by JMA. Hiroyuki Sugimoto. El Niño Monitoring and Prediction Group Climate Prediction Division Japan Meteorological Agency
 ENSO Outlook by JMA Hiroyuki Sugimoto El Niño Monitoring and Prediction Group Climate Prediction Division Outline 1. ENSO impacts on the climate 2. Current Conditions 3. Prediction by JMA/MRI-CGCM 4. Summary
Climatography of the United States No
 Climate Division: CA 4 NWS Call Sign: Month (1) Min (2) Month(1) Extremes Lowest (2) Temperature ( F) Lowest Month(1) Degree s (1) Base Temp 65 Heating Cooling 100 Number of s (3) Jan 55.6 39.3 47.5 77
Climatography of the United States No
 Climate Division: CA 5 NWS Call Sign: Month (1) Min (2) Month(1) Extremes Lowest (2) Temperature ( F) Lowest Month(1) Degree s (1) Base Temp 65 Heating Cooling 100 Number of s (3) Jan 56.6 36.5 46.6 81
Climatography of the United States No
 Climate Division: CA 1 NWS Call Sign: Month (1) Min (2) Month(1) Extremes Lowest (2) Temperature ( F) Lowest Month(1) Degree s (1) Base Temp 65 Heating Cooling 100 Number of s (3) Jan 57.9 38.9 48.4 85
Climatography of the United States No
 Climate Division: CA 5 NWS Call Sign: Month (1) Min (2) Month(1) Extremes Lowest (2) Temperature ( F) Lowest Month(1) Degree s (1) Base Temp 65 Heating Cooling 100 Number of s (3) Jan 44.8 25.4 35.1 72
Climatography of the United States No
 Climate Division: CA 4 NWS Call Sign: Month (1) Min (2) Month(1) Extremes Lowest (2) Temperature ( F) Lowest Month(1) Degree s (1) Base Temp 65 Heating Cooling 100 Number of s (3) Jan 49.4 37.5 43.5 73
Climatography of the United States No
 Climate Division: CA 6 NWS Call Sign: Month (1) Min (2) Month(1) Extremes Lowest (2) Temperature ( F) Lowest Month(1) Degree s (1) Base Temp 65 Heating Cooling 100 Number of s (3) Jan 69.4 46.6 58.0 92
Climatography of the United States No
 Climate Division: CA 4 NWS Call Sign: Month (1) Min (2) Month(1) Extremes Lowest (2) Temperature ( F) Lowest Month(1) Degree s (1) Base Temp 65 Heating Cooling 1 Number of s (3) Jan 58.5 38.8 48.7 79 1962
Climatography of the United States No
 Climate Division: CA 6 NWS Call Sign: Month (1) Min (2) Month(1) Extremes Lowest (2) Temperature ( F) Lowest Month(1) Degree s (1) Base Temp 65 Heating Cooling 1 Number of s (3) Jan 67.5 42. 54.8 92 1971
Climatography of the United States No
 Climate Division: CA 1 NWS Call Sign: Month (1) Min (2) Month(1) Extremes Lowest (2) Temperature ( F) Lowest Month(1) Degree s (1) Base Temp 65 Heating Cooling 1 Number of s (3) Jan 57.8 39.5 48.7 85 1962
2016 Meteorology Summary
 2016 Meteorology Summary New Jersey Department of Environmental Protection AIR POLLUTION AND METEOROLOGY Meteorology plays an important role in the distribution of pollution throughout the troposphere,
Climatography of the United States No
 Climate Division: ND 8 NWS Call Sign: BIS Month (1) Min (2) Month(1) Extremes Lowest (2) Temperature ( F) Lowest Month(1) Degree s (1) Base Temp 65 Heating Cooling 100 Number of s (3) Jan 21.1 -.6 10.2
Climatography of the United States No
 Climate Division: TN 1 NWS Call Sign: Month (1) Min (2) Month(1) Extremes Lowest (2) Temperature ( F) Lowest Month(1) Degree s (1) Base Temp 65 Heating Cooling 100 Number of s (3) Jan 47.6 24.9 36.3 81
Climatography of the United States No
 Climate Division: CA 5 NWS Call Sign: FAT Month (1) Min (2) Month(1) Extremes Lowest (2) Temperature ( F) Lowest Month(1) Degree s (1) Base Temp 65 Heating Cooling 1 Number of s (3) Jan 53.6 38.4 46. 78
Climatography of the United States No
 Climate Division: CA 5 NWS Call Sign: BFL Month (1) Min (2) Month(1) Extremes Lowest (2) Temperature ( F) Lowest Month(1) Degree s (1) Base Temp 65 Heating Cooling 1 Number of s (3) Jan 56.3 39.3 47.8
United States Climate
 25-1 Alabama Annual Average Temperature Data Source: http://www.wrcc.dri.edu/cgi-bin/divplot1_form.pl?0106 25-2 How does climate vary as we traverse the U.S. along 40 N? 25-3 Average Temperature Along
Jackson County 2014 Weather Data
 Jackson County 2014 Weather Data 62 Years of Weather Data Recorded at the UF/IFAS Marianna North Florida Research and Education Center Doug Mayo Jackson County Extension Director 1952-2008 Rainfall Data
Climatography of the United States No
 Climate Division: TN 3 NWS Call Sign: BNA Month (1) Min (2) Month(1) Extremes Lowest (2) Temperature ( F) Lowest Month(1) Degree s (1) Base Temp 65 Heating Cooling 100 Number of s (3) Jan 45.6 27.9 36.8
Supplementary appendix
 Supplementary appendix This appendix formed part of the original submission and has been peer reviewed. We post it as supplied by the authors. Supplement to: Lowe R, Stewart-Ibarra AM, Petrova D, et al.
The Climate of Pontotoc County
 The Climate of Pontotoc County Pontotoc County is part of the Crosstimbers. This region is a transition region from the Central Great Plains to the more irregular terrain of southeast Oklahoma. Average
Sierra Weather and Climate Update
 Sierra Weather and Climate Update 2014-15 Kelly Redmond Western Regional Climate Center Desert Research Institute Reno Nevada Yosemite Hydroclimate Workshop Yosemite Valley, 2015 October 8-9 Percent of
The Climate of Payne County
 The Climate of Payne County Payne County is part of the Central Great Plains in the west, encompassing some of the best agricultural land in Oklahoma. Payne County is also part of the Crosstimbers in the
The Climate of Haskell County
 The Climate of Haskell County Haskell County is part of the Hardwood Forest. The Hardwood Forest is characterized by its irregular landscape and the largest lake in Oklahoma, Lake Eufaula. Average annual
Optimal Spectral Decomposition (OSD) for Ocean Data Analysis
 for Ocean Data Analysis") Optimal Spectral Decomposition (OSD) for Ocean Data Analysis Peter C Chu (1) and Charles Sun (2) (1) Naval Postgraduate School, Monterey, CA 93943 pcchu@nps.edu, http://faculty.nps.edu/pcchu/ (2) NOAA/NODC,
Optimal Spectral Decomposition (OSD) for Ocean Data Analysis Peter C Chu (1) and Charles Sun (2) (1) Naval Postgraduate School, Monterey, CA 93943 pcchu@nps.edu, http://faculty.nps.edu/pcchu/ (2) NOAA/NODC,
Faisal S. Syed, Shahbaz M.,Nadia R.,Siraj I. K., M. Adnan Abid, M. Ashfaq, F. Giorgi, J. Pal, X. Bi
 ICTP NCP International Conference on Global Change 15-19 November, 2006, Islamabad Climate Change Studies over South Asia Region Using Regional Climate Model RegCM3 (Preliminary Results) Faisal S. Syed,
Climatography of the United States No
 No. 2 1971-2 Asheville, North Carolina 2881 COOP ID: 46646 Climate Division: CA 4 NWS Call Sign: 8W Month (1) Min (2) Month(1) Extremes Lowest (2) Temperature ( F) Lowest Month(1) Degree s (1) Base Temp
Climatography of the United States No
 No. 2 1971-2 Asheville, North Carolina 2881 COOP ID: 4792 Climate Division: CA 6 NWS Call Sign: Month (1) Min (2) Month(1) Extremes Lowest (2) Temperature ( F) Lowest Month(1) Degree s (1) Base Temp 65
Studies of Austfonna ice cap (Svalbard) using radar altimetry with other satellite techniques
 using radar altimetry with other satellite techniques") 15 Years of progress in Radar Altimetry Symposium Ocean surface topography science team (OSTST) International Doris Service (IDS) Workshop, Argo Workshop 13-18 March 2006, Venice, Italy Alexei V. Kouraev,
15 Years of progress in Radar Altimetry Symposium Ocean surface topography science team (OSTST) International Doris Service (IDS) Workshop, Argo Workshop 13-18 March 2006, Venice, Italy Alexei V. Kouraev,
CATCHMENT DESCRIPTION. Little River Catchment Management Plan Stage I Report Climate 4.0
 CATCHMENT DESCRIPTION Little River Catchment Management Plan Stage I Report Climate 4. Little River Catchment Management Plan Stage I Report Climate 4.1 4. CLIMATE 4.1 INTRODUCTION Climate is one of the
Lesson Adaptation Activity: Analyzing and Interpreting Data
 Lesson Adaptation Activity: Analyzing and Interpreting Data Related MA STE Framework Standard: 3-ESS2-1. Use graphs and tables of local weather data to describe and predict typical weather during a particular
The Climate of Seminole County
 The Climate of Seminole County Seminole County is part of the Crosstimbers. This region is a transition region from the Central Great Plains to the more irregular terrain of southeastern Oklahoma. Average
GEO 101, Feb 4, 2014 Finish isolines Atmosphere intro Variation in incoming solar radiation. Freezing rain is supercooled liquid water
 GEO 101, Feb 4, 14 Finish isolines Atmosphere intro Variation in incoming solar radiation Freezing rain is supercooled liquid water Graupel is white because it has air trapped inside leet is more colorless
Climatography of the United States No
 Month (1) Min (2) Month(1) Extremes Lowest (2) Temperature ( F) Lowest Month(1) Degree s (1) Base Temp 65 Heating Cooling 100 Number of s (3) 42.6 24.2 33.4 79 1950 25 44.2 1974-16 1994 19 18.8 1977 977
CURRENT METHODS AND PRODUCTS OF SEASONAL PREDICTION IN KENYA
 CURRENT METHODS AND PRODUCTS OF SEASONAL PREDICTION IN KENYA BY Mr. PETER G. AMBENJE Deputy Director Kenya Meteorological Department Box 3259-1 NAIROBI OUTLINE Introduction Brief Geography of Kenya Brief
Global Climates. Name Date
 Global Climates Name Date No investigation of the atmosphere is complete without examining the global distribution of the major atmospheric elements and the impact that humans have on weather and climate.
Climatography of the United States No
 No. 2 1971-2 Asheville, North Carolina 2881 COOP ID: 4795 Climate Division: CA 6 NWS Call Sign: SBA Month (1) Min (2) Month(1) Extremes Lowest (2) Temperature ( F) Lowest Month(1) Degree s (1) Base Temp
Habitat Suitability for Forage Fishes in Chesapeake Bay
 Habitat Suitability for Forage Fishes in Chesapeake Bay Aug 2017 Jul 2019 Mary C Fabrizio Troy D Tuckey Aaron J Bever Michael L MacWilliams 21 June 2018 Photo: Chesapeake Bay Program Motivation Production
The Coupled Earth Reanalysis system [CERA]
![The Coupled Earth Reanalysis system [CERA]](/thumbs/95/122770734.jpg "The Coupled Earth Reanalysis system [CERA]") The Coupled Earth Reanalysis system [CERA] Patrick Laloyaux Acknowledgments: Eric de Boisséson, Magdalena Balmaseda, Dick Dee, Peter Janssen, Kristian Mogensen, Jean-Noël Thépaut and Reanalysis Section
The Coupled Earth Reanalysis system [CERA] Patrick Laloyaux Acknowledgments: Eric de Boisséson, Magdalena Balmaseda, Dick Dee, Peter Janssen, Kristian Mogensen, Jean-Noël Thépaut and Reanalysis Section
The Climate of Texas County
 The Climate of Texas County Texas County is part of the Western High Plains in the north and west and the Southwestern Tablelands in the east. The Western High Plains are characterized by abundant cropland
Climatography of the United States No
 Month (1) Min (2) Month(1) Extremes Lowest (2) Temperature ( F) Lowest Month(1) Degree s (1) Base Temp 65 Heating Cooling 100 Number of s (3) Jan 54.3 40.1 47.2 75 1998 17 53.0 1995 18 1949 11 41.7 1972
Exercise 6. Solar Panel Orientation EXERCISE OBJECTIVE DISCUSSION OUTLINE. Introduction to the importance of solar panel orientation DISCUSSION
 Exercise 6 Solar Panel Orientation EXERCISE OBJECTIVE When you have completed this exercise, you will understand how the solar illumination at any location on Earth varies over the course of a year. You
Location. Datum. Survey. information. Etrometa. Step Gauge. Description. relative to Herne Bay is -2.72m. The site new level.
 Tide Gauge Location OS: 616895E 169377N WGS84: Latitude: 51 o 22.919196 N Longitude: 01 o 6.9335907 E Instrument Type Etrometa Step Gauge Benchmarks Benchmark TGBM = 5.524m above Ordnance Datum Newlyn
Investigate the influence of the Amazon rainfall on westerly wind anomalies and the 2002 Atlantic Nino using QuikScat, Altimeter and TRMM data
 Investigate the influence of the Amazon rainfall on westerly wind anomalies and the 2002 Atlantic Nino using QuikScat, Altimeter and TRMM data Rong Fu 1, Mike Young 1, Hui Wang 2, Weiqing Han 3 1 School
The Climate of Oregon Climate Zone 5 High Plateau
 105 E55 Unbound issue i". 9 13oes not circulate CZe Special Report 917 May 1993 The Climate of Oregon Climate Zone 5 Property of OREGON STATE UNIVERSITY Library Serials Corvallis, OR 97331-4503 Agricultural
Climatography of the United States No
 Climate Division: CA 6 NWS Call Sign: Month (1) Min (2) Month(1) Extremes Lowest (2) Temperature ( F) Lowest Month(1) Degree s (1) Base Temp 65 Heating Cooling 100 Number of s (3) Jan 51.5 35.0 43.3 80
Three main areas of work:
 Task 2: Climate Information 1 Task 2: Climate Information Three main areas of work: Collect historical and projected weather and climate data Conduct storm surge and wave modeling, sea-level rise (SLR)
Location. Datum. Survey. information. Etrometa. Step Gauge. Description. relative to Herne Bay is -2.72m. The site new level.
 Tide Gauge Location OS: 616895E 169377N WGS84: Latitude: 51 o 22.919196 N Longitude: 01 o 6.9335907 E Instrument Type Etrometa Step Gauge Benchmarks Benchmark TGBM = 5.524m above Ordnance Datum Newlyn
Climatography of the United States No
 Climate Division: CA 5 NWS Call Sign: Month (1) Min (2) Month(1) Extremes Lowest (2) Temperature ( F) Lowest Month(1) Degree s (1) Base Temp 65 Heating Cooling 100 Number of s (3) 59.3 31.5 45.4 80 1976
Climatography of the United States No
 Climate Division: CA 7 NWS Call Sign: Month (1) Min (2) Month(1) Extremes Lowest (2) Temperature ( F) Lowest Month(1) Degree s (1) Base Temp 65 Heating Cooling 100 Number of s (3) 44.5 29.3 36.9 69 1951
Climatography of the United States No
 Climate Division: CA 2 NWS Call Sign: Month (1) Min (2) Month(1) Extremes Lowest (2) Temperature ( F) Lowest Month(1) Degree s (1) Base Temp 65 Heating Cooling 100 Number of s (3) 53.3 37.1 45.2 77 1962
Climatography of the United States No
 Climate Division: CA 2 NWS Call Sign: Month (1) Min (2) Month(1) Extremes Lowest (2) Temperature ( F) Lowest Month(1) Degree s (1) Base Temp 65 Heating Cooling 100 Number of s (3) 53.3 31.8 42.6 74+ 1975
Climatography of the United States No
 Climate Division: CA 2 NWS Call Sign: Month (1) Min (2) Month(1) Extremes Lowest (2) Temperature ( F) Lowest Month(1) Degree s (1) Base Temp 65 Heating Cooling 100 Number of s (3) 53.7 32.7 43.2 79 1962
Climatography of the United States No
 Climate Division: CA 6 NWS Call Sign: Month (1) Min (2) Month(1) Extremes Lowest (2) Temperature ( F) Lowest Month(1) Degree s (1) Base Temp 65 Heating Cooling 100 Number of s (3) 68.5 45.7 57.1 90 1971
Climatography of the United States No
 Climate Division: CA 7 NWS Call Sign: Month (1) Min (2) Month(1) Extremes Lowest (2) Temperature ( F) Lowest Month(1) Degree s (1) Base Temp 65 Heating Cooling 100 Number of s (3) 56.0 35.7 45.9 83 1975
Climatography of the United States No
 Climate Division: CA 7 NWS Call Sign: Month (1) Min (2) Month(1) Extremes Lowest (2) Temperature ( F) Lowest Month(1) Degree s (1) Base Temp 65 Heating Cooling 1 Number of s (3) 65.5 38.7 52.1 87 1962
Climatography of the United States No
 Climate Division: CA 7 NWS Call Sign: Month (1) Min (2) Month(1) Extremes Lowest (2) Temperature ( F) Lowest Month(1) Degree s (1) Base Temp 65 Heating Cooling 1 Number of s (3) 64.8 45.4 55.1 85 1971
Climatography of the United States No
 Climate Division: CA 7 NWS Call Sign: Month (1) Min (2) Month(1) Extremes Lowest (2) Temperature ( F) Lowest Month(1) Degree s (1) Base Temp 65 Heating Cooling 100 Number of s (3) 58.8 34.3 46.6 81+ 1948
Climatography of the United States No
 Climate Division: CA 7 NWS Call Sign: Month (1) Min (2) Month(1) Extremes Lowest (2) Temperature ( F) Lowest Month(1) Degree s (1) Base Temp 65 Heating Cooling 100 Number of s (3) 70.4 44.2 57.3 95 1971
Recent Improvements in the U.S. Navy s Ice Modeling Efforts Using CryoSat-2 Ice Thickness for Model Initialization
 Recent Improvements in the U.S. Navy s Ice Modeling Efforts Using CryoSat-2 Ice Thickness for Model Initialization Richard Allard 1, David Hebert 1, Pamela Posey 1, Alan Wallcraft 1, Li Li 2, William Johnston
Climatography of the United States No
 Climate Division: CA 1 NWS Call Sign: Month (1) Min (2) Month(1) Extremes Lowest (2) Temperature ( F) Lowest Month(1) Degree s (1) Base Temp 65 Heating Cooling 100 Number of s (3) Jan 52.4 35.4 43.9 69