Optimal Spectral Decomposition (OSD) for Ocean Data Analysis
|
|
|
- Griffin Alexander
- 5 years ago
- Views:
Transcription
1 Optimal Spectral Decomposition (OSD) for Ocean Data Analysis Peter C Chu (1) and Charles Sun (2) (1) Naval Postgraduate School, Monterey, CA pcchu@nps.edu, (2) NOAA/NODC, Silver Spring, MD 291 Charles.Sun@noaa.gov GTSPP Meeting, Honolulu, Hawaii, 27 October 28


2 How can we effectively use observational ocean data to represent and to predict the ocean state?
3 Collaborators Leonid M. Ivanov (California State Univ) Chenwu Fan (NPS) Tateana Margolina (NPS) Oleg Melnichenko (Univ of Hawaii)
4 References Chu, P.C., L.M. Ivanov, T.P. Korzhova, T.M. Margolina, and O.M. Melnichenko, 23a: Analysis of sparse and noisy ocean current data using flow decomposition. Part 1: Theory. Journal of Atmospheric and Oceanic Technology, 2 (4), Chu, P.C., L.M. Ivanov, T.P. Korzhova, T.M. Margolina, and O.M. Melnichenko, 23b: Analysis of sparse and noisy ocean current data using flow decomposition. Part 2: Application to Eulerian and Lagrangian data. Journal of Atmospheric and Oceanic Technology, 2 (4), Chu, P.C., L.M. Ivanov, and T.M. Margolina, 24: Rotation method for reconstructing process and field from imperfect data. International Journal of Bifurcation and Chaos, 14 (4),
5 References Chu, P.C., L.M. Ivanov, and T.M. Margolina, 25: Seasonal variability of the Black Sea Chlorophyll-a concentration. Journal of Marine Systems, 56, Chu, P.C., L.M. Ivanov, and O.M. Melnichenko, 25: Fall-winter current reversals on the Texas-Lousiana continental shelf. Journal of Physical Oceanography, 35, Chu, P.C., L.M. Ivanov, O.V. Melnichenko, and N.C. Wells, 27: On long baroclinic Rossby waves in the tropical North Atlantic observed from profiling floats. Journal of Geophysical Research, 112, C532, doi:1.129/26jc3698. Chu, P. C., L. M. Ivanov, O. V. Melnichenko, and R.-F. Li, 28: Argo floats revealing bimodality of large-scale mid-depth circulation in the North Atlantic. Acta Oceanologica Sinica, 27 (2), 1-1. Chu, P.C., C. Sun, and C. Fan, 29: Variability in meridional overturning circulation and thermohaline structure detected from GTSPP/Argo/MOODS/OSCAR Data. Proceedings on 21th Symposium on Climate Variability, American Meteorological Society, Phoenix, January 11-15, 29.
6 Observational Data
7 A Popular Method for Ocean Data Analysis: Optimum Interpolation (OI)
8 OI Equation Grid point k, Observational Point j f Q k o Q j f Q j First guess field (gridded) Observation First guess interpolated on the observational point N a f o f k = k + αkj j j j= 1 Q Q ( Q Q ) a Q k Analyzed field at the grid point
9 OI Weight Coefficients α kj N j= 1 o ( η + δλ) α = η ij ij i kj kj η ij η kj Autocorrelation functions λ o i Signal-to-noise ratio
10 Three Requirements for the OI Method (1) First guess field (2) Autocorrelation functions (3) High signal-to-noise ratio
11 What happens if the three conditions are not satisfied?
12 Spectral Representation - a Possible Alternative Method Ψm Basis functions c any ocean variable

13 Flow Decomposition
14 Basis Functions (Closed Basin)
15 Basis Functions (Open Boundaries)
16 Boundary Conditions
17 Spectral Decomposition M = + m Φm m= 1 T( x, t) T ( x) c ( t) ( x, t) M = + m Φm m= 1 S( x, t) S ( x) d ( t) ( x, t)
18 Benefits of Using OSD (1) Don t need first guess field (2) Don t need autocorrelation functions (3) Don t require high signal-to-noise ratio (4) Basis functions are pre-determined before the data analysis.
19 Optimal Mode Truncation
20 Vapnik (1983) Cost Function
21 Optimal Truncation Gulf of Mexico, Monterey Bay, Louisiana- Texas Shelf, North Atlantic Kopt = 4, Mopt = 3
22 Determination of Spectral Coefficients (Ill- Posed Algebraic Equation) This is caused by the features of the matrix A.
23 Rotation Method (Chu et al., 24)
24 Example-1 Temporal and spatial variability of Pacific Ocean
25 T (1 m)
26 T (1 m)
27 T (5 m)
 minus WOA 94")
28 Seasonal Anomaly versus WOA 94 (1 m) Monthly mean ( ) minus WOA 94 Monthly Mean
 minus WOA 94")
29 Seasonal Anomaly versus WOA 94 (1 m) Monthly mean ( ) minus WOA 94 Monthly Mean
 minus WOA 94")
30 Seasonal Anomaly versus WOA 94 (25 m) Monthly mean ( ) minus WOA 94 Monthly Mean
 minus WOA 94")
31 Seasonal Anomaly versus WOA 94 (5 m) Monthly mean ( ) minus WOA 94 Monthly Mean
32 T: NINO-3 (5 o S-5 o N, 15 o W-9 o W)
33 Example-2 OSD for Analyzing ARGO Data Baroclinic Rossby Waves in the tropical North Atlantic
 (Rahmstorf")
34 Tropical North Atlantic (4 o -24 o N) Important Transition Zone Meridional Overturning Circulation (MOC) (Rahmstorf 26)
35 MOC Variation Heat Transport Variation Climate Change
36 Are mid-depth (~1 m) ocean circulations steady? If not, what mechanisms cause the change? (Rossby wave propagation)

37
38 ARGO Observations (Oct-Nov 24) (a) Subsurface tracks (b) Float positions where (T,S) were measured 6 N 6 N 5 N 5 N 4 N 4 N 3 N 3 N 2 N 2 N 1 N 1 N N 1 S (a) 7 W 5 W 3 W 1 W N 1 S (b) 7 W 5 W 3 W 1 W
39 6 N Circulations at 1 m estimated from the original ARGO float tracks (bin method) April 24 April N 5 N N 4 N 32 4 N 28 3 N 24 3 N 2 2 N 16 2 N 12 1 N N 7 W 6 W 5 W 4 W 3 W 2 W 1 W N N 5 cm/s 7 W 5 W 3 W 1 W It is difficult to get physical insights and to use such noisy data into ocean numerical models.
40 Boundary Configuration Basis Functions for OSD 6 N 5 N 4 N 3 N Γ 2 Azores Islands 2 N Γ 1 1 N N 1 S Γ 3 Γ 3 / 7 W 5 W 3 W 1 W
41 Basis Functions for Streamfunction Mode-1 and Mode-2 6 N 6 N 5 N 5 N 4 N 3 N N 3 N N N 1 N 1 N N 1 2 N S 7 W 5 W 3 W 1 W 1 S 7 W 5 W 3 W 1 W
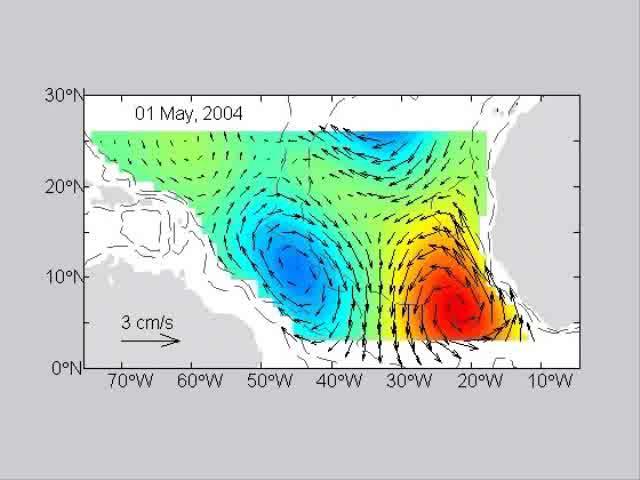
42 Circulations at 1 m (March 4 to May 5) Bin Method OSD 6 N 6 N 5 N 5 N 4 N 4 N 3 N 3 N 2 N 2 N 1 N 5 cm/s 1 N 5 cm/s N 7 W 5 W 3 W 1 W N 7 W 5 W 3 W 1 W
43 Mid-Depth Circulations (1 m) Mar-May 4 May Jul 4 Jul-Sep 4 Sep Nov 4 6 N 6 N 6 N 6 N 5 N 5 N 5 N 5 N 4 N 4 N 4 N 4 N 3 N 3 N 3 N 3 N 2 N 2 N 2 N 2 N 1 N 1 N 1 N 5 cm/s N 5 W 3 W 1 W 7 W Nov 4 Jan 5 5 cm/s N N 7 W 1 N 5 cm/s 5 cm/s 5 W 3 W N 7 W 1 W 5 W 3 W 1 W Mar May 5 Jan-Mar 5 6 N 6 N 6 N 5 N 5 N 5 N 4 N 4 N 4 N 3 N 3 N 3 N 2 N 2 N 2 N 1 N 1 N 1 N 5 cm/s 5 cm/s 5 cm/s N N 7 W 7 W 5 W 3 W 1 W 5 W 3 W 1 W N 7 W 5 W 3 W 1 W 7 W 5 W 3 W 1 W
44 Temperature at 95 m (March 4 to May 5) NOAA/WOA OSD 6 N 6 N 5 N N N 3 N N 3 N N N N 5 1 N 5 N 7 W 6 W 5 W 4 W 3 W 2 W 1 W N 7 W 6 W 5 W 4 W 3 W 2 W 1 W
45 8 4 Mid-Depth Temperature (95 m) May 4 Jul 4 Sep 4 Nov 4 6 N 6 N 6 N 6 N 5 N 4 N 3 N 2 N 1 N N W 6 W 5 W 4 W 3 W 2 W 1 W N 4 N 3 N 2 N 1 N N W 6 W 5 W 4 W 3 W 2 W 1 W N 4 N 3 N 2 N 1 N N W 6 W 5 W 4 W 3 W 2 W 1 W N 4 N 3 N 2 N 1 N N W 6 W 5 W 4 W 3 W 2 W 1 W Jan 5 Mar 5 May 5 6 N 5 N 5 6 N 5 N N 5 N N 3 N N 3 N N 3 N N N N N 5 1 N 5 1 N 5 N 7 W 6 W 5 W 4 W 3 W 2 W 1 W N 7 W 6 W 5 W 4 W 3 W 2 W 1 W N 7 W 6 W 5 W 4 W 3 W 2 W 1 W
46 Baroclinic Rossby Waves in Tropical North Atlantic
47 Fourier Expansion Temporal Annual and Semi-anuual
48 Fourier Expansion Temporal Annual and Semi-anuual
49 Optimization
50 Annual Component
51 Semi-annual Component
52 Time Longitude Diagrams of Meridional Velocity Along 11 o N Apr. Feb. Dec. Oct. Aug June 1 (a) (b) 5 W 4 W 3 W 2 W 5 W 4 W 3 W 2 W Annual Semi-Annual
53 Time Longitude Diagrams of temperature Along 11 o N Apr. Feb. Dec. Oct. Aug. June Apr. Feb. Annual Semi-Annual (c) (d) Dec. Oct. Aug. June (a) (b) 5 W 4 W 3 W 2 W 5 W 4 W 3 W 2 W 5 W 4 W 3 W 2 W 5 W 4 W 3 W 2 W Annual Semi-Annual 55 m 95 m
54 Annual Currents (1 m) May-Jun 24 Jul-Aug 24 3 N 5 cm/s 3 N 5 cm/s 2 N 2 N λ 1 λ 2 B 1 // A 1 1 N B 1 A 1 1 N B 1 / N 7 W 6 W 5 W 4 W 3 W 2 W 1 W (a) N 7 W 6 W 5 W 4 W 3 W 2 W 1 W (b) 3 N Sep-Oct 24 Nov-Dec 24 3 N 5 cm/s 5 cm/s 2 N B 1 // 2 N A 1 1 N 1 N B 2 A 2 A 2 N 7 W 6 W 5 W 4 W 3 W 2 W 1 W (c) N 7 W 6 W 5 W 4 W 3 W 2 W 1 W (d)

55 Characteristics of Annual Rossby Waves Western Basin Eastern Basin Western Basin Eastern Basin
56 (b) (a) 7 W 6 W 5 W 4 W 3 W 2 W 1 W N 7 W 6 W 5 W 4 W 3 W 2 W 1 W N 2 N 1 N N 3 N 2 N 1 N N 2 N 1 N N Annual Monthly Temperature Anomaly ( o C) at 95 m Depth Annual Rossby Waves (7-1 cm/s) Jun 4 Aug 4 Oct 4 Dec 4 3 N N 2 1 N (c) N 7 W 6 W 5 W 4 W 3 W 2 W 1 W 7 W 6 W 5 W 4 W 3 W 2 W 1 W (d) Temperature anomaly ( C)
57 Annual Monthly Temperature Anomaly ( o C) at 25 m Depth Equatorially Forced Coastal Kelvin waves (27-3 cm/s) Jun 4 Aug 4 3 N 3 N 2 N N N N 3 N (b) N (a) 7 W 6 W 5 W 4 W 3 W 2 W 1 W 7 W 6 W 5 W 4 W 3 W 2 W 1 W Oct 4 Dec 4 1 N 3 N N N N N N 7 W 6 W 5 W 4 W 3 W 2 W 1 W (c) N 7 W 6 W 5 W 4 W 3 W 2 W 1 W (d) Temperature anomaly ( C)
58 Zonal cross-sections of the annual component of the temperature anomaly ( o C) Depth (m) o N in Jun (a) 45 W 4 W 35 W 3 W 25 W 2 W 15 W Depth (m) o N in Oct, W A 1 A 1 (b) 45 W 4 W 35 W 3 W 25 W 2 W Depth (m).4 16 o N in Oct 4 7 A (c) 5 W 45 W 4 W 35 W 3 W 25 W 2 W
59 Baroclinic Modes Depth (m) Depth (m) (a) Φ l Φ l combination (b)
60 Annual Component in the Western Sub-Basin 3 Mean wind KE <E i > (m 2 /s 2 ) 2 1 (a) IV VI VIII X XII II IV Zonal: circle Mean KE for mid-depth currents <e i > (cm 2 /s 2 ) 1.5 (b) Meridional : Correlation between Winds and currents Correlation between wind Stress curl and streamfunction (solid: no-lag, dashed: 3 mon lag R ii R IV VI VIII X XII II IV (c) IV VI VIII X XII II IV (d) IV VI VIII X XII II IV Month square R (δt) 11
61 Annual Component in the Eastern Mean wind KE Mean KE for mid-depth currents Correlation between Winds and currents Correlation between wind Stress curl and streamfunction (solid: no-lag, dashed: 3 mon lag Sub-Basin <E i > (m 2 /s 2 ) <e i > (cm 2 /s 2 ) R ii R (a) IV VI VIII X XII II IV (b) IV VI VIII X XII II IV (c) IV VI VIII X XII II IV (d) IV VI VIII X XII II IV Month.5.5 R 11 (δt) Zonal: circle Meridional : square
62 Semi-annual currents at 1 m depth (24) (a)5/15 (b)5/3 (c)6/14 (d)6/29 (e) 7/13 3 N 2 N 1 N N 3 N 2 N C 2 5 cm/s (a) 7 W 6 W 5 W 4 W 3 W 2 W 1 W C 2 C 1 D 2 D 1 5 cm/s D 3 D 4 3 N 2 N 1 N N 3 N 2 N C 2 C 1 D2 5 cm/s D 3 D 4 7 W 6 W 5 W 4 W 3 W 2 W 1 W D 1 5 cm/s C 2 D 4 C 1 (d) 1 N C 1 1 N D 2 D 1 N D 2 D 1 7 W 6 W 5 W 4 W 3 W 2 W 1 W (b) N 7 W 6 W 5 W 4 W 3 W 2 W 1 W (e) 3 N 5 cm/s C 2 D 3 D 4 2 N 1 N C 1 D 2 D 1 N 7 W 6 W 5 W 4 W 3 W 2 W 1 W (c)
63 Semi-annual monthly temperature anomaly at 95m depth 3 N 3 N (a)jun 4 (b) Aug 4 (c) Oct 4 (d) Dec 4. 2 N 1 N N 3 N (a) 7 W 6 W 5 W 4 W 3 W 2 W 1 W 2 N 1 N N 3 N (b) 7 W 6 W 5 W 4 W 3 W 2 W 1 W 2 N 2 N 1 N 1 N N 7 W 6 W 5 W 4 W 3 W 2 W 1 W (c) N 7 W 6 W 5 W 4 W 3 W 2 W 1 W (d) Temperature anomaly ( C)
64 Semi-annual component of monthly temperature anomaly along 11 o N Depth (m) (a) 55 W 5 W 45 W 4 W 35 W 3 W 25 W 2 W.25 (a) 6/ Depth (m) (b) 7/ (b) 55 W 5 W 45 W 4 W 35 W 3 W 25 W 2 W.5 (c) 8/4 (24) (d) 9/ Depth (m) (c) 55 W 5 W 45 W 4 W 35 W 3 W 25 W 2 W Depth (m) (d) 55 W 5 W 45 W 4 W 35 W 3 W 25 W 2 W
65 Semi-annual temperature anomaly at 55m depth (24) 3 N (a) 5/15 2 N 1 N (b) 6/29 N 3 N 7 W 6 W 5 W 4 W 3 W 2 W 1 W (a) 2 N 1 N N 7 W 6 W 5 W 4 W 3 W 2 W 1 W (b) Temperature anomaly ( C)
66 Semiannual Component in the Western Sub-Basin (a).6.4 (d) (a) wind KE (b) current KE (c) corr wind stress and currents (d) corr between semi-annual currents and mean wind (e) corr between semiannual currents and annual wind stress. <E > (m 2 /s 2 ) i <e > (cm 2 /s 2 ) i IV VI VIII X XII II IV (b) IV VI VIII X XII II IV (c) r ii r ii IV VI VIII X XII II IV (e) IV VI VIII X XII II IV Month R ii.2.4 IV VI VIII X XII II IV Month
67 Semiannual Component in the Eastern Sub-Basin.8 (a).8 (d) <E i > (m 2 /s 2 ) (a) wind KE (b) current KE (c) corr wind stress and currents (d) corr between semi-annual currents and mean wind (e) corr between semiannual currents and annual wind stress. <e > (cm 2 /s 2 ) i IV VI VIII X XII II IV (b) IV VI VIII X XII II IV (c) r ii r ii IV VI VIII X XII II IV (e) IV VI VIII X XII II IV Month.2 R ii IV VI VIII X XII II IV Month
68 Results The annual and semi-annual unstable standing Rossby waves are detected in both the western and eastern sub-basins. The wind-driven Ekman pumping seems to be responsible for the standing wave generation in both the sub-basins.
69 Example-3 OSD for Analyzing Combined Current Meter and Surface Drifting Buoy Data
70 Ocean Velocity Observation 31 near-surface (1-14 m) current meter moorings during LATEX from April 1992 to November 1994 Drifting buoys deployed at the first segment of the Surface Current and Lagrangian-drift Program (SCULP-I) from October 1993 to July 1994.

71 Moorings and Buoys
72 LTCS current reversal detected from SCULP-I drift trajectories.

73
74 Reconstructed and observed circulations at Station-24.
75 Probability of TLCS Current Reversal for Given Period (T) n ~-current reversal n 1 ~ 1-current reversal n 2 ~ 2-current reversals m ~ all realizations
76 Fitting the Poison Distribution μ is the mean number of reversal for a single time interval μ ~.8
77 Dependence of P, P 1, P 2 on T For observational periods larger than 2 days, the probability for no current reversal is less than.2. For 15 day observational period, the probability for 1-reversal reaches.5 Data Solid Curve Poison Distribution Fitting Dashed Curve
78 Time Interval between Successive Current Reversals (not a Rare Event)

79 LTCS current reversal detected from the reconstructed velocity data December 3, 1993 January 3, 1994 January 6, 1994
80 EOF Analysis of the Reconstructed Velocity Filed Variance (%) EOF 1/21/93-5/21/93 12/19/93-4/17/94 1/5/94-11/29/
81 Mean and First EOF Mode
 3.")
82 Mean Circulation 1. First Period (1/21-5/21/93) 2. Second Period 12/19/93-4/17/94) 3. Third Period (1/5-11/29/94)
83 EOF1 1. First Period (1/21-5/21/93) 2. Second Period 12/19/93-4/17/94) 3. Third Period (1/5-11/29/94)
84 Calculated A1(t) Using Current Meter Mooring (solid) and SCULP-1 Drifters (dashed)

85 8 total reversals observed Uals ~ alongshore wind


86 Morlet Wavelet A 1 (t) Uals
87 Surface Wind Data 7 buoys of the National Data Buoy Center (NDBC) and industry (C-MAN) around LATEX area
88 Regression between A1(t) and Surface Winds Solid Curve (reconstructed) Dashed Curve (predicted using winds)
89 Results Alongshore wind forcing is the major factor causing the synoptic current reversal. Other factors, such as the Mississippi- Atchafalaya River discharge and offshore eddies of Loop Current origin, may affect the reversal threshold, but can not cause the synoptic current reversal.
90 Part-4 OSD for Analyzing CODAR Data
91 CODAR

92 Monterey Bay
93 3 cm/s 37. o N 3 cm/s 36.9 o N 36.8 o N 36.7 o N 36.6 o N o W o W 122. o W o W o W o W o W 122. o W o W o W Place for comments: left - radar derived currents for 17: UT December 1, 1999 right reconstructed velocity field.

94
95 Conclusions OSD is a useful tool for processing realtime velocity data with short duration and limited-area sampling especially the ARGO data. OSD has wide application in ocean data assimilation.
Optimal Spectral Decomposition (OSD) for GTSPP Data Analysis
 for GTSPP Data Analysis") Optimal Spectral Decomposition (OSD) for GTSPP Data Analysis Peter C Chu (1),Charles Sun (2), & Chenwu Fan (1) (1) Naval Postgraduate School, Monterey, CA 93943 pcchu@nps.edu, http://faculty.nps.edu/pcchu/
Optimal Spectral Decomposition (OSD) for GTSPP Data Analysis Peter C Chu (1),Charles Sun (2), & Chenwu Fan (1) (1) Naval Postgraduate School, Monterey, CA 93943 pcchu@nps.edu, http://faculty.nps.edu/pcchu/
Optimal Spectral Decomposition for ARGO Data Analysis
 IUGG 2007 PS010 New Insights into the Ocean and Its Circulation from ARGO and GODAE July 9-10, Perugia, Italy Optimal Spectral Decomposition for ARGO Data Analysis Peter C. Chu Naval Postgraduate School
Global Ocean Tripole and Climate Variability
 Global Ocean Tripole and Climate Variability Peter C. Chu Naval Postgraduate School EAPS, MIT June 2, 2010 Outline (1) Recent Development in Short-term Climate Variability (2) Data Analysis: (T, S) Profiles
Effect of Inter and Intra annual Thermohaline Variability on Acoustic Propagation
 Effect of Inter and Intra annual Thermohaline Variability on Acoustic Propagation Peter C Chu, Colleen McDonald, Murat Kucukosmanoglu Albert Judono, Tetyana Margolina Department of Oceanography Naval Postgraduate
Eddy and Chlorophyll-a Structure in the Kuroshio Extension Detected from Altimeter and SeaWiFS
 14th Symposium on Integrated Observing and Assimilation Systems for the Atmosphere, Oceans, and Land Surface (IOAS-AOLS), AMS Atlanta, January 17-21, 21 Eddy and Chlorophyll-a Structure in the Kuroshio
New Development in Coastal Ocean Analysis and Prediction. Peter C. Chu Naval Postgraduate School Monterey, CA 93943, USA
 New Development in Coastal Ocean Analysis and Prediction Peter C. Chu Naval Postgraduate School Monterey, CA 93943, USA Coastal Model Major Problems in Coastal Modeling (1) Discretization (2) Sigma Error
Wind induced oscillator dynamics in the Black Sea revealed by Lagrangian drifters
 GEOPHYSICAL RESEARCH LETTERS, VOL. 34, L13609, doi:10.1029/2007gl030263, 2007 Wind induced oscillator dynamics in the Black Sea revealed by Lagrangian drifters Leonid M. Ivanov, 1,2,3 Oleg V. Melnichenko,
From El Nino to Atlantic Nino: pathways as seen in the QuikScat winds
 From El Nino to Atlantic Nino: pathways as seen in the QuikScat winds Rong Fu 1, Lei Huang 1, Hui Wang 2 Presented by Nicole Smith-Downey 1 1 Jackson School of Geosciences, The University of Texas at Austin
ENSO Outlook by JMA. Hiroyuki Sugimoto. El Niño Monitoring and Prediction Group Climate Prediction Division Japan Meteorological Agency
 ENSO Outlook by JMA Hiroyuki Sugimoto El Niño Monitoring and Prediction Group Climate Prediction Division Outline 1. ENSO impacts on the climate 2. Current Conditions 3. Prediction by JMA/MRI-CGCM 4. Summary
Preliminary study of multi-year ocean salinity trends with merged SMOS and Aquarius data.
 Preliminary study of multi-year ocean salinity trends with merged SMOS and Aquarius data. Gary Lagerloef and Hsun-Ying Kao Earth & Space Research Seattle, USA Aquarius Status Completed 3-year Prime Mission
Life Cycle of Convective Systems over Western Colombia
 Life Cycle of Convective Systems over Western Colombia Meiry Sakamoto Uiversidade de São Paulo, São Paulo, Brazil Colombia Life Cycle of Convective Systems over Western Colombia Convective System (CS)
ATSR SST Observations of the Tropical Pacific Compared with TOPEX/Poseidon Sea Level Anomaly
 ATSR SST Observations of the Tropical Pacific Compared with TOPEX/Poseidon Sea Level Anomaly J.P.Angell and S.P.Lawrence Earth Observation Science Group, Dept. Physics and Astronomy, Space Research Centre,
Investigate the influence of the Amazon rainfall on westerly wind anomalies and the 2002 Atlantic Nino using QuikScat, Altimeter and TRMM data
 Investigate the influence of the Amazon rainfall on westerly wind anomalies and the 2002 Atlantic Nino using QuikScat, Altimeter and TRMM data Rong Fu 1, Mike Young 1, Hui Wang 2, Weiqing Han 3 1 School
8.1 Attachment 1: Ambient Weather Conditions at Jervoise Bay, Cockburn Sound
 8.1 Attachment 1: Ambient Weather Conditions at Jervoise Bay, Cockburn Sound Cockburn Sound is 20km south of the Perth-Fremantle area and has two features that are unique along Perth s metropolitan coast
The Arctic Energy Budget
 The Arctic Energy Budget The global heat engine [courtesy Kevin Trenberth, NCAR]. Differential solar heating between low and high latitudes gives rise to a circulation of the atmosphere and ocean that
WHEN IS IT EVER GOING TO RAIN? Table of Average Annual Rainfall and Rainfall For Selected Arizona Cities
 WHEN IS IT EVER GOING TO RAIN? Table of Average Annual Rainfall and 2001-2002 Rainfall For Selected Arizona Cities Phoenix Tucson Flagstaff Avg. 2001-2002 Avg. 2001-2002 Avg. 2001-2002 October 0.7 0.0
Non-linear patterns of eddy kinetic energy in the Japan/East Sea
 Non-linear patterns of eddy kinetic energy in the Japan/East Sea O.O. Trusenkova, D.D. Kaplunenko, S.Yu. Ladychenko, V.B. Lobanov V.I.Il ichev Pacific Oceanological Institute, FEB RAS Vladivostok, Russia
Identifying the MJO Skeleton in Observational Data
 . Identifying the MJO Skeleton in Observational Data Sam Stechmann, Wisconsin Andrew Majda, NYU World Weather Open Science Conference August 20, 2014 Montreal, Canada Theoretical prediction of MJO structure
South Eastern Australian Rainfall in relation to the Mean Meridional Circulation
 South Eastern Australian Rainfall in relation to the Mean Meridional Circulation Bertrand Timbal, Hanh Nguyen, Robert Fawcett, Wasyl Drosdowsky and Chris Lucas CAWCR / Bureau of Meteorology Long-term SEA
El Niño, South American Monsoon, and Atlantic Niño links as detected by a. TOPEX/Jason Observations
 El Niño, South American Monsoon, and Atlantic Niño links as detected by a decade of QuikSCAT, TRMM and TOPEX/Jason Observations Rong Fu 1, Lei Huang 1, Hui Wang 2, Paola Arias 1 1 Jackson School of Geosciences,
A Modeling Study on Flows in the Strait of Hormuz (SOH)
") A Modeling Study on Flows in the Strait of Hormuz (SOH) Peter C Chu & Travis Clem Naval Postgraduate School Monterey, CA 93943, USA IUGG 2007: PS005 Flows and Waves in Straits. July 5-6, Perugia, Italy
A Modeling Study on Flows in the Strait of Hormuz (SOH) Peter C Chu & Travis Clem Naval Postgraduate School Monterey, CA 93943, USA IUGG 2007: PS005 Flows and Waves in Straits. July 5-6, Perugia, Italy
Yellow Sea Thermohaline and Acoustic Variability
 Yellow Sea Thermohaline and Acoustic Variability Peter C Chu, Carlos J. Cintron Naval Postgraduate School, USA Steve Haeger Naval Oceanographic Office, USA Yellow Sea Bottom Sediment Chart Four Bottom
SIO 210: Data analysis
 SIO 210: Data analysis 1. Sampling and error 2. Basic statistical concepts 3. Time series analysis 4. Mapping 5. Filtering 6. Space-time data 7. Water mass analysis 10/8/18 Reading: DPO Chapter 6 Look
Evidence of a Barrier Layer in the Sulu and Celebes Seas
 3299 Evidence of a Barrier Layer in the Sulu and Celebes Seas PETER C. CHU Naval Ocean Analysis and Prediction Laboratory, Department of Oceanography, Naval Postgraduate School, Monterey, California QINYU
WIND EFFECTS ON CHEMICAL SPILL IN ST ANDREW BAY SYSTEM
 WIND EFFECTS ON CHEMICAL SPILL IN ST ANDREW BAY SYSTEM PETER C. CHU, PATRICE PAULY Naval Postgraduate School, Monterey, CA93943 STEVEN D. HAEGER Naval Oceanographic Office, Stennis Space Center MATHEW
Global Ocean Monitoring: Recent Evolution, Current Status, and Predictions
 Global Ocean Monitoring: Recent Evolution, Current Status, and Predictions Prepared by Climate Prediction Center, NCEP November 6, 2009 http://www.cpc.ncep.noaa.gov/products/godas/ This project to deliver
Atmospheric circulation analysis for seasonal forecasting
 Training Seminar on Application of Seasonal Forecast GPV Data to Seasonal Forecast Products 18 21 January 2011 Tokyo, Japan Atmospheric circulation analysis for seasonal forecasting Shotaro Tanaka Climate
Changing Hydrology under a Changing Climate for a Coastal Plain Watershed
 Changing Hydrology under a Changing Climate for a Coastal Plain Watershed David Bosch USDA-ARS, Tifton, GA Jeff Arnold ARS Temple, TX and Peter Allen Baylor University, TX SEWRU Objectives 1. Project changes
Coastal Ocean Circulation Experiment off Senegal (COCES)
") DISTRIBUTION STATEMENT A. Approved for public release; distribution is unlimited. Coastal Ocean Circulation Experiment off Senegal (COCES) Pierre-Marie Poulain Istituto Nazionale di Oceanografia e di Geofisica
DISTRIBUTION STATEMENT A. Approved for public release; distribution is unlimited. Coastal Ocean Circulation Experiment off Senegal (COCES) Pierre-Marie Poulain Istituto Nazionale di Oceanografia e di Geofisica
ECMWF: Weather and Climate Dynamical Forecasts
 ECMWF: Weather and Climate Dynamical Forecasts Medium-Range (0-day) Partial coupling Extended + Monthly Fully coupled Seasonal Forecasts Fully coupled Atmospheric model Atmospheric model Wave model Wave
Littoral Zone Oceanography for ASW/MIW
 Littoral Zone Oceanography for ASW/MIW Peter C. Chu Department of Oceanography Naval Postgraduate School Monterey, CA 93943 phone: (831) 656-3688 fax: (831) 656-3686 email: chu@nps.navy.mil Sponsor: Naval
The global ocean circulation: an elegant dynamical system
 The global ocean circulation: an elegant dynamical system Henk Dijkstra Institute for Marine and Atmospheric research Utrecht (IMAU), Department of Physics and Astronomy, Utrecht University, The Netherlands
Chiang Rai Province CC Threat overview AAS1109 Mekong ARCC
 Chiang Rai Province CC Threat overview AAS1109 Mekong ARCC This threat overview relies on projections of future climate change in the Mekong Basin for the period 2045-2069 compared to a baseline of 1980-2005.
Investigating the contribution of allochthonous subsidies to kelp forests in central California
 Investigating the contribution of allochthonous subsidies to kelp forests in central California melissa m foley UCSC Institute of Marine Science and Center for Ocean Solutions system connectivity rivers
Will a warmer world change Queensland s rainfall?
 Will a warmer world change Queensland s rainfall? Nicholas P. Klingaman National Centre for Atmospheric Science-Climate Walker Institute for Climate System Research University of Reading The Walker-QCCCE
Variability and trend of the heat balance in the southeast Indian Ocean
 Variability and trend of the heat balance in the southeast Indian Ocean Ming Feng, CSIRO Marine & Atmospheric Research Arne Biastoch, Claus Böning, Leibniz-Institut für Meeresforschung Nick Caputi, Department
PICES XIV (2005) in Vladivostok
 in Vladivostok") PICES XIV (2005) in Vladivostok Present and future of the North Pacific simulated by a high resolution coupled atmosphere-ocean model Hiroyasu HASUMI (CCSR) Tatsuo SUZUKI (FRCGC) Takashi SAKAMOTO (FRCGC)
PICES XIV (2005) in Vladivostok Present and future of the North Pacific simulated by a high resolution coupled atmosphere-ocean model Hiroyasu HASUMI (CCSR) Tatsuo SUZUKI (FRCGC) Takashi SAKAMOTO (FRCGC)
SIO 210: Data analysis methods L. Talley, Fall Sampling and error 2. Basic statistical concepts 3. Time series analysis
 SIO 210: Data analysis methods L. Talley, Fall 2016 1. Sampling and error 2. Basic statistical concepts 3. Time series analysis 4. Mapping 5. Filtering 6. Space-time data 7. Water mass analysis Reading:
CHAPTER 2 DATA AND METHODS. Errors using inadequate data are much less than those using no data at all. Charles Babbage, circa 1850
 CHAPTER 2 DATA AND METHODS Errors using inadequate data are much less than those using no data at all. Charles Babbage, circa 185 2.1 Datasets 2.1.1 OLR The primary data used in this study are the outgoing
EVALUATION OF THE GLOBAL OCEAN DATA ASSIMILATION SYSTEM AT NCEP: THE PACIFIC OCEAN
 2.3 Eighth Symposium on Integrated Observing and Assimilation Systems for Atmosphere, Oceans, and Land Surface, AMS 84th Annual Meeting, Washington State Convention and Trade Center, Seattle, Washington,
Benguela Niño/Niña events and their connection with southern Africa rainfall have been documented before. They involve a weakening of the trade winds
 Benguela Niño/Niña events and their connection with southern Africa rainfall have been documented before. They involve a weakening of the trade winds in the equatorial western Atlantic in the early monsoon,
Steady Flow: rad conv. where. E c T gz L q 2. p v 2 V. Integrate from surface to top of atmosphere: rad TOA rad conv surface
 The Three-Dimensional Circulation 1 Steady Flow: F k ˆ F k ˆ VE 0, rad conv where 1 E c T gz L q 2 p v 2 V Integrate from surface to top of atmosphere: VE F FF F 0 rad TOA rad conv surface 2 What causes
Assessment of the Impact of El Niño-Southern Oscillation (ENSO) Events on Rainfall Amount in South-Western Nigeria
 Events on Rainfall Amount in South-Western Nigeria") 2016 Pearl Research Journals Journal of Physical Science and Environmental Studies Vol. 2 (2), pp. 23-29, August, 2016 ISSN 2467-8775 Full Length Research Paper http://pearlresearchjournals.org/journals/jpses/index.html
2016 Pearl Research Journals Journal of Physical Science and Environmental Studies Vol. 2 (2), pp. 23-29, August, 2016 ISSN 2467-8775 Full Length Research Paper http://pearlresearchjournals.org/journals/jpses/index.html
Invited paper on the South Atlantic J. Lutjeharms
 AGU Chapman Conference on the Agulhas System Stellenbosch South Africa October 8 12, 2012 With regard to the thermohaline circulation, we identify some key locations where very important processes occur,
Improvements to the Wind Driven Component of the OSCAR Surface Current Product
 OVWST Meeting May 18-2, 29 p. 1 Improvements to the Wind Driven Component of the OSCAR Surface Current Product Kathleen Dohan, Gary S. E. Lagerloef, and John T. Gunn Earth & Space Research Seattle, Washington
SIO 210 CSP: Data analysis methods L. Talley, Fall Sampling and error 2. Basic statistical concepts 3. Time series analysis
 SIO 210 CSP: Data analysis methods L. Talley, Fall 2016 1. Sampling and error 2. Basic statistical concepts 3. Time series analysis 4. Mapping 5. Filtering 6. Space-time data 7. Water mass analysis Reading:
GAMINGRE 8/1/ of 7
 FYE 09/30/92 JULY 92 0.00 254,550.00 0.00 0 0 0 0 0 0 0 0 0 254,550.00 0.00 0.00 0.00 0.00 254,550.00 AUG 10,616,710.31 5,299.95 845,656.83 84,565.68 61,084.86 23,480.82 339,734.73 135,893.89 67,946.95
Role of Interannual Kelvin wave propagations in the equatorial Atlantic on the Angola-Benguela current system.
 Role of Interannual Kelvin wave propagations in the equatorial Atlantic on the Angola-Benguela current system. Presented by: Rodrigue Anicet IMBOL KOUNGUE With the Collaboration of: - Dr Serena ILLIG -
Monitoring and modeling the Eastern Mediterranean circulation and its climatic variability
 UNIVESRITY OF ATHENS, OCEAN PHYSICS AND MODELING GROUP Monitoring and modeling the Eastern Mediterranean circulation and its climatic variability S. Sofianos and OPAM group EastMed Symposium, November
Delayed Response of the Extratropical Northern Atmosphere to ENSO: A Revisit *
 Delayed Response of the Extratropical Northern Atmosphere to ENSO: A Revisit * Ruping Mo Pacific Storm Prediction Centre, Environment Canada, Vancouver, BC, Canada Corresponding author s address: Ruping
Real World Globes Investigating Surface Currents around the Globe Authored by Ryan Glaubke, Graduate Student at Old Dominion University, Norfolk, VA
 Real World Globes Investigating Surface Currents around the Globe Authored by Ryan Glaubke, Graduate Student at Old Dominion University, Norfolk, VA Purpose: - To practice basic plotting techniques using
Interannual Variability of Wind Induced Onshore Transport over the Northern West Florida Shelf
 Interannual Variability of Wind Induced Onshore Transport over the Northern West Florida Shelf Steve Morey Austin Todd Mark Bourassa COAPS/FSU Motivation Understand the physical controls on regional Gag
A Synoptic Climatology of Heavy Precipitation Events in California
 A Synoptic Climatology of Heavy Precipitation Events in California Alan Haynes Hydrometeorological Analysis and Support (HAS) Forecaster National Weather Service California-Nevada River Forecast Center
Sierra Weather and Climate Update
 Sierra Weather and Climate Update 2014-15 Kelly Redmond Western Regional Climate Center Desert Research Institute Reno Nevada Yosemite Hydroclimate Workshop Yosemite Valley, 2015 October 8-9 Percent of
High Baroclinic Equatorial Kelvin Waves and Central Pacific Surface Warming
 High Baroclinic Equatorial Kelvin Waves and Central Pacific Surface Warming Peter C Chu Naval Postgraduate School Monterey, CA, USA Jilin Sun and Qinyu Liu Ocean University of China Qingdao, China IUGG2003,
Dynamical Statistical Seasonal Prediction of Atlantic Hurricane Activity at NCEP
 Dynamical Statistical Seasonal Prediction of Atlantic Hurricane Activity at NCEP Hui Wang, Arun Kumar, Jae Kyung E. Schemm, and Lindsey Long NOAA/NWS/NCEP/Climate Prediction Center Fifth Session of North
Coupled ocean-atmosphere ENSO bred vector
 Coupled ocean-atmosphere ENSO bred vector Shu-Chih Yang 1,2, Eugenia Kalnay 1, Michele Rienecker 2 and Ming Cai 3 1 ESSIC/AOSC, University of Maryland 2 GMAO, NASA/ Goddard Space Flight Center 3 Dept.
Technical note on seasonal adjustment for M0
 Technical note on seasonal adjustment for M0 July 1, 2013 Contents 1 M0 2 2 Steps in the seasonal adjustment procedure 3 2.1 Pre-adjustment analysis............................... 3 2.2 Seasonal adjustment.................................
United States Climate
 25-1 Alabama Annual Average Temperature Data Source: http://www.wrcc.dri.edu/cgi-bin/divplot1_form.pl?0106 25-2 How does climate vary as we traverse the U.S. along 40 N? 25-3 Average Temperature Along
Responding to the 2016 and 2017 Mass Coral Bleaching events on the Great Barrier Reef: from Observations to Modelling
 Responding to the 2016 and 2017 Mass Coral Bleaching events on the Great Barrier Reef: from Observations to Modelling EMatson@aims Craig Steinberg & Claire Spillman N. Cantin, J. Benthuysen, H. Tonin,
Intraseasonal and seasonal variations in in the eastern equatorial Indian Ocean. Y. Masumoto, H. Hase, Y. Kuroda, and H. Sasaki
 Intraseasonal and seasonal variations in in the eastern equatorial Indian Ocean -A -A high-resolution OGCM and and ADCP Observation- Y. Masumoto, H. Hase, Y. Kuroda, and H. Sasaki FRCGC/IORGC/ESC JAMSTEC
Global climate predictions: forecast drift and bias adjustment issues
 www.bsc.es Ispra, 23 May 2017 Global climate predictions: forecast drift and bias adjustment issues Francisco J. Doblas-Reyes BSC Earth Sciences Department and ICREA Many of the ideas in this presentation
Drought in Southeast Colorado
 Drought in Southeast Colorado Nolan Doesken and Roger Pielke, Sr. Colorado Climate Center Prepared by Tara Green and Odie Bliss http://climate.atmos.colostate.edu 1 Historical Perspective on Drought Tourism
ENSO Cycle: Recent Evolution, Current Status and Predictions. Update prepared by Climate Prediction Center / NCEP 5 August 2013
 ENSO Cycle: Recent Evolution, Current Status and Predictions Update prepared by Climate Prediction Center / NCEP 5 August 2013 Outline Overview Recent Evolution and Current Conditions Oceanic Niño Index
Characterizing the Physical Oceanography of Coastal Waters Off Rhode Island
 Characterizing the Physical Oceanography of Coastal Waters Off Rhode Island Dan Codiga and Dave Ullman Graduate School of Oceanography University of Rhode Island RI OSAMP Stakeholder Meeting January 5,
Journal of Coastal Develpopment ISSN :
 Volume 15, Number 1,October 2011 : 1-8 Original Paper INTRASEASONAL VARIATIONS OF NEAR-SURFACE ZONAL CURRENT OBSERVED IN THE SOUTH-EASTERN EQUATORIAL INDIAN OCEAN Iskhaq Iskandar Department of Physics,
Variability and trends in daily minimum and maximum temperatures and in diurnal temperature range in Lithuania, Latvia and Estonia
 Variability and trends in daily minimum and maximum temperatures and in diurnal temperature range in Lithuania, Latvia and Estonia Jaak Jaagus Dept. of Geography, University of Tartu Agrita Briede Dept.
Technical note on seasonal adjustment for Capital goods imports
 Technical note on seasonal adjustment for Capital goods imports July 1, 2013 Contents 1 Capital goods imports 2 1.1 Additive versus multiplicative seasonality..................... 2 2 Steps in the seasonal
Zonal currents of the SW tropical Pacific. William S. Kessler and Lionel Gourdeau
 Zonal currents of the SW tropical Pacific William S. Kessler and Lionel Gourdeau Data/model sources CARS CTD compilation (Ridgway and Dunn) IFREMER XBT data Topex/Jason altimetry Auckland-Solomon Strait
Lecture 1. Amplitude of the seasonal cycle in temperature
 Lecture 6 Lecture 1 Ocean circulation Forcing and large-scale features Amplitude of the seasonal cycle in temperature 1 Atmosphere and ocean heat transport Trenberth and Caron (2001) False-colour satellite
SC-WACCM! and! Problems with Specifying the Ozone Hole
 SC-WACCM! and! Problems with Specifying the Ozone Hole R. Neely III, K. Smith2, D. Marsh,L. Polvani2 NCAR, 2Columbia Thanks to: Mike Mills, Francis Vitt and Sean Santos Motivation To design a stratosphere-resolving
CHINESE JOURNAL OF GEOPHYSICS. Analysis of the characteristic time scale during ENSO. LIU Lin 1,2, YU Wei2Dong 2
 49 1 2006 1 CHINESE JOURNAL OF GEOPHYSICS Vol. 49, No. 1 Jan., 2006,. ENSO., 2006, 49 (1) : 45 51 Liu L, Yu W D. Analysis of the characteristic time scale during ENSO. Chinese J. Geophys. (in Chinese),
ALASKA REGION CLIMATE OUTLOOK BRIEFING. December 22, 2017 Rick Thoman National Weather Service Alaska Region
 ALASKA REGION CLIMATE OUTLOOK BRIEFING December 22, 2017 Rick Thoman National Weather Service Alaska Region Today s Outline Feature of the month: Autumn sea ice near Alaska Climate Forecast Basics Climate
When to Do the Gridding?
 Part 6: Objective Analysis Optimum Interpolation Composite Analysis When to Do the Gridding? The methods described are applicable to any problem where the data you are given do not fill the domain of interest
Scarborough Tide Gauge
 Tide Gauge Location OS: 504898E 488622N WGS84: Latitude: 54 16' 56.990"N Longitude: 00 23' 25.0279"W Instrument Valeport 740 (Druck Pressure Transducer) Benchmarks Benchmark Description TGBM = 4.18m above
Supplementary appendix
 Supplementary appendix This appendix formed part of the original submission and has been peer reviewed. We post it as supplied by the authors. Supplement to: Lowe R, Stewart-Ibarra AM, Petrova D, et al.
C
 C 0.8 0.4 0.2 0.0-0.2-0.6 Fig. 1. SST-wind relation in the North Pacific and Atlantic Oceans. Left panel: COADS SST (color shade), surface wind vectors, and SLP regressed upon the Pacific Decadal Oscillation
Global Ocean Monitoring: A Synthesis of Atmospheric and Oceanic Analysis
 Extended abstract for the 3 rd WCRP International Conference on Reanalysis held in Tokyo, Japan, on Jan. 28 Feb. 1, 2008 Global Ocean Monitoring: A Synthesis of Atmospheric and Oceanic Analysis Yan Xue,
WATER VAPOR FLUXES OVER EQUATORIAL CENTRAL AFRICA
 WATER VAPOR FLUXES OVER EQUATORIAL CENTRAL AFRICA INTRODUCTION A good understanding of the causes of climate variability depend, to the large extend, on the precise knowledge of the functioning of the
ALASKA REGION CLIMATE FORECAST BRIEFING. January 23, 2015 Rick Thoman ESSD Climate Services
 ALASKA REGION CLIMATE FORECAST BRIEFING January 23, 2015 Rick Thoman ESSD Climate Services Today Climate Forecast Basics Review of recent climate forecasts and conditions CPC Forecasts and observations
Local Ctimatotogical Data Summary White Hall, Illinois
 SWS Miscellaneous Publication 98-5 STATE OF ILLINOIS DEPARTMENT OF ENERGY AND NATURAL RESOURCES Local Ctimatotogical Data Summary White Hall, Illinois 1901-1990 by Audrey A. Bryan and Wayne Armstrong Illinois
Relationship between atmospheric circulation indices and climate variability in Estonia
 BOREAL ENVIRONMENT RESEARCH 7: 463 469 ISSN 1239-695 Helsinki 23 December 22 22 Relationship between atmospheric circulation indices and climate variability in Estonia Oliver Tomingas Department of Geography,
Early Period Reanalysis of Ocean Winds and Waves
 Early Period Reanalysis of Ocean Winds and Waves Andrew T. Cox and Vincent J. Cardone Oceanweather Inc. Cos Cob, CT Val R. Swail Climate Research Branch, Meteorological Service of Canada Downsview, Ontario,
Developing Coastal Ocean Forecasting Systems and Their Applications
 Developing Coastal Ocean Forecasting Systems and Their Applications Xiaochun Wang a,b LASG/IAP, CAS, July 23, 2010 Contributions from: JPL Yi Chao, John Farrara, Peggy Li, Zhijin Li, Quoc Vu, Hongchun
ENSO Cycle: Recent Evolution, Current Status and Predictions. Update prepared by Climate Prediction Center / NCEP 25 February 2013
 ENSO Cycle: Recent Evolution, Current Status and Predictions Update prepared by Climate Prediction Center / NCEP 25 February 2013 Outline Overview Recent Evolution and Current Conditions Oceanic Niño Index
GPC Exeter forecast for winter Crown copyright Met Office
 GPC Exeter forecast for winter 2015-2016 Global Seasonal Forecast System version 5 (GloSea5) ensemble prediction system the source for Met Office monthly and seasonal forecasts uses a coupled model (atmosphere
over the Northern West Florida Shelf from SeaWinds and ASCAT
 Interannual Variability of Synoptic Scale Winds over the Northern West Florida Shelf from SeaWinds and ASCAT Steve Morey Mark Bourassa Austin Todd COAPS/FSU This work is sponsored by the NASA Ocean Vector
"STUDY ON THE VARIABILITY OF SOUTHWEST MONSOON RAINFALL AND TROPICAL CYCLONES FOR "
 "STUDY ON THE VARIABILITY OF SOUTHWEST MONSOON RAINFALL AND TROPICAL CYCLONES FOR 2001 2010" ESPERANZA O. CAYANAN, Ph.D. Chief, Climatology & Agrometeorology R & D Section Philippine Atmospheric Geophysical
ANNUAL CLIMATE REPORT 2016 SRI LANKA
 ANNUAL CLIMATE REPORT 2016 SRI LANKA Foundation for Environment, Climate and Technology C/o Mahaweli Authority of Sri Lanka, Digana Village, Rajawella, Kandy, KY 20180, Sri Lanka Citation Lokuhetti, R.,
Coastal Ocean Circulation Experiment off Senegal (COCES)
") DISTRIBUTION STATEMENT A. Approved for public release; distribution is unlimited. Coastal Ocean Circulation Experiment off Senegal (COCES) Pierre-Marie Poulain Istituto Nazionale di Oceanografia e di Geofisica
DISTRIBUTION STATEMENT A. Approved for public release; distribution is unlimited. Coastal Ocean Circulation Experiment off Senegal (COCES) Pierre-Marie Poulain Istituto Nazionale di Oceanografia e di Geofisica
Introduction to Climate ~ Part I ~
 2015/11/16 TCC Seminar JMA Introduction to Climate ~ Part I ~ Shuhei MAEDA (MRI/JMA) Climate Research Department Meteorological Research Institute (MRI/JMA) 1 Outline of the lecture 1. Climate System (
Name Period Part I: INVESTIGATING OCEAN CURRENTS: PLOTTING BUOY DATA
 Name Period Part I: INVESTIGATING OCEAN CURRENTS: PLOTTING BUOY DATA INTRODUCTION: Ocean currents are like huge rivers in the sea. They carry drifting organisms, vital dissolved chemical nutrients and
Time Series Analysis
 Time Series Analysis A time series is a sequence of observations made: 1) over a continuous time interval, 2) of successive measurements across that interval, 3) using equal spacing between consecutive
ENSO UPDATE By Joseph D Aleo, CCM
 ENSO UPDATE By Joseph D Aleo, CCM El Nino is still hanging on but likely not for very long. Warmer than normal water can still be seen along the equator in the tropical Pacific. It is even warmer in the
HFR Surface Currents Observing System in Lower Chesapeake Bay and Virginia Coast
 HFR Surface Currents Observing System in Lower Chesapeake Bay and Virginia Coast Larry P. Atkinson, Teresa Garner, and Jose Blanco Center for Coastal Physical Oceanography Old Dominion University Norfolk,
AN ASSESSMENT OF THE RELATIONSHIP BETWEEN RAINFALL AND LAKE VICTORIA LEVELS IN UGANDA
 AN ASSESSMENT OF THE RELATIONSHIP BETWEEN RAINFALL AND LAKE VICTORIA LEVELS IN UGANDA BY CATHERINE MULINDE BA (Environmental Management), PGD (Meteorology) Teaching Assistant Department of Geography, Meteorology
What is happening to the Jamaican climate?
 What is happening to the Jamaican climate? Climate Change and Jamaica: Why worry? Climate Studies Group, Mona (CSGM) Department of Physics University of the West Indies, Mona Part 1 RAIN A FALL, BUT DUTTY
ARUBA CLIMATOLOGICAL SUMMARY 2017 PRECIPITATION
 ARUBA CLIMATOLOGICAL SUMMARY 2017 PRECIPITATION The total amount of rainfall recorded at Reina Beatrix International Airport for the year 2017 was 391.0 mm. This is 17.1 % below normal ( Figure 1 ). During
Forecast of Nearshore Wave Parameters Using MIKE-21 Spectral Wave Model
 Forecast of Nearshore Wave Parameters Using MIKE-21 Spectral Wave Model Felix Jose 1 and Gregory W. Stone 2 1 Coastal Studies Institute, Louisiana State University, Baton Rouge, LA 70803 2 Coastal Studies
Fig.3.1 Dispersion of an isolated source at 45N using propagating zonal harmonics. The wave speeds are derived from a multiyear 500 mb height daily
 Fig.3.1 Dispersion of an isolated source at 45N using propagating zonal harmonics. The wave speeds are derived from a multiyear 500 mb height daily data set in January. The four panels show the result