Investigating the contribution of allochthonous subsidies to kelp forests in central California
|
|
|
- Harold Garrison
- 5 years ago
- Views:
Transcription


1 Investigating the contribution of allochthonous subsidies to kelp forests in central California melissa m foley UCSC Institute of Marine Science and Center for Ocean Solutions
2 system connectivity rivers nearshore ocean open ocean coral reefs mangroves estuaries forests


3 system connectivity - subsidies seabirds and islands Maron et al salmon, bears, and watersheds Hicks et al watersheds to rivers Power et al. 2004
4 system connectivity - subsidies terrestrial open ocean nearshore ocean
5 system connectivity - subsidies terrestrial open ocean? nearshore ocean
6 system connectivity - subsidies nutrients particulate organic matter nearshore ocean importance of different subsidies depends on * temporal availability * spatial availability * abundance * quality


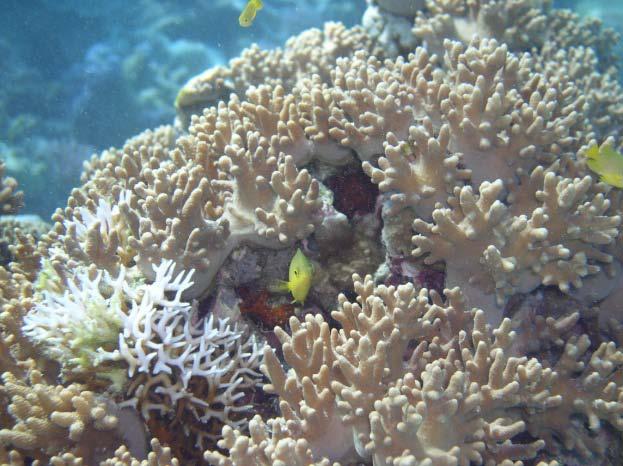
7 nearshore ecosystems ~ 7% marine habitat ~ 25% primary productivity - disproportionately diverse - valuable ecosystem services - threatened by human activities

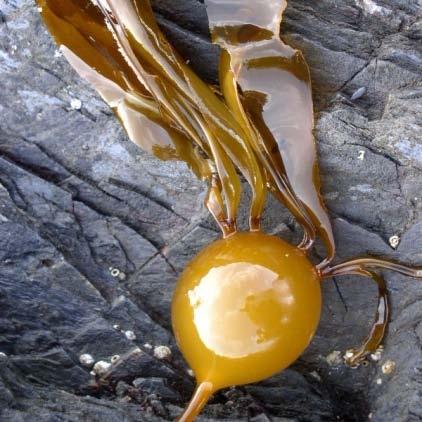
8 giant kelp (Macrocystis) forests foundation species support high algal, invert, & fish diversity high productivity and biomass persist year-round life history stages affected by inputs from terrestrial and open ocean systems
9 system connectivity what subsidies are delivered via stream and upwelling sources to giant kelp communities throughout the year? rivers open ocean Macrocystis
10 interdisciplinary approach oceanography ecology biogeochemistry rivers open ocean Macrocystis


11 Big Sur, California San Francisco Bay Monterey Bay Big Sur

12 Big Sur, California stream Big Sur Big Creek Non-River River North Big Creek River South stream N
13 allochthonous subsidies DIC & NO 3 atmospheric input stream input DIC DIC NO 3 NO 3 DIC DIC NO 3 upwelling input
14 allochthonous subsidies -upwelling DIC DIC NO 3 NO 3 DIC DIC NO 3 upwelling input open ocean inputs seasonal upwelling circulation narrow continental shelf
15 allochthonous subsidies - streams stream input DIC DIC NO 3 NO 3 DIC DIC NO 3 terrestrial-derived inputs short, steep watersheds seasonal rainfall episodic inputs


16 Big Creek stream dynamics 30 December January 2006
17 allochthonous subsidy delivery stream input upwelling input
18 allochthonous subsidy delivery upwelling strength m 3 /s/100m Jan Feb 2005 Mar Apr May Jun Jul Aug Sep Oct Nov Dec stream discharge Jan Feb 2006 Mar Apr May Jun Jul Aug Sep month Oct Nov Dec Jan Feb Mar Apr May Jun Jul Aug Sep Oct Nov Dec m 3 s Jan Feb Mar Apr May Jun Jul Aug Sep Oct Nov Dec Jan Feb Mar Apr May Oct Nov Dec Jan Feb Mar Apr May Jun Jul Aug Sep Oct Nov Dec 5 0 Jun Jul Aug Sep month

19 water sampling nearshore non-river intertidal winter only spring/summer only year round nearshore river north nearshore river south intertidal upstream
20 nitrate & phosphate Nitrate concentration (um) Non-river River Upstream Phosphate concentration (um) Jan Feb Mar Apr May Jun Jul Aug Sep Oct Nov Dec 2006 Jan Feb Mar Apr May Jun Jul Aug Sep Oct Nov Dec 2007 Jan Feb Mar Apr May Jun Jul Aug Sep Oct Nov Dec Month
21 chlorophyll-a concentration 10 8 Big Creek Non-river River Upstream Chlorophyll Concentration (µg/l) Big Sur Jan Feb Mar Apr May Jun Jul Aug Sep Oct Nov Dec Jan Feb Mar Apr May Jun Jul Aug Sep Oct Nov Dec Jan Feb Mar Apr May Jun Jul Aug Sep Oct Nov Dec Month
![[chlorophyll-a] in context](/docs-images/94/119568931/images/22-1.jpg "Point Reyes Monterey Bay Big")
22 [chlorophyll-a] in context Point Reyes Monterey Bay Big Sur
23 decoupled chl-a & nitrate dynamics concentration concentration time iron replete area time iron limited area chlorophyll nitrate
24 stable isotopes C and N * naturally occurring in unequal abundances * differential uptake caused by increased mass of heavy isotope (light isotope = faster) * predictable change between trophic levels * signature is ratio of heavy:light isotope e.g. higher = more 13 C; lower = more 12 C
25 allochthonous subsidy delivery stream input DIC DIC NO 3 NO 3 upwelling input DIC DIC NO 3 is there temporal and/or spatial variation in Macrocystis isotope values due to seasonal changes in the subsidy source?
26 kelp isotopes and tissue content * blades collected monthly * collected from 5 & 15 meters depth * standardized blade size & condition * analyzed for δ 13 C, δ 15 N, C:N, %C, %N
27 allochthonous subsidies isotope signatures stream UPWELLING Non-River δ 13 C DIC ~ 0 δ 15 N DIN ~ +7 to 8 TERRESTRIAL δ 13 C DIC ~ -15 to -5 δ 15 N DIN ~ -2 to +4 River North River South stream N
28 possible seasonal patterns δ 15 N late summer spring early summer winter early spring δ 13 C
29 seasonal variability 9 8 Macrocystis Late Summer - Winter (Aug-Dec) Spring - Early Summer (Mar-Jul) 5 m δ 15 N m 15 m 5 15 m δ 13 C
30 what drives seasonal variability? Use environmental variables to estimate the timing and concentration of DIC and DIN delivered to nearshore kelp beds Use statistical tests to determine if any environmental variables explain the variability in seasonal isotope values River discharge (m 3 /s) River discharge Water transport (m 3 /s/100m) Upwelling Index Nitrate Concentration (µm) Nitrate Concentration 0 Jan Feb Mar Apr May Jun Jul Aug Sep Oct Nov Dec -40 Jan Feb Mar Apr May Jun Jul Aug Sep Oct Nov Dec 0 Jan Feb Mar Apr May Jun Jul Aug Sep Oct Nov Dec
31 upwelling strength & [nitrate] seasonal variability in δ 13 C and δ 15 N driven by upwelling strength DIN (nitrate) concentration Water transport (m 3 /s/100m) Upwelling Index Nitrate Concentration (µm) Nitrate Concentration -40 Jan Feb Mar Apr May Jun Jul Aug Sep Oct Nov Dec 0 Jan Feb Mar Apr May Jun Jul Aug Sep Oct Nov Dec
32 upwelling strength & [nitrate] δ 13 C δ 15 N NO 3 (µm) NO 3 (µm) δ 13 C Jul 05 Aug 05 Sep 05 Oct 05 Dec 05 May 06 Jun 06 Jul 06 Oct 06 Nov 06 Sep 06 Mar 07 May 07 Jun 07 Jul 07 Aug 07 Sep Nitrate Concentration (µm) δ 15 N Jul 05 Aug 05 Sep 05 Oct 05 Macrocystis Nitrate Dec 05 May 06 Jun 06 Jul 06 Oct 06 Nov 06 Sep 06 Mar 07 May 07 Jun 07 Jul 07 Aug 07 Sep Nitrate Concentration (µm) date date
33 [nitrate] & isotope values k e l p
34 [nitrate] & isotope values k e l p k e l p kelp = lighter than source
35 [nitrate] & isotope values k e l p kelp = lighter than source k e l p kelp = same as source
36 seasonal variability 9 8 Macrocystis Late Summer - Winter (Aug-Dec) Spring - Early Summer (Mar-Jul) 5 m δ 15 N m 15 m 5 15 m δ 13 C
37 what does this mean for consumers?
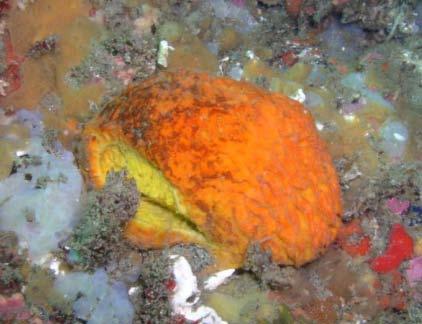
38 consumer subsidies terrestrial POM kelp phytoplankton red blades (20%)
39 consumer subsidies terrestrial POM kelp phytoplankton what food source(s) do kelp forest consumers use and does that vary seasonally? red blades (20%)
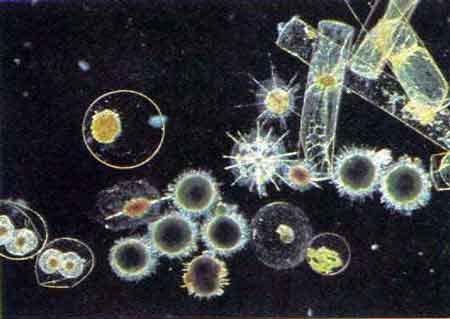
40 isotope value of resources Macrocystis Phytoplankton Terrestrial POM 10 δ 15 N δ 13 C
41 isotope value of seasonal resources Spring Macro Summer Macro Fall Macro Phytoplankton Terrestrial POM δ 15 N δ 13 C
 δ 13 C ~5.5 δ 15 N ~6.3 δ 15 N 10.0 9.5 9.0 8.5-20.5-20.0-19.5-19.0-18.")
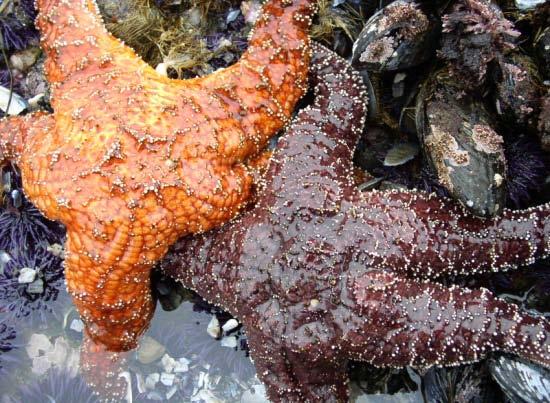
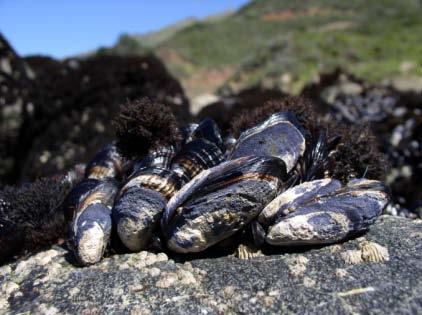
42 δ 13 C kelp forest consumers filter feeders Spring Summer Fall Bryozoans δ 13 C ~9.5 (Membranipora) δ 15 N ~9.5 δ 15 N Mussels (Mytilus) δ 13 C ~3.5 δ 15 N ~3.6 δ 15 N δ 13 C δ 13 C Sponges (Tethya) δ 13 C ~5.5 δ 15 N ~6.3 δ 15 N
43 seasonal resources & consumers 14 possible scenarios Spring Macro Summer Macro Fall Macro Phytoplankton Terrestrial POM δ 15 N δ 13 C
44 seasonal resources & consumers δ 15 N Spring consumers Summer consumers Fall consumers Spring Macro Summer Macro Fall Macro Phytoplankton Terrestrial POM δ 13 C
45 stable isotope mixing model MixSIR 14 δ 15 N Spring consumers Summer consumers Fall consumers Spring Macro Summer Macro Fall Macro Phytoplankton Terrestrial POM Bayesian approach incorporates uncertainty accommodates multiple isotopes and sources δ 13 C (Moore & Semmens 2008)
46 MixSIR results Macrocystis dominates % contribution to consumer tissue Total kelp Phytoplankton Terrestrial POM Me spr Me sum Me fall My spr 5m My spr 15m My sum 5m My sum 15m My fall 5m Nereocystis luetkeana (30%) My fall 15m Te spr Te sum Te fall Membranipora Mytilus Tethya
47 summary kelp & isotopes terrestrial POM kelp phytoplankton
48 summary kelp & isotopes stream input (iron) kelp upwelling input

49 importance of connectivity climate change wildfire habitat destruction rivers open ocean primary producers consumers
50 altering connectivity wildfire rivers open ocean primary producers consumers
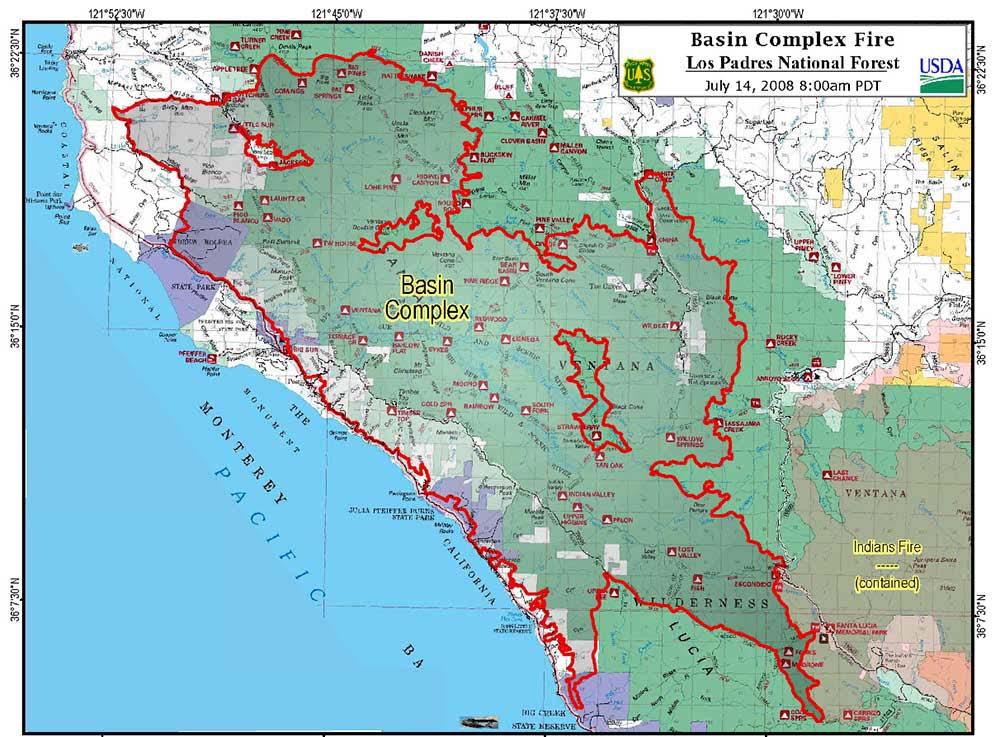
51 altering connectivity


52 altering connectivity increased sediment increased terrestrial material
53 altering connectivity 120 Stream POM 600 Stream total PM 70 Intertidal total PM Concentration (mg/l) pre-fire post-fire Big Creek Big Sur 0 Big Creek Big Sur 0 Big Creek Big Sur increased particulate matter
54 altering connectivity 3.5 Chlorophyll (µg/l) 20 Nitrate (µm) 0.5 Phosphate (µm) Concentration pre-fire post-fire Big Creek Big Sur 0 Big Creek Big Sur 0.0 Big Creek Big Sur increased nutrient concentration
55 altering connectivity?
56 questions?
GAMINGRE 8/1/ of 7
 FYE 09/30/92 JULY 92 0.00 254,550.00 0.00 0 0 0 0 0 0 0 0 0 254,550.00 0.00 0.00 0.00 0.00 254,550.00 AUG 10,616,710.31 5,299.95 845,656.83 84,565.68 61,084.86 23,480.82 339,734.73 135,893.89 67,946.95
Satellite-derived environmental drivers for top predator hotspots
 Satellite-derived environmental drivers for top predator hotspots Peter Miller @PeterM654 South West Marine Ecosystems 2017 21 Apr. 2017, Plymouth University Satellite environmental drivers for hotspots
Algae and Dissolved Oxygen Dynamics of Landa Lake and the Upper Spring Run
 Algae and Dissolved Oxygen Dynamics of Landa Lake and the Upper Spring Run Why study algae and dissolved oxygen dynamics of Landa Lake and the Upper Spring Run? During low-flow conditions, extensive algal
Changing Hydrology under a Changing Climate for a Coastal Plain Watershed
 Changing Hydrology under a Changing Climate for a Coastal Plain Watershed David Bosch USDA-ARS, Tifton, GA Jeff Arnold ARS Temple, TX and Peter Allen Baylor University, TX SEWRU Objectives 1. Project changes
Climate also has a large influence on how local ecosystems have evolved and how we interact with them.
 The Mississippi River in a Changing Climate By Paul Lehman, P.Eng., General Manager Mississippi Valley Conservation (This article originally appeared in the Mississippi Lakes Association s 212 Mississippi
Time-series observations in the Northern Indian Ocean V.V.S.S. Sarma National Institute of Oceanography Visakhapatnam, India
 The Second GEOSS Asia-Pacific Symposium, Tokyo, 14-16 th April 28 Time-series observations in the Northern Indian Ocean V.V.S.S. Sarma National Institute of Oceanography Visakhapatnam, India Seasonal variations
REDWOOD VALLEY SUBAREA
 Independent Science Review Panel Conceptual Model of Watershed Hydrology, Surface Water and Groundwater Interactions and Stream Ecology for the Russian River Watershed Appendices A-1 APPENDIX A A-2 REDWOOD
BIOLOGICAL OCEANOGRAPHY
 BIOLOGICAL OCEANOGRAPHY AN INTRODUCTION 0 ^ J ty - y\ 2 S CAROL M. LALLI and TIMOTHY R. PARSONS University of British Columbia, Vancouver, Canada PERGAMON PRESS OXFORD NEW YORK SEOUL TOKYO ABOUT THIS VOLUME
Long-term Water Quality Monitoring in Estero Bay
 Long-term Water Quality Monitoring in Estero Bay Keith Kibbey Laboratory Director Lee County Environmental Laboratory Division of Natural Resource Management Estero Bay Monitoring Programs Three significant
Climatic and Ecological Conditions in the Klamath Basin of Southern Oregon and Northern California: Projections for the Future
 Climatic and Ecological Conditions in the Klamath Basin of Southern Oregon and Northern California: Projections for the Future A Collaborative Effort by: CLIMATE LEADERSHIP INITIATIVE INSTITUTE FOR A SUSTAINABLE
HAIDA GWAII CLIMATE ASSESSMENT 2010 Special Report for MIEDS Franc Pridoehl
 HAIDA GWAII CLIMATE ASSESSMENT 2010 Special Report for MIEDS Franc Pridoehl INTRODUCTION Climatic conditions have varied considerably on Haida Gwaii over the past centuries and millennia (Hebda 2007).
Seasonal cycle of phytoplankton community composition off Newport, Oregon, in 2009
 Seasonal cycle of phytoplankton community composition off Newport, Oregon, in 29 Xiuning Du 1, William Peterson 2 1 College of Environmental science and Engineering, Ocean University of China, Qingdao,
UNIT 5: ECOLOGY Chapter 15: The Biosphere
 CORNELL NOTES Directions: You must create a minimum of 5 questions in this column per page (average). Use these to study your notes and prepare for tests and quizzes. Notes will be stamped after each assigned
Cambridge International Examinations Cambridge International Advanced Subsidiary and Advanced Level
 Cambridge International Examinations Cambridge International Advanced Subsidiary and Advanced Level *2554656732* MARINE SCIENCE 9693/01 Paper 1 AS Structured Questions October/November 2017 1 hour 30 minutes
Eddy and Chlorophyll-a Structure in the Kuroshio Extension Detected from Altimeter and SeaWiFS
 14th Symposium on Integrated Observing and Assimilation Systems for the Atmosphere, Oceans, and Land Surface (IOAS-AOLS), AMS Atlanta, January 17-21, 21 Eddy and Chlorophyll-a Structure in the Kuroshio
Abiotic Dominant Dominant Factors Plants Animals
 TERRESTRIAL BIOMES Abiotic Dominant Dominant Factors Plants Animals Tropical Rain Forest Hot & wet year round Ferns Woody vines Broad leaved evergreen trees Sloths Jaguars Monkeys Toucans Tropical Dry
WHEN IS IT EVER GOING TO RAIN? Table of Average Annual Rainfall and Rainfall For Selected Arizona Cities
 WHEN IS IT EVER GOING TO RAIN? Table of Average Annual Rainfall and 2001-2002 Rainfall For Selected Arizona Cities Phoenix Tucson Flagstaff Avg. 2001-2002 Avg. 2001-2002 Avg. 2001-2002 October 0.7 0.0
Illinois State Water Survey Division
 Illinois State Water Survey Division SURFACE WATER SECTION SWS Miscellaneous Publication 108 SEDIMENT YIELD AND ACCUMULATION IN THE LOWER CACHE RIVER by Misganaw Demissie Champaign, Illinois June 1989
Changes in spatial distribution of chub mackerel under climate change: the case study using Japanese purse seine fisheries data in the East China Sea
 Changes in spatial distribution of chub mackerel under climate change: the case study using Japanese purse seine fisheries data in the East China Sea Tohya Yasuda, Ryuji Yukami, Seiji Ohshimo Seikai National
Habitat Suitability for Forage Fishes in Chesapeake Bay
 Habitat Suitability for Forage Fishes in Chesapeake Bay Aug 2017 Jul 2019 Mary C Fabrizio Troy D Tuckey Aaron J Bever Michael L MacWilliams 21 June 2018 Photo: Chesapeake Bay Program Motivation Production
Long term change in the abundances of northern Gulf of Mexico scyphomedusae Chrysaora sp. and Aurelia spp. with links to climate variability
 Long term change in the abundances of northern Gulf of Mexico scyphomedusae Chrysaora sp. and Aurelia spp. with links to climate variability Kelly L. Robinson William M. Graham U. Southern Mississippi
Disentangling Impacts of Climate & Land Use Changes on the Quantity & Quality of River Flows in Southern Ontario
 Disentangling Impacts of Climate & Land Use Changes on the Quantity & Quality of River Flows in Southern Ontario by Trevor Dickinson & Ramesh Rudra, Water Resources Engineering University of Guelph Acknowledgements
Average temperature ( F) World Climate Zones. very cold all year with permanent ice and snow. very cold winters, cold summers, and little rain or snow
 World Climate Zones. very cold all year with permanent ice and snow. very cold winters, cold summers, and little rain or snow") P r e v i e w Look carefully at the climagraph of Mumbai, India. What is the wettest month (or months) in Mumbai? What is the driest month (or months) in Mumbai? What effects might this city s climate
P r e v i e w Look carefully at the climagraph of Mumbai, India. What is the wettest month (or months) in Mumbai? What is the driest month (or months) in Mumbai? What effects might this city s climate
Analysis of Historical Pattern of Rainfall in the Western Region of Bangladesh
 24 25 April 214, Asian University for Women, Bangladesh Analysis of Historical Pattern of Rainfall in the Western Region of Bangladesh Md. Tanvir Alam 1*, Tanni Sarker 2 1,2 Department of Civil Engineering,
The pattern determination of sea surface temperature distribution and chlorophyll a in the Southern Caspian Sea using SOM Model
 Iranian Journal of Fisheries Sciences 2()05-4 203 The pattern determination of sea surface temperature distribution and chlorophyll a in the Southern Caspian Sea using SOM Model Downloaded from jifro.ir
Chiang Rai Province CC Threat overview AAS1109 Mekong ARCC
 Chiang Rai Province CC Threat overview AAS1109 Mekong ARCC This threat overview relies on projections of future climate change in the Mekong Basin for the period 2045-2069 compared to a baseline of 1980-2005.
Investigation of Rainfall Trend in Jorhat Town, Assam, India
 EUROPEAN ACADEMIC RESEARCH Vol. II, Issue 7/ October 2014 ISSN 2286-4822 www.euacademic.org Impact Factor: 3.1 (UIF) DRJI Value: 5.9 (B+) Investigation of Rainfall Trend in Jorhat Town, MAYURAKSHI BHUYAN
Global Climates. Name Date
 Global Climates Name Date No investigation of the atmosphere is complete without examining the global distribution of the major atmospheric elements and the impact that humans have on weather and climate.
2015 Fall Conditions Report
 2015 Fall Conditions Report Prepared by: Hydrologic Forecast Centre Date: December 21 st, 2015 Table of Contents Table of Figures... ii EXECUTIVE SUMMARY... 1 BACKGROUND... 2 SUMMER AND FALL PRECIPITATION...
Identifying risks of geoduck aquaculture: the role of larval transport
 Material intended for presentation only. Please do not cite, copy or distribute Bivalve life cycle: a simplified view however: High fecundities (female geoduck 50 million eggs/year) High larval mortalities
PICES-2010 Annual Meeting Portland, OR October 27, Jenny Q. Lane Peter T. Raimondi Raphael M. Kudela
 The development of toxigenic Pseudo-nitzschia bloom models in Monterey Bay, CA, and their application at a single monitoring site within the model domain PICES-2010 Annual Meeting Portland, OR October
TEST NAME: Biome Test 10/7 TEST ID: GRADE:05 - Fifth Grade SUBJECT:Life and Physical Sciences TEST CATEGORY: My Classroom
 TEST NAME: Biome Test 10/7 TEST ID:1239163 GRADE:05 - Fifth Grade SUBJECT:Life and Physical Sciences TEST CATEGORY: My Classroom Biome Test 10/7 Page 1 of 8 10/07/16, Biome Test 10/7 Student: Class: Date:
over the Northern West Florida Shelf from SeaWinds and ASCAT
 Interannual Variability of Synoptic Scale Winds over the Northern West Florida Shelf from SeaWinds and ASCAT Steve Morey Mark Bourassa Austin Todd COAPS/FSU This work is sponsored by the NASA Ocean Vector
Optimal Spectral Decomposition (OSD) for Ocean Data Analysis
 for Ocean Data Analysis") Optimal Spectral Decomposition (OSD) for Ocean Data Analysis Peter C Chu (1) and Charles Sun (2) (1) Naval Postgraduate School, Monterey, CA 93943 pcchu@nps.edu, http://faculty.nps.edu/pcchu/ (2) NOAA/NODC,
Optimal Spectral Decomposition (OSD) for Ocean Data Analysis Peter C Chu (1) and Charles Sun (2) (1) Naval Postgraduate School, Monterey, CA 93943 pcchu@nps.edu, http://faculty.nps.edu/pcchu/ (2) NOAA/NODC,
TILT, DAYLIGHT AND SEASONS WORKSHEET
 TILT, DAYLIGHT AND SEASONS WORKSHEET Activity Description: Students will use a data table to make a graph for the length of day and average high temperature in Utah. They will then answer questions based
3.0 TECHNICAL FEASIBILITY
 3.0 TECHNICAL FEASIBILITY 3.1 INTRODUCTION To enable seasonal storage and release of water from Lake Wenatchee, an impoundment structure would need to be constructed on the lake outlet channel. The structure
Future climate impacts on Puget Sound oceanography: the North Pacific and hydrological context
 Western Washington University Western CEDAR Salish Sea Ecosystem Conference 2014 Salish Sea Ecosystem Conference (Seattle, Wash.) Apr 30th, 1:30 PM - 3:00 PM Future climate impacts on Puget Sound oceanography:
Water Temperature Monitoring of the Klamath River Mainstem
 Water Temperature Monitoring of the Klamath River Mainstem Progress Report #3 Prepared by Robert Rohde and Leaf Hillman with assistance provided by Susan Smith and William Tripp Karuk Tribe of California
Modeling Indian Ocean Biogeochemistry Iron Limitation and Dipole-Zonal Mode Impacts
 Modeling Indian Ocean Biogeochemistry Iron Limitation and Dipole-Zonal Mode Impacts Jerry Wiggert jwiggert@ccpo.odu.edu Funded by the NASA Oceanography Program Outline 1) Coupled 3-D Bio-physical Model
Marine Ecoregions. Marine Ecoregions. Slide 1. Robert G. Bailey. USDA Forest Service Rocky Mountain Research Station
 Slide 1 Marine Ecoregions Robert G. Bailey Marine Ecoregions Robert G. Bailey USDA Forest Service Rocky Mountain Research Station rgbailey@fs.fed.us Draft of 7/20/2006 8:44 PM Abstract: Oceans occupy some
Increased phytoplankton blooms detected by ocean color
 Increased phytoplankton blooms detected by ocean color Mati Kahru & B. Greg Mitchell Scripps Institution of Oceanography/ University of California San Diego La Jolla, CA 92093-0218 ASLO Aquatic Sciences
Cost of Inflow Forecast Uncertainty for Day Ahead Hydropower Production Scheduling
 Cost of Inflow Forecast Uncertainty for Day Ahead Hydropower Production Scheduling HEPEX 10 th University Workshop June 25 th, 2014 NOAA Center for Weather and Climate Thomas D. Veselka and Les Poch Argonne
Real-Time NO 3 and PO 4 Sensors for Chesapeake Bay
 Real-Time NO 3 and PO 4 Sensors for Chesapeake Bay Lora Harris Jeremy Testa Amanda Moore UMCES Chesapeake Biological Laboratory Mark Trice Rebecca Burrell Kristin Heyer John Zimmerelli Bruce Michael Ben
Stream Discharge and the Water Budget
 Regents Earth Science Unit 6: Water Cycle & Climate Name: Lab # Stream Discharge and the Water Budget Introduction: The United States Geological Survey (USGS) measures and publishes values for the daily
Three main areas of work:
 Task 2: Climate Information 1 Task 2: Climate Information Three main areas of work: Collect historical and projected weather and climate data Conduct storm surge and wave modeling, sea-level rise (SLR)
U.S. Outlook For October and Winter Thursday, September 19, 2013
 About This report coincides with today s release of the monthly temperature and precipitation outlooks for the U.S. from the Climate Prediction Center (CPC). U.S. CPC October and Winter Outlook The CPC
Climate Variability. Eric Salathé. Climate Impacts Group & Department of Atmospheric Sciences University of Washington. Thanks to Nathan Mantua
 Climate Variability Eric Salathé Climate Impacts Group & Department of Atmospheric Sciences University of Washington Thanks to Nathan Mantua Northwest Climate: the mean Factors that influence local/regional
Physical Features of Monsoon Asia. 192 Unit 7 Teachers Curriculum Institute 60 N 130 E 140 E 150 E 60 E 50 N 160 E 40 N 30 N 150 E.
 50 N 60 E 70 E 80 E 90 E 100 E 60 N 110 E 120 E 130 E 140 E 150 E 50 N 160 E 40 N 40 N 30 N 60 E 30 N 150 E Tropic of Cancer 20 N Tropic of Cancer 20 N 10 N 10 N 0 Equator 0 Equator 10 S 10 S 0 500 1,000
Interannual variation of MODIS NDVI in Lake Taihu and its relation to climate in submerged macrophyte region
 Yale-NUIST Center on Atmospheric Environment Interannual variation of MODIS NDVI in Lake Taihu and its relation to climate in submerged macrophyte region ZhangZhen 2015.07.10 1 Outline Introduction Data
United States Climate
 25-1 Alabama Annual Average Temperature Data Source: http://www.wrcc.dri.edu/cgi-bin/divplot1_form.pl?0106 25-2 How does climate vary as we traverse the U.S. along 40 N? 25-3 Average Temperature Along
Streamflow, Sediment, and Nutrient Simulation of the Bitterroot Watershed using SWAT
 Streamflow, Sediment, and Nutrient Simulation of the Bitterroot Watershed using SWAT by Dr. Michael Van Liew Montana Department of Environmental Quality Helena, Montana, USA Site Map of SWAT Watersheds
COUPLING A DISTRIBUTED HYDROLOGICAL MODEL TO REGIONAL CLIMATE MODEL OUTPUT: AN EVALUATION OF EXPERIMENTS FOR THE RHINE BASIN IN EUROPE
 P.1 COUPLING A DISTRIBUTED HYDROLOGICAL MODEL TO REGIONAL CLIMATE MODEL OUTPUT: AN EVALUATION OF EXPERIMENTS FOR THE RHINE BASIN IN EUROPE Jan Kleinn*, Christoph Frei, Joachim Gurtz, Pier Luigi Vidale,
Characterizing the Physical Oceanography of Coastal Waters Off Rhode Island
 Characterizing the Physical Oceanography of Coastal Waters Off Rhode Island Dan Codiga and Dave Ullman Graduate School of Oceanography University of Rhode Island RI OSAMP Stakeholder Meeting January 5,
Climate Change and Water Supply Research. Drought Response Workshop October 8, 2013
 Climate Change and Water Supply Research Drought Response Workshop October 8, 2013 DWR Photo Oroville Reservoir, 2009 Talk Overview Expectations History Atmospheric Rivers and Water Supply Current Research
Sampling, Storage and Pre-Treatment Techniques
 1. Sampling Protocol Sample needs to be representative of the body of water (or other matrix) from where it originates. Sampling Considerations A. Location B. Frequency (hourly, daily) C. Spatial and temporal
Presentation Overview. Southwestern Climate: Past, present and future. Global Energy Balance. What is climate?
 Southwestern Climate: Past, present and future Mike Crimmins Climate Science Extension Specialist Dept. of Soil, Water, & Env. Science & Arizona Cooperative Extension The University of Arizona Presentation
Time Series Analysis
 Time Series Analysis A time series is a sequence of observations made: 1) over a continuous time interval, 2) of successive measurements across that interval, 3) using equal spacing between consecutive
A Report on a Statistical Model to Forecast Seasonal Inflows to Cowichan Lake
 A Report on a Statistical Model to Forecast Seasonal Inflows to Cowichan Lake Prepared by: Allan Chapman, MSc, PGeo Hydrologist, Chapman Geoscience Ltd., and Former Head, BC River Forecast Centre Victoria
Integrating Weather Forecasts into Folsom Reservoir Operations
 Integrating Weather Forecasts into Folsom Reservoir Operations California Extreme Precipitation Symposium September 6, 2016 Brad Moore, PE US Army Corps of Engineers Biography Brad Moore is a Lead Civil
MONITORING THE EFFECTS OF CLIMATE CHANGE ON SPRINGS, SEEPS AND OTHER WATER NATIONAL PRESERVE
 MONITORING THE EFFECTS OF CLIMATE CHANGE ON SPRINGS, SEEPS AND OTHER WATER RESOURCES IN THE MOJAVE NATIONAL PRESERVE Boris Poff and Debra Hughson Mojave National Preserve, California CLIMATE CHANGE Predictions
Earth s Major Terrerstrial Biomes. *Wetlands (found all over Earth)
") Biomes Biome: the major types of terrestrial ecosystems determined primarily by climate 2 main factors: Depends on ; proximity to ocean; and air and ocean circulation patterns Similar traits of plants
Biomes Biome: the major types of terrestrial ecosystems determined primarily by climate 2 main factors: Depends on ; proximity to ocean; and air and ocean circulation patterns Similar traits of plants
2. PHYSICAL SETTING FINAL GROUNDWATER MANAGEMENT PLAN. 2.1 Topography. 2.2 Climate
 FINAL GROUNDWATER MANAGEMENT PLAN 2. PHYSICAL SETTING Lassen County is a topographically diverse area at the confluence of the Cascade Range, Modoc Plateau, Sierra Nevada and Basin and Range geologic provinces.
Average 175, , , , , , ,046 YTD Total 1,098,649 1,509,593 1,868,795 1,418, ,169 1,977,225 2,065,321
 AGRICULTURE 01-Agriculture JUL 2,944-4,465 1,783-146 102 AUG 2,753 6,497 5,321 1,233 1,678 744 1,469 SEP - 4,274 4,183 1,596 - - 238 OCT 2,694 - - 1,032 340-276 NOV 1,979-5,822 637 3,221 1,923 1,532 DEC
Average 175, , , , , , ,940 YTD Total 944,460 1,284,944 1,635,177 1,183, ,954 1,744,134 1,565,640
 AGRICULTURE 01-Agriculture JUL 2,944-4,465 1,783-146 102 AUG 2,753 6,497 5,321 1,233 1,678 744 1,469 SEP - 4,274 4,183 1,596 - - 238 OCT 2,694 - - 1,032 340-276 NOV 1,979-5,822 637 3,221 1,923 1,532 DEC
PRELIMINARY DRAFT FOR DISCUSSION PURPOSES
 Memorandum To: David Thompson From: John Haapala CC: Dan McDonald Bob Montgomery Date: February 24, 2003 File #: 1003551 Re: Lake Wenatchee Historic Water Levels, Operation Model, and Flood Operation This
Remote Sensing of Episodic Rainfall Events Affecting Coral Reefs in Southwestern Puerto Rico
 Remote Sensing of Episodic Rainfall Events Affecting Coral Reefs in Southwestern Puerto Rico Y. Detrés, R. Armstrong, E. Otero and R. García yasmin@cacique.uprm.edu University of Puerto Rico, Mayaguez
Chapter 52 An Introduction to Ecology and the Biosphere
 Chapter 52 An Introduction to Ecology and the Biosphere Ecology The study of the interactions between organisms and their environment. Ecology Integrates all areas of biological research and informs environmental
The Colorado Drought of 2002 in Perspective
 The Colorado Drought of 2002 in Perspective Colorado Climate Center Nolan Doesken and Roger Pielke, Sr. Prepared by Tara Green and Odie Bliss http://climate.atmos.colostate.edu Known Characteristics of
Modelling Denitrification
 Modelling Denitrification Tom Anderson, Mike Fasham National Oceanography Centre, Southampton, UK Vladimir Ryabchenko, Viktor Gorchakov P.P. Shirshov Institute of Oceanology, St Petersburg, Russia Questions:
SEAWIFS VALIDATION AT THE CARIBBEAN TIME SERIES STATION (CATS)
") SEAWIFS VALIDATION AT THE CARIBBEAN TIME SERIES STATION (CATS) Jesús Lee-Borges* and Roy Armstrong Department of Marine Science, University of Puerto Rico at Mayagüez, Mayagüez, Puerto Rico 00708 Fernando
SEAWIFS VALIDATION AT THE CARIBBEAN TIME SERIES STATION (CATS) Jesús Lee-Borges* and Roy Armstrong Department of Marine Science, University of Puerto Rico at Mayagüez, Mayagüez, Puerto Rico 00708 Fernando
ENGINE SERIAL NUMBERS
 ENGINE SERIAL NUMBERS The engine number was also the serial number of the car. Engines were numbered when they were completed, and for the most part went into a chassis within a day or so. However, some
Midwest and Great Plains Climate and Drought Update
 Midwest and Great Plains Climate and Drought Update June 20,2013 Laura Edwards Climate Field Specialist Laura.edwards@sdstate.edu 605-626-2870 2012 Board of Regents, South Dakota State University General
Variability and trends in daily minimum and maximum temperatures and in diurnal temperature range in Lithuania, Latvia and Estonia
 Variability and trends in daily minimum and maximum temperatures and in diurnal temperature range in Lithuania, Latvia and Estonia Jaak Jaagus Dept. of Geography, University of Tartu Agrita Briede Dept.
Persistence of prey hot spots in southeast Alaska
 Persistence of prey hot spots in southeast Alaska Scott M. Gende National Park Service, Glacier Bay Field Station, 3100 National Park, Juneau, Alaska, USA; Scott_Gende Gende@nps.gov Michael Sigler National
The Blob, El Niño, and the Drought in Puget Sound
 The Blob, El Niño, and the Drought in Puget Sound Christopher Krembs, Marine Monitoring Unit, EAP, Ecology The Drought The Blob El Niño Warmest first four months since 1981, (Source: NASA's Goddard Institute
Local Ctimatotogical Data Summary White Hall, Illinois
 SWS Miscellaneous Publication 98-5 STATE OF ILLINOIS DEPARTMENT OF ENERGY AND NATURAL RESOURCES Local Ctimatotogical Data Summary White Hall, Illinois 1901-1990 by Audrey A. Bryan and Wayne Armstrong Illinois
UWM Field Station meteorological data
 University of Wisconsin Milwaukee UWM Digital Commons Field Station Bulletins UWM Field Station Spring 992 UWM Field Station meteorological data James W. Popp University of Wisconsin - Milwaukee Follow
ZUMWALT WEATHER AND CLIMATE ANNUAL REPORT ( )
") ZUMWALT WEATHER AND CLIMATE ANNUAL REPORT (26-29) FINAL DRAFT (9 AUGUST 21) J.D. HANSEN 1, R.V. TAYLOR 2, AND V.S. JANSEN 3 INTRODUCTION The Zumwalt Prairie in northeastern Oregon is a unique grassland
ZUMWALT WEATHER AND CLIMATE ANNUAL REPORT (26-29) FINAL DRAFT (9 AUGUST 21) J.D. HANSEN 1, R.V. TAYLOR 2, AND V.S. JANSEN 3 INTRODUCTION The Zumwalt Prairie in northeastern Oregon is a unique grassland
PROGRESS ACCOMPLISHED THIS PERIOD
 Semi-Annual Report Period Covered: September 1, 21 through February 28, 217 Prepared By: Richard Radigan Title: Monitoring of a Constructed Oyster Reef in the St. Lucie Estuary Agency: Florida Fish & Wildlife
Arctic climate change and effects on the ecosystems
 Arctic climate change and effects on the ecosystems NalânKoç Centre for Ice, Climate and Ecosystems (ICE) Norwegian Polar Institute Nalan.koc@npolar.no The Arctic Pacific Ocean Main inflow Main outflow
Turmoil in the Global Biosphere A View from Space
 BIOTECHNO 2011 - Keynote Venice/Mestre, Italy, May 2011 Turmoil in the Global Biosphere A View from Space S. V. Nghiem 1, P. Clemente-Colón 2, I. G. Rigor 3, D. K. Perovich 4, and G. Neumann 1 1 NASA Jet
Oceanography II Notes
 Oceanography II Notes Tides The rise and fall in sea level is called a tide. Caused by a giant wave and the gravitational pull of the moon and sun on the ocean One low-tide/high-tide cycle takes about
WIND EFFECTS ON CHEMICAL SPILL IN ST ANDREW BAY SYSTEM
 WIND EFFECTS ON CHEMICAL SPILL IN ST ANDREW BAY SYSTEM PETER C. CHU, PATRICE PAULY Naval Postgraduate School, Monterey, CA93943 STEVEN D. HAEGER Naval Oceanographic Office, Stennis Space Center MATHEW
Overview of Chapter 6
 Overview of Chapter 6 Earth s Major Biomes Aquatic Ecosystems Freshwater ecosystems Estuaries Marine Ecosystems Wildfires and Ecosystems Wildfire unexpected fire in grass, shrub, or forests (a significant
Reproductive and growth variation of the gorgonian Junceella fragilis in southern Taiwan
 Reproductive and growth variation of the gorgonian Junceella fragilis in southern Taiwan Tung-Yung Fan 1, 2, I-Chu Huang 1, 3 and Shinn-Pyng Yeh 3 1 National Museum of Marine Biology and Aquarium, Pingtung,
Unconventional Wisdom and the Effects of Dams on Downstream Coarse Sediment Supply. Byron Amerson, Jay Stallman, John Wooster, and Derek Booth
 Unconventional Wisdom and the Effects of Dams on Downstream Coarse Sediment Supply 3 February 2009 Byron Amerson, Jay Stallman, John Wooster, and Derek Booth Sultan River, WA OBJECTIVE Consider the landscape
Atmospheric circulation analysis for seasonal forecasting
 Training Seminar on Application of Seasonal Forecast GPV Data to Seasonal Forecast Products 18 21 January 2011 Tokyo, Japan Atmospheric circulation analysis for seasonal forecasting Shotaro Tanaka Climate
Outline. Ecology. Introduction. Ecology and Human. Ecology and Evolution. Ecology and Environment 5/6/2009. Ecology
 Outline Ecology SCBI 113 Essential Biology Nuttaphon Onparn, PhD. 7 May 2009 Ecology Introduction Ecology and ecosystem Ecosystem Structure Function Interactions Biomes 1 2 Ecology Introduction Greek oikos+
Jeffrey Polovina 1, John Dunne 2, Phoebe Woodworth 1, and Evan Howell 1
 Projected expansion of the subtropical biome and contraction of the temperate and equatorial upwelling biomes in the North Pacific under global warming Jeffrey Polovina 1, John Dunne 2, Phoebe Woodworth
Workshop and Conference on Biogeochemical Impacts of Climate and Land-Use Changes on Marine Ecosystems November 2009
 2066-12 Workshop and Conference on Biogeochemical Impacts of Climate and Land-Use Changes on Marine Ecosystems 2-10 November 2009 Nutrient cycling in the Mekong River plume M. Voss IOW Germany Nutrient
Folsom Dam Water Control Manual Update Joint Federal Project, Folsom Dam
 Folsom Dam Water Control Manual Update Joint Federal Project, Folsom Dam Public Workshop May 25, 2016 Sacramento Library Galleria 828 I Street, Sacramento, CA US Army Corps of Engineers BUILDING STRONG
Name ECOLOGY TEST #1 Fall, 2014
 Name ECOLOGY TEST #1 Fall, 2014 Answer the following questions in the spaces provided. The value of each question is given in parentheses. Devote more explanation to questions of higher point value. 1.
Significant Rainfall and Peak Sustained Wind Estimates For Downtown San Francisco
 Significant Rainfall and Peak Sustained Wind Estimates For Downtown San Francisco Report Prepared by John P. Monteverdi, PhD, CCM July 30, 1998 Mayacamas Weather Consultants 1. Impact of Location The location
Seasonal forecasting as a stepping stone to climate adaptation in marine fisheries and aquaculture
 Seasonal forecasting as a stepping stone to climate adaptation in marine fisheries and aquaculture Alistair Hobday Paige Eveson Jason Hartog Claire Spillman Projected changes (e.g. distribution) 11 species
Climate Change Impact Assessment on Long Term Water Budget for Maitland Catchment in Southern Ontario
 215 SWAT CONFERENCE, PURDUE Climate Change Impact Assessment on Long Term Water Budget for Maitland Catchment in Southern Ontario By Vinod Chilkoti Aakash Bagchi Tirupati Bolisetti Ram Balachandar Contents
Taxonomy and Systematics: a broader classification system that also shows evolutionary relationships
 Taxonomy: a system for naming living creatures Carrolus Linnaeus (1707-1778) The binomial system: Genus and species e.g., Macrocystis pyrifera (Giant kelp); Medialuna californiensis (halfmoon) Taxonomy
"STUDY ON THE VARIABILITY OF SOUTHWEST MONSOON RAINFALL AND TROPICAL CYCLONES FOR "
 "STUDY ON THE VARIABILITY OF SOUTHWEST MONSOON RAINFALL AND TROPICAL CYCLONES FOR 2001 2010" ESPERANZA O. CAYANAN, Ph.D. Chief, Climatology & Agrometeorology R & D Section Philippine Atmospheric Geophysical
Climate Change and Arizona s Rangelands: Management Challenges and Opportunities
 Climate Change and Arizona s Rangelands: Management Challenges and Opportunities Mike Crimmins Climate Science Extension Specialist Dept. of Soil, Water, & Env. Science & Arizona Cooperative Extension
January 25, Summary
 January 25, 2013 Summary Precipitation since the December 17, 2012, Drought Update has been slightly below average in parts of central and northern Illinois and above average in southern Illinois. Soil
Climatography of the United States No
 Climate Division: AK 5 NWS Call Sign: ANC Month (1) Min (2) Month(1) Extremes Lowest (2) Temperature ( F) Lowest Month(1) Degree s (1) Base Temp 65 Heating Cooling 90 Number of s (3) Jan 22.2 9.3 15.8