Accuracy and Uncertainty
|
|
|
- Jacob Lawson
- 5 years ago
- Views:
Transcription

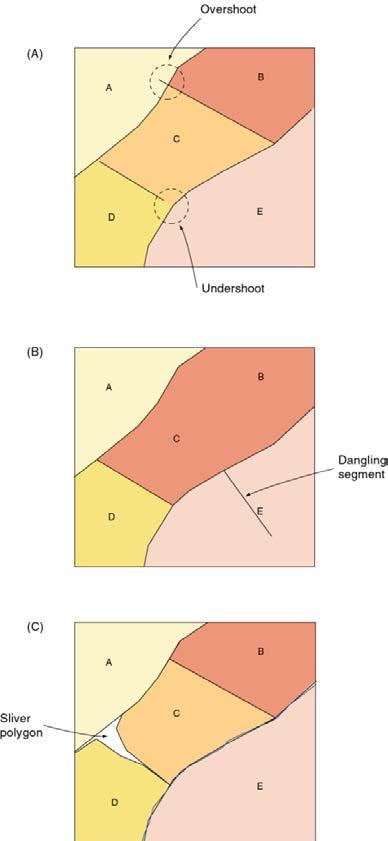
1 Accuracy and Uncertainty
2 Accuracy and Uncertainty Why is this an issue? What is meant by accuracy and uncertainty (data vs rule)? How things have changed in a digital world. Spatial data quality issues (Metadata).


![application] [analytical](/docs-images/95/123615967/images/3-5.jpg "capability >< social context]")


3 Why an Issue? Imperfect or uncertain reconciliation [science >< practice] [concepts >< application] [analytical capability >< social context] It is impossible to make a perfect representation of the world, so uncertainty about it is inevitable Changing (temporal) patterns (e.g., census) Fractals (e.g., coastlines)
 Often little is known of the input data quality,")

4 Why an Issue? GIGO (?) Often little is known of the input data quality, and far too much is assumed about the output quality GIS fosters data merging Engineering Planning Taxation Single municipal database

?")

5 Accuracy and Uncertainty Why is this an issue? What is meant by accuracy and uncertainty (data vs rule)? How things have changed in a digital world. Spatial data quality issues (Metadata). Accounting for uncertainty.
6 Sources of Error Measurement error: different observers, measuring instruments, etc. Setup Observer Procedure Software Environment Error Equipment

7 Sources of Error Specification error: omitted variables (regression discussion) Ambiguity, vagueness and the quality of a GIS representation Blunders or spurious errors Uncertainty has become a catch-all for incomplete representations or a quality measure. It can be characterized and managed but not eliminated.
 Rule uncertainty: how we reason with observations we are unsure of the conclusions we can draw from even perfect data. (e.g., linear versus non-linear models)")
8 Uncertainty Uncertainty: a reflection of our imperfect and inexact knowledge of the world. Data uncertainty: our observations or measurements encompass ambiguity / inherent variability. (e.g., standard deviation) Rule uncertainty: how we reason with observations we are unsure of the conclusions we can draw from even perfect data. (e.g., linear versus non-linear models)

9 Uncertainty: Data to Rule Conception Measurement & Representation Analysis Real World


, cognitive Ambiguity")
10 Data Uncertainty Spatial uncertainty Natural geographic units? Multivariate extensions? Census vs samples Vagueness Statistical, cartographic (i.e., generalization), cognitive Ambiguity Values, language (semantics, ontologies)
 Relations typically grow stronger when based on larger geographic units")
 # of regions r 48.2189 24.2963 12.")
11 Data Uncertainty (& MAUP) Regions Uniformity (one or all aspects?) Relations typically grow stronger when based on larger geographic units (statistical uncertainty appears to decrease while our ability to assign characteristics to individuals decreases) # of regions r


12 Dealing with Data Uncertainty In fuzzy set theory, it is possible to have partial membership in a set membership can vary, e.g., from 0 to 1 this adds a third option to classification: yes, no, and possibly Fuzzy approaches have been applied to the mapping of soils, vegetation cover, and land use
13 Fuzzy Membership Functions 1 Short Medium Tall Membership 0 5 Height 6

14 Measurement/Representation Representational models filter reality differently Vector crisp Raster can be fuzzy Savannah Forest Forest membership
.")
15 Measures of Uncertainty Given that uncertainty exists in every layer in a GIS, and that decisions are made based on analyses of that data, how can we quantify the certainty we have in our data? The measures of uncertainty we can use are dependent on the type of data we are working with (NOIR). Measures of central tendency Measures of dispersion

")
16 How to measure the accuracy of nominal attributes? e.g., a vegetation cover map The confusion or misclassification matrix compares recorded classes (the observations) with classes obtained by a more accurate process, or from a more accurate source (the reference) Measures of Uncertainty


 Collecting the")
17 Examining every parcel (or pixel) may not be practical Rarer classes should be sampled more often in order to reliably assess accuracy sampling is often stratified by class (recall notes on spatial sampling) Collecting the Reference Data
18 The bolded numbers reflect correct classification (i.e., where the land use in the database equaled the land use observed in the field). The off-diagonal numbers reflect incorrect land use records in the database. Land use: in the field A B C D E Total Land use: in the database A B C D E Total Misclassification Matrix
19 The bolded numbers reflect areas where the land use has not changed. The offdiagonal numbers reflect areas where the land use has changed over time. Land use: at time B A B C D E Total A B Land use: at time A C D E Total Transition Matrix Markov models
20 Misclassification Statistics Percent correctly classified total of diagonal entries divided by the grand total, times /304*100 = 68.8% but chance would give a score of better than 0 Kappa statistic (more) normalized to range from 0 (chance) to 100 evaluates to 58.3%
21 Per-Polygon and Per-Pixel Assessment Error can occur in the attributes of polygons, but it can also occur in the positions of the boundaries better to conceive of the map as a field, and to sample points this also reflects how the data are likely to be used (to query the class at a point)

22 Assessment An example of a vegetation cover map. Two strategies for accuracy assessment are available: to check by area (polygon), or to check by point. In the former case a strategy would be devised for field checking each area, to determine the area's correct class. In the latter, points would be sampled across the state and the correct class determined at each point. It will be much easier to sample using points.
23 Errors typically distort interval / ratio measurements by small amounts (unless a blunder or outlier) Accuracy refers to the amount of deviation from the true value Precision the variation among repeated measurements, and also the amount of detail in the reporting of a measurement Measures of Uncertainty
, but show a bias away from the correct value (they are inaccurate).")
24 The term precision is often used to refer to the repeatability of measurements. On the left, successive measurements have similar values (they are precise), but show a bias away from the correct value (they are inaccurate). On the right, precision is lower but accuracy is higher (no apparent bias). Precision
![The amount of detail in a reported measurement [precision] (e.g., output from a GIS) should reflect its accuracy 14.](/docs-images/95/123615967/images/25-1.jpg "4 m implies an accuracy of ±0.05 m 14 m implies an accuracy of ±0.")
25 The amount of detail in a reported measurement [precision] (e.g., output from a GIS) should reflect its accuracy 14.4 m implies an accuracy of ±0.05 m 14 m implies an accuracy of ±0.5 m Excess precision should be removed by rounding Reporting Measurements


26 Measuring Accuracy Root Mean Square Error is the square root of the average squared error or deviation the primary measure of accuracy in map accuracy standards and GIS databases e.g., elevations in a digital elevation model might have an RMSE of 6.1m (TRIM Specs) the abundances of errors of different magnitudes often closely follow a Gaussian or normal distribution where y i is an elevation from the DEM, y j is the "true" known or measured elevation of a test point and N is the number of sample points. Standard deviations


27 Uncertainty based on an assumed RMSE of 7 m. The Gaussian distribution with a mean of 350 m and a standard deviation of 7 m gives a 95% probability that the true location of the 350 m contour lies in the colored area, and a 5% probability that it lies outside. Visualizing Uncertainty
28 Positional accuracy of features on a paper map is roughly 0.5mm on the map e.g., 0.5mm on a map at scale 1:20,000 gives a positional accuracy of 10m this is approximately the U.S. National Map Accuracy Standard, used by BC TRIM and also allows for digitizing error, stretching of the paper, and other common sources of positional error A Useful Rule of Thumb


29 Correlation of Errors Absolute positional errors may be high reflecting the technical difficulty of measuring distances from the Equator and the Greenwich Meridian, or elevations from mean sea level or the geoide Relative positional errors over short distances may be much lower positional errors tend to be strongly correlated over short distances As a result, positional errors can largely cancel out in the calculation of properties such as distance or area
30 Measures of central tendency: Mean (Arithmetic, geometric, harmonic), median or mode? The form of the relation? (linear, nonlinear, multiple regression models) Alternative approaches to many operations such as slope, spatial interpolation. More than just incomplete knowledge. Rule Uncertainty Interpolation methods
 Best fitting surface Several other")
31 What is the slope? Use a 2x2 window or a 3x3 window? Maximum difference ( ) Best fitting surface Several other options Slope Uncertainty


32 Slope Uncertainty SAGA GIS has nine different slope derivation methods

 Accounting for")
33 Accuracy and Uncertainty Why is this an issue? What is meant by accuracy and uncertainty (data vs rule) How things have changed in a digital world. Spatial data quality issues (Metadata) Accounting for uncertainty

34 Standards, such as the National Map Accuracy Standard (NMAS), defined positional accuracy but little else. Most maps were made by governmental mapping agencies with typically high standards. Scale, accuracy and resolution are linked on paper maps. The Digital Divide: Paper Maps


35 Digital data can come from anyone (unknown standards) Data entry can create problems Digitizing errors Conflation of data layers Datum differences, scale differences Georegistration (rubber sheeting) Mixed pixels An OpenStreetMap.org trace Mandates Software GIS Data Filter Filter Mandates The Digital Divide: Digital Data

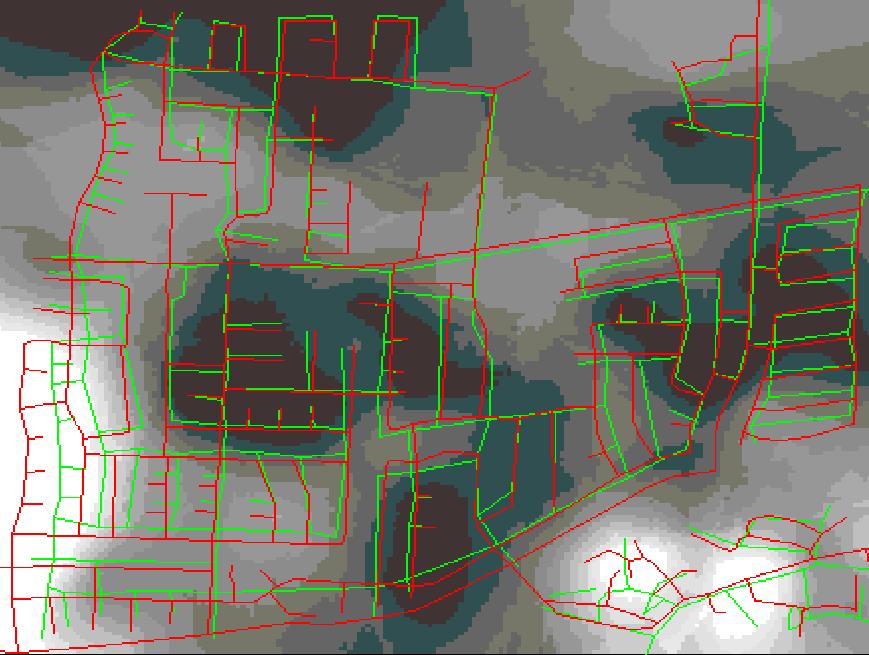
36 Trust in the data provider? How the big three of online maps compare to a more precise source.

37 Geocoding results Bing Maps Google Maps Yahoo! Maps Threshold Quantile 95% Threshold Outlier

38 Map conflation problems Digitizing errors Data Entry

 But even orthophotos")
39 Data entry A common source of error working directly off-of an aerial photograph (ignoring relief displacement) But even orthophotos aren t perfect.
40 Georegistration error? Rubber sheet transformation
41 Analysis: Error Propagation Addresses the effects of errors and uncertainty on the results of GIS analysis Typical mathematical or statistical approaches are not appropriate. Almost every input to a GIS is subject to error and uncertainty In principle, every output should have confidence limits or some other expression of uncertainty
 Zinc data: Predicted")

42 Geostatistical interpolation (kriging) Zinc data: Predicted values Zinc data: Estimated standard deviation Showing your [uncertainty] colours

43 Accounting for Uncertainty Traditional statistics vs spatial statistics spatial autocorrelation is assumed when using spatial data, but it is the antithesis to aspatial statistics [IID] Analytical error propagation is not possible in such cases.

44 Accounting for Uncertainty Monte Carlo Simulation (MCS) or sensitivity analysis Elevation Repeat 100 times Determine slope Add random value How likely is the slope we determine the actual slope value, given that we know the elevation values have an underlying uncertainty? Generate a random raster Iterators in ArcMap Toolbox Examples of Iterators


45 Three realizations of a model simulating the effects of error on a digital elevation model. The three data sets differ only to a degree consistent with known error. Error has been simulated using a model designed to replicate the known error properties of this data set the distribution of error magnitude, and the spatial autocorrelation between errors. Error Modelling: M C Simulation
46 Error Modelling Error in the measurement of the area of a square 100 m on a side. Each of the four corner points has been surveyed; the errors are subject to bivariate Gaussian distributions with standard deviations in x and y of 1 m (dashed circles). The red polygon shows one possible surveyed square (one realization of the error model). In this case the measurement of area is subject to a standard deviation of 200 sq m; a result such as 10, is quite likely, though the true area is 10,000 sq m. In principle, the result of 10, should be rounded to the known accuracy and reported as 10,000 sq m.
47 Living with Uncertainty It is easy to see the importance of uncertainty in GIS but much more difficult to deal with it effectively but we may have no option, especially in disputes that are likely to involve litigation
48 Some Basic Principles Uncertainty is inevitable in GIS Data obtained from others should never be taken as truth efforts should be made to determine quality Effects on GIS outputs are often much greater than expected there is an automatic tendency to regard outputs from a computer as the truth
49 Some Basic Principles Use as many sources of data as possible and cross-check them for accuracy Be honest and informative in reporting results add relevant caveats and cautions Interactive Map Disclaimer Data presented should be considered in conjunction with the report. Product demand projections detailed in the report will vary depending on the amount of retrofit activity the 1200 Buildings program stimulates and the extent of retrofit that is implemented in buildings. As there are inherent uncertainties in predicting demand from future activity the product demand projections and findings may not be accurate. Specific advice should be sought and further detailed analysis undertaken before acting or relying on the product demand projections
 How things have changed in a")
50 Accuracy and Uncertainty Why is this an issue? What is meant by accuracy and uncertainty (data vs rule) How things have changed in a digital world. Spatial data quality issues (Metadata)


.")
51 Metadata Definition: Metadata are "data about data They describe the content, quality, condition, and other characteristics of data. Metadata help a person to locate and understand data. In epistemology the word meta means "about (its own category). Thus metadata is "data about the data".
52 Metadata Lineage (author, manipulations) Positional accuracy ( x, y, z) Attribute accuracy (misclassification) Completeness (how thorough?) Logical consistency (turn tables) Semantic accuracy (one-to-many) Temporal information (date obtained, entered into system) Air photo taken Event happens Air photo entered into GIS Why event not acted upon?
53 Examples of Metadata Identification Title? Area covered? Themes? Currentness? Restrictions? Data Quality Accuracy? Completeness? Logical Consistency? Lineage? Spatial Data Organization Vector? Raster? Type of elements? Number? Spatial Reference Projection? Grid system? Datum? Coordinate system?

54 Examples of Metadata Entity and Attribute Information Features? Attributes? Attribute values? Distribution Distributor? Formats? Media? Online? Price? Metadata Reference Metadata currentness? Responsible party?

55 A classification of uncertainty
56 Conclusion Uncertainty is ever-present in GIS analyses from the source data through to the analyses and to the final output. It is important to be conscious of uncertainty in your data / analyses / presentation and, if necessary, determine the impact of it on your results. (MCS) Knowledge of uncertainty allows us to make estimates of the confidence limits of the results. Metadata!
57
Types of spatial data. The Nature of Geographic Data. Types of spatial data. Spatial Autocorrelation. Continuous spatial data: geostatistics
 The Nature of Geographic Data Types of spatial data Continuous spatial data: geostatistics Samples may be taken at intervals, but the spatial process is continuous e.g. soil quality Discrete data Irregular:
Geog183: Cartographic Design and Geovisualization Spring Quarter 2016 Lecture 15: Dealing with Uncertainty
 Geog183: Cartographic Design and Geovisualization Spring Quarter 2016 Lecture 15: Dealing with Uncertainty All maps are distortions It s not easy to lie with maps, it s essential...to present a useful
Uncertainty in Geographic Information: House of Cards? Michael F. Goodchild University of California Santa Barbara
 Uncertainty in Geographic Information: House of Cards? Michael F. Goodchild University of California Santa Barbara Starting points All geospatial data leave the user to some extent uncertain about the
Watershed Sciences 4930 & 6920 GEOGRAPHIC INFORMATION SYSTEMS
 Watershed Sciences 4930 & 6920 GEOGRAPHIC INFORMATION SYSTEMS WEEK TWELVE UNCERTAINTY IN GIS Joe Wheaton HOUSEKEEPING Labs Do you need extended Quinney Lab hours? Okay with Lab 9? Geoprocessing worked?
Statistical Perspectives on Geographic Information Science. Michael F. Goodchild University of California Santa Barbara
 Statistical Perspectives on Geographic Information Science Michael F. Goodchild University of California Santa Barbara Statistical geometry Geometric phenomena subject to chance spatial phenomena emphasis
Basics of GIS. by Basudeb Bhatta. Computer Aided Design Centre Department of Computer Science and Engineering Jadavpur University
 Basics of GIS by Basudeb Bhatta Computer Aided Design Centre Department of Computer Science and Engineering Jadavpur University e-governance Training Programme Conducted by National Institute of Electronics
Software. People. Data. Network. What is GIS? Procedures. Hardware. Chapter 1
 People Software Data Network Procedures Hardware What is GIS? Chapter 1 Why use GIS? Mapping Measuring Monitoring Modeling Managing Five Ms of Applied GIS Chapter 2 Geography matters Quantitative analyses
Quality and Coverage of Data Sources
 Quality and Coverage of Data Sources Objectives Selecting an appropriate source for each item of information to be stored in the GIS database is very important for GIS Data Capture. Selection of quality
Introduction to GIS. Phil Guertin School of Natural Resources and the Environment GeoSpatial Technologies
 Introduction to GIS Phil Guertin School of Natural Resources and the Environment dguertin@cals.arizona.edu Mapping GeoSpatial Technologies Traditional Survey Global Positioning Systems (GPS) Remote Sensing
Representation of Geographic Data
 GIS 5210 Week 2 The Nature of Spatial Variation Three principles of the nature of spatial variation: proximity effects are key to understanding spatial variation issues of geographic scale and level of
Introduction to GIS I
 Introduction to GIS Introduction How to answer geographical questions such as follows: What is the population of a particular city? What are the characteristics of the soils in a particular land parcel?
NR402 GIS Applications in Natural Resources. Lesson 9: Scale and Accuracy
 NR402 GIS Applications in Natural Resources Lesson 9: Scale and Accuracy 1 Map scale Map scale specifies the amount of reduction between the real world and the map The map scale specifies how much the
Least-Cost Transportation Corridor Analysis Using Raster Data.
 Least-Cost Transportation Corridor Analysis Using Raster Data What is GeoMedia Grid: Key Grid Concepts Vector Model Vector based systems show data by means of a series of points, lines, and polygons. Each
Why Is It There? Attribute Data Describe with statistics Analyze with hypothesis testing Spatial Data Describe with maps Analyze with spatial analysis
 6 Why Is It There? Why Is It There? Getting Started with Geographic Information Systems Chapter 6 6.1 Describing Attributes 6.2 Statistical Analysis 6.3 Spatial Description 6.4 Spatial Analysis 6.5 Searching
Cell-based Model For GIS Generalization
 Cell-based Model For GIS Generalization Bo Li, Graeme G. Wilkinson & Souheil Khaddaj School of Computing & Information Systems Kingston University Penrhyn Road, Kingston upon Thames Surrey, KT1 2EE UK
UNCERTAINTY AND ERRORS IN GIS
 Christos G. Karydas,, Dr. xkarydas@agro.auth.gr http://users.auth.gr/xkarydas Lab of Remote Sensing and GIS Director: Prof. N. Silleos School of Agriculture Aristotle University of Thessaloniki, GR 1 UNCERTAINTY
A General Framework for Conflation
 A General Framework for Conflation Benjamin Adams, Linna Li, Martin Raubal, Michael F. Goodchild University of California, Santa Barbara, CA, USA Email: badams@cs.ucsb.edu, linna@geog.ucsb.edu, raubal@geog.ucsb.edu,
GIS for ChEs Introduction to Geographic Information Systems
 GIS for ChEs Introduction to Geographic Information Systems AIChE Webinar John Cirucci 1 GIS for ChEs Introduction to Geographic Information Systems What is GIS? Tools and Methods Applications Examples
USE OF RADIOMETRICS IN SOIL SURVEY
 USE OF RADIOMETRICS IN SOIL SURVEY Brian Tunstall 2003 Abstract The objectives and requirements with soil mapping are summarised. The capacities for different methods to address these objectives and requirements
Geog 469 GIS Workshop. Data Analysis
 Geog 469 GIS Workshop Data Analysis Outline 1. What kinds of need-to-know questions can be addressed using GIS data analysis? 2. What is a typology of GIS operations? 3. What kinds of operations are useful
Version 1.1 GIS Syllabus
 GEOGRAPHIC INFORMATION SYSTEMS CERTIFICATION Version 1.1 GIS Syllabus Endorsed 1 Version 1 January 2007 GIS Certification Programme 1. Target The GIS certification is aimed at: Those who wish to demonstrate
Errors in GIS. Errors in GIS. False: If its digital, it must be correct, or at least more correct than a manual product
 Errors in GIS GIS is like children s art..? Errors in GIS False: If its digital, it must be correct, or at least more correct than a manual product Data errors are common in GIS: Errors from (pre-digital)
DATA SOURCES AND INPUT IN GIS. By Prof. A. Balasubramanian Centre for Advanced Studies in Earth Science, University of Mysore, Mysore
 DATA SOURCES AND INPUT IN GIS By Prof. A. Balasubramanian Centre for Advanced Studies in Earth Science, University of Mysore, Mysore 1 1. GIS stands for 'Geographic Information System'. It is a computer-based
Data Quality and Uncertainty
 Data Quality and Uncertainty The power of GIS analysis is based on the assembly of layers of data, but as data layers increase, errors multiply - quality decreases. Garbage in, garbage out. High quality
GEOGRAPHY 350/550 Final Exam Fall 2005 NAME:
 1) A GIS data model using an array of cells to store spatial data is termed: a) Topology b) Vector c) Object d) Raster 2) Metadata a) Usually includes map projection, scale, data types and origin, resolution
Projections & GIS Data Collection: An Overview
 Projections & GIS Data Collection: An Overview Projections Primary data capture Secondary data capture Data transfer Capturing attribute data Managing a data capture project Geodesy Basics for Geospatial
Outline. Geographic Information Analysis & Spatial Data. Spatial Analysis is a Key Term. Lecture #1
 Geographic Information Analysis & Spatial Data Lecture #1 Outline Introduction Spatial Data Types: Objects vs. Fields Scale of Attribute Measures GIS and Spatial Analysis Spatial Analysis is a Key Term
UNIVERSITY OF TECHNOLOGY, SYDNEY
 THllS PAPER MUST NOT BE REMOVED TO BE RETURNED AT THE END OF THE EXAMINA'TION UNIVERSITY OF TECHNOLOGY, SYDNEY NAME: STUDENT NUMBER: COURSE: AUTUMN SEMESTER EXAMINATION 2007 Subject Number: 91 120 GIs
Michael Harrigan Office hours: Fridays 2:00-4:00pm Holden Hall
 Announcement New Teaching Assistant Michael Harrigan Office hours: Fridays 2:00-4:00pm Holden Hall 209 Email: michael.harrigan@ttu.edu Guofeng Cao, Texas Tech GIST4302/5302, Lecture 2: Review of Map Projection
Overview key concepts and terms (based on the textbook Chang 2006 and the practical manual)
") Introduction Geo-information Science (GRS-10306) Overview key concepts and terms (based on the textbook 2006 and the practical manual) Introduction Chapter 1 Geographic information system (GIS) Geographically
Introduction Geo-information Science (GRS-10306) Overview key concepts and terms (based on the textbook 2006 and the practical manual) Introduction Chapter 1 Geographic information system (GIS) Geographically
Lecture 1: Geospatial Data Models
 Lecture 1: GEOG413/613 Dr. Anthony Jjumba Introduction Course Outline Journal Article Review Projects (and short presentations) Final Exam (April 3) Participation in class discussions Geog413/Geog613 A
METADATA. Publication Date: Fiscal Year Cooperative Purchase Program Geospatial Data Presentation Form: Map Publication Information:
 METADATA CONTOURS Digital Geospatial Metadata: North Central Texas Orthophotography Identification Information Citation Originator: Publication Date: Fiscal Year 2001-2002 Title: Cooperative Purchase Program
Supplementary material: Methodological annex
 1 Supplementary material: Methodological annex Correcting the spatial representation bias: the grid sample approach Our land-use time series used non-ideal data sources, which differed in spatial and thematic
Data Quality and Uncertainty. Accuracy, Precision, Data quality and Errors
 Data Quality and Uncertainty The power of GIS analysis is based on the assembly of layers of data, but as data layers increase, errors multiply (and quality decreases). Garbage in, garbage out. High quality
Spatial Process VS. Non-spatial Process. Landscape Process
 Spatial Process VS. Non-spatial Process A process is non-spatial if it is NOT a function of spatial pattern = A process is spatial if it is a function of spatial pattern Landscape Process If there is no
Geostatistics and Spatial Scales
 Geostatistics and Spatial Scales Semivariance & semi-variograms Scale dependence & independence Ranges of spatial scales Variable dependent Fractal dimension GIS implications Spatial Modeling Spatial Analysis
GIST 4302/5302: Spatial Analysis and Modeling Lecture 2: Review of Map Projections and Intro to Spatial Analysis
 GIST 4302/5302: Spatial Analysis and Modeling Lecture 2: Review of Map Projections and Intro to Spatial Analysis Guofeng Cao http://www.spatial.ttu.edu Department of Geosciences Texas Tech University guofeng.cao@ttu.edu
Introduction-Overview. Why use a GIS? What can a GIS do? Spatial (coordinate) data model Relational (tabular) data model
 data model Relational (tabular) data model") Introduction-Overview Why use a GIS? What can a GIS do? How does a GIS work? GIS definitions Spatial (coordinate) data model Relational (tabular) data model intro_gis.ppt 1 Why use a GIS? An extension
Introduction-Overview Why use a GIS? What can a GIS do? How does a GIS work? GIS definitions Spatial (coordinate) data model Relational (tabular) data model intro_gis.ppt 1 Why use a GIS? An extension
Lecture 9: Reference Maps & Aerial Photography
 Lecture 9: Reference Maps & Aerial Photography I. Overview of Reference and Topographic Maps There are two basic types of maps? Reference Maps - General purpose maps & Thematic Maps - maps made for a specific
Geographically weighted methods for examining the spatial variation in land cover accuracy
 Geographically weighted methods for examining the spatial variation in land cover accuracy Alexis Comber 1, Peter Fisher 1, Chris Brunsdon 2, Abdulhakim Khmag 1 1 Department of Geography, University of
SPOT DEM Product Description
 SPOT DEM Product Description Version 1.1 - May 1 st, 2004 This edition supersedes previous versions Acronyms DIMAP DTED DXF HRS JPEG, JPG DEM SRTM SVG Tiff - GeoTiff XML Digital Image MAP encapsulation
Geographic Information Systems. Introduction to Data and Data Sources
 Geographic Information Systems Introduction to Data and Data Sources Presented by John Showler, NJDA-SSCC NJ SCD GIS Training Session December 10, 209 The Objectives of this session are 3-fold: 1. Introduce
GIST 4302/5302: Spatial Analysis and Modeling
 GIST 4302/5302: Spatial Analysis and Modeling Review Guofeng Cao www.gis.ttu.edu/starlab Department of Geosciences Texas Tech University guofeng.cao@ttu.edu Spring 2016 Course Outlines Spatial Point Pattern
The Geodatabase Working with Spatial Analyst. Calculating Elevation and Slope Values for Forested Roads, Streams, and Stands.
 GIS LAB 7 The Geodatabase Working with Spatial Analyst. Calculating Elevation and Slope Values for Forested Roads, Streams, and Stands. This lab will ask you to work with the Spatial Analyst extension.
Spatial Analysis and Modeling (GIST 4302/5302) Guofeng Cao Department of Geosciences Texas Tech University
 Guofeng Cao Department of Geosciences Texas Tech University") Spatial Analysis and Modeling (GIST 4302/5302) Guofeng Cao Department of Geosciences Texas Tech University TTU Graduate Certificate Geographic Information Science and Technology (GIST) 3 Core Courses and
Spatial Analysis and Modeling (GIST 4302/5302) Guofeng Cao Department of Geosciences Texas Tech University TTU Graduate Certificate Geographic Information Science and Technology (GIST) 3 Core Courses and
Popular Mechanics, 1954
 Introduction to GIS Popular Mechanics, 1954 1986 $2,599 1 MB of RAM 2017, $750, 128 GB memory, 2 GB of RAM Computing power has increased exponentially over the past 30 years, Allowing the existence of
It s a Model. Quantifying uncertainty in elevation models using kriging
 It s a Model Quantifying uncertainty in elevation models using kriging By Konstantin Krivoruchko and Kevin Butler, Esri Raster based digital elevation models (DEM) are the basis of some of the most important
RESEARCH ON SPATIAL DATA MINING BASED ON UNCERTAINTY IN GOVERNMENT GIS
 Abstract RESEARCH ON SPATIAL DATA MINING BASED ON UNCERTAINTY IN GOVERNMENT GIS Bin Li 1,2, Jiping Liu 1, Lihong Shi 1 1 Chinese Academy of Surveying and Mapping 16 beitaiping Road, Beijing 10039, China
Outline. Introduction to SpaceStat and ESTDA. ESTDA & SpaceStat. Learning Objectives. Space-Time Intelligence System. Space-Time Intelligence System
 Outline I Data Preparation Introduction to SpaceStat and ESTDA II Introduction to ESTDA and SpaceStat III Introduction to time-dynamic regression ESTDA ESTDA & SpaceStat Learning Objectives Activities
In this exercise we will learn how to use the analysis tools in ArcGIS with vector and raster data to further examine potential building sites.
 GIS Level 2 In the Introduction to GIS workshop we filtered data and visually examined it to determine where to potentially build a new mixed use facility. In order to get a low interest loan, the building
GIST 4302/5302: Spatial Analysis and Modeling
 GIST 4302/5302: Spatial Analysis and Modeling Lecture 2: Review of Map Projections and Intro to Spatial Analysis Guofeng Cao http://thestarlab.github.io Department of Geosciences Texas Tech University
USING GIS IN WATER SUPPLY AND SEWER MODELLING AND MANAGEMENT
 USING GIS IN WATER SUPPLY AND SEWER MODELLING AND MANAGEMENT HENRIETTE TAMAŠAUSKAS*, L.C. LARSEN, O. MARK DHI Water and Environment, Agern Allé 5 2970 Hørsholm, Denmark *Corresponding author, e-mail: htt@dhigroup.com
NR402 GIS Applications in Natural Resources
 NR402 GIS Applications in Natural Resources Lesson 1 Introduction to GIS Eva Strand, University of Idaho Map of the Pacific Northwest from http://www.or.blm.gov/gis/ Welcome to NR402 GIS Applications in
Using Fuzzy Logic as a Complement to Probabilistic Radioactive Waste Disposal Facilities Safety Assessment -8450
 Using Fuzzy Logic as a Complement to Probabilistic Radioactive Waste Disposal Facilities Safety Assessment -8450 F. L. De Lemos CNEN- National Nuclear Energy Commission; Rua Prof. Mario Werneck, s/n, BH
INSTITUTE OF AERONAUTICAL ENGINEERING (Autonomous) Dundigal, Hyderabad
 Dundigal, Hyderabad") INSTITUTE OF AERONAUTICAL ENGINEERING (Autonomous) Dundigal, Hyderabad -00 0 CIVIL ENGINEERING TUTORIAL QUESTION BANK Course Name : Remote Sensing and GIS Course Code : A00 Class : IV B. Tech I Semester
INSTITUTE OF AERONAUTICAL ENGINEERING (Autonomous) Dundigal, Hyderabad -00 0 CIVIL ENGINEERING TUTORIAL QUESTION BANK Course Name : Remote Sensing and GIS Course Code : A00 Class : IV B. Tech I Semester
USING GIS CARTOGRAPHIC MODELING TO ANALYSIS SPATIAL DISTRIBUTION OF LANDSLIDE SENSITIVE AREAS IN YANGMINGSHAN NATIONAL PARK, TAIWAN
 CO-145 USING GIS CARTOGRAPHIC MODELING TO ANALYSIS SPATIAL DISTRIBUTION OF LANDSLIDE SENSITIVE AREAS IN YANGMINGSHAN NATIONAL PARK, TAIWAN DING Y.C. Chinese Culture University., TAIPEI, TAIWAN, PROVINCE
Illustrator: Vector base Each line/point store some sort of information Mapping Representation of the world
 Illustrator: Vector base Each line/point store some sort of information Mapping Representation of the world Photoshop Raster base Images can be overlaid Pixel vector data model: [data models] A representation
Lesson 6: Accuracy Assessment
 This work by the National Information Security and Geospatial Technologies Consortium (NISGTC), and except where otherwise Development was funded by the Department of Labor (DOL) Trade Adjustment Assistance
UNCERTAINTY EVALUATION OF MILITARY TERRAIN ANALYSIS RESULTS BY SIMULATION AND VISUALIZATION
 Geoinformatics 2004 Proc. 12th Int. Conf. on Geoinformatics Geospatial Information Research: Bridging the Pacific and Atlantic University of Gävle, Sweden, 7-9 June 2004 UNCERTAINTY EVALUATION OF MILITARY
Automatic Determination of Uncertainty versus Data Density
 Automatic Determination of Uncertainty versus Data Density Brandon Wilde and Clayton V. Deutsch It is useful to know how various measures of uncertainty respond to changes in data density. Calculating
Spatial Analysis II. Spatial data analysis Spatial analysis and inference
 Spatial Analysis II Spatial data analysis Spatial analysis and inference Roadmap Spatial Analysis I Outline: What is spatial analysis? Spatial Joins Step 1: Analysis of attributes Step 2: Preparing for
Dr.Weerakaset Suanpaga (D.Eng RS&GIS)
") The Analysis of Discrete Entities i in Space Dr.Weerakaset Suanpaga (D.Eng RS&GIS) Aim of GIS? To create spatial and non-spatial database? Not just this, but also To facilitate query, retrieval and analysis
The Analysis of Discrete Entities i in Space Dr.Weerakaset Suanpaga (D.Eng RS&GIS) Aim of GIS? To create spatial and non-spatial database? Not just this, but also To facilitate query, retrieval and analysis
Evaluating Urban Vegetation Cover Using LiDAR and High Resolution Imagery
 Evaluating Urban Vegetation Cover Using LiDAR and High Resolution Imagery Y.A. Ayad and D. C. Mendez Clarion University of Pennsylvania Abstract One of the key planning factors in urban and built up environments
Geographical Information System GIS
 Geographical Information System GIS LOOM.02.331 anto.aasa@ut.ee Scale GIS and spatial planning National Regional Local Strategic (National Dev. Plan) National Goals and development policy Tactical (Regional
A MultiGaussian Approach to Assess Block Grade Uncertainty
 A MultiGaussian Approach to Assess Block Grade Uncertainty Julián M. Ortiz 1, Oy Leuangthong 2, and Clayton V. Deutsch 2 1 Department of Mining Engineering, University of Chile 2 Department of Civil &
Spatial Analysis I. Spatial data analysis Spatial analysis and inference
 Spatial Analysis I Spatial data analysis Spatial analysis and inference Roadmap Outline: What is spatial analysis? Spatial Joins Step 1: Analysis of attributes Step 2: Preparing for analyses: working with
Name NRS 409 Exam I. 1. (24 Points) Consider the following questions concerning standard data for GIS systems.
 Consider the following questions concerning standard data for GIS systems.") Read every question carefully. You may use a calculator if you wish. Conversion tables are provided at the end of the exam. If you have any questions, raise your hand. Be sure to show your work on computational
Read every question carefully. You may use a calculator if you wish. Conversion tables are provided at the end of the exam. If you have any questions, raise your hand. Be sure to show your work on computational
Chapter 02 Maps. Multiple Choice Questions
 Chapter 02 Maps Multiple Choice Questions 1. Every projection has some degree of distortion because A. a curved surface cannot be represented on a flat surface without distortion. B. parallels and meridians
Give 4 advantages of using ICT in the collection of data. Give. Give 4 disadvantages in the use of ICT in the collection of data
 Give 4 advantages of using ICT in the collection of data can use a handheld GPS to get accurate location information which can be used to show data linked to specific locations within a GIS can collect
GEO-DATA INPUT AND CONVERSION. Christos G. Karydas,, Dr. Lab of Remote Sensing and GIS Director: Prof. N. Silleos
 Christos G. Karydas,, Dr. xkarydas@agro.auth.gr http://users.auth.gr/xkarydas Lab of Remote Sensing and GIS Director: Prof. N. Silleos School of Agriculture Aristotle University of Thessaloniki, GR 1 0.
INTEGRATION OF GIS AND MULTICRITORIAL HIERARCHICAL ANALYSIS FOR AID IN URBAN PLANNING: CASE STUDY OF KHEMISSET PROVINCE, MOROCCO
 Geography Papers 2017, 63 DOI: http://dx.doi.org/10.6018/geografia/2017/280211 ISSN: 1989-4627 INTEGRATION OF GIS AND MULTICRITORIAL HIERARCHICAL ANALYSIS FOR AID IN URBAN PLANNING: CASE STUDY OF KHEMISSET
Formats for Expressing Acceptable Uncertainty
 Formats for Expressing Acceptable Uncertainty Brandon J. Wilde and Clayton V. Deutsch This short note aims to define a number of formats that could be used to express acceptable uncertainty. These formats
Harris: Quantitative Chemical Analysis, Eight Edition CHAPTER 03: EXPERIMENTAL ERROR
 Harris: Quantitative Chemical Analysis, Eight Edition CHAPTER 03: EXPERIMENTAL ERROR Chapter 3. Experimental Error -There is error associated with every measurement. -There is no way to measure the true
Data Aggregation with InfraWorks and ArcGIS for Visualization, Analysis, and Planning
 Data Aggregation with InfraWorks and ArcGIS for Visualization, Analysis, and Planning Stephen Brockwell President, Brockwell IT Consulting, Inc. Join the conversation #AU2017 KEYWORD Class Summary Silos
Lecture 2. A Review: Geographic Information Systems & ArcGIS Basics
 Lecture 2 A Review: Geographic Information Systems & ArcGIS Basics GIS Overview Types of Maps Symbolization & Classification Map Elements GIS Data Models Coordinate Systems and Projections Scale Geodatabases
Experimental Uncertainty (Error) and Data Analysis
 and Data Analysis") Experimental Uncertainty (Error) and Data Analysis Advance Study Assignment Please contact Dr. Reuven at yreuven@mhrd.org if you have any questions Read the Theory part of the experiment (pages 2-14) and
Experimental Uncertainty (Error) and Data Analysis Advance Study Assignment Please contact Dr. Reuven at yreuven@mhrd.org if you have any questions Read the Theory part of the experiment (pages 2-14) and
GIS = Geographic Information Systems;
 What is GIS GIS = Geographic Information Systems; What Information are we talking about? Information about anything that has a place (e.g. locations of features, address of people) on Earth s surface,
INTRODUCTION TO GIS. Dr. Ori Gudes
 INTRODUCTION TO GIS Dr. Ori Gudes Outline of the Presentation What is GIS? What s the rational for using GIS, and how GIS can be used to solve problems? Explore a GIS map and get information about map
Introducing GIS analysis
 1 Introducing GIS analysis GIS analysis lets you see patterns and relationships in your geographic data. The results of your analysis will give you insight into a place, help you focus your actions, or
Display data in a map-like format so that geographic patterns and interrelationships are visible
 Vilmaliz Rodríguez Guzmán M.S. Student, Department of Geology University of Puerto Rico at Mayagüez Remote Sensing and Geographic Information Systems (GIS) Reference: James B. Campbell. Introduction to
Overview of Statistical Analysis of Spatial Data
 Overview of Statistical Analysis of Spatial Data Geog 2C Introduction to Spatial Data Analysis Phaedon C. Kyriakidis www.geog.ucsb.edu/ phaedon Department of Geography University of California Santa Barbara
ENV208/ENV508 Applied GIS. Week 1: What is GIS?
 ENV208/ENV508 Applied GIS Week 1: What is GIS? 1 WHAT IS GIS? A GIS integrates hardware, software, and data for capturing, managing, analyzing, and displaying all forms of geographically referenced information.
Quality Assessment and Uncertainty Handling in Uncertainty-Based Spatial Data Mining Framework
 Quality Assessment and Uncertainty Handling in Uncertainty-Based Spatial Data Mining Framework Sk. Rafi, Sd. Rizwana Abstract: Spatial data mining is to extract the unknown knowledge from a large-amount
Propagation of Errors in Spatial Analysis
 Stephen F. Austin State University SFA ScholarWorks Faculty Presentations Spatial Science 2001 Propagation of Errors in Spatial Analysis Peter P. Siska I-Kuai Hung Arthur Temple College of Forestry and
Improving Spatial Data Interoperability
 Improving Spatial Data Interoperability A Framework for Geostatistical Support-To To-Support Interpolation Michael F. Goodchild, Phaedon C. Kyriakidis, Philipp Schneider, Matt Rice, Qingfeng Guan, Jordan
Harris: Quantitative Chemical Analysis, Eight Edition CHAPTER 03: EXPERIMENTAL ERROR
 Harris: Quantitative Chemical Analysis, Eight Edition CHAPTER 03: EXPERIMENTAL ERROR Chapter 3. Experimental Error -There is error associated with every measurement. -There is no way to measure the true
Understanding Geographic Information System GIS
 Understanding Geographic Information System GIS What do we know about GIS? G eographic I nformation Maps Data S ystem Computerized What do we know about maps? Types of Maps (Familiar Examples) Street Maps
Introduction to Geographic Information Systems (GIS): Environmental Science Focus
: Environmental Science Focus") Introduction to Geographic Information Systems (GIS): Environmental Science Focus September 9, 2013 We will begin at 9:10 AM. Login info: Username:!cnrguest Password: gocal_bears Instructor: Domain: CAMPUS
Introduction to Geographic Information Systems (GIS): Environmental Science Focus September 9, 2013 We will begin at 9:10 AM. Login info: Username:!cnrguest Password: gocal_bears Instructor: Domain: CAMPUS
Data Structures & Database Queries in GIS
 Data Structures & Database Queries in GIS Objective In this lab we will show you how to use ArcGIS for analysis of digital elevation models (DEM s), in relationship to Rocky Mountain bighorn sheep (Ovis
Canadian Board of Examiners for Professional Surveyors Core Syllabus Item C 5: GEOSPATIAL INFORMATION SYSTEMS
 Study Guide: Canadian Board of Examiners for Professional Surveyors Core Syllabus Item C 5: GEOSPATIAL INFORMATION SYSTEMS This guide presents some study questions with specific referral to the essential
VISUAL ANALYTICS APPROACH FOR CONSIDERING UNCERTAINTY INFORMATION IN CHANGE ANALYSIS PROCESSES
 VISUAL ANALYTICS APPROACH FOR CONSIDERING UNCERTAINTY INFORMATION IN CHANGE ANALYSIS PROCESSES J. Schiewe HafenCity University Hamburg, Lab for Geoinformatics and Geovisualization, Hebebrandstr. 1, 22297
KNOWLEDGE-BASED CLASSIFICATION OF LAND COVER FOR THE QUALITY ASSESSEMENT OF GIS DATABASE. Israel -
 KNOWLEDGE-BASED CLASSIFICATION OF LAND COVER FOR THE QUALITY ASSESSEMENT OF GIS DATABASE Ammatzia Peled a,*, Michael Gilichinsky b a University of Haifa, Department of Geography and Environmental Studies,
Chapter 6. Fundamentals of GIS-Based Data Analysis for Decision Support. Table 6.1. Spatial Data Transformations by Geospatial Data Types
 Chapter 6 Fundamentals of GIS-Based Data Analysis for Decision Support FROM: Points Lines Polygons Fields Table 6.1. Spatial Data Transformations by Geospatial Data Types TO: Points Lines Polygons Fields
Spatial Webs. Michael F. Goodchild University of California Santa Barbara
 Spatial Webs Michael F. Goodchild University of California Santa Barbara The locations of computing User location u the user interface Processing location p u-p 1960s < 10m dedicated lines ca 1970
Deriving Uncertainty of Area Estimates from Satellite Imagery using Fuzzy Land-cover Classification
 International Journal of Information and Computation Technology. ISSN 0974-2239 Volume 3, Number 10 (2013), pp. 1059-1066 International Research Publications House http://www. irphouse.com /ijict.htm Deriving
, (1) e i = ˆσ 1 h ii. c 2016, Jeffrey S. Simonoff 1
 e i = ˆσ 1 h ii. c 2016, Jeffrey S. Simonoff 1") Regression diagnostics As is true of all statistical methodologies, linear regression analysis can be a very effective way to model data, as along as the assumptions being made are true. For the regression
Regression diagnostics As is true of all statistical methodologies, linear regression analysis can be a very effective way to model data, as along as the assumptions being made are true. For the regression
4th HR-HU and 15th HU geomathematical congress Geomathematics as Geoscience Reliability enhancement of groundwater estimations
 Reliability enhancement of groundwater estimations Zoltán Zsolt Fehér 1,2, János Rakonczai 1, 1 Institute of Geoscience, University of Szeged, H-6722 Szeged, Hungary, 2 e-mail: zzfeher@geo.u-szeged.hu
a system for input, storage, manipulation, and output of geographic information. GIS combines software with hardware,
 Introduction to GIS Dr. Pranjit Kr. Sarma Assistant Professor Department of Geography Mangaldi College Mobile: +91 94357 04398 What is a GIS a system for input, storage, manipulation, and output of geographic
Bathymetry Data and Models: Best Practices
 Bathymetry Data and Models: Best Practices Barry Eakins & Lisa Taylor The NOAA National Geophysical Data Center Over 600 data types - from the core of the Earth to the surface of the Sun NGDC Bathymetry
Concepts and Applications of Kriging. Eric Krause Konstantin Krivoruchko
 Concepts and Applications of Kriging Eric Krause Konstantin Krivoruchko Outline Introduction to interpolation Exploratory spatial data analysis (ESDA) Using the Geostatistical Wizard Validating interpolation