B. Topographic maps are also called. contour maps
|
|
|
- Daniel Page
- 5 years ago
- Views:
Transcription
1
2 Topographic Maps

3 Introduction A. Topographic maps are essential tools in geologic and engineering studies because they show the configuration of Earth's surface in remarkable detail and permit one to measure horizontal distances and elevations. vertical This is accomplished by means of carefully surveyed connecting isolines points of to equal elevation represent elevations of hills and valleys. They are also used by the military, hikers, hunters, campers, and anyone who for whom knowledge of the three-dimensional nature of the land surface is useful. B. Topographic maps are also called. contour maps

4 II. Representing Elevation A. Contour Lines 1. Connect points of with equal elevation respect to sea level 2. Represent distance vertical (altitude can also be used). 3. Contour lines are plotted in. brown
 b.")
5 3. Bathymetric contours a. Show the shape and slope of the surface ocean bottom (Depth!) b. Shown in or blue, black depending on their location.
6 Crater Lake Bathymetric contours are also used for lakes and other bodies of water.
7 4. Index Contours Dark a. brown lines with elevations printed on them. b. Usually every line. fifth c. Not used if the map area has low. relief
8 Topographic Relief High Relief High Relief Low Relief Low Relief Digital Relief Map of Salt Lake City (1) Relief is the difference between the and highest lowest elevation. (2) A region with low relief will be relatively. flat (3) In areas with low relief, few contour lines will be required and all will be labeled
9 6. The Contour Interval a. The difference in elevation between two contour consecutive lines. b. Specified on the bottom margin of a map as either or feet. meters
10 Determine the Contour Interval Elevations are in meters c. Maps use the smallest contour interval that will allow easy readability and provide as much detail as possible. (2) intervals Large are used if there is a high relief. Small (3) intervals are used for low relief.
11 Rules for Contour Lines
 Contour lines always close to form an irregular.")

12 a. Every point on a contour line is of the exact same elevation (1) Contour lines always close to form an irregular. circle (2) Sometimes part of a contour line extends beyond the mapped area. (3) This is why the entire circle formed can t be seen.


13 c. Contour lines cross never one another Overhanging Cliff Vertical Cliff (1) A map location can t have two elevations. (2) A rare exception is where an is overhanging cliff present. In this case the hidden contour lines are dashed. (3) If the cliff is vertical the contour lines will merge to form a single contour line.
14 d. Gradient (Slope) (1) Gradient is a measure of the of steepness a slope. (2) Gradient is determined by finding the over change in elevation a distance. horizontal Expressed as: (a) Feet per mile (b) Meters per kilometer (for metric maps)
15 d. Gradient (Slope) Change in Elevation Horizontal Distance Change in field value = Change in elevation Distance = Horizontal distance Gradient is sometimes called: Rise over Run (1) Gradient is a measure of the of steepness a slope. (2) Gradient is determined by finding the over change in elevation a distance. horizontal Expressed as: (a) Feet per mile (b) Meters per kilometer (for metric maps)
16 Find the Gradient Between Points X and Y 300 m 340 m Gradient = change in elevation (m) Horizontal Distance (km) First find the change in elevation 20 m Contour Interval = Elevation of Point X = 300 m Elevation of Point Y = 340 m Change in elevation = 40 m Next measure the distance from X to Y Distance = 3 km Finally substitute into the equation Gradient = Answer: 13.3 m/km 40 m 3 km 3 km
17 Gradient Gentle Gradient Gentle Gradient (3) Can be inferred by the spacing of the contour lines. (a) A steeper gradient will be shown by contour closely spaced lines. (b) The more gentle the gradient, the the farther apart contour lines will be spaced.
18 e. Stream Valleys (1) Contour lines form a when V Pattern crossing a stream. (2) The apex of the V always points towards upstream the higher elevation.
19 Hills f. A concentric series of circular close contour lines represents a. hill

20 g. Depressions (1) Depression contour lines have marks hachure on the downhill side. They represent depressions. closed
 Contour lines repeat on opposite sides of the depression.")
21 Repeating Contour Lines 300 ft. elevation in the depression 300 ft. elevation on slope of hill (3) Contour lines repeat on opposite sides of the depression. (4) This means that the first contour line inside the depression has the same elevation as the last contour line outside

22 A Depression on a Slope If the depression is on a slope, the contour lines will repeat on only the lower side.
23 B. Vertical Control Points 1. These are symbols on a map that indicate the at exact elevation that location. 2. Some types of vertical control points:
 Its position vertical has been surveyed as accurately as")
 Shown as a with triangle the elevation if latitude and")
24 (1) A set permanent brass plate into the ground. (2) Its position vertical has been surveyed as accurately as possible. (3) Abbreviated BM. (4) Shown as a with triangle the elevation if latitude and longitude coordinates are certain. a. Bench Marks Example: BM 6016

25 Bench Marks (5) If VABM is next to a triangle symbol it indicates the elevation was determined by a surveying technique that used a vertical angle (hence, the letters VA).
 The horizontal position has been surveyed as accurately as possible, but exact coordinates haven t been determined.")
26 Bench Marks (5) If shown as by an BM X symbol with the elevation. (6) The horizontal position has been surveyed as accurately as possible, but exact coordinates haven t been determined. (7) Instead of a brass plate, the marker is a concrete tablet with the numbers etched onto the top (like a gravestone).
27 b. Recoverable Mark (1) Naturally occurring whose landmark horizontal position has been surveyed as accurately as possible. (2) Shown by an X symbol with the elevation. (3) Referred to as a. spot elevation

28 III. Latitude and Longitude ontopographic Maps <>
29
30 A. Quadrangles 1. Topographic maps rectangles whose borders are lines of latitude and. longitude 2. Because most maps cover of small areas Earth s surface whole degrees aren t used. 3. Maps are published in sizes using and minutes of seconds latitude and longitude.
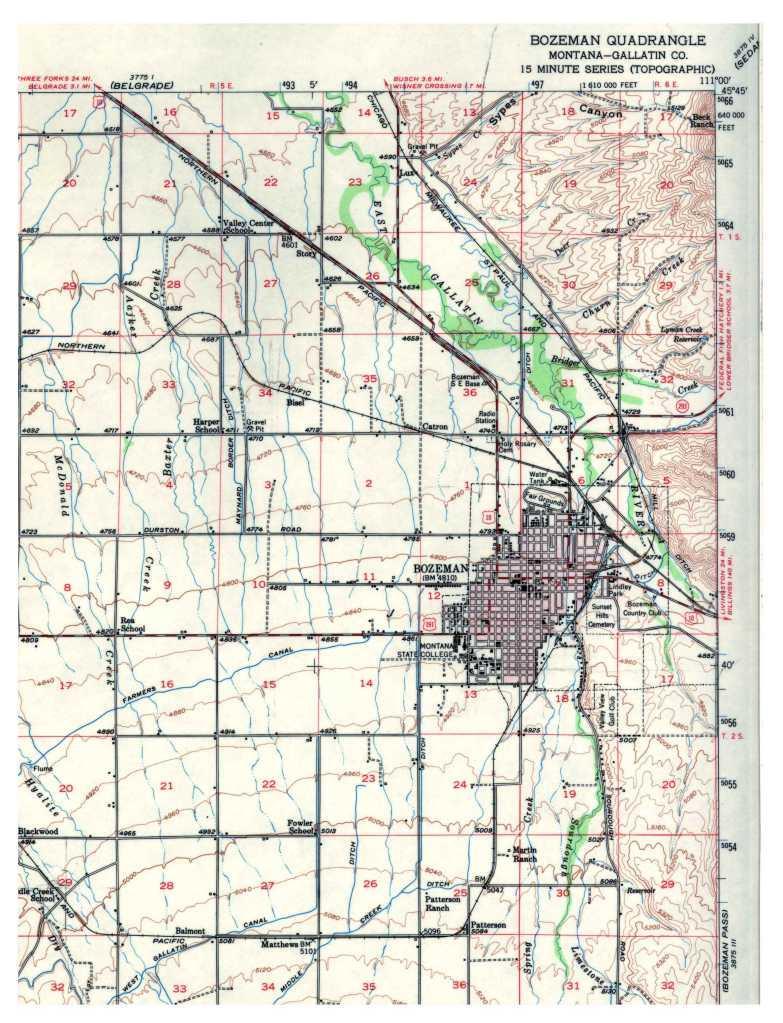
31 b. Two Common Sizes (1) 7 ½ minute quadrangle 7.5 minutes (a) Covers (7' 30") of latitude and longitude. (b) Most common map published by the United States Geologic Survey (USGS.) (2) 15 minute quadrangle 15 minutes four (a) Covers (15' 00") of latitude and longitude. (b) Covers times the area of a 7 ½ minute quadrangle. (c) This size is no longer published by the USGS
32 3. The Direction to North (a) North is always at the of top the quadrangle grid (b) Longitude lines (meridians) form the and east borders west of the map. (c) They aren t parallel because meridians toward converge the north. (d) Grid North ( ) GN (1) At the top of the quadrangle grid. (2) Based on a grid constructed on the map. (3) About the same as true north ( ) geographic North Pole on the actual Earth Note: The north and south borders of The map are parallels of latitude.


33 Using the Corners of the Map
 MN (a) The direction in which Earth s magnetic")
34 B. Magnetic North is not the same as True North 1. Magnetic North ( ) MN (a) The direction in which Earth s magnetic lines of force. converge
35 b. This is in not the same location as true north and moves 10 to 40 km per year It s currently about 1,000 km from the true North Pole, in Hudson Bay, Northern Canada (at 82.7 o N, o W in 2005).

36 Compasses Are Unusable Near the North Pole The horizontal force of the magnetic field Responsible for the direction in which a compass needle is oriented Decreases in strength as it approaches the North Magnetic Pole, where it is zero. Close to the pole, an area is reached where the frictional forces in the pivot are comparable to the horizontal forces of the magnetic field. The compass starts to behave erratically Eventually, as the horizontal force decreases even more, the compass becomes unusable
37 2. Magnetic Declination a. The between difference in degrees (MN) compass north and (shown true north by a star). b. Because magnetic north is continually changing, this is good only for the year of the map.
 Having")
38 Magnetic Declination East Declination West Declination Agonic Line (No Declination) Having no angle
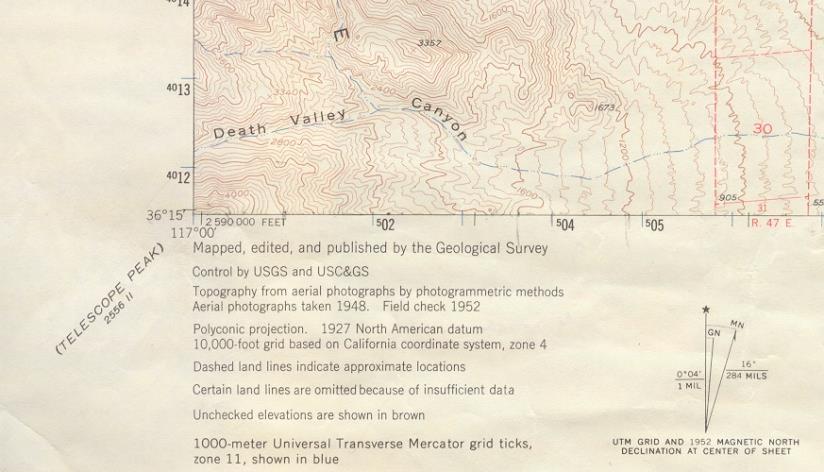
39 Finding Declination on a Map True North (to Geographic N. Pole) Magnetic North True North (to Geographic N. Pole) 16 degrees East Declination 12 ½ West Declination Most maps use an angle symbol shown at the bottom of the map. Use the number with only the degree symbol. Ignore the other numbers. They were for military use. Some newer maps simply state the value.
40 A. What is meant by scale? IV. Map Scale 1. Maps are. scale models 2. Scale is the by proportion which the real distance has been reduced. 3. All scales are shown on the bottom of the map
41 B. Ratio Scale 1. Expresses how much a certain distance on the map equals on the real Earth. 2. Units are in inches (centimeters if the contour lines are in meters). 3. Samples (a) 1:24,000 (1) One inch on the map represents in 24,000 inches real distance on Earth s surface. (2) Used on 7 ½ minute quadrangle maps (b) 1:62,000 (1) Once inch on the map represents in 62,000 inches real distance on Earth s surface. (2) Used on 15 minute quadrangle maps. (c) 1:100,000 (1) One centimeter on the map represents (1 100,000 cm km) in real distance on Earth s surface. (2) Used on metric maps.
42 C. Fractional Scale 1. Indicates that map has been reduced to the fraction of it s actual size. 2. Ratio Scale can easily be expressed as. Fractional Scale a. 1:24,000 equals a fractional scale of 1/24,000. b. 1:62,000 equals a fractional scale of 1/62,000. c. 1:100,000 equals a fractional scale of 1/100,000.
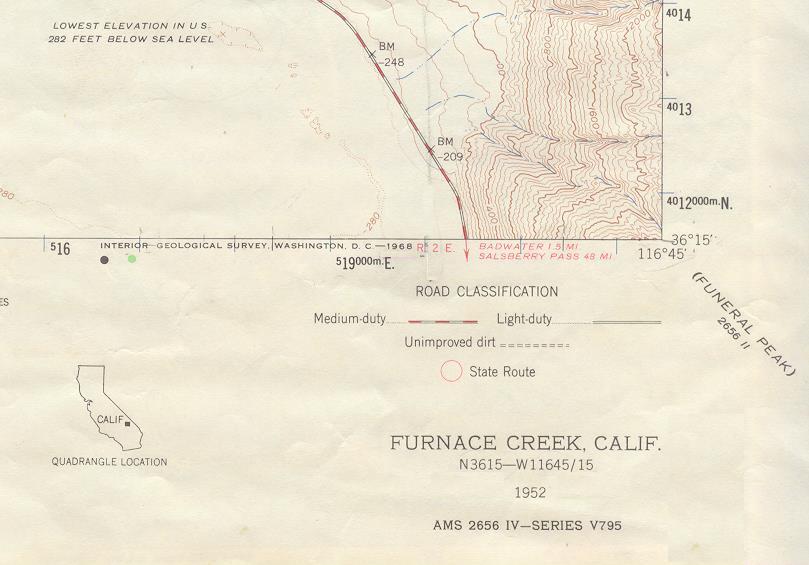
43 Note the zero mark on each scale D. Bar Scale 4 miles 1. Printed in the lower margin. 2. Four types: (a) (b) (c) 5 km Miles Feet Kilometers (subdivided into Meters)
44 V. Map Symbols and the Use of Color page A17 Lab Book A. Features and Symbols 1. Shown as points, lines, or areas, depending on their size and extent. 2. Individual houses may be shown as small black squares. For larger buildings, the actual shapes are mapped. 3. In densely built-up areas, most individual buildings are omitted and an area tint is shown. On some maps, post offices, churches, city halls, and other landmark buildings are shown within the tinted area. 4. Various point symbols are used to depict features such as buildings, campgrounds, springs, water tanks, mines, survey control points, and wells. Names of places and features are shown in a color corresponding to the type of feature. Many features are identified by labels, such as "Substation" or "Golf Course.
45 B. Color 1. The used colors usually indicate similar classes of information. 2. Colors used: a. : Brown Contour lines
46 Use of Color on Topographic Maps b. : Green Vegetation (e.g., woods, orchards, and vineyards)
47 Use of Color on Topographic Maps c. : Blue Water features such as lakes, swamps, rivers, and drainage
48 Blue is also used for the contours of a glacier (Ice is water.)
49 Use of Color on Topographic Maps d. : Red Classifies cultural features ( manmade ), such as populated areas, main roads, and boundaries
50 Use of Color on Topographic Maps e. Black Cultural features (e.g., buildings, roads, railroads, mines, towers, etc.)
51 Use of Color on Topographic Maps Purple f. : At one time, purple was used as a revision color to show all feature changes. Currently, purple is not used in the USGS revision program, but purple features are still present on many existing maps.
52 Start Lab 1-6
53 VI. Public Land Survey System (PLS) In the original 13 colonies, land grants and property lines were laid out on the basis of metes and bounds. This used landmarks and directions It proved inadequate because some objects used to mark boundaries were not permanent (e.g., trees, boulders) and some, such as mountains, were too large to make accurate surveying possible. Also, the resulting divisions had irregular boundaries
54 Public Land Survey System The United States Public Land Survey System (PLS) was instituted in 1785 when lands west of the Appalachians were being settled because a more accurate system was necessary. Except for the original 13 states and a few other states, all states are covered by this system.
 Point X: SE ¼, SW ¼,SE ¼, Sec. 11, T1S, R2W Point Z: SW ¼, NE ¼, SE ¼, Sec. 11, T1S,R2W")
55 These Township and Range Lines, crossing each other form squares which are called "Townships" or "Government Townships," which are six miles square. PLS (Township and Range) Point X: SE ¼, SW ¼,SE ¼, Sec. 11, T1S, R2W Point Z: SW ¼, NE ¼, SE ¼, Sec. 11, T1S,R2W
 Rectangular and Measured in decimal-based metric units (meters) Global military grid and coordinate system Developed in 1947 by the U.S.")
56 VII: Universal Transverse Mercator System (UTM) Rectangular and Measured in decimal-based metric units (meters) Global military grid and coordinate system Developed in 1947 by the U.S. National Imagery and Mapping Agency (NIMA) Zones 60 North-South strips of longitude Each is 6 degrees of longitude wide Consecutively numbered from Zone 01 between 174 o and 180 o east longitude at the east margin Zone 60 at the west margin (between 168 o west and 180 o)

57 Eastings and Northings Easting Coordinate Location of a point within a zone Measured from west to east in meters Tick for eastings written on maps are printed in green.

58 Reading UTM Coordinates on Maps

59 Reading UTM Coordinates on Maps

60 Construction of a Profile and Vertical Exaggeration
61 The End!
62
63 Lab 1-6 Topographic Maps Get ready for the lab questions. so lets review What did we talk about yesterday?
64 II. Representing Elevation A. Contour Lines 1. Connect points of with equal elevation respect to sea level 2. Represent distance vertical (altitude can also be used). 3. Contour lines are plotted in. brown
65 3. Bathymetric contours a. Show the shape and slope of the surface ocean bottom (Depth!) b. Shown in or blue, black depending on their location.

66 Crater Lake Bathymetric contours are also used for lakes and other bodies of water.

67 4. Index Contours Dark a. brown lines with elevations printed on them. b. Usually every line. fifth c. Not used if the map area has low. relief
 Relief is the difference between the and")
 In areas with low relief, few contour lines will be required and all")
68 Topographic Relief High Relief High Relief Low Relief Low Relief Digital Relief Map of Salt Lake City (1) Relief is the difference between the and highest lowest elevation. (2) A region with low relief will be relatively. flat (3) In areas with low relief, few contour lines will be required and all will be labeled
69 6. The Contour Interval a. The difference in elevation between two contour consecutive lines. b. Specified on the bottom margin of a map as either or feet. meters
70 Determine the Contour Interval Elevations are in meters c. Maps use the smallest contour interval that will allow easy readability and provide as much detail as possible. (2) intervals Large are used if there is a high relief. Small (3) intervals are used for low relief.
71 d. Gradient (Slope) Change in Elevation Horizontal Distance Change in field value = Change in elevation Distance = Horizontal distance Gradient is sometimes called: Rise over Run (1) Gradient is a measure of the of steepness a slope. (2) Gradient is determined by finding the over change in elevation a distance. horizontal Expressed as: (a) Feet per mile (b) Meters per kilometer (for metric maps)
 A steeper gradient will be shown by contour closely spaced lines.")
72 Gradient Gentle Gradient Gentle Gradient (3) Can be inferred by the spacing of the contour lines. (a) A steeper gradient will be shown by contour closely spaced lines. (b) The more gentle the gradient, the the farther apart contour lines will be spaced.
73 e. Stream Valleys (1) Contour lines form a when V Pattern crossing a stream. (2) The apex of the V always points towards upstream the higher elevation.

74 Hills f. A concentric series of circular close contour lines represents a. hill


75 A. Quadrangles 1. Topographic maps rectangles whose borders are lines of latitude and. longitude 2. Because most maps cover of small areas Earth s surface whole degrees aren t used. 3. Maps are published in sizes using and minutes of seconds latitude and longitude.
76 b. Two Common Sizes (1) 7 ½ minute quadrangle 7.5 minutes (a) Covers (7' 30") of latitude and longitude. (b) Most common map published by the United States Geologic Survey (USGS.) (2) 15 minute quadrangle 15 minutes four (a) Covers (15' 00") of latitude and longitude. (b) Covers times the area of a 7 ½ minute quadrangle. (c) This size is no longer published by the USGS
 They aren t parallel because meridians toward converge the north. (d) Grid North ( ) GN (1) At the top of the quadrangle grid. (2) Based on a grid constructed on the map.")
77 3. The Direction to North (a) North is always at the of top the quadrangle grid (b) Longitude lines (meridians) form the and east borders west of the map. (c) They aren t parallel because meridians toward converge the north. (d) Grid North ( ) GN (1) At the top of the quadrangle grid. (2) Based on a grid constructed on the map. (3) About the same as true north ( ) geographic North Pole on the actual Earth Note: The north and south borders of The map are parallels of latitude.
78 2. Magnetic Declination a. The between difference in degrees (MN) compass north and (shown true north by a star). b. Because magnetic north is continually changing, this is good only for the year of the map.
 Magnetic North True North (to Geographic N.")

79 Finding Declination on a Map True North (to Geographic N. Pole) Magnetic North True North (to Geographic N. Pole) 16 degrees East Declination 12 ½ West Declination Most maps use an angle symbol shown at the bottom of the map. Use the number with only the degree symbol. Ignore the other numbers. They were for military use. Some newer maps simply state the value.
80 A. What is meant by scale? IV. Map Scale 1. Maps are. scale models 2. Scale is the by proportion which the real distance has been reduced. 3. All scales are shown on the bottom of the map
81 B. Ratio Scale 1. Expresses how much a certain distance on the map equals on the real Earth. 2. Units are in inches (centimeters if the contour lines are in meters). 3. Samples (a) 1:24,000 (1) One inch on the map represents in 24,000 inches real distance on Earth s surface. (2) Used on 7 ½ minute quadrangle maps (b) 1:62,000 (1) Once inch on the map represents in 62,000 inches real distance on Earth s surface. (2) Used on 15 minute quadrangle maps. (c) 1:100,000 (1) One centimeter on the map represents (1 100,000 cm km) in real distance on Earth s surface. (2) Used on metric maps.
82 V. Map Symbols and the Use of Color page A17 Lab Book A. Features and Symbols 1. Shown as points, lines, or areas, depending on their size and extent. 2. Individual houses may be shown as small black squares. For larger buildings, the actual shapes are mapped. 3. In densely built-up areas, most individual buildings are omitted and an area tint is shown. On some maps, post offices, churches, city halls, and other landmark buildings are shown within the tinted area. 4. Various point symbols are used to depict features such as buildings, campgrounds, springs, water tanks, mines, survey control points, and wells. Names of places and features are shown in a color corresponding to the type of feature. Many features are identified by labels, such as "Substation" or "Golf Course.

83 B. Color 1. The used colors usually indicate similar classes of information. 2. Colors used: a. : Brown Contour lines
")
84 Use of Color on Topographic Maps b. : Green Vegetation (e.g., woods, orchards, and vineyards)


85 Use of Color on Topographic Maps c. : Blue Water features such as lakes, swamps, rivers, and drainage

86 Blue is also used for the contours of a glacier (Ice is water.)
, such as populated")
87 Use of Color on Topographic Maps d. : Red Classifies cultural features ( manmade ), such as populated areas, main roads, and boundaries

88 Use of Color on Topographic Maps e. Black Cultural features (e.g., buildings, roads, railroads, mines, towers, etc.)


89 Use of Color on Topographic Maps Purple f. : At one time, purple was used as a revision color to show all feature changes. Currently, purple is not used in the USGS revision program, but purple features are still present on many existing maps.
90 Start Lab 1-6
Using Map and Compass Together
 Using Map and Compass Together In situations where you foresee a potential evacuation on foot, where there are no roads, and no indication as to the direction of travel (i.e., road signs), it is recommended
Topographic Map Series:
 DEFINITION OF A MAP A MAP IS A GEOGRAPHIC PREPRESENTATION OF A PORTION OF THE EARTH S SURFACE DRAWN TO SCALE, AS SEEN FROM ABOVE. IT S USES COLORS, SYMBOLS AND LABELS TO REPRESENT FEATURES FOUND ON THE
APPENDIX A GLOSSARY. Appendix A.1
 APPENDIX A GLOSSARY Appendix A.1 Appendix A.2 Back Bearing A back bearing is measured from the object to your position. It is the exact opposite of a direct bearing. Base Line An imaginary line on the
Latitude and Longitude
 U n i t 3 M a p p i n g P a g e 1 Latitude and Longitude Note: These coordinates are always expressed LATITUDE/LONGITUDE!!! Coordinate System: Using and to find your position on Earth. LATITUDE LATITUDE
Lab Topographic Maps. Name: Partner: Purpose. Background Information
 Lab Topographic Maps Name: Partner: Purpose The purpose of this lab is to familiarize you with graphic representations of the Earth s surface primarily maps. Simple line maps show the spatial relationship
Laboratory Exercise #2 Introduction to Quadrangle Maps
 page - 1 Laboratory Exercise #2 Introduction to Quadrangle Maps A. Introduction to Quadrangle Maps The United States Geological Survey has developed a nationwide series of quadrangle maps that cover small
Laboratory Exercise #2 Introduction to Quadrangle Maps
 page - Laboratory Exercise #2 Introduction to Quadrangle Maps A. Introduction to Quadrangle Maps The United States Geological Survey has developed a nationwide series of quadrangle maps that cover small
The Tacoma Mountaineers Wilderness Navigation
 The Tacoma Mountaineers Wilderness Navigation Navigation Fundamentals Navigation in mountainous terrain and wilderness areas requires a set of skills, of which using a map and compass is only one part.
Navigating with Map & Compass. Nevada County Sheriff s Search & Rescue
 Navigating with Map & Compass Nevada County Sheriff s Search & Rescue Objectives Very Practical Teach you how to go from point A to point B Go from the wilderness (real world) to a map and visa versa Agenda
Topographic Maps Self-Instruction Lab (2016 edition) Geology 100 David Harbor s Section. 12 inches x 1 mile
 Geology 100 David Harbor s Section. 12 inches x 1 mile") Topographic Maps Name Self-Instruction Lab (2016 edition) Geology 100 David Harbor s Section Topographic maps are an important aid for a geologist, but maps are also useful for hikers, bicyclists, and
Topographic Maps Name Self-Instruction Lab (2016 edition) Geology 100 David Harbor s Section Topographic maps are an important aid for a geologist, but maps are also useful for hikers, bicyclists, and
What is a map? A Map is a two or three-dimensional model or representation of the Earth s surface. 2-Dimensional map
 What is a map? A Map is a two or three-dimensional model or representation of the Earth s surface. 2-Dimensional map What is a Map Projection? Planar Projection Projection A Projection is a mathematical
Chapter 3 Models of the Earth. 3.1 Finding Locations on the Earth. 3.1 Objectives
 Chapter 3 Models of the Earth 3.1 Finding Locations on the Earth 3.1 Objectives Explain latitude and longitude. How can latitude and longitude be used to find locations on Earth? How can a magnetic compass
Compass Basics. Quick Map Basics Review For Compass Use
 Compass Basics Quick Map Basics Review For Compass Use A topographic map tells you where things are and how to get to them, whether you're hiking, biking, hunting, fishing, or just interested in the world
Date: UNI. world. *Dedicated to
 Name: Date: UNI IT THREE 2D and 3D model s of the natural world *Dedicated to Name: Date: ABSTRACT T AND RATIONALE A topographic map is a type of map that depicts the detail and quantitative representation
Topographic Maps and Landforms Geology Lab
 Topographic Maps and Landforms Geology Lab Ray Rector: Instructor Today s Lab Activities 1) Discussion of Last Week s Lab 2) Lecture on Topo Maps and Elevation Contours 3) Construct Topographic Maps and
Topographic Maps. Take Notes as you view the slides
 Topographic Maps Take Notes as you view the slides Lesson Objectives Define a topographic map and state its uses. Describe how contour lines show the elevations, shape, and slope of the land. Identify
MAPPING THE EARTH HOW DO YOU FIND A LOCATION ON THE EARTH?
 MAPPING THE EARTH HOW DO YOU FIND A LOCATION ON THE EARTH? UNIT TOPICS TOPIC 1: LATITUDE & LONGITUDE TOPIC 2: FIELD MAPS TOPIC 3: TOPOGRAPHIC MAPS TOPIC 4: NYS LANDSCAPES TOPIC 1: LATITUDE & LONGITUDE
Mapping Earth. How are Earth s surface features measured and modeled?
 Name Mapping Earth How are Earth s surface features measured and modeled? Before You Read Before you read the chapter, think about what you know about maps Record your thoughts in the first column Pair
Geology 101 Lab Worksheet: Topographic Maps
 Geology 101 Lab Worksheet: Topographic Maps Name: Refer to the Topographic Maps Lab for the information you need to complete this worksheet (http://commons.wvc.edu/rdawes/g101ocl/labs/topomapslab.html).
Topographic Maps: Background
 Topographic Maps: Background Introduction From Dr. Terry Swanson, University of Washington, ESS 101 Lab, Geologic Techniques, and Dr. David Kendrick, Hobart and William Smith Colleges, Geneva, NY Geoscientists
Class Notes: Mapping the Earth
 Name: Date: Period: Mapping the Earth The Physical Setting: Earth Science Class Notes: Mapping the Earth I. Latitude and Longitude Map -! Latitude -! Also called These lines intersect Equator -! The North
UNIT 1C. USING TOPOGRAPHIC MAPS WHERE IN THE WORLD... ARE YOU?
 UNIT 1C. USING TOPOGRAPHIC MAPS WHERE IN THE WORLD... ARE YOU? TIME 60-90 minutes LEVEL All BENCHMARKS Next Generation Science Standards MS-LS1.D Science & Engineering Practices Developing and Using Models
56H. This system allows definition of points on the Earth s surface to within 100 meters. Page 20. Navigation Systems Basics of Maps
 Grid References Many maps are provided with the standard grid overlaying them. This provides a simple and accurate method for finding features on the map. It is a network of intersecting parallel lines
Earth Science Regents Reading Topographic Maps
 Earth Science Regents Reading Topographic Maps Name Period Quick Tutorial on Degrees, Minutes, and Seconds of Latitude and Longitude A degree of latitude on the surface of the earth is about 70 miles long.
Scientists observe the environment around them using their five senses.
 Earth Science Notes Topics 1: Observation and Measurement Topic 2: The Changing Environment Review book pages 1-38 Scientists observe the environment around them using their five senses. When scientists
Basic Map Skills for the Outdoors
 Geography 80-20 80% of what there is to know, for 20% of the sweat Basic Map Skills for the Outdoors Map Scale Map source: US Geological Survey Four ways to indicate map scale: Representative fraction
CONTOUR MAPS This Enrichment4You e-guide provides a brief overview of contour maps In this e-guide you will: Sample file
 GEOLOGY CONTOUR MAPS CONTOUR MAPS This Enrichment4You e-guide provides a brief overview of contour maps In this e-guide you will: *Learn Basic Facts About Contour Maps *Make a 3-D Contour Map Geology Contour
Topographic Maps. More than a Road Map
 Topographic Maps More than a Road Map What is a Topographic Map? Scaled representation of features on the surface of the Earth such as roads, rivers, and plains Provides information about land elevations
Guided Notes Topographic Maps
 Guided Notes Topographic Maps Map scale Straight line distance Curved line distance Rules of Isolines Contour Lines Hachured Lines Possible elevations Slope & Gradient Direction of River Flow Topographic
Erosional Features. What processes shaped this landscape?
 Have you ever looked at the land around you and wondered what processes shaped what you see? Perhaps you see mountains, valleys, rivers, or canyons. Do you know how long these geologic features have been
Topographic Maps and Profiles
 Name: Date: Period: Earth Science Foundations The Physical Setting: Earth Science CLASS NOTES! Topographic Maps [contour maps] -! Topographic maps show three-dimensional shapes in two dimensions Elevation
EROSIONAL FEATURES. reflect
 reflect Have you ever looked at the land around you and wondered what processes shaped what you see? Perhaps you see mountains, valleys, rivers, or canyons. Do you know how long these geologic features
Map Reading & Compass Use
 Spring 2013 Kestrel Land Trust Page 2 / 10 Contents Map Basics... 3 Map Types... 3 Terrain Association... 4 Estimating Distance: Pacing... 4 Contour Lines... 5 Navigating with a Compass... 6 Compass Types...
From Science Olympiad Student Center
 1 of 10 3/5/13 8:18 AM Forums Wiki Test Exchange Image Gallery Score Tracker Road Scholar From Science Olympiad Student Center In Road Scholar, Forum Threads Tests There are no images available for this
Regents Earth Science Unit 1 Earth Dimensions
 Regents Earth Science Unit 1 Earth Dimensions www. BarnesWeb.org 2014-15 edition Name: Name: OBJECTIVES Correctly define: isolines, gradient, topographic map, contour interval, hachured lines, profile,
CHAPTER EXIT CHAPTER. Models of Earth. 3.1 Modeling the Planet. 3.2 Mapmaking and Technology. 3.3 Topographic Maps CHAPTER OUTLINE
 EXIT CHAPTER.1 Modeling the Planet.2 Mapmaking and Technology. Topographic Maps CHAPTER OUTLINE CHAPTER.1 Modeling the Planet A flat of Earth is a convenient tool, but it can distort the shape, distance,
Topo Map Tidbits. Adapted from: An original Creek Connections activity. Creek Connections, Box 10, Allegheny College, Meadville, Pennsylvania, 16335
 Topo Map Tidbits Adapted from: An original Creek Connections activity. Creek Connections, Box 10, Allegheny College, Meadville, Pennsylvania, 16335 Introduction to Topographic Maps Grade Level: Basic Duration:
Elevations are in meters above mean sea level. Scale 1:2000
 12.001 LAB 7: TOPOGRAPHIC MAPS Due: Monday, April 11 PART I: CONTOURING AND PROFILES (20 PTS) 1. Contour this area map using a 5 meter contour interval. Remember some fundamental rules of contour lines,
LAND NAVIGATION 2-1. DEFINITION
 LAND NAVIGATION MAPS Cartography is the art and science of expressing the known physical features of the earth graphically by maps and charts. No one knows who drew, molded, laced together, or scratched
Butte County Fire Department
 Butte County Fire Department Basic Land Navigation Verification Sheet I verify that Print Supervisor s name has completed the Print Employee s name Basic Land Navigation self study guide on. Date Attached
Orienteering Maps & Map Reading Latitude and Longitude Scale
 Orienteering Maps & Map Reading A map is a two-dimensional representation of the three-dimensional world you'll be hiking in. All maps will have some basic features in common and map reading is all about
Chapter 1 Overview of Maps
 Chapter 1 Overview of Maps In this chapter you will learn about: Key points when working with maps General types of maps Incident specific maps Map legend and symbols Map sources A map is a navigational
Homework - Topographic Maps and What They Mean - Standard Earth Science
 Name: Mr. Schwartz Earth Science Period: Date: /10 Homework - Topographic Maps and What They Mean - Standard Earth Science Read pages 46-47 and 53-56 in your text. Then, answer the questions. Don t forget
Navigating for Scouts A Self-teaching Guide to Navigation with Map and Compass
 Don Burgess, November 2003 Materials topographic maps Navigating for Scouts A Self-teaching Guide to Navigation with Map and Compass metric ruler orienteering compass 30 M/5 Hamilton-Burlington 41 I/13
Practice Questions. (4) It connects points of equal air temperature. Which of the following items is a model? lithosphere and the troposphere?
 It connects points of equal air temperature. Which of the following items is a model? lithosphere and the troposphere?") Practice Questions Directions Review the Test-Taking Strategies section of this book. Then answer the folowing questions. Read each question carefuly and answer with a correct choice or response. Part
Practice Questions Directions Review the Test-Taking Strategies section of this book. Then answer the folowing questions. Read each question carefuly and answer with a correct choice or response. Part
Maps. 3. Which altitude of Polaris could be observed in New York State?
 Name: Date: 1. For an observer in New York State, the altitude of Polaris is 43 above the northern horizon. This observer s latitude is closest to the latitude of A. New York City B. Utica 3. Which altitude
King County Explorer Search and Rescue. Course B Map & Compass
 King County Explorer Search and Rescue Course B Map & Compass Disclaimer The intent of this presentation is to provide a basic overview of maps, compasses, and location finding. It is not meant to be a
1. Identify the Earth motion that provides the basis for our system of local time and time zones.
 Base your answers to questions 1 through 4 on the map below and on your knowledge of Earth science. The map shows the four time zones and some latitude and longitude lines across the continental United
Chapter 3 SECTION 1 OBJECTIVES
 Chapter 3 SECTION 1 OBJECTIVES Distinguish between latitude and longitude and locate coordinates on maps. Explain how latitude and longitude can be used to locate places on Earth s surface. Explain the
Midterm Review #4 -FR
 Base your answers to questions 1 through 3 on the diagram below, which represents a north polar view of Earth on a specific day of the year. Solar times at selected longitude lines are shown. Letter A
A map is a small-scale flat-surface representation of some portion of the earth s surface.
 MAPS AND CHARTS A map is a small-scale flat-surface representation of some portion of the earth s surface. A representation that is designed for plotting navigational information is called a chart. Often
California Cadet Corps Curriculum on Maps and Navigation. Map Reading LEADERS KNOW THE WAY
 California Cadet Corps Curriculum on Maps and Navigation Map Reading LEADERS KNOW THE WAY 5/22/2017 Map Reading Agenda A1. Introduction to Maps A2. Topographical Map Basics A3. Elevation and Terrain Features
AS 410 Land Navigation. Chpt 4-1
 AS 410 Land Navigation Chpt 4-1 Overview Types of Maps Map Legends / Scales Latitude and Longitude Orienteering Why? Why important to learn how to read a compass and map? No cell phone coverage Mountain
GCSAR Navigation -- Maps
 GCSAR Navigation -- Maps From the GCSAR Certification Standards Identify and explain all the border information on a topographic map. Identify and explain the following aspects of maps: index and intermediate
5. The topographic map below shows a lake and two rivers.
 Mapping A B1 1. The diagram below shows latitude measurements every 10 degrees and longitude measurements every 15 degrees. What is the latitude and longitude of point X? 5. The topographic map below shows
USING THE MILITARY LENSATIC COMPASS
 USING THE MILITARY LENSATIC COMPASS WARNING This presentation is intended as a quick summary, and not a comprehensive resource. If you want to learn Land Navigation in detail, either buy a book; or get
***When doing the lab report write-up, be sure to follow the guidelines.***
 Topographic Maps Lab Vocabulary: topography - study of the shapes and features of the earth's surface elevation - height above sea level bench mark - a point that has been accurately measured for its position
Mapping Earth Review Note Cards
 Review Note Cards Spheres of Earth Atmosphere- Layer of gases Hydrosphere- All liquid water Lithosphere- Solid surface Biosphere-Living Portion Cryosphere-Ice Portion Evidence that the Earth is Round The
Approximately how many inches of average yearly precipitation does Rochester, New York, receive?
 1. Base your answer to the following question on the isoline map below, which shows the average yearly precipitation, in inches, across New York State. Approximately how many inches of average yearly precipitation
Introduction to Cartography Part I
 Introduction to Cartography Part I Introduction to Cartography Maps vs. Globes General Types of Maps Standard Map Features Maps versus Globes Map: a representation of the world, or part of it, in two dimensions
REVISION: MAPWORK 18 SEPTEMBER 2014
 REVISION: MAPWORK 18 SEPTEMBER 2014 Lesson Description In this lesson we revise: Various mapwork calculations Summary Relative Position Bearing is the angular (angle) distance between two points True Bearing
Butte County Fire Department
 Butte County Fire Department Basic Land Navigation Verification Sheet I verify that Print Supervisor's name Print Employee's name has completed the Basic Land Navigation self study guide on Date Attached
Name: Mid-Year Review #2 SAR
 Name: Mid-Year Review #2 SAR Base your answers to questions 1 through 3 on on the diagram below, which shows laboratory materials used for an investigation of the effects of sediment size on permeability,
EARTH SCIENCE KEY UNIT 2-H
 EARTH SCIENCE KEY UNIT 2-H UNIT 2 MODELS & DIMENSIONS OF EARTH I. Model = ANYTHING THAT REPRESENTS THE PROPERTIES OF AN OBJECT OR SYSTEM A. Types and examples of models: 1. PHYSICAL Provides us with information
Name Class Date. For each pair of terms, explain how the meanings of the terms differ.
 Skills Worksheet Chapter Review USING KEY TERMS For each pair of terms, explain how the meanings of the terms differ. 1. true north and magnetic north 2. latitude and longitude 3. equator and prime meridian
MAP STUDY: INTERPRETATION OF SURVEY MAPS
 MAP STUDY: INTERPRETATION OF SURVEY MAPS Types and Elements of Maps Maps are drawn to represent the Earth on a piece of paper. Maps are used widely to represent the Earth. Maps use signs and symbols in
Chapter 3 Geographic Location Systems
 Chapter 3 Geographic Location Systems In this chapter you will learn about: Latitude and longitude Universal Transverse Mercator (UTM) U.S. Public Land Survey Other geographic location systems Geographic
LESSON 2: INTRODUCTION TO TOPOGRAPHICAL MAPS
 LESSON 2: INTRODUCTION TO TOPOGRAPHICAL MAPS Finding your way if you become separated from a group. PURPOSE This lesson presents an overview of topographic maps. It describes their characteristics and
Notes and Summary pages:
 Topographic Mapping 8.9C Interpret topographical maps and satellite views to identify land and erosional features and predict how these shapes may be reshaped by weathering ATL Skills: Communication taking
NAME DATE TOPOGRAPHIC MAPS. Activity 1: Topographic Map Investigation I: More Than a Road Map
 NAME DATE PARTNER(S) TOPOGRAPHIC MAPS Now you have seen how topographic maps can be generated to present the elevation of a terrain. Let s look at some topographic maps and learn how to interpret them.
OBJECTIVES. Identify the means by which latitude and longitude were created and the science upon which they are based.
 Name: OBJECTIVES Correctly define: isolines, gradient, topographic map, contour interval, hachured lines, profile, latitude, longitude, hydrosphere, lithosphere, atmosphere, elevation, model EARTH S SPHERES
Different types of maps and how to read them.
 Different types of maps and how to read them. A map is a picture or representation of the Earth's surface, showing how things are related to each other by distance, direction, and size. Maps have been
1. The topographic map below shows a depression contour line on Earth's surface.
 1. The topographic map below shows a depression contour line on Earth's surface. Points A, B, C, and D represent surface locations. Contour line elevations are in feet. Which profile best shows the topography
Chapter 02 Maps. Multiple Choice Questions
 Chapter 02 Maps Multiple Choice Questions 1. Every projection has some degree of distortion because A. a curved surface cannot be represented on a flat surface without distortion. B. parallels and meridians
11. ALPINE GLACIAL LANDFORMS
 Geomorphology 11. Alpine Glacial Landforms 11. ALPINE GLACIAL LANDFORMS 40 Points One objective of this exercise is for you be able to identify alpine glacial landforms and measure their characteristics.
Parts of a Map. Map Skills. The Title. There are 4 main parts of a map: The Title The Compass Rose The Map Key The Scale
 Map Skills Parts of a Map There are 4 main parts of a map: The Title The Compass Rose The Map Key The Scale The Title The title of the map is usually at the top and describes the topic of the map Example:
STAAR Science Tutorial 40 TEK 8.9C: Topographic Maps & Erosional Landforms
 Name: Teacher: Pd. Date: STAAR Science Tutorial 40 TEK 8.9C: Topographic Maps & Erosional Landforms TEK 8.9C: Interpret topographic maps and satellite views to identify land and erosional features and
Practice Packet Topic 2: Measuring Earth
 Practice Packet Topic 2: Measuring Earth Vocabulary: Lesson 1: Lesson 2: Name: Lesson 3: Mini Lesson: Latitude Longitude Pre-Test 1. To locate exact places on the earth, one must look at a. The intersecting
Coach Answers Part 2 Zombie 17 COACH ANSWERS (Questions and answers with explanations) Part 2
 Part 2") Zombie 17 COACH ANSWERS (Questions and answers with explanations) Part 2 44. The Brain Building looks fairly new. Based on the map, what is the most recent year in which it could have been constructed?
Zombie 17 COACH ANSWERS (Questions and answers with explanations) Part 2 44. The Brain Building looks fairly new. Based on the map, what is the most recent year in which it could have been constructed?
About places and/or important events Landmarks Maps How the land is, hills or flat or mountain range Connected to maps World Different countries
 What do you think you know about geography? About places and/or important events Landmarks Maps How the land is, hills or flat or mountain range Connected to maps World Different countries What do you
Wonder as you Wander up the Carding Mill Valley
 Wonder as you Wander up the Carding Mill Valley Spot clues to the 600 million year old history of the Long Mynd. Consider how the Earth has evolved since the rock you are walking over first formed. Welcome
Do Now. Copy the ques:on below and write down an. Sketch a profile of the books on the front table.
 Do Now Copy the ques:on below and write down an answer Sketch a profile of the books on the front table. Measurements Contour Lines How do we represent Eleva:on on a flat piece of paper? Eleva?on height
Introduction to Geography
 Introduction to Geography ropic of Cancer 3½ N Arctic Circle 90 N Prime Meridian 0 Arctic Ocean Mississippi R. Appalachian Mts. Europe Rocky Mountains N. America Atlantic Gulf of Ocean Mexico Caribbean
Basic Land Navigation
 A Publication of the National Wildfire Coordinating Group National Interagency Incident Management System Basic Land Navigation PMS 475 June 2007 NFES 2865 JUNE 2007 NFES 2865 Sponsored for NWCG publication
NAME: Log onto YouTube and search for jocrisci channel.
 NAME: Log onto YouTube and search for jocrisci channel. TOPO MAPS (Videos 2.3a, 2.3b, 2.4, 2.5, 2.6, 2.7, 2.8 ESRT 1b part on gradient) 1. You will be given a series of elevations and you will be asked
USING THE MILITARY LENSATIC COMPASS
 USING THE MILITARY LENSATIC COMPASS WARNING This presentation is intended as a quick summary, and not a comprehensive resource. If you want to learn Land Navigation in detail, either buy a book; or get
Lesson 3: Map grids and coordinates
 PRO TIPS: Map Reading Lesson 3: Map grids and coordinates References: FM 21-25; FM 21-26; FM 21-30 Study assignment: read FM 21-25 Chapters 5 and 6, then go through this lesson and take the self-assessment
 Chapter 2 Mapping Our World Picture: Mount Capulin, Raton, NM Cinder Cone Volcano ://3.bp.blogspot.com/_sKz1KwXRzcg/SzFzM52gIoI/AAAAAAAAABk/hguBAT80pk0/s320/capulin.jpg http://www.peteandmelissa.com/images/oklahoma/p1020190.jpg
Activities: Map and Compass
 Activities: Map and Compass Determining General Directions Modified with permission from Outdoor Living Skills Series: Map and Compass, Missouri Department of Conservation Overview: Students use the sun
MILITARY TOPOGRAPHIC MAP II B170247XQ STUDENT HANDOUT
 UNITED STATES MARINE CORPS THE BASIC SCHOOL MARINE CORPS TRAINING COMMAND CAMP BARRETT, VIRGINIA 22134-5019 MILITARY TOPOGRAPHIC MAP II B170247XQ STUDENT HANDOUT Basic Officer Course Introduction Importance
Unit I: Earth Dimensions. Review Book pp.19-30
 Unit I: Earth Dimensions Review Book pp.19-30 Objective #1 Describe the actual shape of the Earth and explain 3 pieces of evidence for its actual shape. Earth s Shape The Earth appears to be the shape
Coordinate Systems & Land Division
 Name Physical Geography Lab Activity #06 Due date Coordinate Systems & Land Division COR Objective 1, SLO 1,3 6.1. Introduction Latitude and longitude are great for sailing around the world, but can be
Red Star Navigation. Bearings:
 Red Star Navigation Bearings: The main focus in Red Star Navigation is how to use a compass and in particular compass bearings. It is important for cadets to describe bearings as this will assist them
What Is a Globe? Hemispheres. Main Idea Globes and maps provide different ways of showing features of the earth. Terms to Know
 r Main Idea Globes and maps provide different ways of showing features of the earth. Terms to Know hemisphere latitude longitude scale bar scale relief elevation contour line What Is a Globe? A globe is
Chapter 6 Mapping and Online Tools
 Chapter 6 Mapping and Online Tools The stream site you monitor is just part of a much larger system. When analyzing stream health, it is important to take a holistic view by considering the entire watershed.
What is a map? Understanding your map needs
 What is a map? A map is simply a drawing or picture of a landscape or location. Maps usually show the landscape as it would be seen from above, looking directly down. As well as showing the landscape of
Earth s Dimensions. Earth s shape. Evidence. Spheres of Earth: 1) Lithosphere- includes: 2) Hydrosphere includes: 3) Atmosphere - Earth Dimensions 23
 Lithosphere- includes: 2) Hydrosphere includes: 3) Atmosphere - Earth Dimensions 23") Earth s Dimensions Earth s shape Evidence Spheres of Earth: 1) Lithosphere- includes: 2) Hydrosphere includes: 3) Atmosphere - Earth Dimensions 23 Selected Properties of Earth s Atmosphere: Earth Science
Earth s Dimensions Earth s shape Evidence Spheres of Earth: 1) Lithosphere- includes: 2) Hydrosphere includes: 3) Atmosphere - Earth Dimensions 23 Selected Properties of Earth s Atmosphere: Earth Science
Maps: Geography s Basic Tools
 Maps: Geography s Basic Tools What is a map? - A map is a representation of the earth s features drawn on a flat surface. - Maps use points, lines, colours, and symbols to represent the features of an
Altitude. Area. surface inside closed boundaries measured in squares. Area is 21 squares. height above sea level or the Earth s surface
 Altitude L 6 height above sea level or the Earth s surface Cruising altitude is 30,000 feet. Area surface inside closed boundaries measured in squares Area is 21 squares L 4 Axis plural Axes 2 intersecting
1/28/16. EGM101 Skills Toolbox. Map types. Political Physical Topographic Climate Resource Road. Thematic maps (use one of the above as backdrop)
") EGM101 Skills Toolbox Map types Political Physical Topographic Climate Resource Road Thematic maps (use one of the above as backdrop) Map Types Deriving information from maps Hydrographic Geological Soils
EGM101 Skills Toolbox Map types Political Physical Topographic Climate Resource Road Thematic maps (use one of the above as backdrop) Map Types Deriving information from maps Hydrographic Geological Soils