Experimental design of fmri studies & Resting-State fmri
|
|
|
- Roger Byrd
- 5 years ago
- Views:
Transcription

1 Methods & Models for fmri Analysis 2016 Experimental design of fmri studies & Resting-State fmri Sandra Iglesias With many thanks for slides & images to: Klaas Enno Stephan, FIL Methods group, Christian Ruff
2 Methods & Models for fmri Analysis 2016 Experimental design of fmri studies & Resting-State fmri Sandra Iglesias With many thanks for slides & images to: Klaas Enno Stephan, FIL Methods group, Christian Ruff 2


3 Overview of SPM Image time-series Kernel Design matrix Statistical parametric map (SPM) Realignment Smoothing General linear model Normalisation Statistical inference Gaussian field theory Template p <0.05 Parameter estimates 3
4 Overview of SPM Research question: Which neuronal structures support face recognition? Design matrix Statistical parametric map (SPM) Hypothesis: The fusiform gyrus is implicated in face recognition General linear model Experimental design Statistical inference Gaussian field theory Parameter estimates p <0.05 4
 Hypothesis: The fusiform gyrus is implicated in face recognition General linear model Experimental design")
5 Overview of SPM Research question: Which neuronal structures support face recognition? Design matrix Statistical parametric map (SPM) Hypothesis: The fusiform gyrus is implicated in face recognition General linear model Experimental design Statistical inference Gaussian field theory Parameter estimates p <0.05 5
6 Overview Categorical designs Subtraction - Pure insertion, evoked / differential responses Conjunction - Testing multiple hypotheses Parametric designs Linear - Adaptation, cognitive dimensions Nonlinear - Polynomial expansions, neurometric functions Factorial designs Categorical Parametric - Interactions and pure insertion - Linear and nonlinear interactions - Psychophysiological Interactions 6
7 Cognitive subtraction Aim: Neuronal structures underlying a single process P? Procedure: Contrast: [Task with P] [control task without P ] = P the critical assumption of pure insertion Example: [Task with P] [task without P ] = P = 7
8 Cognitive subtraction Aim: Neuronal structures underlying a single process P? Procedure: Contrast: [Task with P] [control task without P ] = P the critical assumption of pure insertion Example: [Task with P] [task without P ] = P = = 8

9 Subtraction Logic Cognitive subtraction originated with reaction time experiments (F. C. Donders, a Dutch physiologist). Measure the time for a process to occur by comparing two reaction times, one which has the same components as the other + the process of interest. Example: T1: Hit a button when you see a light T2: Hit a button when the light is green but not red T3: Hit the left button when the light is green and the right button when the light is red T2 T1 = time to make discrimination between light color T3 T2 = time to make a decision Assumption of pure insertion: You can insert a component process into a task without disrupting the other components. F.C. Donders
?")
10 Cognitive subtraction: Baseline problems Which neuronal structures support face recognition? Distant stimuli - Several components differ! Related stimuli - P implicit in control condition? Queen! Aunt Jenny? Same stimuli, different task Name Person! - Interaction of task and stimuli (i.e. do task differences depend on stimuli chosen)? Name Gender! 11


11 A categorical analysis Experimental design Face viewing Object viewing F O F - O = Face recognition O - F = Object recognition under assumption of pure insertion Kanwisher N et al. J. Neurosci. 1997; 12
12 Categorical design Task 1 Task 2 Session 13
13 Overview Categorical designs Subtraction - Pure insertion, evoked / differential responses Conjunction - Testing multiple hypotheses Parametric designs Linear - Adaptation, cognitive dimensions Nonlinear - Polynomial expansions, neurometric functions Factorial designs Categorical Parametric - Interactions and pure insertion - Linear and nonlinear interactions - Psychophysiological Interactions 14
14 Conjunctions One way to minimize the baseline/pure insertion problem is to isolate the same process by two or more separate comparisons, and inspect the resulting simple effects for commonalities A test for such activation common to several independent contrasts is called conjunction Conjunctions can be conducted across a whole variety of different contexts: tasks stimuli senses (vision, audition) etc. Note: the contrasts entering a conjunction must be orthogonal (this is ensured automatically by SPM) 15
?")
15 Conjunctions Stimuli (A/B) Objects Colours Example: Which neural structures support object recognition, independent of task (naming vs. viewing)? Task (1/2) Viewing Naming A1 B1 A2 B2 Visual Processing Object Recognition Phonological Retrieval V R P 16

 [B1 - A1] & (Object - Colour naming) [B2 A2] Price et al.")
16 Conjunctions Stimuli (A/B) Objects Colours Viewing Task (1/2) Naming A1 A2 Visual Processing V Visual Processing Phonological Retrieval V P B1 B2 Visual Processing Object Recognition V R Visual Processing Phonological Retrieval Object Recognition V P R Which neural structures support object recognition? (Object - Colour viewing) [B1 - A1] & (Object - Colour naming) [B2 A2] Price et al Common object recognition response (R) [ V,R - V ] & [ P,V,R - P,V ] = R & R = R A1 B1 A2 B2 17
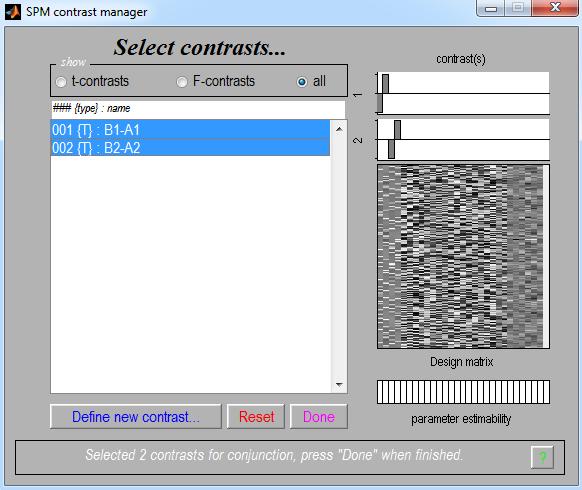
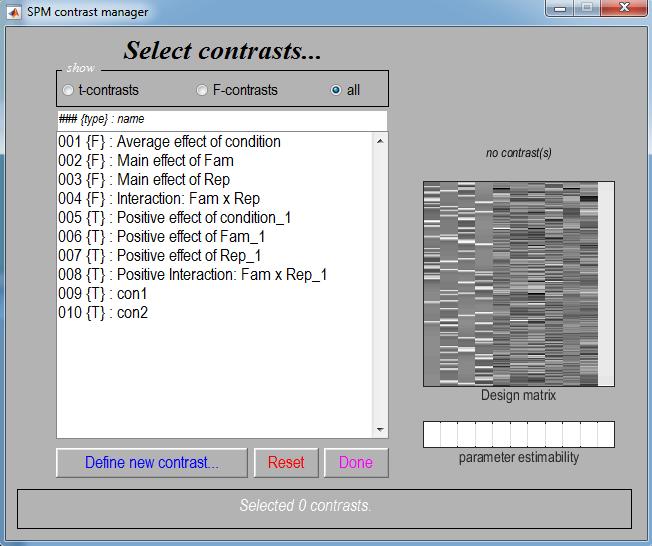
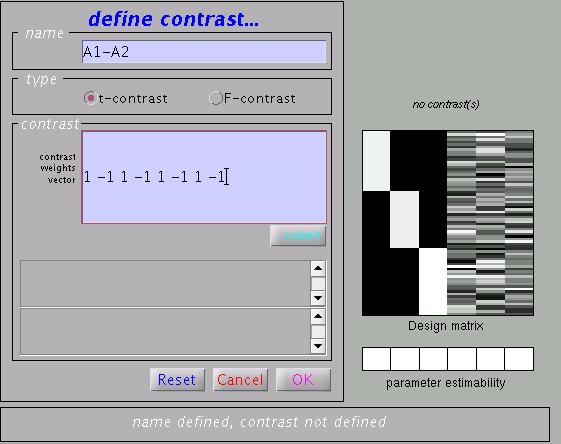
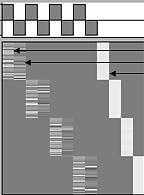
17 Conjunctions 18
18 Two types of conjunctions B1-B2 Test of global null hypothesis: Significant set of consistent effects Which voxels show effects of similar direction (but not necessarily individual significance) across contrasts? Null hypothesis: No contrast is significant: k = 0 does not correspond to a logical AND! Test of conjunction null hypothesis: Set of consistently significant effects Which voxels show, for each specified contrast, significant effects? Null hypothesis: Not all contrasts are significant: k < n corresponds to a logical AND p(a1-a2) < + + A1-A2 p(b1-b2) < Friston et al. (2005). Neuroimage, 25: Nichols et al. (2005). Neuroimage, 25:
19 Global null hypothesis based on the "minimum t statistic": imagine a voxel where contrast A gives t=1 and contrast B gives t=1.4 neither t-value is significant alone, but the fact that both values are larger than zero suggests that there may be a real effect test: compare the observed minimum t value to the null distribution of minimal t-values for a given set of contrasts assuming independence between the tests, one can find uncorrected and corrected thresholds for a minimum of two or more t-values (Worsley and Friston, 2000) this means the contrasts have to be orthogonal! Worsley &Friston (2000) Stat. Probab. Lett. 47 (2),
20 F-test vs. conjunction based on global null grey area: bivariate t-distriution under global null hypothesis Null hypothesis: No contrast is significant: k = 0 Friston et al. 2005, Neuroimage, 25:
21 Overview Categorical designs Subtraction - Pure insertion, evoked / differential responses Conjunction - Testing multiple hypotheses Parametric designs Linear - Adaptation, cognitive dimensions Nonlinear - Polynomial expansions, neurometric functions Factorial designs Categorical Parametric - Interactions and pure insertion - Linear and nonlinear interactions - Psychophysiological Interactions 24
22 Parametric designs Parametric designs approach the baseline problem by: Varying the stimulus-parameter of interest on a continuum, in multiple (n>2) steps and relating measured BOLD signal to this parameter Possible tests for such relations are manifold: Linear Nonlinear: Quadratic/cubic/etc. (polynomial expansion) Model-based (e.g. predictions from learning models) 25

23 Parametric modulation of regressors by time Büchel et al. 1998, NeuroImage 8:
24 User-specified parametric modulation of regressors Polynomial expansion & orthogonalisation Büchel et al. 1998, NeuroImage 8:

25 User-specified parametric modulation of regressors Büchel et al. 1998, NeuroImage 8:
26 Investigating neurometric functions (= relation between a stimulus property and the neuronal response) Pain threshold: 410 mj P0-P4: Variation of intensity of a laser stimulus applied to the right hand (0, 300, 400, 500, and 600 mj) Stimulus awareness Stimulus intensity Pain intensity P0 P1 P2 P3 P4 P0 P1 P2 P3 P4 P0 P1 P2 P3 P4 P0 P1 P2 P3 P4 Büchel et al. 2002, J. Neurosci. 22:


27 Neurometric functions Stimulus intensity dorsal pacc Stimulus awareness dorsal ACC Pain intensity ventral pacc Büchel et al. 2002, J. Neurosci. 22:
28 Model-based regressors general idea: generate predictions from a computational model, e.g. of learning or decision-making Commonly used models: Rescorla-Wagner learning model temporal difference (TD) learning model Bayesian models use these predictions to define regressors include these regressors in a GLM and test for significant correlations with voxel-wise BOLD responses 31
29 Model-based fmri analysis Gläscher & O Doherty 2010, WIREs Cogn. Sci. 32

30 Model-based fmri analysis 0 1 Gläscher & O Doherty 2010, WIREs Cogn. Sci. 33


31 Hierarchical prediction errors about sensory outcome and its probability p(f HT) or cue 300 ms prediction 800/1000/1200 ms time target 150/300 ms ITI 2000 ± 500 ms Trials Iglesias et al. 2013, Neuron 34
32 The Hierarchical Gaussian Filter (HGF) θ μ i π i 1 π i PE i 1 κ, ω (k 1) (k) x 3 x 3 p(x 3 (k) ) ~ N(x 3 (k-1),ϑ) ε 3 σ 3 (k) δ2 (k) x 2 (k 1) x 2 (k) p(x 2 (k) ) ~ N(x 2 (k-1), exp(κx 3 +ω)) ε 2 = σ 2 k δ 1 k x 1 (k 1) x 1 (k) p(x 1 =1) = s(x 2 ) Mathys et al. 2011, Front Hum Neurosci. 35
 ε 2 = σ 2 k δ 1 k ε 3 σ 3 (k) δ2 (k) p<0.")

33 Sensory prediction errors ε 2 in midbrain (N=45) ε 3 in basal forebrain (N=45) ε 2 = σ 2 k δ 1 k ε 3 σ 3 (k) δ2 (k) p<0.05, whole brain FWE corrected p<0.05, SVC FWE corrected p<0.05, SVC FWE corrected p<0.001, uncorrected Iglesias et al. 2013, Neuron 36
34 Overview Categorical designs Subtraction - Pure insertion, evoked / differential responses Conjunction - Testing multiple hypotheses Parametric designs Linear - Adaptation, cognitive dimensions Nonlinear - Polynomial expansions, neurometric functions Factorial designs Categorical Parametric - Interactions and pure insertion - Linear and nonlinear interactions - Psychophysiological Interactions 37
 Viewing Naming Main effect of task: (A1 + B1) (A2 + B2) Main")
 (A2")
35 Stimuli (A/B) Main effects and interactions Objects Colours Task (1/2) Viewing Naming Main effect of task: (A1 + B1) (A2 + B2) Main effect of stimuli: (A1 + A2) (B1 + B2) A1 B1 A2 B2 Interaction of task and stimuli: Can show a failure of pure insertion (A1 B1) (A2 B2) 38
 Viewing")
 (A2")
36 Stimuli (A/B) Factorial design Objects Colours Task (1/2) Viewing Naming A1 B1 A2 B2 A1 A2 B1 B2 Main effect of task: (A1 + B1) (A2 + B2) 39
 (B1 +")
37 Stimuli (A/B) Factorial design Objects Colours Task (1/2) Viewing Naming A1 B1 A2 B2 A1 A2 B1 B2 Main effect of stimuli: (A1 + A2) (B1 + B2) 40
 (A2 B2)")
38 Stimuli (A/B) Factorial design Objects Colours Task (1/2) Viewing Naming A1 B1 A2 B2 A1 A2 B1 B2 Interaction of task and stimuli: (A1 B1) (A2 B2) 41
39 Stimuli (A/B) Main effects and interactions Objects Colours Task (1/2) Viewing Naming Main effect of task: (A1 + B1) (A2 + B2) Main effect of stimuli: (A1 + A2) (B1 + B2) A1 B1 A2 B2 Interaction of task and stimuli: Can show a failure of pure insertion (A1 B1) (A2 B2) Is the inferotemporal region implicated in phonological retrieval during object naming? interaction effect (Stimuli x Task) Colours Objects Colours Objects Viewing Naming 42 42

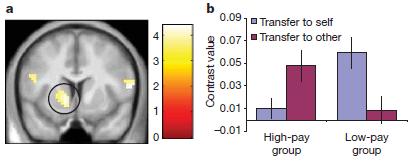
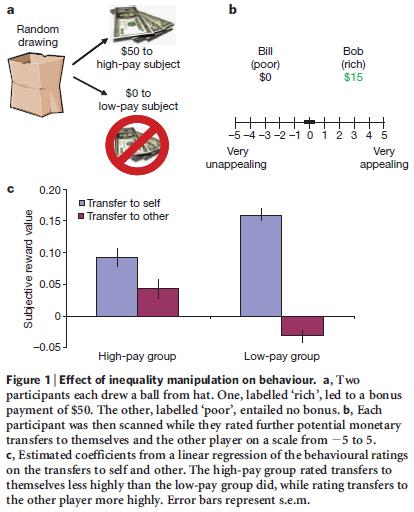
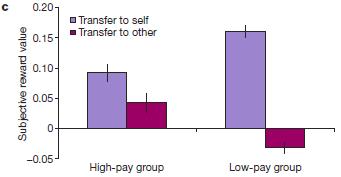
40 Example: evidence for inequality-aversion Tricomi et al. 2010, Nature 44
41 Stimulus factor Psycho-physiological interactions (PPI) Stim 1 Stim 2 Task factor GLM of a 2x2 factorial design: Task A Task B T A /S 1 T B /S 1 T A /S 2 T B /S 2 y ( T T ) 1 ( S ( T e A 1 A S T B 2 B ) β 2 ) ( S 1 S 2 ) β 3 main effect of task main effect of stim. type interaction We can replace one main effect in the GLM by the time series of an area that shows this main effect. E.g. let's replace the main effect of stimulus type by the time series of area V1: y V1β e ( T T ) 1 ( T A A 2 T B B ) V1β 3 main effect of task V1 time series main effect of stim. type psychophysiological interaction 45
42 Psycho-physiological interactions (PPI) cognitive process R1 R5 46

 - Motion")
43 Psycho-physiological interactions (PPI) Attention V1 V5 Radially moving dots Conditions: - Stationary - Motion and attention ( detect changes ) - Motion without attention 47

44 PPI example: attentional modulation of V1 V5 Attention V1 = V5 V1 x Att. V5 Friston et al. 1997, NeuroImage 6: Büchel & Friston 1997, Cereb. Cortex 7:

45 PPI: interpretation y ( T T ) 1 A V1β 2 B ( T e A T B attention ) V1β 3 Two possible interpretations of the PPI term: attention V1 V5 V1 V5 Modulation of V1 V5 by attention Modulation of the impact of attention on V5 by V1. 49
46 Questions? Categorical designs Subtraction - Pure insertion, evoked / differential responses Conjunction - Testing multiple hypotheses Parametric designs Linear - Adaptation, cognitive dimensions Nonlinear - Polynomial expansions, neurometric functions Factorial designs Categorical Parametric - Interactions and pure insertion - Linear and nonlinear interactions - Psychophysiological Interactions 50
Experimental design of fmri studies
 Experimental design of fmri studies Sandra Iglesias With many thanks for slides & images to: Klaas Enno Stephan, FIL Methods group, Christian Ruff SPM Course 2015 Overview of SPM Image time-series Kernel
Experimental design of fmri studies
 Experimental design of fmri studies Zurich SPM Course 2016 Sandra Iglesias Translational Neuromodeling Unit (TNU) Institute for Biomedical Engineering (IBT) University and ETH Zürich With many thanks for
Experimental design of fmri studies
 Methods & Models for fmri Analysis 2017 Experimental design of fmri studies Sara Tomiello With many thanks for slides & images to: Sandra Iglesias, Klaas Enno Stephan, FIL Methods group, Christian Ruff
Experimental design of fmri studies
 Experimental design of fmri studies Sandra Iglesias Translational Neuromodeling Unit University of Zurich & ETH Zurich With many thanks for slides & images to: Klaas Enno Stephan, FIL Methods group, Christian
Contents. design. Experimental design Introduction & recap Experimental design «Take home» message. N εˆ. DISCOS SPM course, CRC, Liège, 2009
 DISCOS SPM course, CRC, Liège, 2009 Contents Experimental design Introduction & recap Experimental design «Take home» message C. Phillips, Centre de Recherches du Cyclotron, ULg, Belgium Based on slides
Experimental Design. Rik Henson. With thanks to: Karl Friston, Andrew Holmes
 Experimental Design Rik Henson With thanks to: Karl Friston, Andrew Holmes Overview 1. A Taxonomy of Designs 2. Epoch vs Event-related 3. Mixed Epoch/Event Designs A taxonomy of design Categorical designs
Overview. Experimental Design. A categorical analysis. A taxonomy of design. A taxonomy of design. A taxonomy of design. 1. A Taxonomy of Designs
 Experimental Design Overview Rik Henson With thanks to: Karl Friston, Andrew Holmes 1. A Taxonomy of Designs 2. Epoch vs Event-related 3. Mixed Epoch/Event Designs designs designs - and nonlinear interactions
The General Linear Model (GLM)
") he General Linear Model (GLM) Klaas Enno Stephan ranslational Neuromodeling Unit (NU) Institute for Biomedical Engineering University of Zurich & EH Zurich Wellcome rust Centre for Neuroimaging Institute
he General Linear Model (GLM) Klaas Enno Stephan ranslational Neuromodeling Unit (NU) Institute for Biomedical Engineering University of Zurich & EH Zurich Wellcome rust Centre for Neuroimaging Institute
Effective Connectivity & Dynamic Causal Modelling
 Effective Connectivity & Dynamic Causal Modelling Hanneke den Ouden Donders Centre for Cognitive Neuroimaging Radboud University Nijmegen Advanced SPM course Zurich, Februari 13-14, 2014 Functional Specialisation
The General Linear Model. Guillaume Flandin Wellcome Trust Centre for Neuroimaging University College London
 The General Linear Model Guillaume Flandin Wellcome Trust Centre for Neuroimaging University College London SPM Course Lausanne, April 2012 Image time-series Spatial filter Design matrix Statistical Parametric
The General Linear Model Ivo Dinov
 Stats 33 Statistical Methods for Biomedical Data The General Linear Model Ivo Dinov dinov@stat.ucla.edu http://www.stat.ucla.edu/~dinov Slide 1 Problems with t-tests and correlations 1) How do we evaluate
The General Linear Model (GLM)
") The General Linear Model (GLM) Dr. Frederike Petzschner Translational Neuromodeling Unit (TNU) Institute for Biomedical Engineering, University of Zurich & ETH Zurich With many thanks for slides & images
The General Linear Model (GLM) Dr. Frederike Petzschner Translational Neuromodeling Unit (TNU) Institute for Biomedical Engineering, University of Zurich & ETH Zurich With many thanks for slides & images
Dynamic Causal Modelling for fmri
 Dynamic Causal Modelling for fmri André Marreiros Friday 22 nd Oct. 2 SPM fmri course Wellcome Trust Centre for Neuroimaging London Overview Brain connectivity: types & definitions Anatomical connectivity
Overview of SPM. Overview. Making the group inferences we want. Non-sphericity Beyond Ordinary Least Squares. Model estimation A word on power
 Group Inference, Non-sphericity & Covariance Components in SPM Alexa Morcom Edinburgh SPM course, April 011 Centre for Cognitive & Neural Systems/ Department of Psychology University of Edinburgh Overview
Modelling temporal structure (in noise and signal)
") Modelling temporal structure (in noise and signal) Mark Woolrich, Christian Beckmann*, Salima Makni & Steve Smith FMRIB, Oxford *Imperial/FMRIB temporal noise: modelling temporal autocorrelation temporal
Modelling temporal structure (in noise and signal) Mark Woolrich, Christian Beckmann*, Salima Makni & Steve Smith FMRIB, Oxford *Imperial/FMRIB temporal noise: modelling temporal autocorrelation temporal
Dynamic Causal Models
 Dynamic Causal Models V1 SPC Will Penny V1 SPC V5 V5 Olivier David, Karl Friston, Lee Harrison, Andrea Mechelli, Klaas Stephan Wellcome Department of Imaging Neuroscience, ION, UCL, UK. Mathematics in
Statistical Inference
 Statistical Inference J. Daunizeau Institute of Empirical Research in Economics, Zurich, Switzerland Brain and Spine Institute, Paris, France SPM Course Edinburgh, April 2011 Image time-series Spatial
Statistical Inference
 Statistical Inference Jean Daunizeau Wellcome rust Centre for Neuroimaging University College London SPM Course Edinburgh, April 2010 Image time-series Spatial filter Design matrix Statistical Parametric
Group Analysis. Lexicon. Hierarchical models Mixed effect models Random effect (RFX) models Components of variance
 models Components of variance") Group Analysis J. Daunizeau Institute of Empirical Research in Economics, Zurich, Switzerland Brain and Spine Institute, Paris, France SPM Course Edinburgh, April 2011 Image time-series Spatial filter
Group Analysis J. Daunizeau Institute of Empirical Research in Economics, Zurich, Switzerland Brain and Spine Institute, Paris, France SPM Course Edinburgh, April 2011 Image time-series Spatial filter
Group analysis. Jean Daunizeau Wellcome Trust Centre for Neuroimaging University College London. SPM Course Edinburgh, April 2010
 Group analysis Jean Daunizeau Wellcome Trust Centre for Neuroimaging University College London SPM Course Edinburgh, April 2010 Image time-series Spatial filter Design matrix Statistical Parametric Map
Event-related fmri. Christian Ruff. Laboratory for Social and Neural Systems Research Department of Economics University of Zurich
 Event-related fmri Christian Ruff Laboratory for Social and Neural Systems Research Department of Economics University of Zurich Institute of Neurology University College London With thanks to the FIL
Wellcome Trust Centre for Neuroimaging, UCL, UK.
 Bayesian Inference Will Penny Wellcome Trust Centre for Neuroimaging, UCL, UK. SPM Course, Virginia Tech, January 2012 What is Bayesian Inference? (From Daniel Wolpert) Bayesian segmentation and normalisation
Signal Processing for Functional Brain Imaging: General Linear Model (2)
") Signal Processing for Functional Brain Imaging: General Linear Model (2) Maria Giulia Preti, Dimitri Van De Ville Medical Image Processing Lab, EPFL/UniGE http://miplab.epfl.ch/teaching/micro-513/ March
Signal Processing for Functional Brain Imaging: General Linear Model (2) Maria Giulia Preti, Dimitri Van De Ville Medical Image Processing Lab, EPFL/UniGE http://miplab.epfl.ch/teaching/micro-513/ March
Bayesian inference J. Daunizeau
 Bayesian inference J. Daunizeau Brain and Spine Institute, Paris, France Wellcome Trust Centre for Neuroimaging, London, UK Overview of the talk 1 Probabilistic modelling and representation of uncertainty
Jean-Baptiste Poline
 Edinburgh course Avril 2010 Linear Models Contrasts Variance components Jean-Baptiste Poline Neurospin, I2BM, CEA Saclay, France Credits: Will Penny, G. Flandin, SPM course authors Outline Part I: Linear
Neuroimaging for Machine Learners Validation and inference
 GIGA in silico medicine, ULg, Belgium http://www.giga.ulg.ac.be Neuroimaging for Machine Learners Validation and inference Christophe Phillips, Ir. PhD. PRoNTo course June 2017 Univariate analysis: Introduction:
Statistical inference for MEG
 Statistical inference for MEG Vladimir Litvak Wellcome Trust Centre for Neuroimaging University College London, UK MEG-UK 2014 educational day Talk aims Show main ideas of common methods Explain some of
Contents. Introduction The General Linear Model. General Linear Linear Model Model. The General Linear Model, Part I. «Take home» message
 DISCOS SPM course, CRC, Liège, 2009 Contents The General Linear Model, Part I Introduction The General Linear Model Data & model Design matrix Parameter estimates & interpretation Simple contrast «Take
Bayesian inference J. Daunizeau
 Bayesian inference J. Daunizeau Brain and Spine Institute, Paris, France Wellcome Trust Centre for Neuroimaging, London, UK Overview of the talk 1 Probabilistic modelling and representation of uncertainty
HGF Workshop. Christoph Mathys. Wellcome Trust Centre for Neuroimaging at UCL, Max Planck UCL Centre for Computational Psychiatry and Ageing Research
 HGF Workshop Christoph Mathys Wellcome Trust Centre for Neuroimaging at UCL, Max Planck UCL Centre for Computational Psychiatry and Ageing Research Monash University, March 3, 2015 Systems theory places
Extracting fmri features
 Extracting fmri features PRoNTo course May 2018 Christophe Phillips, GIGA Institute, ULiège, Belgium c.phillips@uliege.be - http://www.giga.ulg.ac.be Overview Introduction Brain decoding problem Subject
Uncertainty, precision, prediction errors and their relevance to computational psychiatry
 Uncertainty, precision, prediction errors and their relevance to computational psychiatry Christoph Mathys Wellcome Trust Centre for Neuroimaging at UCL, London, UK Max Planck UCL Centre for Computational
Models of effective connectivity & Dynamic Causal Modelling (DCM)
") Models of effective connectivit & Dnamic Causal Modelling (DCM Presented b: Ariana Anderson Slides shared b: Karl Friston Functional Imaging Laborator (FIL Wellcome Trust Centre for Neuroimaging Universit
Models of effective connectivit & Dnamic Causal Modelling (DCM Presented b: Ariana Anderson Slides shared b: Karl Friston Functional Imaging Laborator (FIL Wellcome Trust Centre for Neuroimaging Universit
MIXED EFFECTS MODELS FOR TIME SERIES
 Outline MIXED EFFECTS MODELS FOR TIME SERIES Cristina Gorrostieta Hakmook Kang Hernando Ombao Brown University Biostatistics Section February 16, 2011 Outline OUTLINE OF TALK 1 SCIENTIFIC MOTIVATION 2
A test for a conjunction
 A test for a conjunction K.J. Worsley a,, K.J. Friston b a Department of Mathematics and Statistics, McGill University, Montreal, Canada H3A 2K6 b Wellcome Department of Cognitive Neurology, Institute
Dynamic Causal Modelling for EEG/MEG: principles J. Daunizeau
 Dynamic Causal Modelling for EEG/MEG: principles J. Daunizeau Motivation, Brain and Behaviour group, ICM, Paris, France Overview 1 DCM: introduction 2 Dynamical systems theory 3 Neural states dynamics
Bayesian Inference. Chris Mathys Wellcome Trust Centre for Neuroimaging UCL. London SPM Course
 Bayesian Inference Chris Mathys Wellcome Trust Centre for Neuroimaging UCL London SPM Course Thanks to Jean Daunizeau and Jérémie Mattout for previous versions of this talk A spectacular piece of information
The Bayesian Brain. Robert Jacobs Department of Brain & Cognitive Sciences University of Rochester. May 11, 2017
 The Bayesian Brain Robert Jacobs Department of Brain & Cognitive Sciences University of Rochester May 11, 2017 Bayesian Brain How do neurons represent the states of the world? How do neurons represent
An introduction to Bayesian inference and model comparison J. Daunizeau
 An introduction to Bayesian inference and model comparison J. Daunizeau ICM, Paris, France TNU, Zurich, Switzerland Overview of the talk An introduction to probabilistic modelling Bayesian model comparison
Revealing Interactions Among Brain Systems With Nonlinear PCA
 Human Brain Mapping 8:92 97(1999) Revealing Interactions Among Brain Systems With Nonlinear PCA Karl Friston,* Jacquie Phillips, Dave Chawla, and Christian Büchel The Wellcome Department of Cognitive Neurology,
Models of effective connectivity & Dynamic Causal Modelling (DCM)
") Models of effective connectivit & Dnamic Causal Modelling (DCM) Slides obtained from: Karl Friston Functional Imaging Laborator (FIL) Wellcome Trust Centre for Neuroimaging Universit College London Klaas
Models of effective connectivit & Dnamic Causal Modelling (DCM) Slides obtained from: Karl Friston Functional Imaging Laborator (FIL) Wellcome Trust Centre for Neuroimaging Universit College London Klaas
Bayesian Inference. Will Penny. 24th February Bayesian Inference. Will Penny. Bayesian Inference. References
 24th February 2011 Given probabilities p(a), p(b), and the joint probability p(a, B), we can write the conditional probabilities p(b A) = p(a B) = p(a, B) p(a) p(a, B) p(b) Eliminating p(a, B) gives p(b
Data Analysis I: Single Subject
 Data Analysis I: Single Subject ON OFF he General Linear Model (GLM) y= X fmri Signal = Design Matrix our data = what we CAN explain x β x Betas + + how much x of it we CAN + explain ε Residuals what
Bayesian modeling of learning and decision-making in uncertain environments
 Bayesian modeling of learning and decision-making in uncertain environments Christoph Mathys Max Planck UCL Centre for Computational Psychiatry and Ageing Research, London, UK Wellcome Trust Centre for
Bayesian Analysis. Bayesian Analysis: Bayesian methods concern one s belief about θ. [Current Belief (Posterior)] (Prior Belief) x (Data) Outline
![Bayesian Analysis. Bayesian Analysis: Bayesian methods concern one s belief about θ. [Current Belief (Posterior)] (Prior Belief) x (Data) Outline](/thumbs/87/97378301.jpg "Bayesian Analysis. Bayesian Analysis: Bayesian methods concern one s belief about θ. [Current Belief (Posterior)] (Prior Belief) x (Data) Outline") Bayesian Analysis DuBois Bowman, Ph.D. Gordana Derado, M. S. Shuo Chen, M. S. Department of Biostatistics and Bioinformatics Center for Biomedical Imaging Statistics Emory University Outline I. Introduction
Bayesian Analysis DuBois Bowman, Ph.D. Gordana Derado, M. S. Shuo Chen, M. S. Department of Biostatistics and Bioinformatics Center for Biomedical Imaging Statistics Emory University Outline I. Introduction
Detecting fmri activation allowing for unknown latency of the hemodynamic response
 Detecting fmri activation allowing for unknown latency of the hemodynamic response K.J. Worsley McGill University J.E. Taylor Stanford University January 7, 006 Abstract Several authors have suggested
Supplementary Information. Brain networks involved in tactile speed classification of moving dot patterns: the. effects of speed and dot periodicity
 Supplementary Information Brain networks involved in tactile speed classification of moving dot patterns: the effects of speed and dot periodicity Jiajia Yang, Ryo Kitada *, Takanori Kochiyama, Yinghua
Beyond Univariate Analyses: Multivariate Modeling of Functional Neuroimaging Data
 Beyond Univariate Analyses: Multivariate Modeling of Functional Neuroimaging Data F. DuBois Bowman Department of Biostatistics and Bioinformatics Center for Biomedical Imaging Statistics Emory University,
Hierarchy. Will Penny. 24th March Hierarchy. Will Penny. Linear Models. Convergence. Nonlinear Models. References
 24th March 2011 Update Hierarchical Model Rao and Ballard (1999) presented a hierarchical model of visual cortex to show how classical and extra-classical Receptive Field (RF) effects could be explained
ROI analysis of pharmafmri data: an adaptive approach for global testing
 ROI analysis of pharmafmri data: an adaptive approach for global testing Giorgos Minas, John A.D. Aston, Thomas E. Nichols and Nigel Stallard Abstract Pharmacological fmri (pharmafmri) is a new highly
Model Comparison. Course on Bayesian Inference, WTCN, UCL, February Model Comparison. Bayes rule for models. Linear Models. AIC and BIC.
 Course on Bayesian Inference, WTCN, UCL, February 2013 A prior distribution over model space p(m) (or hypothesis space ) can be updated to a posterior distribution after observing data y. This is implemented
Morphometry. John Ashburner. Wellcome Trust Centre for Neuroimaging, 12 Queen Square, London, UK.
 Morphometry John Ashburner Wellcome Trust Centre for Neuroimaging, 12 Queen Square, London, UK. Morphometry is defined as: Measurement of the form of organisms or of their parts. The American Heritage
Decoding Cognitive Processes from Functional MRI
 Decoding Cognitive Processes from Functional MRI Oluwasanmi Koyejo 1 and Russell A. Poldrack 2 1 Imaging Research Center, University of Texas at Austin sanmi.k@utexas.edu 2 Depts. of Psychology and Neuroscience,
Causal modeling of fmri: temporal precedence and spatial exploration
 Causal modeling of fmri: temporal precedence and spatial exploration Alard Roebroeck Maastricht Brain Imaging Center (MBIC) Faculty of Psychology & Neuroscience Maastricht University Intro: What is Brain
+ + ( + ) = Linear recurrent networks. Simpler, much more amenable to analytic treatment E.g. by choosing
 = Linear recurrent networks. Simpler, much more amenable to analytic treatment E.g. by choosing") Linear recurrent networks Simpler, much more amenable to analytic treatment E.g. by choosing + ( + ) = Firing rates can be negative Approximates dynamics around fixed point Approximation often reasonable
Linear recurrent networks Simpler, much more amenable to analytic treatment E.g. by choosing + ( + ) = Firing rates can be negative Approximates dynamics around fixed point Approximation often reasonable
A Multivariate Time-Frequency Based Phase Synchrony Measure for Quantifying Functional Connectivity in the Brain
 A Multivariate Time-Frequency Based Phase Synchrony Measure for Quantifying Functional Connectivity in the Brain Dr. Ali Yener Mutlu Department of Electrical and Electronics Engineering, Izmir Katip Celebi
Anatomical Background of Dynamic Causal Modeling and Effective Connectivity Analyses
 Anatomical Background of Dynamic Causal Modeling and Effective Connectivity Analyses Jakob Heinzle Translational Neuromodeling Unit (TNU), Institute for Biomedical Engineering University and ETH Zürich
Hierarchical Dirichlet Processes with Random Effects
 Hierarchical Dirichlet Processes with Random Effects Seyoung Kim Department of Computer Science University of California, Irvine Irvine, CA 92697-34 sykim@ics.uci.edu Padhraic Smyth Department of Computer
Dynamic causal modeling for fmri
 Dynamic causal modeling for fmri Methods and Models for fmri, HS 2016 Jakob Heinzle Structural, functional & effective connectivity Sporns 2007, Scholarpedia anatomical/structural connectivity - presence
Decoding conceptual representations
 Decoding conceptual representations!!!! Marcel van Gerven! Computational Cognitive Neuroscience Lab (www.ccnlab.net) Artificial Intelligence Department Donders Centre for Cognition Donders Institute for
Semi-supervised subspace analysis of human functional magnetic resonance imaging data
 Max Planck Institut für biologische Kybernetik Max Planck Institute for Biological Cybernetics Technical Report No. 185 Semi-supervised subspace analysis of human functional magnetic resonance imaging
A. Motivation To motivate the analysis of variance framework, we consider the following example.
 9.07 ntroduction to Statistics for Brain and Cognitive Sciences Emery N. Brown Lecture 14: Analysis of Variance. Objectives Understand analysis of variance as a special case of the linear model. Understand
Optimization of Designs for fmri
 Optimization of Designs for fmri UCLA Advanced Neuroimaging Summer School August 2, 2007 Thomas Liu, Ph.D. UCSD Center for Functional MRI Why optimize? Scans are expensive. Subjects can be difficult to
Dynamic Causal Modelling for evoked responses J. Daunizeau
 Dynamic Causal Modelling for evoked responses J. Daunizeau Institute for Empirical Research in Economics, Zurich, Switzerland Brain and Spine Institute, Paris, France Overview 1 DCM: introduction 2 Neural
Piotr Majer Risk Patterns and Correlated Brain Activities
 Alena My²i ková Piotr Majer Song Song Alena Myšičková Peter N. C. Mohr Peter N. C. Mohr Wolfgang K. Härdle Song Song Hauke R. Heekeren Wolfgang K. Härdle Hauke R. Heekeren C.A.S.E. Centre C.A.S.E. for
Dynamic causal modeling for fmri
 Dynamic causal modeling for fmri Methods and Models for fmri, HS 2015 Jakob Heinzle Structural, functional & effective connectivity Sporns 2007, Scholarpedia anatomical/structural connectivity - presence
Lateral organization & computation
 Lateral organization & computation review Population encoding & decoding lateral organization Efficient representations that reduce or exploit redundancy Fixation task 1rst order Retinotopic maps Log-polar
NeuroImage. Modeling the hemodynamic response function in fmri: Efficiency, bias and mis-modeling
 NeuroImage 45 (2009) S187 S198 Contents lists available at ScienceDirect NeuroImage journal homepage: www. elsevier. com/ locate/ yni mg Modeling the hemodynamic response function in fmri: Efficiency,
Stochastic Dynamic Causal Modelling for resting-state fmri
 Stochastic Dynamic Causal Modelling for resting-state fmri Ged Ridgway, FIL, Wellcome Trust Centre for Neuroimaging, UCL Institute of Neurology, London Overview Connectivity in the brain Introduction to
Morphometrics with SPM12
 Morphometrics with SPM12 John Ashburner Wellcome Trust Centre for Neuroimaging, 12 Queen Square, London, UK. What kind of differences are we looking for? Usually, we try to localise regions of difference.
Statistical Analysis of fmrl Data
 Statistical Analysis of fmrl Data F. Gregory Ashby The MIT Press Cambridge, Massachusetts London, England Preface xi Acronyms xv 1 Introduction 1 What Is fmri? 2 The Scanning Session 4 Experimental Design
COMP304 Introduction to Neural Networks based on slides by:
 COMP34 Introduction to Neural Networks based on slides by: Christian Borgelt http://www.borgelt.net/ Christian Borgelt Introduction to Neural Networks Motivation: Why (Artificial) Neural Networks? (Neuro-)Biology
Statistical Analysis Aspects of Resting State Functional Connectivity
 Statistical Analysis Aspects of Resting State Functional Connectivity Biswal s result (1995) Correlations between RS Fluctuations of left and right motor areas Why studying resting state? Human Brain =
Bayesian Treatments of. Neuroimaging Data Will Penny and Karl Friston. 5.1 Introduction
 Bayesian Treatments of 5 Neuroimaging Data Will Penny and Karl Friston 5.1 Introduction In this chapter we discuss the application of Bayesian methods to neuroimaging data. This includes data from positron
Dynamic Causal Modelling for EEG and MEG
 Dynamic Causal Modelling for EEG and MEG Stefan Kiebel Ma Planck Institute for Human Cognitive and Brain Sciences Leipzig, Germany Overview 1 M/EEG analysis 2 Dynamic Causal Modelling Motivation 3 Dynamic
Fundamentals of Computational Neuroscience 2e
 Fundamentals of Computational Neuroscience 2e January 1, 2010 Chapter 10: The cognitive brain Hierarchical maps and attentive vision A. Ventral visual pathway B. Layered cortical maps Receptive field size
First Technical Course, European Centre for Soft Computing, Mieres, Spain. 4th July 2011
 First Technical Course, European Centre for Soft Computing, Mieres, Spain. 4th July 2011 Linear Given probabilities p(a), p(b), and the joint probability p(a, B), we can write the conditional probabilities
Transformation of stimulus correlations by the retina
 Transformation of stimulus correlations by the retina Kristina Simmons (University of Pennsylvania) and Jason Prentice, (now Princeton University) with Gasper Tkacik (IST Austria) Jan Homann (now Princeton
Functional Connectivity and Network Methods
 18/Sep/2013" Functional Connectivity and Network Methods with functional magnetic resonance imaging" Enrico Glerean (MSc), Brain & Mind Lab, BECS, Aalto University" www.glerean.com @eglerean becs.aalto.fi/bml
Searchlight-based multi-voxel pattern analysis of fmri by cross-validated MANOVA
 Searchlight-based multi-voxel pattern analysis of fmri by cross-validated MANOVA arxiv:1401.4122v2 [q-bio.nc] 7 Feb 2014 Carsten Allefeldˆ1,2*ˆ; John-Dylan Haynesˆ1 6**ˆ Affiliations: 1. Bernstein Center
A prior distribution over model space p(m) (or hypothesis space ) can be updated to a posterior distribution after observing data y.
 (or hypothesis space ) can be updated to a posterior distribution after observing data y.") June 2nd 2011 A prior distribution over model space p(m) (or hypothesis space ) can be updated to a posterior distribution after observing data y. This is implemented using Bayes rule p(m y) = p(y m)p(m)
June 2nd 2011 A prior distribution over model space p(m) (or hypothesis space ) can be updated to a posterior distribution after observing data y. This is implemented using Bayes rule p(m y) = p(y m)p(m)
Model-free Functional Data Analysis
 Model-free Functional Data Analysis MELODIC Multivariate Exploratory Linear Optimised Decomposition into Independent Components decomposes data into a set of statistically independent spatial component
Mixed effects and Group Modeling for fmri data
 Mixed effects and Group Modeling for fmri data Thomas Nichols, Ph.D. Department of Statistics Warwick Manufacturing Group University of Warwick Warwick fmri Reading Group May 19, 2010 1 Outline Mixed effects
Peak Detection for Images
 Peak Detection for Images Armin Schwartzman Division of Biostatistics, UC San Diego June 016 Overview How can we improve detection power? Use a less conservative error criterion Take advantage of prior
CHARACTERIZATION OF NONLINEAR NEURON RESPONSES
 CHARACTERIZATION OF NONLINEAR NEURON RESPONSES Matt Whiteway whit8022@umd.edu Dr. Daniel A. Butts dab@umd.edu Neuroscience and Cognitive Science (NACS) Applied Mathematics and Scientific Computation (AMSC)
Every animal is represented by a blue circle. Correlation was measured by Spearman s rank correlation coefficient (ρ).
.") Supplementary Figure 1 Correlations between tone and context freezing by animal in each of the four groups in experiment 1. Every animal is represented by a blue circle. Correlation was measured by Spearman
Supplementary Figure 1 Correlations between tone and context freezing by animal in each of the four groups in experiment 1. Every animal is represented by a blue circle. Correlation was measured by Spearman
M/EEG source analysis
 Jérémie Mattout Lyon Neuroscience Research Center Will it ever happen that mathematicians will know enough about the physiology of the brain, and neurophysiologists enough of mathematical discovery, for
Dynamic Causal Modelling for EEG and MEG. Stefan Kiebel
 Dynamic Causal Modelling for EEG and MEG Stefan Kiebel Overview 1 M/EEG analysis 2 Dynamic Causal Modelling Motivation 3 Dynamic Causal Modelling Generative model 4 Bayesian inference 5 Applications Overview
Continuous Time Particle Filtering for fmri
 Continuous Time Particle Filtering for fmri Lawrence Murray School of Informatics University of Edinburgh lawrence.murray@ed.ac.uk Amos Storkey School of Informatics University of Edinburgh a.storkey@ed.ac.uk
Motion Perception 1. PSY305 Lecture 12 JV Stone
 Motion Perception 1 PSY305 Lecture 12 JV Stone 1 Structure Human visual system as a band-pass filter. Neuronal motion detection, the Reichardt detector. The aperture problem. 2 The visual system is a temporal
Dynamic causal models of brain responses
 Okinawa Computational Neuroscience Course; Thurs 13 th Nov. 2004 Dynamic causal models of brain responses Klaas E. Stephan, Lee M. Harrison, Will D. Penny, Karl J. Friston The Wellcome Dept. of Imaging
Chapter 9: The Perceptron
 Chapter 9: The Perceptron 9.1 INTRODUCTION At this point in the book, we have completed all of the exercises that we are going to do with the James program. These exercises have shown that distributed
New Procedures for False Discovery Control
 New Procedures for False Discovery Control Christopher R. Genovese Department of Statistics Carnegie Mellon University http://www.stat.cmu.edu/ ~ genovese/ Elisha Merriam Department of Neuroscience University
Latent state estimation using control theory
 Latent state estimation using control theory Bert Kappen SNN Donders Institute, Radboud University, Nijmegen Gatsby Unit, UCL London August 3, 7 with Hans Christian Ruiz Bert Kappen Smoothing problem Given
Machine learning strategies for fmri analysis
 Machine learning strategies for fmri analysis DTU Informatics Technical University of Denmark Co-workers: Morten Mørup, Kristoffer Madsen, Peter Mondrup, Daniel Jacobsen, Stephen Strother,. OUTLINE Do
CHARACTERIZATION OF NONLINEAR NEURON RESPONSES
 CHARACTERIZATION OF NONLINEAR NEURON RESPONSES Matt Whiteway whit8022@umd.edu Dr. Daniel A. Butts dab@umd.edu Neuroscience and Cognitive Science (NACS) Applied Mathematics and Scientific Computation (AMSC)
THE ROYAL STATISTICAL SOCIETY 2008 EXAMINATIONS SOLUTIONS HIGHER CERTIFICATE (MODULAR FORMAT) MODULE 4 LINEAR MODELS
 MODULE 4 LINEAR MODELS") THE ROYAL STATISTICAL SOCIETY 008 EXAMINATIONS SOLUTIONS HIGHER CERTIFICATE (MODULAR FORMAT) MODULE 4 LINEAR MODELS The Society provides these solutions to assist candidates preparing for the examinations
THE ROYAL STATISTICAL SOCIETY 008 EXAMINATIONS SOLUTIONS HIGHER CERTIFICATE (MODULAR FORMAT) MODULE 4 LINEAR MODELS The Society provides these solutions to assist candidates preparing for the examinations
FIL. Event-related. fmri. Rik Henson. With thanks to: Karl Friston, Oliver Josephs
 Event-related fmri Rik Henson With thanks to: Karl Friston, Oliver Josephs Overview 1. BOLD impulse response 2. General Linear Model 3. Temporal Basis Functions 4. Timing Issues 5. Design Optimisation
Model- based fmri analysis. Shih- Wei Wu fmri workshop, NCCU, Jan. 19, 2014
 Model- based fmri analysis Shih- Wei Wu fmri workshop, NCCU, Jan. 19, 2014 Outline: model- based fmri analysis I: General linear model: basic concepts II: Modeling how the brain makes decisions: Decision-
Computational Brain Anatomy
 Computational Brain Anatomy John Ashburner Wellcome Trust Centre for Neuroimaging, 12 Queen Square, London, UK. Overview Voxel-Based Morphometry Morphometry in general Volumetrics VBM preprocessing followed