Peak Detection for Images
|
|
|
- Russell Ross
- 6 years ago
- Views:
Transcription


1 Peak Detection for Images Armin Schwartzman Division of Biostatistics, UC San Diego June 016
2 Overview How can we improve detection power? Use a less conservative error criterion Take advantage of prior knowledge on the signal How do we know the algorithm works? Show theoretical error control and power consistency Show practical error control and power consistency simulations /39
3 Error Criteria in Multiple Testing Family-wise error rate FWER: Prob. of getting at least one false positive Computed under the complete null hypothesis of no signal anywhere Does not consider the signal False discovery rate FDR: Expected proportion of false positives among positives Benjamini and Hochberg Computed under the actual distribution of the data, including the signal 3/39
4 False Discovery Rate FDR False discovery proportion FDP Proportion of false discoveries: FDP = V maxr,1 False discovery rate FDR # false discoveries # discoveries Expected false discovery proportion: FDR = E maxr,1 V [ FDP] = E 4/39
5 Benjamini-Hochberg Procedure The BH procedure: Given m ordered p-values p 1 < < p m Reject the first k null hypotheses where k mpi = max i : < α i Theorem: If the p-values are independent or weakly positively dependent then m0 FDR m α α 5/39
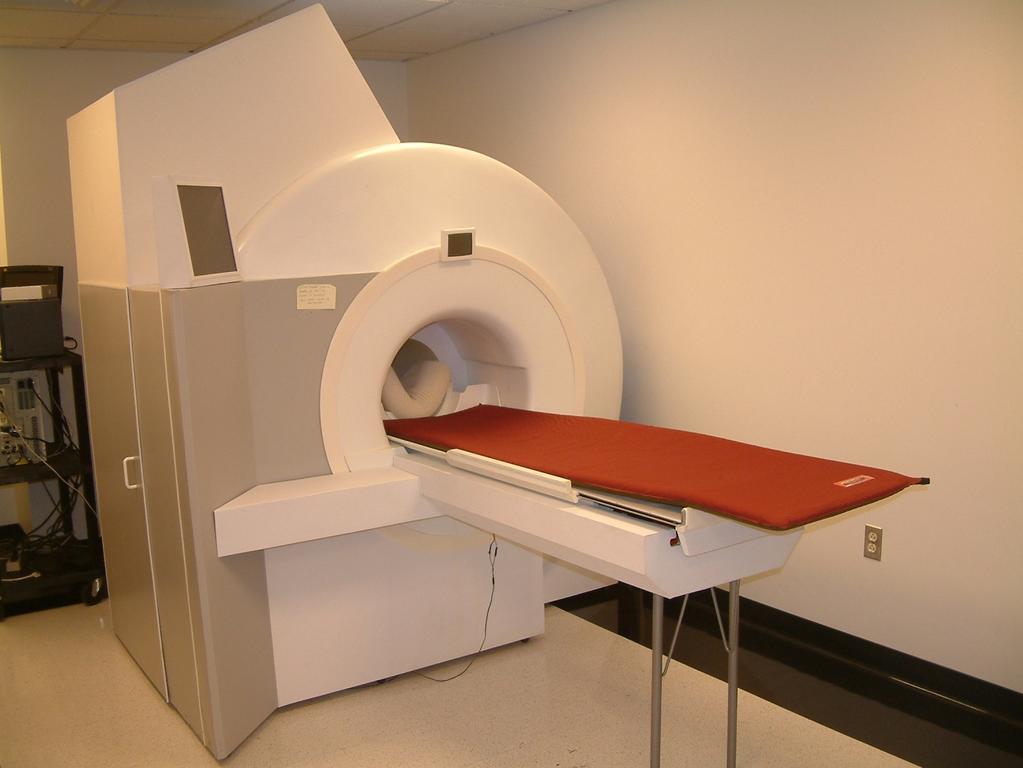
6 Fluorescence Nanoscopy 1 μm Courtesy: Alex Egner, Gottingen 6/33

7 Background Adjusted 1 μm 7/33

8 Pixelwise BH 1 μm 8/33
9 Kernel Smoothing 1 μm =1 m ~ = 338 Local maxima 9/33
10 STEM Algorithm BH 1 μm FDR Level α = Intensity Threshold R = 3 Sig. peaks 10/33


11 Inference for Images Approach Image Processing Statistical Control Familywise Error Rate FWER Control False Discovery Rate FDR Regularized estimation Widely used in neuroimaging Random field theory Widely used in genomics Less conservative Sparse estimates Dimension reduction Peak detection Inference at level of regions Too conservative false negatives Discrete tests Inference about voxels Driven by fit, not error control Threshold is often heuristic 11/39

12 Statistical Peak Detection Yields inference about spatial clusters, not voxels: 1/39

13 Statistical Peak Detection Significant clusters correspond to significant local maxima or minima 13/39
14 N-Dimensional Model Signal: unimodal peaks µ t J = a jh j j= 1 t, h t dt = 1, t [ 0, L] N j L = 00 h = Gaussian J = 6 14/39
15 N-Dimensional Model Add stationary ergodic Gaussian noise 0, y t = µ t + z t, z t ~ N σ E [ z t z t + s ] = c s σ = 1 cs = Gaussian 15/39

16 Pointwise Multiple Testing Every pixel has a p-value Number of tests is fixed = L Benjamini- Hochberg BH FDR Level α = 0.1 m = 4 10 tests 4 16/39
17 FWER Using the Supremum FWER = Prob. supremum exceeds thresh. Expected Euler Characteristic FWER Level α = /39
18 Pointwise Thresholding Every pixel has a p-value Number of tests is fixed = L FDR Level α = 0.1 m = 4 10 tests 4 18/39
19 The STEM Algorithm 1. Smooth with a unimodal kernel. Find all the local maxima 3. Compute the p-value of each local maximum 4. Correct for multiple testing STEM = Smooth and TEst Maxima 19/39

20 1. Kernel Smoothing Unimodal kernel best if same as signal = = = t w t w ds s y s t w t y t w t x N 1, = 6 0/39

21 1. Kernel Smoothing Unimodal kernel best if same as signal = = = t w t w ds s y s t w t y t w t x N 1, = 6 1/39
22 1. Kernel Smoothing Unimodal kernel best if same as signal = = = t w t w ds s y s t w t y t w t x N 1, = 6 /39
![. Find Local Maxima Local maxima are candidate peaks ~ = T { t [ 0, L]](/docs-images/72/66691857/images/23-0.jpg ": x t 0, x t 0} N = Dimension reduction! L = 4 10 4 ~ = 56 m Random!")
23 . Find Local Maxima Local maxima are candidate peaks ~ = T { t [ 0, L] : x t 0, x t 0} N = Dimension reduction! L = ~ = 56 m Random! 3/39
24 3. Compute p-values Test at each local maximum the hypothesis H t : µ t = 0 vs. H t : µ t > 0, t T 0 A Define the distribution of the height of a local max. under the complete null hypothesis μt 0 ~ [ z t u is local max] F u P > t = Palm distribution For each observed local maximum, its p-value is computed as p t F x t = ~ [ ], t T 4/39
25 Isotropic Gaussian Fields In the case N =, the density of the height of a local maximum is In practice, κ is estimated from the data. Φ + + Φ = κ κ σ κ κ σ ϕ κ σ κ σ ϕ κ πσ κ κ σ κ σ ϕ σ σ κ u u u u u u u u f 5/39

26 4. Multiple Testing Get threshold for p-values Number of tests is random! Benjamini- Hochberg BH Level α = 0.1 ~ = 56 m tests 6/39
27 4. Multiple Testing Get threshold for p-values Number of tests is random! Benjamini- Hochberg BH Level α = 0.1 ~ = 56 m tests 7/39
28 The problem: Summary So Far Find local significant regions in continuous domains What we have: Test local maxima after smoothing STEM What we are still missing: Distribution of local maxima Theoretical justification Simulations Data example 8/39
29 Theory: Assumptions True peaks are unimodal, finite support twice-differentiable after kernel smoothing Noise is Gaussian stationary ergodic trice-differentiable after kernel smoothing Kernel is unimodal, finite support 9/39
30 Theory: Error Definitions FDR = Expected fraction of false positive local max. among sig. local max. True peak Power = Expected fraction of detected peaks Smoothed peak False discovery True discovery False discovery 30/39
31 Theory: Main Result Let L, a = inf j a j, log L/a 0 # peaks Signal volume J / L N = A 1 + Oa -, 0 < A 1. S 1 / L N = A + Oa -, 0 < A < 1. Let u BH be the BH threshold at level α. 1. FDR u BH α + O p L N Error control + Op a. Power u BH 1 O p a Consistency In repeated samples: a = n so a = n. 31/39
32 L = 00 Simulation: Setup J = 9 peaks, regularly spaced h b t is isotropic Gaussian kernel with std. dev. b = 3, truncated at ±b zt is zero-mean Gaussian noise, Gaussian isotropic autocorrelation function with bandwidth ν = 1,, 3 Smoothing Gaussian kernel w t = h t,000 repetitions 3/39
33 Simulation: Performance ν = 0 ν = 1 ν = FDR a = 30 a = 40 Power a = 50 33/3
34 Optimal Bandwidth How to choose the kernel bandwidth? Small : High noise variance Large : low signal Optimal bandwidth maximizes SNR: arg max Power u arg max P [ x τ > u] arg max h σ 0 Gaussian peaks, Gaussian ACF, Gaussian kernel, std. dev. std. dev. std. dev. b ν opt = b ν 34/39
35 Functional MRI fmri 35/33


36 fmri Experiment: Social Thinking time off on off on off Social Social Nonsocial Nonsocial Nonsocial on Social Where in the brain is social information processed? Find differences between on and off states Moran et al. 009, OpenfMRI.org 36/33
37 Data: fmri: Voxelwise Analysis 71 ˣ 7 ˣ 36 ˣ 179 array Space Time At each voxel s: 1. Fit a linear model: Time Y s = Xβ s + ε s ˆ β s = X T X 1 X T Y s Obs. Stimulus. Compute a test statistic: ~ β s = se ˆ β s [ ˆ ] β s 37/33

38 STEM Algorithm BH =1.6 ~ = 334 m Local maxima FDR Level α = 0.05 R = 55 Sig. peaks 38/33
39 The problem: Summary Find local significant regions in continuous domains What we did: Test local maxima after smoothing STEM Algorithm searches for peaks and measures error in terms of peaks Conclusion: Inference should be about the right features 39/39
Neuroimaging for Machine Learners Validation and inference
 GIGA in silico medicine, ULg, Belgium http://www.giga.ulg.ac.be Neuroimaging for Machine Learners Validation and inference Christophe Phillips, Ir. PhD. PRoNTo course June 2017 Univariate analysis: Introduction:
The General Linear Model. Guillaume Flandin Wellcome Trust Centre for Neuroimaging University College London
 The General Linear Model Guillaume Flandin Wellcome Trust Centre for Neuroimaging University College London SPM Course Lausanne, April 2012 Image time-series Spatial filter Design matrix Statistical Parametric
New Procedures for False Discovery Control
 New Procedures for False Discovery Control Christopher R. Genovese Department of Statistics Carnegie Mellon University http://www.stat.cmu.edu/ ~ genovese/ Elisha Merriam Department of Neuroscience University
Lecture 7 April 16, 2018
 Stats 300C: Theory of Statistics Spring 2018 Lecture 7 April 16, 2018 Prof. Emmanuel Candes Scribe: Feng Ruan; Edited by: Rina Friedberg, Junjie Zhu 1 Outline Agenda: 1. False Discovery Rate (FDR) 2. Properties
False Discovery Control in Spatial Multiple Testing
 False Discovery Control in Spatial Multiple Testing WSun 1,BReich 2,TCai 3, M Guindani 4, and A. Schwartzman 2 WNAR, June, 2012 1 University of Southern California 2 North Carolina State University 3 University
Looking at the Other Side of Bonferroni
 Department of Biostatistics University of Washington 24 May 2012 Multiple Testing: Control the Type I Error Rate When analyzing genetic data, one will commonly perform over 1 million (and growing) hypothesis
Lecture 28. Ingo Ruczinski. December 3, Department of Biostatistics Johns Hopkins Bloomberg School of Public Health Johns Hopkins University
 Lecture 28 Department of Biostatistics Johns Hopkins Bloomberg School of Public Health Johns Hopkins University December 3, 2015 1 2 3 4 5 1 Familywise error rates 2 procedure 3 Performance of with multiple
Statistical Inference
 Statistical Inference Jean Daunizeau Wellcome rust Centre for Neuroimaging University College London SPM Course Edinburgh, April 2010 Image time-series Spatial filter Design matrix Statistical Parametric
Hunting for significance with multiple testing
 Hunting for significance with multiple testing Etienne Roquain 1 1 Laboratory LPMA, Université Pierre et Marie Curie (Paris 6), France Séminaire MODAL X, 19 mai 216 Etienne Roquain Hunting for significance
False Discovery Rate
 False Discovery Rate Peng Zhao Department of Statistics Florida State University December 3, 2018 Peng Zhao False Discovery Rate 1/30 Outline 1 Multiple Comparison and FWER 2 False Discovery Rate 3 FDR
High-Throughput Sequencing Course. Introduction. Introduction. Multiple Testing. Biostatistics and Bioinformatics. Summer 2018
 High-Throughput Sequencing Course Multiple Testing Biostatistics and Bioinformatics Summer 2018 Introduction You have previously considered the significance of a single gene Introduction You have previously
Statistical Inference
 Statistical Inference J. Daunizeau Institute of Empirical Research in Economics, Zurich, Switzerland Brain and Spine Institute, Paris, France SPM Course Edinburgh, April 2011 Image time-series Spatial
Statistical inference for MEG
 Statistical inference for MEG Vladimir Litvak Wellcome Trust Centre for Neuroimaging University College London, UK MEG-UK 2014 educational day Talk aims Show main ideas of common methods Explain some of
Non-specific filtering and control of false positives
 Non-specific filtering and control of false positives Richard Bourgon 16 June 2009 bourgon@ebi.ac.uk EBI is an outstation of the European Molecular Biology Laboratory Outline Multiple testing I: overview
Multiple Testing. Hoang Tran. Department of Statistics, Florida State University
 Multiple Testing Hoang Tran Department of Statistics, Florida State University Large-Scale Testing Examples: Microarray data: testing differences in gene expression between two traits/conditions Microbiome
Table of Outcomes. Table of Outcomes. Table of Outcomes. Table of Outcomes. Table of Outcomes. Table of Outcomes. T=number of type 2 errors
 The Multiple Testing Problem Multiple Testing Methods for the Analysis of Microarray Data 3/9/2009 Copyright 2009 Dan Nettleton Suppose one test of interest has been conducted for each of m genes in a
New Approaches to False Discovery Control
 New Approaches to False Discovery Control Christopher R. Genovese Department of Statistics Carnegie Mellon University http://www.stat.cmu.edu/ ~ genovese/ Larry Wasserman Department of Statistics Carnegie
Lecture 27. December 13, Department of Biostatistics Johns Hopkins Bloomberg School of Public Health Johns Hopkins University.
 This work is licensed under a Creative Commons Attribution-NonCommercial-ShareAlike License. Your use of this material constitutes acceptance of that license and the conditions of use of materials on this
High-throughput Testing
 High-throughput Testing Noah Simon and Richard Simon July 2016 1 / 29 Testing vs Prediction On each of n patients measure y i - single binary outcome (eg. progression after a year, PCR) x i - p-vector
Extracting fmri features
 Extracting fmri features PRoNTo course May 2018 Christophe Phillips, GIGA Institute, ULiège, Belgium c.phillips@uliege.be - http://www.giga.ulg.ac.be Overview Introduction Brain decoding problem Subject
Multiple testing: Intro & FWER 1
 Multiple testing: Intro & FWER 1 Mark van de Wiel mark.vdwiel@vumc.nl Dep of Epidemiology & Biostatistics,VUmc, Amsterdam Dep of Mathematics, VU 1 Some slides courtesy of Jelle Goeman 1 Practical notes
Bumpbars: Inference for region detection. Yuval Benjamini, Hebrew University
 Bumpbars: Inference for region detection Yuval Benjamini, Hebrew University yuvalbenj@gmail.com WHOA-PSI-2017 Collaborators Jonathan Taylor Stanford Rafael Irizarry Dana Farber, Harvard Amit Meir U of
Confidence Thresholds and False Discovery Control
 Confidence Thresholds and False Discovery Control Christopher R. Genovese Department of Statistics Carnegie Mellon University http://www.stat.cmu.edu/ ~ genovese/ Larry Wasserman Department of Statistics
Step-down FDR Procedures for Large Numbers of Hypotheses
 Step-down FDR Procedures for Large Numbers of Hypotheses Paul N. Somerville University of Central Florida Abstract. Somerville (2004b) developed FDR step-down procedures which were particularly appropriate
The General Linear Model (GLM)
") he General Linear Model (GLM) Klaas Enno Stephan ranslational Neuromodeling Unit (NU) Institute for Biomedical Engineering University of Zurich & EH Zurich Wellcome rust Centre for Neuroimaging Institute
he General Linear Model (GLM) Klaas Enno Stephan ranslational Neuromodeling Unit (NU) Institute for Biomedical Engineering University of Zurich & EH Zurich Wellcome rust Centre for Neuroimaging Institute
Statistical Applications in Genetics and Molecular Biology
 Statistical Applications in Genetics and Molecular Biology Volume 5, Issue 1 2006 Article 28 A Two-Step Multiple Comparison Procedure for a Large Number of Tests and Multiple Treatments Hongmei Jiang Rebecca
Exam: high-dimensional data analysis January 20, 2014
 Exam: high-dimensional data analysis January 20, 204 Instructions: - Write clearly. Scribbles will not be deciphered. - Answer each main question not the subquestions on a separate piece of paper. - Finish
Doing Cosmology with Balls and Envelopes
 Doing Cosmology with Balls and Envelopes Christopher R. Genovese Department of Statistics Carnegie Mellon University http://www.stat.cmu.edu/ ~ genovese/ Larry Wasserman Department of Statistics Carnegie
Statistical testing. Samantha Kleinberg. October 20, 2009
 October 20, 2009 Intro to significance testing Significance testing and bioinformatics Gene expression: Frequently have microarray data for some group of subjects with/without the disease. Want to find
Announcements. Proposals graded
 Announcements Proposals graded Kevin Jamieson 2018 1 Hypothesis testing Machine Learning CSE546 Kevin Jamieson University of Washington October 30, 2018 2018 Kevin Jamieson 2 Anomaly detection You are
PROCEDURES CONTROLLING THE k-fdr USING. BIVARIATE DISTRIBUTIONS OF THE NULL p-values. Sanat K. Sarkar and Wenge Guo
 PROCEDURES CONTROLLING THE k-fdr USING BIVARIATE DISTRIBUTIONS OF THE NULL p-values Sanat K. Sarkar and Wenge Guo Temple University and National Institute of Environmental Health Sciences Abstract: Procedures
Aliaksandr Hubin University of Oslo Aliaksandr Hubin (UIO) Bayesian FDR / 25
 Bayesian FDR / 25") Presentation of The Paper: The Positive False Discovery Rate: A Bayesian Interpretation and the q-value, J.D. Storey, The Annals of Statistics, Vol. 31 No.6 (Dec. 2003), pp 2013-2035 Aliaksandr Hubin University
Presentation of The Paper: The Positive False Discovery Rate: A Bayesian Interpretation and the q-value, J.D. Storey, The Annals of Statistics, Vol. 31 No.6 (Dec. 2003), pp 2013-2035 Aliaksandr Hubin University
Department of Statistics University of Central Florida. Technical Report TR APR2007 Revised 25NOV2007
 Department of Statistics University of Central Florida Technical Report TR-2007-01 25APR2007 Revised 25NOV2007 Controlling the Number of False Positives Using the Benjamini- Hochberg FDR Procedure Paul
arxiv: v2 [stat.me] 31 Aug 2017
![arxiv: v2 [stat.me] 31 Aug 2017](/thumbs/87/96538680.jpg "arxiv: v2 [stat.me] 31 Aug 2017") Multiple testing with discrete data: proportion of true null hypotheses and two adaptive FDR procedures Xiongzhi Chen, Rebecca W. Doerge and Joseph F. Heyse arxiv:4274v2 [stat.me] 3 Aug 207 Abstract We
Multiple testing with discrete data: proportion of true null hypotheses and two adaptive FDR procedures Xiongzhi Chen, Rebecca W. Doerge and Joseph F. Heyse arxiv:4274v2 [stat.me] 3 Aug 207 Abstract We
Estimation of a Two-component Mixture Model
 Estimation of a Two-component Mixture Model Bodhisattva Sen 1,2 University of Cambridge, Cambridge, UK Columbia University, New York, USA Indian Statistical Institute, Kolkata, India 6 August, 2012 1 Joint
Advanced Statistical Methods: Beyond Linear Regression
 Advanced Statistical Methods: Beyond Linear Regression John R. Stevens Utah State University Notes 3. Statistical Methods II Mathematics Educators Worshop 28 March 2009 1 http://www.stat.usu.edu/~jrstevens/pcmi
False Discovery Rates for Random Fields
 False Discovery Rates for Random Fields M. Perone Pacifico, C. Genovese, I. Verdinelli, L. Wasserman 1 Carnegie Mellon University and Università di Roma La Sapienza. February 25, 2003 ABSTRACT This paper
False discovery rate and related concepts in multiple comparisons problems, with applications to microarray data
 False discovery rate and related concepts in multiple comparisons problems, with applications to microarray data Ståle Nygård Trial Lecture Dec 19, 2008 1 / 35 Lecture outline Motivation for not using
Heterogeneity and False Discovery Rate Control
 Heterogeneity and False Discovery Rate Control Joshua D Habiger Oklahoma State University jhabige@okstateedu URL: jdhabigerokstateedu August, 2014 Motivating Data: Anderson and Habiger (2012) M = 778 bacteria
On Procedures Controlling the FDR for Testing Hierarchically Ordered Hypotheses
 On Procedures Controlling the FDR for Testing Hierarchically Ordered Hypotheses Gavin Lynch Catchpoint Systems, Inc., 228 Park Ave S 28080 New York, NY 10003, U.S.A. Wenge Guo Department of Mathematical
arxiv: v1 [math.st] 24 Apr 2015
![arxiv: v1 [math.st] 24 Apr 2015](/thumbs/84/89098828.jpg "arxiv: v1 [math.st] 24 Apr 2015") Multiple Testing of Local Extrema for Detection of Change Points arxiv:.v [math.st] Apr Dan Cheng North Carolina State University April, Astract Armin Schwartzman North Carolina State University A new
Multiple Testing of Local Extrema for Detection of Change Points arxiv:.v [math.st] Apr Dan Cheng North Carolina State University April, Astract Armin Schwartzman North Carolina State University A new
Miscellanea False discovery rate for scanning statistics
 Biometrika (2011), 98,4,pp. 979 985 C 2011 Biometrika Trust Printed in Great Britain doi: 10.1093/biomet/asr057 Miscellanea False discovery rate for scanning statistics BY D. O. SIEGMUND, N. R. ZHANG Department
Statistical Emerging Pattern Mining with Multiple Testing Correction
 Statistical Emerging Pattern Mining with Multiple Testing Correction Junpei Komiyama 1, Masakazu Ishihata 2, Hiroki Arimura 2, Takashi Nishibayashi 3, Shin-Ichi Minato 2 1. U-Tokyo 2. Hokkaido Univ. 3.
Alpha-Investing. Sequential Control of Expected False Discoveries
 Alpha-Investing Sequential Control of Expected False Discoveries Dean Foster Bob Stine Department of Statistics Wharton School of the University of Pennsylvania www-stat.wharton.upenn.edu/ stine Joint
Week 5 Video 1 Relationship Mining Correlation Mining
 Week 5 Video 1 Relationship Mining Correlation Mining Relationship Mining Discover relationships between variables in a data set with many variables Many types of relationship mining Correlation Mining
Sta$s$cs for Genomics ( )
") Sta$s$cs for Genomics (140.688) Instructor: Jeff Leek Slide Credits: Rafael Irizarry, John Storey No announcements today. Hypothesis testing Once you have a given score for each gene, how do you decide
Sta$s$cs for Genomics (140.688) Instructor: Jeff Leek Slide Credits: Rafael Irizarry, John Storey No announcements today. Hypothesis testing Once you have a given score for each gene, how do you decide
Sanat Sarkar Department of Statistics, Temple University Philadelphia, PA 19122, U.S.A. September 11, Abstract
 Adaptive Controls of FWER and FDR Under Block Dependence arxiv:1611.03155v1 [stat.me] 10 Nov 2016 Wenge Guo Department of Mathematical Sciences New Jersey Institute of Technology Newark, NJ 07102, U.S.A.
Multiple Change-Point Detection and Analysis of Chromosome Copy Number Variations
 Multiple Change-Point Detection and Analysis of Chromosome Copy Number Variations Yale School of Public Health Joint work with Ning Hao, Yue S. Niu presented @Tsinghua University Outline 1 The Problem
Massive MIMO: Signal Structure, Efficient Processing, and Open Problems II
 Massive MIMO: Signal Structure, Efficient Processing, and Open Problems II Mahdi Barzegar Communications and Information Theory Group (CommIT) Technische Universität Berlin Heisenberg Communications and
Signal Processing for Functional Brain Imaging: General Linear Model (2)
") Signal Processing for Functional Brain Imaging: General Linear Model (2) Maria Giulia Preti, Dimitri Van De Ville Medical Image Processing Lab, EPFL/UniGE http://miplab.epfl.ch/teaching/micro-513/ March
Signal Processing for Functional Brain Imaging: General Linear Model (2) Maria Giulia Preti, Dimitri Van De Ville Medical Image Processing Lab, EPFL/UniGE http://miplab.epfl.ch/teaching/micro-513/ March
Controlling Bayes Directional False Discovery Rate in Random Effects Model 1
 Controlling Bayes Directional False Discovery Rate in Random Effects Model 1 Sanat K. Sarkar a, Tianhui Zhou b a Temple University, Philadelphia, PA 19122, USA b Wyeth Pharmaceuticals, Collegeville, PA
Optional Stopping Theorem Let X be a martingale and T be a stopping time such
 Plan Counting, Renewal, and Point Processes 0. Finish FDR Example 1. The Basic Renewal Process 2. The Poisson Process Revisited 3. Variants and Extensions 4. Point Processes Reading: G&S: 7.1 7.3, 7.10
Adaptive Filtering Multiple Testing Procedures for Partial Conjunction Hypotheses
 Adaptive Filtering Multiple Testing Procedures for Partial Conjunction Hypotheses arxiv:1610.03330v1 [stat.me] 11 Oct 2016 Jingshu Wang, Chiara Sabatti, Art B. Owen Department of Statistics, Stanford University
Post-selection Inference for Changepoint Detection
 Post-selection Inference for Changepoint Detection Sangwon Hyun (Justin) Dept. of Statistics Advisors: Max G Sell, Ryan Tibshirani Committee: Will Fithian (UC Berkeley), Alessandro Rinaldo, Kathryn Roeder,
Biostatistics Advanced Methods in Biostatistics IV
 Biostatistics 140.754 Advanced Methods in Biostatistics IV Jeffrey Leek Assistant Professor Department of Biostatistics jleek@jhsph.edu Lecture 11 1 / 44 Tip + Paper Tip: Two today: (1) Graduate school
Basics of Experimental Design. Review of Statistics. Basic Study. Experimental Design. When an Experiment is Not Possible. Studying Relations
 Basics of Experimental Design Review of Statistics And Experimental Design Scientists study relation between variables In the context of experiments these variables are called independent and dependent
Family-wise Error Rate Control in QTL Mapping and Gene Ontology Graphs
 Family-wise Error Rate Control in QTL Mapping and Gene Ontology Graphs with Remarks on Family Selection Dissertation Defense April 5, 204 Contents Dissertation Defense Introduction 2 FWER Control within
Resampling-Based Control of the FDR
 Resampling-Based Control of the FDR Joseph P. Romano 1 Azeem S. Shaikh 2 and Michael Wolf 3 1 Departments of Economics and Statistics Stanford University 2 Department of Economics University of Chicago
A. Motivation To motivate the analysis of variance framework, we consider the following example.
 9.07 ntroduction to Statistics for Brain and Cognitive Sciences Emery N. Brown Lecture 14: Analysis of Variance. Objectives Understand analysis of variance as a special case of the linear model. Understand
Incorporation of Sparsity Information in Large-scale Multiple Two-sample t Tests
 Incorporation of Sparsity Information in Large-scale Multiple Two-sample t Tests Weidong Liu October 19, 2014 Abstract Large-scale multiple two-sample Student s t testing problems often arise from the
Topic 3: Hypothesis Testing
 CS 8850: Advanced Machine Learning Fall 07 Topic 3: Hypothesis Testing Instructor: Daniel L. Pimentel-Alarcón c Copyright 07 3. Introduction One of the simplest inference problems is that of deciding between
Stat 206: Estimation and testing for a mean vector,
 Stat 206: Estimation and testing for a mean vector, Part II James Johndrow 2016-12-03 Comparing components of the mean vector In the last part, we talked about testing the hypothesis H 0 : µ 1 = µ 2 where
Specific Differences. Lukas Meier, Seminar für Statistik
 Specific Differences Lukas Meier, Seminar für Statistik Problem with Global F-test Problem: Global F-test (aka omnibus F-test) is very unspecific. Typically: Want a more precise answer (or have a more
Bayesian inference J. Daunizeau
 Bayesian inference J. Daunizeau Brain and Spine Institute, Paris, France Wellcome Trust Centre for Neuroimaging, London, UK Overview of the talk 1 Probabilistic modelling and representation of uncertainty
Journal Club: Higher Criticism
 Journal Club: Higher Criticism David Donoho (2002): Higher Criticism for Heterogeneous Mixtures, Technical Report No. 2002-12, Dept. of Statistics, Stanford University. Introduction John Tukey (1976):
Model Selection Tutorial 2: Problems With Using AIC to Select a Subset of Exposures in a Regression Model
 Model Selection Tutorial 2: Problems With Using AIC to Select a Subset of Exposures in a Regression Model Centre for Molecular, Environmental, Genetic & Analytic (MEGA) Epidemiology School of Population
Generalized likelihood ratio tests for complex fmri data
 Generalized likelihood ratio tests for complex fmri data J. Sijbers a and A. J. den Dekker b a Vision Lab, University of Antwerp, Groenenborgerlaan 171, B-2020 Antwerpen, Belgium; b Delft Center for Systems
2. What are the tradeoffs among different measures of error (e.g. probability of false alarm, probability of miss, etc.)?
?") ECE 830 / CS 76 Spring 06 Instructors: R. Willett & R. Nowak Lecture 3: Likelihood ratio tests, Neyman-Pearson detectors, ROC curves, and sufficient statistics Executive summary In the last lecture we
ECE 830 / CS 76 Spring 06 Instructors: R. Willett & R. Nowak Lecture 3: Likelihood ratio tests, Neyman-Pearson detectors, ROC curves, and sufficient statistics Executive summary In the last lecture we
Exceedance Control of the False Discovery Proportion Christopher Genovese 1 and Larry Wasserman 2 Carnegie Mellon University July 10, 2004
 Exceedance Control of the False Discovery Proportion Christopher Genovese 1 and Larry Wasserman 2 Carnegie Mellon University July 10, 2004 Multiple testing methods to control the False Discovery Rate (FDR),
arxiv: v3 [stat.me] 29 Oct 2016
![arxiv: v3 [stat.me] 29 Oct 2016](/thumbs/72/66691820.jpg "arxiv: v3 [stat.me] 29 Oct 2016") The p-filter: multi-layer FDR control for grouped hypotheses arxiv:1512.03397v3 [stat.me] 29 Oct 2016 Rina Foygel Barber and Aaditya Ramdas October 28, 2016 Abstract In many practical applications of multiple
The p-filter: multi-layer FDR control for grouped hypotheses arxiv:1512.03397v3 [stat.me] 29 Oct 2016 Rina Foygel Barber and Aaditya Ramdas October 28, 2016 Abstract In many practical applications of multiple
T.I.H.E. IT 233 Statistics and Probability: Sem. 1: 2013 ESTIMATION AND HYPOTHESIS TESTING OF TWO POPULATIONS
 ESTIMATION AND HYPOTHESIS TESTING OF TWO POPULATIONS In our work on hypothesis testing, we used the value of a sample statistic to challenge an accepted value of a population parameter. We focused only
Applying the Benjamini Hochberg procedure to a set of generalized p-values
 U.U.D.M. Report 20:22 Applying the Benjamini Hochberg procedure to a set of generalized p-values Fredrik Jonsson Department of Mathematics Uppsala University Applying the Benjamini Hochberg procedure
Lecture 12: Multiple Hypothesis Testing
 ECE 830 Fall 00 Saisical Signal Processing insrucor: R. Nowak, scribe: Xinjue Yu Lecure : Muliple Hypohesis Tesing Inroducion In many applicaions we consider muliple hypohesis es a he same ime. Example
Controlling the False Discovery Rate: Understanding and Extending the Benjamini-Hochberg Method
 Controlling the False Discovery Rate: Understanding and Extending the Benjamini-Hochberg Method Christopher R. Genovese Department of Statistics Carnegie Mellon University joint work with Larry Wasserman
Improving the Performance of the FDR Procedure Using an Estimator for the Number of True Null Hypotheses
 Improving the Performance of the FDR Procedure Using an Estimator for the Number of True Null Hypotheses Amit Zeisel, Or Zuk, Eytan Domany W.I.S. June 5, 29 Amit Zeisel, Or Zuk, Eytan Domany (W.I.S.)Improving
ROI ANALYSIS OF PHARMAFMRI DATA:
 ROI ANALYSIS OF PHARMAFMRI DATA: AN ADAPTIVE APPROACH FOR GLOBAL TESTING Giorgos Minas, John A.D. Aston, Thomas E. Nichols and Nigel Stallard Department of Statistics and Warwick Centre of Analytical Sciences,
Bayesian inference J. Daunizeau
 Bayesian inference J. Daunizeau Brain and Spine Institute, Paris, France Wellcome Trust Centre for Neuroimaging, London, UK Overview of the talk 1 Probabilistic modelling and representation of uncertainty
University of California, Berkeley
 University of California, Berkeley U.C. Berkeley Division of Biostatistics Working Paper Series Year 2004 Paper 147 Multiple Testing Methods For ChIP-Chip High Density Oligonucleotide Array Data Sunduz
Let us first identify some classes of hypotheses. simple versus simple. H 0 : θ = θ 0 versus H 1 : θ = θ 1. (1) one-sided
 one-sided") Let us first identify some classes of hypotheses. simple versus simple H 0 : θ = θ 0 versus H 1 : θ = θ 1. (1) one-sided H 0 : θ θ 0 versus H 1 : θ > θ 0. (2) two-sided; null on extremes H 0 : θ θ 1 or
Let us first identify some classes of hypotheses. simple versus simple H 0 : θ = θ 0 versus H 1 : θ = θ 1. (1) one-sided H 0 : θ θ 0 versus H 1 : θ > θ 0. (2) two-sided; null on extremes H 0 : θ θ 1 or
Asymptotic Results on Adaptive False Discovery Rate Controlling Procedures Based on Kernel Estimators
 Asymptotic Results on Adaptive False Discovery Rate Controlling Procedures Based on Kernel Estimators Pierre Neuvial To cite this version: Pierre Neuvial. Asymptotic Results on Adaptive False Discovery
REPRODUCIBLE ANALYSIS OF HIGH-THROUGHPUT EXPERIMENTS
 REPRODUCIBLE ANALYSIS OF HIGH-THROUGHPUT EXPERIMENTS Ying Liu Department of Biostatistics, Columbia University Summer Intern at Research and CMC Biostats, Sanofi, Boston August 26, 2015 OUTLINE 1 Introduction
Understanding Regressions with Observations Collected at High Frequency over Long Span
 Understanding Regressions with Observations Collected at High Frequency over Long Span Yoosoon Chang Department of Economics, Indiana University Joon Y. Park Department of Economics, Indiana University
A General Framework for High-Dimensional Inference and Multiple Testing
 A General Framework for High-Dimensional Inference and Multiple Testing Yang Ning Department of Statistical Science Joint work with Han Liu 1 Overview Goal: Control false scientific discoveries in high-dimensional
Association studies and regression
 Association studies and regression CM226: Machine Learning for Bioinformatics. Fall 2016 Sriram Sankararaman Acknowledgments: Fei Sha, Ameet Talwalkar Association studies and regression 1 / 104 Administration
A Sequential Bayesian Approach with Applications to Circadian Rhythm Microarray Gene Expression Data
 A Sequential Bayesian Approach with Applications to Circadian Rhythm Microarray Gene Expression Data Faming Liang, Chuanhai Liu, and Naisyin Wang Texas A&M University Multiple Hypothesis Testing Introduction
The General Linear Model (GLM)
") The General Linear Model (GLM) Dr. Frederike Petzschner Translational Neuromodeling Unit (TNU) Institute for Biomedical Engineering, University of Zurich & ETH Zurich With many thanks for slides & images
The General Linear Model (GLM) Dr. Frederike Petzschner Translational Neuromodeling Unit (TNU) Institute for Biomedical Engineering, University of Zurich & ETH Zurich With many thanks for slides & images
Chapter 2 Signal Processing at Receivers: Detection Theory
 Chapter Signal Processing at Receivers: Detection Theory As an application of the statistical hypothesis testing, signal detection plays a key role in signal processing at receivers of wireless communication
More powerful control of the false discovery rate under dependence
 Statistical Methods & Applications (2006) 15: 43 73 DOI 10.1007/s10260-006-0002-z ORIGINAL ARTICLE Alessio Farcomeni More powerful control of the false discovery rate under dependence Accepted: 10 November
Post-Selection Inference
 Classical Inference start end start Post-Selection Inference selected end model data inference data selection model data inference Post-Selection Inference Todd Kuffner Washington University in St. Louis
Minitab Project Report Assignment 3
 3.1.1 Simulation of Gaussian White Noise Minitab Project Report Assignment 3 Time Series Plot of zt Function zt 1 0. 0. zt 0-1 0. 0. -0. -0. - -3 1 0 30 0 50 Index 0 70 0 90 0 1 1 1 1 0 marks The series
Piotr Majer Risk Patterns and Correlated Brain Activities
 Alena My²i ková Piotr Majer Song Song Alena Myšičková Peter N. C. Mohr Peter N. C. Mohr Wolfgang K. Härdle Song Song Hauke R. Heekeren Wolfgang K. Härdle Hauke R. Heekeren C.A.S.E. Centre C.A.S.E. for
Contents. Introduction The General Linear Model. General Linear Linear Model Model. The General Linear Model, Part I. «Take home» message
 DISCOS SPM course, CRC, Liège, 2009 Contents The General Linear Model, Part I Introduction The General Linear Model Data & model Design matrix Parameter estimates & interpretation Simple contrast «Take
Journal of Statistical Software
 JSS Journal of Statistical Software MMMMMM YYYY, Volume VV, Issue II. doi: 10.18637/jss.v000.i00 GroupTest: Multiple Testing Procedure for Grouped Hypotheses Zhigen Zhao Abstract In the modern Big Data
Lecture 5: Likelihood ratio tests, Neyman-Pearson detectors, ROC curves, and sufficient statistics. 1 Executive summary
 ECE 830 Spring 207 Instructor: R. Willett Lecture 5: Likelihood ratio tests, Neyman-Pearson detectors, ROC curves, and sufficient statistics Executive summary In the last lecture we saw that the likelihood
Some General Types of Tests
 Some General Types of Tests We may not be able to find a UMP or UMPU test in a given situation. In that case, we may use test of some general class of tests that often have good asymptotic properties.
Large-Scale Multiple Testing of Correlations
 Large-Scale Multiple Testing of Correlations T. Tony Cai and Weidong Liu Abstract Multiple testing of correlations arises in many applications including gene coexpression network analysis and brain connectivity
A Large-Sample Approach to Controlling the False Discovery Rate
 A Large-Sample Approach to Controlling the False Discovery Rate Christopher R. Genovese Department of Statistics Carnegie Mellon University Larry Wasserman Department of Statistics Carnegie Mellon University
Modelling temporal structure (in noise and signal)
") Modelling temporal structure (in noise and signal) Mark Woolrich, Christian Beckmann*, Salima Makni & Steve Smith FMRIB, Oxford *Imperial/FMRIB temporal noise: modelling temporal autocorrelation temporal
Modelling temporal structure (in noise and signal) Mark Woolrich, Christian Beckmann*, Salima Makni & Steve Smith FMRIB, Oxford *Imperial/FMRIB temporal noise: modelling temporal autocorrelation temporal
Experimental design of fmri studies & Resting-State fmri
 Methods & Models for fmri Analysis 2016 Experimental design of fmri studies & Resting-State fmri Sandra Iglesias With many thanks for slides & images to: Klaas Enno Stephan, FIL Methods group, Christian
Two simple sufficient conditions for FDR control
 Electronic Journal of Statistics Vol. 2 (2008) 963 992 ISSN: 1935-7524 DOI: 10.1214/08-EJS180 Two simple sufficient conditions for FDR control Gilles Blanchard, Fraunhofer-Institut FIRST Kekuléstrasse