Model-free Functional Data Analysis
|
|
|
- Ezra Watts
- 6 years ago
- Views:
Transcription
1 Model-free Functional Data Analysis MELODIC Multivariate Exploratory Linear Optimised Decomposition into Independent Components decomposes data into a set of statistically independent spatial component maps and associated time courses fully automated (incl estimation of the number of components) inference on IC maps using alternative hypothesis testing 1
2 Model-free Functional Data Analysis MELODIC Multivariate Exploratory Linear Optimised Decomposition into Independent Components decomposes data into a set of statistically independent spatial component maps and associated time courses fully automated (incl estimation of the number of components) inference on IC maps using alternative hypothesis testing 1

3 The FMRI inferential path Experiment 2
4 The FMRI inferential path Experiment Physiology 2
5 The FMRI inferential path Experiment Physiology MR Physics 2
6 The FMRI inferential path Experiment Physiology Analysis MR Physics 2
7 The FMRI inferential path Experiment Interpretation of final results Physiology Analysis MR Physics 2
8 Variability in FMRI Experiment Interpretation of final results suboptimal event timing, non-efficient design, etc Physiology Analysis MR Physics 3
9 Variability in FMRI Experiment Interpretation of final results suboptimal event timing, non-efficient design, etc Physiology secondary activation, ill-defined baseline, resting-fluctuations etc Analysis MR Physics 3
10 Variability in FMRI Experiment Interpretation of final results suboptimal event timing, non-efficient design, etc Physiology secondary activation, ill-defined baseline, resting-fluctuations etc Analysis MR Physics MR noise, field inhomogeneity, MR artefacts etc 3
11 Variability in FMRI Experiment Interpretation suboptimal event timing, Physiology of final results non-efficient design, etc secondary activation, ill-defined baseline, resting-fluctuations etc filteringanalysis & sampling artefacts, design misspecification, stats & thresholding issues etc MR Physics MR noise, field inhomogeneity, MR artefacts etc 3
 analysis =")


12 Model-based (GLM) analysis = β i + model each measured time-series as a linear combination of signal and noise If the design matrix does not capture every signal, we typically get wrong inferences! 4

13 Data Analysis Confirmatory How well does my model fit to the data? Problem Model Data Analysis Results Results depend on the model 5
14 Data Analysis Confirmatory How well does my model fit to the data? Exploratory Is there anything interesting in the data? Problem Data Problem Data Model Analysis Analysis Model Results Results depend on the model Results can give unexpected results 5
15 EDA techniques try to explain / represent the data by calculating quantities that summarise the data by extracting underlying hidden features that are interesting differ in what is considered interesting are localised in time and/or space (Clustering) explain observed data variance (PCA, FDA, FA) are maximally independent (ICA) typically are multivariate and linear 6
16 EDA techniques for FMRI are mostly multivariate often provide a multivariate linear decomposition: space # maps space time Scan #k FMRI data = time # maps spatial maps Data is represented as a 2D matrix and decomposed into factor matrices (or modes) 7
17 PCA for FMRI 8
18 PCA for FMRI 1 assemble all (demeaned) data as a matrix time space Scan #k FMRI data 8

19 PCA for FMRI 1 assemble all (demeaned) data as a matrix 2 calculate the data covariance matrix 8
20 PCA for FMRI # maps 1 assemble all (demeaned) data as a matrix 2 calculate the data time covariance matrix 3 calculate SVD 8
 data as a matrix 2")

21 PCA for FMRI 1 assemble all (demeaned) data as a matrix 2 calculate the data covariance matrix 3 calculate SVD 4 project data onto the Eigenvectors 8
22 PCA decompositions: Implications 9
23 PCA decompositions: Implications spatial maps and time courses are orthogonal (uncorrelated) 9
24 PCA vs ICA Gaussian data 10
25 PCA vs ICA PCA finds projections of maximum amount of variance in Gaussian data (uses 2nd order statistics only) Gaussian data 10
26 PCA vs ICA PCA finds projections of maximum amount of variance in Gaussian data (uses 2nd order statistics only) non-gaussian data 10
27 PCA vs ICA PCA finds projections of maximum amount of variance in Gaussian data (uses 2nd order statistics only) non-gaussian data 10
28 PCA vs ICA PCA finds projections of maximum amount of variance in Gaussian data (uses 2nd order statistics only) Independent Component Analysis (ICA) finds projections of maximal independence in non- Gaussian data (using higher-order statistics) non-gaussian data 10
29 PCA decompositions: Implications spatial maps and time courses are orthogonal (uncorrelated) 11
30 PCA decompositions: Implications spatial maps and time courses are orthogonal (uncorrelated) uncorrelated un-related 11
31 Correlation vs independece 12
32 Correlation vs independece de-correlated signals can still be dependent y = sin(z) Plot x vs y r= xy x = cos(z)
33 Correlation vs independece de-correlated signals can still be dependent y = sin(z) Plot x vs y r= xy higher-order statistics (beyond mean and variance) can reveal these dependencies Stone et al 2002 y 2 = sin(z) x = cos(z) x = cos(z) high order correlations r= x 2 y x 2 = cos(z) 2 12
34 PCA decompositions: Implications 13
35 PCA decompositions: Implications spatial maps and time courses are orthogonal (uncorrelated) uncorrelated un-related only looks at 2nd order statistics: problem with non-gaussian sources PCA is rotationally invariant 13
36 Rotational invariance 14
37 Rotational invariance consider de-correlated signals Y, ie R Y = I 14
38 Rotational invariance consider de-correlated signals Y, ie R Y = I consider projecting the data onto a basis R QY QY Y T Q T = QQ T Q 14
39 Rotational invariance consider de-correlated signals Y, ie R Y = I consider projecting the data onto a basis R QY QY Y T Q T = QQ T Q then, R QY = R Y = I for any Q st QQ T = I 14
40 Rotational invariance consider de-correlated signals Y, ie R Y = I consider projecting the data onto a basis R QY QY Y T Q T = QQ T Q then, R QY = R Y = I for any Q st QQ T = I QQ T = I : Q is a rotation matrix 14
41 The Geometry of PCA and ICA s 2 s 2 PC PC 2 s 1 0 s independent, uniformly distributed sources linear mixtures of sources 15

42 The Geometry of PCA and ICA 08 s 1 IC 1 08 IC 2 s s 1 IC 2 IC 1 04 s PCA solution ICA solution 15
43 spatial ICA for FMRI McKeown et al (1998): data is decomposed into a set of spatially independent component maps and a set of time-course space # ICs space time Scan #k FMRI data = time # ICs Components impose spatial independence McKeown et al HBM
44 PCA pre-processing for ICA whitening Data uncorrelated signals 17
45 PCA pre-processing for ICA whitening Data uncorrelated signals 2-stage approach to ICA: PCA to obtain whitened (uncorrelated) signals using 2nd order statistics 17
46 PCA pre-processing for ICA whitening rotation Data uncorrelated signals 2-stage approach to ICA: independent signals PCA to obtain whitened (uncorrelated) signals using 2nd order statistics estimate rotation which minimises higher-order dependencies 17
47 ICA - the overfitting problem fitting a noise-free model to noisy observations: no control over signal vs noise (noninterpretable results) statistical significance testing not possible 18
48 ICA - the overfitting problem fitting a noise-free model to noisy observations: no control over signal vs noise (noninterpretable results) statistical significance testing not possible GLM analysis standard ICA (unconstrained) 18
49 Probabilistic ICA model statistical latent variables model: we observe linear mixtures of hidden sources y i = Xβ i + ɛ i for all i Y = XB + E we can estimate the model order from the Eigenspectrum of the data covariance matrix need to account for differences in voxel-wise variance (can use a pre-whitening approach (eg al, NeuroImage 14(6) 2001) Woolrich et 19
50 Variance-normalisation we might choose to ignore temporal autocorrelation in the EPI time-series but always need to normalise by the voxel-wise variance Voxel wise standard deviation this amounts to modelling the spatial covariance matrix as a diagonal matrix V 1/2 = diag(σ 1,, σ N ) Estimated voxel-wise std deviation (logscale) from FMRI data obtained under rest condition
51 Model Order Selection The sample covariance matrix has a Wishart distribution and we can calculate the empirical distribution function for the eigenvalues Everson & Roberts, IEEE Trans Sig Proc 48(7), 2000 Empirical distribution function observed Eigenspectrum 21
52 Model Order Selection (PPCA) use a probabilistic PCA model and calculate (approximate) the Bayesian evidence for the model order Minka, TR 514 MIT Media Lab 2000 Laplace approximation BIC AIC 22
 (b) x2")

53 Conditioning the Eigenspectrum (a) (b) x2 P C 2 (c) 10 sources introduced into white noise (AR 0) 23
54 ICA estimation need to find an unmixing matrix such that the dependency between estimated sources is minimised need (i) a contrast (objective/cost) function which measures statistical independence and (ii) an optimisation technique: kurtosis or cumulants & gradient descent (Jade) maximum entropy & gradient descent (Infomax) neg-entropy & fixed point iteration (FastICA) 24
55 Non-Gaussianity is interesting 25
56 Non-Gaussianity is interesting 25
57 Non-Gaussianity is interesting 25
58 Non-Gaussianity is interesting 25
59 Non-Gaussianity is interesting 25
60 Non-Gaussianity is interesting mixing 25
61 Non-Gaussianity is interesting mixing 25
62 ICA estimation 26
63 ICA estimation Random mixing results in more Gaussian shapes PDFs (Central Limit Theorem) 26
64 ICA estimation Random mixing results in more Gaussian shapes PDFs (Central Limit Theorem) conversely: if an unmixing matrix produces less Gaussian shaped PDFs this is unlikely to be a random result 26
65 ICA estimation Random mixing results in more Gaussian shapes PDFs (Central Limit Theorem) conversely: if an unmixing matrix produces less Gaussian shaped PDFs this is unlikely to be a random result measure non-gaussianity 26
66 ICA estimation Random mixing results in more Gaussian shapes PDFs (Central Limit Theorem) conversely: if an unmixing matrix produces less Gaussian shaped PDFs this is unlikely to be a random result measure non-gaussianity can use neg-entropy J (s) = H(s gauss ) H(s) 26
67 ICA estimation Random mixing results in more Gaussian shapes PDFs (Central Limit Theorem) conversely: if an unmixing matrix produces less Gaussian shaped PDFs this is unlikely to be a random result measure non-gaussianity can use neg-entropy Fast approximations: J (s) = H(s gauss) H(s) J (s) p i κ i [ E(gi (s)) E(g i (s gauss )) ] 2 Hyvärinen & Oja


68 Probabilistic ICA (I) Data pre-processing: voxel wise demeaning and variance normalization estimate intrinsic dimensionality (PCA) unmix source signals using negentropy as a measure of non- Gaussianity (Hyvärinen, 1999) 27
69 ICA and spatially correlated sources Spatial correlation: ρ(s 1, s 2 ) = s t 1s 2 N Var(s 1 ) Var(s 2 ) In the presence of noise: ρ(s 1 + η 1, s 2 + η 2 ) = s t 1s 2 N Var(s 1 ) + σ 2 Var(s 2 ) + σ 2 28
 2 sources correlated")
 de-correlating the two maps")
 (b)")
70 ICA and spatially correlated sources Example: (a) 2 sources correlated (ρ=05); (b) in the presence of noise, ρ<01 and (c) de-correlating the two maps preserves the structure; (d) thresholded maps represent the sources well (a) (b) (c) (d) 28


71 Probabilistic ICA (II) form voxel-wise Z-statistics using the estimated standard deviation of the noise x 2 PC 2 C 1 IC 1 ˆɛ i 29
72 Thresholding Null-hypothesis testing is invalid: right tail IC-map thresholding based on Z-transforming across the spatial domain gives wrong false-positives rate! Under the model: left tail B = W Y = W (XB + E) ie the estimated spatial maps contain a linear projection of the noise term the distribution of the estimated spatial maps is a mixture distribution 30


73 Alternative Hypothesis Test use Gaussian/Gamma mixture model fitted to the histogram of intensity values (using EM) 31
74 Full PICA model MELODIC 32
75 Full PICA model MELODIC Beckmann and Smith IEEE TMI
76 Probabilistic ICA designed to address the overfitting problem : GLM analysis standard ICA (unconstrained) 33
77 Probabilistic ICA designed to address the overfitting problem : GLM analysis probabilistic ICA (constrained) 33
78 Probabilistic ICA designed to address the overfitting problem : GLM analysis probabilistic ICA (constrained) avoids generation of spurious results 33
 avoids generation of spurious results high spatial sensitivity and specificity")
79 Probabilistic ICA designed to address the overfitting problem : GLM analysis probabilistic ICA (constrained) avoids generation of spurious results high spatial sensitivity and specificity 33

80 Simulated data Receiver - Operator Characteristics: PICA vs GLM at different `activation` levels and different thresholds 34
81 Applications EDA techniques can be useful to investigate the BOLD response estimate artefacts in the data find areas of activation which respond in a non-standard way analyse data for which no model of the BOLD response is available 35
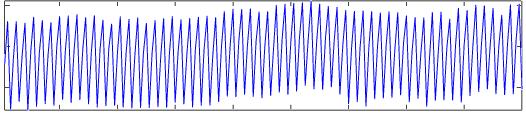
82 Investigate BOLD response estimated signal time course standard hrf model Wise & Tracey 36
83 Applications EDA techniques can be useful to investigate the BOLD response estimate artefacts in the data find areas of activation which respond in a non-standard way analyse data for which no model of the BOLD response is available 37
84 Artefact detection FMRI data contain a variety of source processes Artefactual sources typically have unknown spatial and temporal extent and cannot easily be modeled accurately Exploratory techniques do not require a priori knowledge of time-courses and spatial maps 38
85 slice drop-outs 39
86 gradient instability 40

87 EPI ghost 41
88 EPI ghost 42
89 high-frequency noise 43
90 head motion 44
91 field inhomogeneity 45
92 eye-related artefacts 46
93 eye-related artefacts 46
94 eye-related artefacts Wrap around 46
95 spin-history effects 47
 In either case lead to suboptimal estimates and wrong inference!")
96 Implication for the GLM structured noise appears: in the GLM residuals and inflate variance estimates (more false negatives) in the parameter estimates (more false positives and/or false negatives) In either case lead to suboptimal estimates and wrong inference! 48

97 Structured noise and GLM Z-stats bias Correlations of the noise time courses with typical FMRI regressors can cause a shift in the histogram of the Z- statistics Thresholded maps will have wrong false-positive rate 49
98 Denoising FMRI before denoising PE raw Z raw Example: left vs right hand finger tapping Johansen-Berg et al PNAS !1000! !10! LEFT - RIGHT LEFT contrast PE clean Z clean !1000! !10! after denoising 50
99 Denoising FMRI before denoising 600 PE raw 350 Z raw Example: left vs right hand finger tapping Johansen-Berg et al PNAS !1000! !10! LEFT - RIGHT LEFT contrast PE clean Z clean 0!1000! !10! after denoising 50

100 Denoising FMRI before denoising Example: left vs right hand finger tapping LEFT - RIGHT contrast Johansen-Berg et al PNAS 2002 after denoising 50

101 Apparent variability McGonigle et al: 33 Sessions under motor paradigm de-noising data by regressing out noise: reduced apparent session variability 51
102 Applications EDA techniques can be useful to investigate the BOLD response estimate artefacts in the data find areas of activation which respond in a non-standard way analyse data for which no model of the BOLD response is available 52


103 Example: stim correl motion GLM est z-rotation FE-map PICA est y-translation standard ICA 53
2! 86'313! (2! 6)*132*#214! -<! 6)3$1'414! \"&+=3%6)43! )1>2(5'7! (#2>(21! 2$1! (642%*7! 37321,! ()4!! %;! #%)#%,2()2! %*! 36##133>1! 32,6'(2%)3:! +)321(4! %;! >()3$)-! 2$1!! -:<!@A<!")
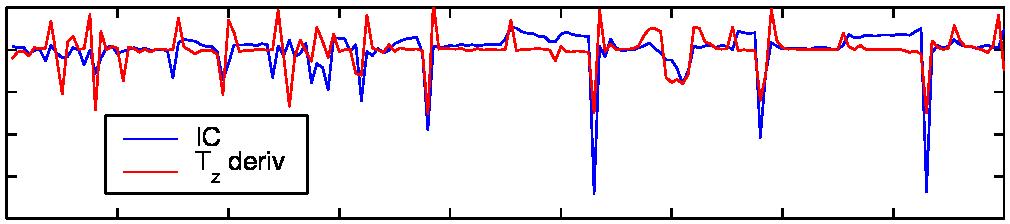
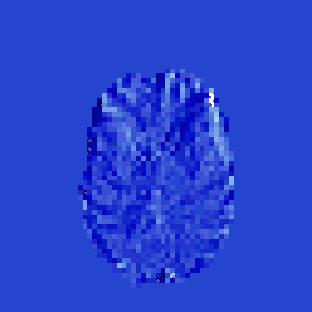
104 ! 7!fIU!8*)#8'13!3!36214!2%!%82,B1!2$1!,%41'!%;!2$1!NKf!9$'1!8*%21 &%+*)23#+&)%! %41'!>(!(88*%8*(21!,%41'=%*41*!31'1#2%)!?aA:!! Clinical example!!!!!!!!!!!!!!!!!!!!!!!!!!!! #%)341*(5'1! (#%632#! )%31! 57! 32118! -*(41)2! 86'313! (2! 6)*132*#214! -<! 6)3$1'414! "&+=3%6)43! )1>2(5'7! (#2>(21! 2$1! (642%*7! 37321,! ()4!! %;! #%)#%,2()2! %*! 36##133>1! 32,6'(2%)3:! +)321(4! %;! >()3$)-! 2$1!! 57! 12$1*! )2*%46#)-! (51**()2! -*(41)2! 392#$13!?C=DA<! (,8'26413! %*! 7!3(,8')-!8$73%'%-#(''7!41'(714!$1,%47)(,#!FGHI=*138%)313!2%!2$1! )2'7! 41'(714! 562! %2$1*931! 6),%4;14! -*(41)2! )%31!?MA:! N1*1<! 91!!(3!91''!(3!4(2(=4*>1)!4121#2%)!%;!,%46'(2%)3!)!2$1!FGHI!3-)('!%;!2$1! *1(4=%623!/KPG30!;*%,!2$1!-*(41)2=2*()!%;!()!"&+!86'31!31Q61)#1:! f+wzk"!d\( K-$2!>13256'(*!3#$9())%,(!P!8%32%81*(2>1!41(;)133! use EPI readout gradient noise to evoke auditory responses in patients before cochlear implant surgery 1-+,)2"! ()3! 91*1!*1(4! +A! 9$#$! 9(3! 91''! (3!,6;;'1! '1!,%2%)3:! %*,('!$1(*)-! (8]CEj0!91*1! Zf+='%#('B1*3:! #())1*:! 2$*11! 4;;1*1)2! $9())%,(<! (!,! %;! (! $1*813= 33214! %;! 3!(!32,6'63!%;! da0:!t$1!3#()3! (!321(47=32(21:! ;! f"ut=413-)! 41*>(2>1:! f%*! VH0!9(3!6314:!!! JGI+f+"I!"&+!WKUI+"ST=TKU+S!n+TN!K"UI=GZT!GJ+VV+GSV!o!"R&"XT"I!UZI+TGKm!FGHI!V+WSUH!JGIZHUT+GSV\!!!"#$%&'()*!"#$%&'"()%+,!"##-(**+&,-&-"$*/0(1*)2,(1"(0+*345 +J&GV+SW!&K+GK!T"J&GKUH!XGSTKU+STV!TG!IUTU=IK+c"S!&KGFUF+H+VT+X!+SI"&"SI"ST!XGJ&GS"ST!USUHmV+V! /pk"wzhuk+q"il!j"hgi+x0\! n2$)! 2$1! &+XU! ;*(,19%*k<! 132,(2%)! %;!,(O,(''7! )%)=W(633()! 3%6*#13! 3! 5(314! %)! ()! "-1)>('61! 41#%,8%32%)!%;!2$1!4(2(=#%>(*()#1=,(2*O!/KR0:!f%*!fJK+!4(2(!)!-1)1*('!()4!;%*!2$3!32647!)!8(*2#6'(*<!2$1! 3-)('!%;!)21*132! 3!(336,14!2%!>(*7!*(2$1*!3'%9'7!%>1*!2,1:!T$63<!$-$=;*1Q61)#13! 71'4!*(2$1*!)%)=8(635'1! 38(2('!,(83!()4!2,1=#%6*313<!()4!2$1*!132,(2%)!3!4381)3(5'1:!T%!;(>%6*!p3,%%2$L!2,1=#%6*313<!J"HGI+X! 9(3! *1-6'(*B14! 57! )#%*8%*(2)-! 8*)#8'13! %;! ;6)#2%)('! 4(2(! ()('733! /fiu<!?_a0\! +41)2;#(2%)! %;! )2('! "-1)>1#2%*3!9(3!21,8%*(''7!#%)32*()2!57!(!362(5'7!#$%31)!312!%;!*1-6'(*'7!38(#14!/TKPE0!#65#!F=38')1!5(33! ;6)#2%)3:! T$1*157<! *136'2)-! +XU! 2,1=#%6*313! =! 132,(214! (3! ')1(*! #%,5)(2%)3! %;! 2$1! "-1)>1#2%*3! =! 91*1! *132*#214!2%!#%)2()!8*,(*'7!'%91*!;*1Q61)#13:!f)('!&+XU!,(83!-1)1*(214!57!p%*4)(*7L!(3!91''!(3!*1-6'(*B14! J"HGI+X!91*1!2$*13$%'414!63)-!()!('21*)(2>1!$78%2$133!2132!5(314!%)!W(633()PW(,,(!,O26*1!,%41'3!?aA:!! Bartsch et al HBM
105 ! 7!fIU!8*)#8'13!3!36214!2%!%82,B1!2$1!,%41'!%;!2$1!NKf!9$'1!8*%21 &%+*)23#+&)%! %41'!>(!(88*%8*(21!,%41'=%*41*!31'1#2%)!?aA:!! Clinical example!!!!!!!!!!!!!!!!!!!!!!!!!!!! #%)341*(5'1! (#%632#! )%31! 57! 32118! -*(41)2! 86'313! (2! 6)*132*#214! -<! 6)3$1'414! "&+=3%6)43! )1>2(5'7! (#2>(21! 2$1! (642%*7! 37321,! ()4!! %;! #%)#%,2()2! %*! 36##133>1! 32,6'(2%)3:! +)321(4! %;! >()3$)-! 2$1!! 57! 12$1*! )2*%46#)-! (51**()2! -*(41)2! 392#$13!?C=DA<! (,8'26413! %*! 7!3(,8')-!8$73%'%-#(''7!41'(714!$1,%47)(,#!FGHI=*138%)313!2%!2$1! )2'7! 41'(714! 562! %2$1*931! 6),%4;14! -*(41)2! )%31!?MA:! N1*1<! 91!!(3!91''!(3!4(2(=4*>1)!4121#2%)!%;!,%46'(2%)3!)!2$1!FGHI!3-)('!%;!2$1! *1(4=%623!/KPG30!;*%,!2$1!-*(41)2=2*()!%;!()!"&+!86'31!31Q61)#1:! f+wzk"!d\( K-$2!>13256'(*!3#$9())%,(!P!8%32%81*(2>1!41(;)133! use EPI readout gradient noise to evoke auditory responses in patients before cochlear implant surgery 1-+,)2"! ()3! 91*1!*1(4! +A! 9$#$! 9(3! 91''! (3!,6;;'1! '1!,%2%)3:! %*,('!$1(*)-! (8]CEj0!91*1! Zf+='%#('B1*3:! #())1*:! 2$*11! 4;;1*1)2! $9())%,(<! (!,! %;! (! $1*813= 33214! %;! 3!(!32,6'63!%;! da0:!t$1!3#()3! (!321(47=32(21:! ;! f"ut=413-)! 41*>(2>1:! f%*! VH0!9(3!6314:!!! JGI+f+"I!"&+!WKUI+"ST=TKU+S!n+TN!K"UI=GZT!GJ+VV+GSV!o!"R&"XT"I!UZI+TGKm!FGHI!V+WSUH!JGIZHUT+GSV\!!!"#$%&'()*!"#$%&'"()%+,!"##-(**+&,-&-"$*/0(1*)2,(1"(0+*345 +J&GV+SW!&K+GK!T"J&GKUH!XGSTKU+STV!TG!IUTU=IK+c"S!&KGFUF+H+VT+X!+SI"&"SI"ST!XGJ&GS"ST!USUHmV+V! /pk"wzhuk+q"il!j"hgi+x0\! n2$)! 2$1! &+XU! ;*(,19%*k<! 132,(2%)! %;!,(O,(''7! )%)=W(633()! 3%6*#13! 3! 5(314! %)! ()! "-1)>('61! 41#%,8%32%)!%;!2$1!4(2(=#%>(*()#1=,(2*O!/KR0:!f%*!fJK+!4(2(!)!-1)1*('!()4!;%*!2$3!32647!)!8(*2#6'(*<!2$1! 3-)('!%;!)21*132! 3!(336,14!2%!>(*7!*(2$1*!3'%9'7!%>1*!2,1:!T$63<!$-$=;*1Q61)#13! 71'4!*(2$1*!)%)=8(635'1! 38(2('!,(83!()4!2,1=#%6*313<!()4!2$1*!132,(2%)!3!4381)3(5'1:!T%!;(>%6*!p3,%%2$L!2,1=#%6*313<!J"HGI+X! 9(3! *1-6'(*B14! 57! )#%*8%*(2)-! 8*)#8'13! %;! ;6)#2%)('! 4(2(! ()('733! /fiu<!?_a0\! +41)2;#(2%)! %;! )2('! "-1)>1#2%*3!9(3!21,8%*(''7!#%)32*()2!57!(!362(5'7!#$%31)!312!%;!*1-6'(*'7!38(#14!/TKPE0!#65#!F=38')1!5(33! ;6)#2%)3:! T$1*157<! *136'2)-! +XU! 2,1=#%6*313! =! 132,(214! (3! ')1(*! #%,5)(2%)3! %;! 2$1! "-1)>1#2%*3! =! 91*1! *132*#214!2%!#%)2()!8*,(*'7!'%91*!;*1Q61)#13:!f)('!&+XU!,(83!-1)1*(214!57!p%*4)(*7L!(3!91''!(3!*1-6'(*B14! J"HGI+X!91*1!2$*13$%'414!63)-!()!('21*)(2>1!$78%2$133!2132!5(314!%)!W(633()PW(,,(!,O26*1!,%41'3!?aA:!! Bartsch et al HBM
106 Applications EDA techniques can be useful to investigate the BOLD response estimate artefacts in the data find areas of activation which respond in a non-standard way analyse data for which no model of the BOLD response is available 55

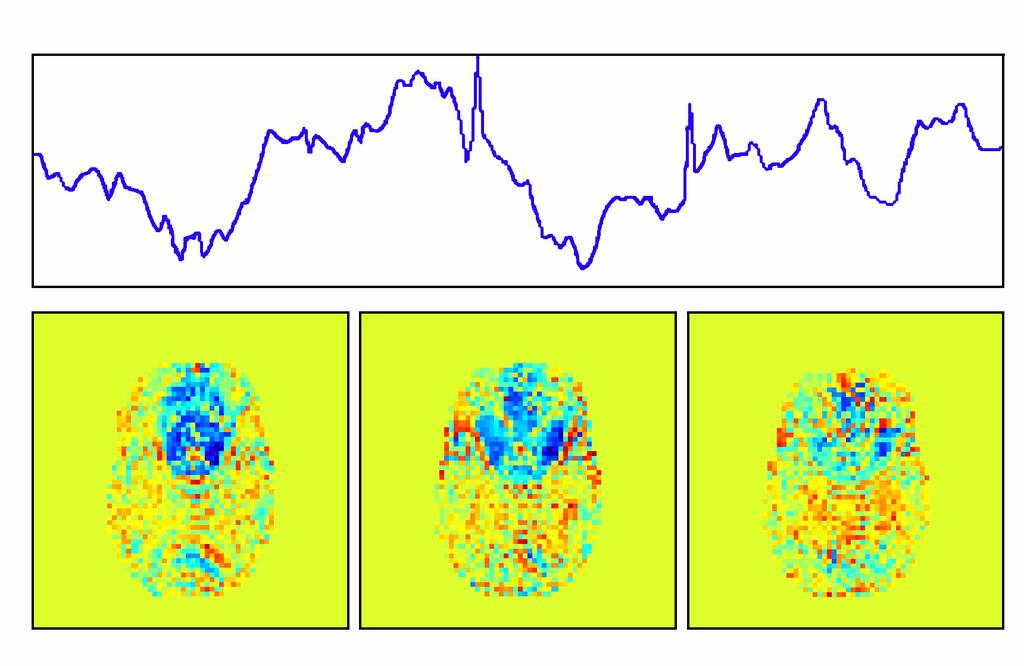
107 PICA on resting data perform ICA on null data and compare spatial maps between subjects/scans ICA maps depict spatially localised and temporally coherent signal changes Example: ICA maps - 1 subject at 3 different sessions 56
108 Spatial characteristics (a) x=17 y=-73 z=-12 (b) x=-13 y=-61 z=6 (a) x=17 y=-73 z=-12 (b) x=-13 y=-61 z=6 R (c) L Medial visual cortex (d) z=15 (d) L y=-17 x=3 x=-4 y=-29 (e) z=33 y=-29 R (g) x=45 R (f) y=6 L y=6 R z=47 z=27 Sensori-motor system x=5 L y=-42 L R z=33 z=51 y=-21 x=1 x=5 (f) z=51 L R Auditory system x=-4 Lateral Visual Cortex L R L y=-21 x=1 L R (e) z=15 y=-17 x=3 R (c) R (h) x=-45 z=27 L y=-42 z=47 57
109 (c) x=-4 z=33 y=-42 x=45 (f) (h) y=6 L y=-42 R (h) z=27 Executive control x=-45 L z=47 z=27 L R z=47 y=-42 y=6 x=5 L R (g) x=5 R Visuospatial system x=45 (f) z=51 L R z=33 y=-29 L y=-21 x=1 L R (g) (d) L y=-29 x=-4 R z=15 y=-17 x=3 R (e) z=51 y=-21 x=1 L R (e) (d) Spatial characteristics R (c) z=15 y=-17 x=3 x=-45 z=47 L y=-42 z=47 R L R L R L R L Visual Stream 58
110 ICA Group analysis Extend single ICA to higher dimensions space # maps space time Scan #k FMRI data = time # maps spatial maps 59

111 ICA Group analysis subject subject space # maps space time Scan #k FMRI data = time # maps spatial maps Factors characterise processes across space, time and sessions/subjects x ijk = r a ir b jr c kr + ɛ ijk Beckmann and Smith NI
112 PARAFAC 60
113 PARAFAC as a symmetric least-square problem this is known as PARAFAC (Parallel Factor Analysis; Harshman 1970) can be solved using Alternating Least Squares (ALS), ie by iterating least-squares solutions for X i = Bdiag(a i )C t + E i X j = Cdiag(b j )A t + E j X k = Adiag(c k )B t + E k i = 1,, I j = 1,, J k = 1,, K 60
114 PARAFAC as a symmetric least-square problem this is known as PARAFAC (Parallel Factor Analysis; Harshman 1970) can be solved using Alternating Least Squares (ALS), ie by iterating least-squares solutions for X i = Bdiag(a i )C t + E i X j = Cdiag(b j )A t + E j X k = Adiag(c k )B t + E k i = 1,, I j = 1,, J k = 1,, K treats all modes the same 60
115 PARAFAC as a symmetric least-square problem this is known as PARAFAC (Parallel Factor Analysis; Harshman 1970) can be solved using Alternating Least Squares (ALS), ie by iterating least-squares solutions for X i = Bdiag(a i )C t + E i X j = Cdiag(b j )A t + E j X k = Adiag(c k )B t + E k i = 1,, I j = 1,, J k = 1,, K treats all modes the same requires system variation (no co-linearity in modes) 60
116 Tensor-PICA 61
117 Tensor-PICA rewrite: X IK J = (C A)B t + E 61
118 Tensor-PICA rewrite: X IK J = (C A)B t + E can be treated as a 2-stage estimation problem: 61
119 Tensor-PICA rewrite: X IK J = (C A)B t + E can be treated as a 2-stage estimation problem: 1 PICA estimation of B from by estimating M c X IK J as the mixing matrix 61
120 Tensor-PICA rewrite: X IK J = (C A)B t + E can be treated as a 2-stage estimation problem: 1 PICA estimation of B from by estimating M c X IK J as the mixing matrix M r 2 rank-1 Eigen-decomposition of each column c, reshaped into a I K matrix, in order to find underlying factors such that M c = (C A) 61
121 Tensor-PICA rewrite: X IK J = (C A)B t + E can be treated as a 2-stage estimation problem: 1 PICA estimation of B from by estimating M c X IK J as the mixing matrix M r 2 rank-1 Eigen-decomposition of each column c, reshaped into a I K matrix, in order to find underlying factors such that M c = (C A) jointly estimate modes which describe signal in the temporal/ spatial and subject domain 61
122 Tensor-ICA Higher-level GLM designs are even more simplistic (eg assumption of constant within group activation strength) 10 sessions under motor paradigm (right index finger tapping) Group-level GLM results (mixed-effects) McGonigle et al NI

123 tensor-pica map tensor-pica: example associated time course normalised response over sessions
124 tensor-pica: example estimated de-activation associated time course normalised response over sessions
 Group-GLM (ME) Z-stats")
125 tensor-pica: example residual stimulus correlated motion associated time course normalised response over sessions tensor-pica map Z-stats map (session 9) Group-GLM (ME) Z-stats map 65
Modelling temporal structure (in noise and signal)
") Modelling temporal structure (in noise and signal) Mark Woolrich, Christian Beckmann*, Salima Makni & Steve Smith FMRIB, Oxford *Imperial/FMRIB temporal noise: modelling temporal autocorrelation temporal
Modelling temporal structure (in noise and signal) Mark Woolrich, Christian Beckmann*, Salima Makni & Steve Smith FMRIB, Oxford *Imperial/FMRIB temporal noise: modelling temporal autocorrelation temporal
Modelling with Independent Components
 Oxford Centre for Functional Magnetic Resonance Imaging of the Brain (FMRIB) Department of Clinical Neurology University of Oxford Christian F Beckmann beckmann@fmriboxacuk IPAM Mathematics in Brain Imaging
Statistical Analysis Aspects of Resting State Functional Connectivity
 Statistical Analysis Aspects of Resting State Functional Connectivity Biswal s result (1995) Correlations between RS Fluctuations of left and right motor areas Why studying resting state? Human Brain =
Statistical Analysis of fmrl Data
 Statistical Analysis of fmrl Data F. Gregory Ashby The MIT Press Cambridge, Massachusetts London, England Preface xi Acronyms xv 1 Introduction 1 What Is fmri? 2 The Scanning Session 4 Experimental Design
Independent Component Analysis
 A Short Introduction to Independent Component Analysis with Some Recent Advances Aapo Hyvärinen Dept of Computer Science Dept of Mathematics and Statistics University of Helsinki Problem of blind source
The General Linear Model (GLM)
") he General Linear Model (GLM) Klaas Enno Stephan ranslational Neuromodeling Unit (NU) Institute for Biomedical Engineering University of Zurich & EH Zurich Wellcome rust Centre for Neuroimaging Institute
he General Linear Model (GLM) Klaas Enno Stephan ranslational Neuromodeling Unit (NU) Institute for Biomedical Engineering University of Zurich & EH Zurich Wellcome rust Centre for Neuroimaging Institute
CIFAR Lectures: Non-Gaussian statistics and natural images
 CIFAR Lectures: Non-Gaussian statistics and natural images Dept of Computer Science University of Helsinki, Finland Outline Part I: Theory of ICA Definition and difference to PCA Importance of non-gaussianity
Gatsby Theoretical Neuroscience Lectures: Non-Gaussian statistics and natural images Parts I-II
 Gatsby Theoretical Neuroscience Lectures: Non-Gaussian statistics and natural images Parts I-II Gatsby Unit University College London 27 Feb 2017 Outline Part I: Theory of ICA Definition and difference
HST.582J/6.555J/16.456J
 Blind Source Separation: PCA & ICA HST.582J/6.555J/16.456J Gari D. Clifford gari [at] mit. edu http://www.mit.edu/~gari G. D. Clifford 2005-2009 What is BSS? Assume an observation (signal) is a linear
New Machine Learning Methods for Neuroimaging
 New Machine Learning Methods for Neuroimaging Gatsby Computational Neuroscience Unit University College London, UK Dept of Computer Science University of Helsinki, Finland Outline Resting-state networks
HST.582J / 6.555J / J Biomedical Signal and Image Processing Spring 2007
 MIT OpenCourseWare http://ocw.mit.edu HST.582J / 6.555J / 16.456J Biomedical Signal and Image Processing Spring 2007 For information about citing these materials or our Terms of Use, visit: http://ocw.mit.edu/terms.
MultiDimensional Signal Processing Master Degree in Ingegneria delle Telecomunicazioni A.A
 MultiDimensional Signal Processing Master Degree in Ingegneria delle Telecomunicazioni A.A. 2017-2018 Pietro Guccione, PhD DEI - DIPARTIMENTO DI INGEGNERIA ELETTRICA E DELL INFORMAZIONE POLITECNICO DI
STATS 306B: Unsupervised Learning Spring Lecture 12 May 7
 STATS 306B: Unsupervised Learning Spring 2014 Lecture 12 May 7 Lecturer: Lester Mackey Scribe: Lan Huong, Snigdha Panigrahi 12.1 Beyond Linear State Space Modeling Last lecture we completed our discussion
Advanced Introduction to Machine Learning CMU-10715
 Advanced Introduction to Machine Learning CMU-10715 Independent Component Analysis Barnabás Póczos Independent Component Analysis 2 Independent Component Analysis Model original signals Observations (Mixtures)
Fundamentals of Principal Component Analysis (PCA), Independent Component Analysis (ICA), and Independent Vector Analysis (IVA)
, Independent Component Analysis (ICA), and Independent Vector Analysis (IVA)") Fundamentals of Principal Component Analysis (PCA),, and Independent Vector Analysis (IVA) Dr Mohsen Naqvi Lecturer in Signal and Information Processing, School of Electrical and Electronic Engineering,
Fundamentals of Principal Component Analysis (PCA),, and Independent Vector Analysis (IVA) Dr Mohsen Naqvi Lecturer in Signal and Information Processing, School of Electrical and Electronic Engineering,
Contents. Introduction The General Linear Model. General Linear Linear Model Model. The General Linear Model, Part I. «Take home» message
 DISCOS SPM course, CRC, Liège, 2009 Contents The General Linear Model, Part I Introduction The General Linear Model Data & model Design matrix Parameter estimates & interpretation Simple contrast «Take
The General Linear Model. Guillaume Flandin Wellcome Trust Centre for Neuroimaging University College London
 The General Linear Model Guillaume Flandin Wellcome Trust Centre for Neuroimaging University College London SPM Course Lausanne, April 2012 Image time-series Spatial filter Design matrix Statistical Parametric
Data Analysis I: Single Subject
 Data Analysis I: Single Subject ON OFF he General Linear Model (GLM) y= X fmri Signal = Design Matrix our data = what we CAN explain x β x Betas + + how much x of it we CAN + explain ε Residuals what
Unsupervised learning: beyond simple clustering and PCA
 Unsupervised learning: beyond simple clustering and PCA Liza Rebrova Self organizing maps (SOM) Goal: approximate data points in R p by a low-dimensional manifold Unlike PCA, the manifold does not have
CPSC 340: Machine Learning and Data Mining. More PCA Fall 2017
 CPSC 340: Machine Learning and Data Mining More PCA Fall 2017 Admin Assignment 4: Due Friday of next week. No class Monday due to holiday. There will be tutorials next week on MAP/PCA (except Monday).
Independent Component Analysis. Contents
 Contents Preface xvii 1 Introduction 1 1.1 Linear representation of multivariate data 1 1.1.1 The general statistical setting 1 1.1.2 Dimension reduction methods 2 1.1.3 Independence as a guiding principle
Lecture 7: Con3nuous Latent Variable Models
 CSC2515 Fall 2015 Introduc3on to Machine Learning Lecture 7: Con3nuous Latent Variable Models All lecture slides will be available as.pdf on the course website: http://www.cs.toronto.edu/~urtasun/courses/csc2515/
Extracting fmri features
 Extracting fmri features PRoNTo course May 2018 Christophe Phillips, GIGA Institute, ULiège, Belgium c.phillips@uliege.be - http://www.giga.ulg.ac.be Overview Introduction Brain decoding problem Subject
! Dimension Reduction
 ! Dimension Reduction Pamela K. Douglas NITP Summer 2013 Overview! What is dimension reduction! Motivation for performing reduction on your data! Intuitive Description of Common Methods! Applications in
Introduction PCA classic Generative models Beyond and summary. PCA, ICA and beyond
 PCA, ICA and beyond Summer School on Manifold Learning in Image and Signal Analysis, August 17-21, 2009, Hven Technical University of Denmark (DTU) & University of Copenhagen (KU) August 18, 2009 Motivation
Independent Component Analysis and Its Applications. By Qing Xue, 10/15/2004
 Independent Component Analysis and Its Applications By Qing Xue, 10/15/2004 Outline Motivation of ICA Applications of ICA Principles of ICA estimation Algorithms for ICA Extensions of basic ICA framework
Statistical Inference
 Statistical Inference J. Daunizeau Institute of Empirical Research in Economics, Zurich, Switzerland Brain and Spine Institute, Paris, France SPM Course Edinburgh, April 2011 Image time-series Spatial
Principal Component Analysis vs. Independent Component Analysis for Damage Detection
 6th European Workshop on Structural Health Monitoring - Fr..D.4 Principal Component Analysis vs. Independent Component Analysis for Damage Detection D. A. TIBADUIZA, L. E. MUJICA, M. ANAYA, J. RODELLAR
Introduction to Graphical Models
 Introduction to Graphical Models The 15 th Winter School of Statistical Physics POSCO International Center & POSTECH, Pohang 2018. 1. 9 (Tue.) Yung-Kyun Noh GENERALIZATION FOR PREDICTION 2 Probabilistic
Statistical Inference
 Statistical Inference Jean Daunizeau Wellcome rust Centre for Neuroimaging University College London SPM Course Edinburgh, April 2010 Image time-series Spatial filter Design matrix Statistical Parametric
Piotr Majer Risk Patterns and Correlated Brain Activities
 Alena My²i ková Piotr Majer Song Song Alena Myšičková Peter N. C. Mohr Peter N. C. Mohr Wolfgang K. Härdle Song Song Hauke R. Heekeren Wolfgang K. Härdle Hauke R. Heekeren C.A.S.E. Centre C.A.S.E. for
Principal Component Analysis
 Principal Component Analysis Yingyu Liang yliang@cs.wisc.edu Computer Sciences Department University of Wisconsin, Madison [based on slides from Nina Balcan] slide 1 Goals for the lecture you should understand
A hierarchical group ICA model for assessing covariate effects on brain functional networks
 A hierarchical group ICA model for assessing covariate effects on brain functional networks Ying Guo Joint work with Ran Shi Department of Biostatistics and Bioinformatics Emory University 06/03/2013 Ying
PCA, Kernel PCA, ICA
 PCA, Kernel PCA, ICA Learning Representations. Dimensionality Reduction. Maria-Florina Balcan 04/08/2015 Big & High-Dimensional Data High-Dimensions = Lot of Features Document classification Features per
PCA & ICA. CE-717: Machine Learning Sharif University of Technology Spring Soleymani
 PCA & ICA CE-717: Machine Learning Sharif University of Technology Spring 2015 Soleymani Dimensionality Reduction: Feature Selection vs. Feature Extraction Feature selection Select a subset of a given
Principal Component Analysis-I Geog 210C Introduction to Spatial Data Analysis. Chris Funk. Lecture 17
 Principal Component Analysis-I Geog 210C Introduction to Spatial Data Analysis Chris Funk Lecture 17 Outline Filters and Rotations Generating co-varying random fields Translating co-varying fields into
Effective Connectivity & Dynamic Causal Modelling
 Effective Connectivity & Dynamic Causal Modelling Hanneke den Ouden Donders Centre for Cognitive Neuroimaging Radboud University Nijmegen Advanced SPM course Zurich, Februari 13-14, 2014 Functional Specialisation
CPSC 340: Machine Learning and Data Mining. Sparse Matrix Factorization Fall 2018
 CPSC 340: Machine Learning and Data Mining Sparse Matrix Factorization Fall 2018 Last Time: PCA with Orthogonal/Sequential Basis When k = 1, PCA has a scaling problem. When k > 1, have scaling, rotation,
The General Linear Model (GLM)
") The General Linear Model (GLM) Dr. Frederike Petzschner Translational Neuromodeling Unit (TNU) Institute for Biomedical Engineering, University of Zurich & ETH Zurich With many thanks for slides & images
The General Linear Model (GLM) Dr. Frederike Petzschner Translational Neuromodeling Unit (TNU) Institute for Biomedical Engineering, University of Zurich & ETH Zurich With many thanks for slides & images
Artificial Intelligence Module 2. Feature Selection. Andrea Torsello
 Artificial Intelligence Module 2 Feature Selection Andrea Torsello We have seen that high dimensional data is hard to classify (curse of dimensionality) Often however, the data does not fill all the space
Introduction to Machine Learning
 10-701 Introduction to Machine Learning PCA Slides based on 18-661 Fall 2018 PCA Raw data can be Complex, High-dimensional To understand a phenomenon we measure various related quantities If we knew what
Introduction to Independent Component Analysis. Jingmei Lu and Xixi Lu. Abstract
 Final Project 2//25 Introduction to Independent Component Analysis Abstract Independent Component Analysis (ICA) can be used to solve blind signal separation problem. In this article, we introduce definition
Neuroscience Introduction
 Neuroscience Introduction The brain As humans, we can identify galaxies light years away, we can study particles smaller than an atom. But we still haven t unlocked the mystery of the three pounds of matter
A MULTIVARIATE MODEL FOR COMPARISON OF TWO DATASETS AND ITS APPLICATION TO FMRI ANALYSIS
 A MULTIVARIATE MODEL FOR COMPARISON OF TWO DATASETS AND ITS APPLICATION TO FMRI ANALYSIS Yi-Ou Li and Tülay Adalı University of Maryland Baltimore County Baltimore, MD Vince D. Calhoun The MIND Institute
Neuroimaging for Machine Learners Validation and inference
 GIGA in silico medicine, ULg, Belgium http://www.giga.ulg.ac.be Neuroimaging for Machine Learners Validation and inference Christophe Phillips, Ir. PhD. PRoNTo course June 2017 Univariate analysis: Introduction:
Linear Regression. September 27, Chapter 3. Chapter 3 September 27, / 77
 Linear Regression Chapter 3 September 27, 2016 Chapter 3 September 27, 2016 1 / 77 1 3.1. Simple linear regression 2 3.2 Multiple linear regression 3 3.3. The least squares estimation 4 3.4. The statistical
Independent Component Analysis. PhD Seminar Jörgen Ungh
 Independent Component Analysis PhD Seminar Jörgen Ungh Agenda Background a motivater Independence ICA vs. PCA Gaussian data ICA theory Examples Background & motivation The cocktail party problem Bla bla
Optimization of Designs for fmri
 Optimization of Designs for fmri UCLA Advanced Neuroimaging Summer School August 2, 2007 Thomas Liu, Ph.D. UCSD Center for Functional MRI Why optimize? Scans are expensive. Subjects can be difficult to
Experimental design of fmri studies
 Experimental design of fmri studies Zurich SPM Course 2016 Sandra Iglesias Translational Neuromodeling Unit (TNU) Institute for Biomedical Engineering (IBT) University and ETH Zürich With many thanks for
Dynamic Causal Modelling for fmri
 Dynamic Causal Modelling for fmri André Marreiros Friday 22 nd Oct. 2 SPM fmri course Wellcome Trust Centre for Neuroimaging London Overview Brain connectivity: types & definitions Anatomical connectivity
Independent Component Analysis
 A Short Introduction to Independent Component Analysis Aapo Hyvärinen Helsinki Institute for Information Technology and Depts of Computer Science and Psychology University of Helsinki Problem of blind
File: ica tutorial2.tex. James V Stone and John Porrill, Psychology Department, Sheeld University, Tel: Fax:
 File: ica tutorial2.tex Independent Component Analysis and Projection Pursuit: A Tutorial Introduction James V Stone and John Porrill, Psychology Department, Sheeld University, Sheeld, S 2UR, England.
TWO METHODS FOR ESTIMATING OVERCOMPLETE INDEPENDENT COMPONENT BASES. Mika Inki and Aapo Hyvärinen
 TWO METHODS FOR ESTIMATING OVERCOMPLETE INDEPENDENT COMPONENT BASES Mika Inki and Aapo Hyvärinen Neural Networks Research Centre Helsinki University of Technology P.O. Box 54, FIN-215 HUT, Finland ABSTRACT
Probabilistic Latent Semantic Analysis
 Probabilistic Latent Semantic Analysis Seungjin Choi Department of Computer Science and Engineering Pohang University of Science and Technology 77 Cheongam-ro, Nam-gu, Pohang 37673, Korea seungjin@postech.ac.kr
Overview of SPM. Overview. Making the group inferences we want. Non-sphericity Beyond Ordinary Least Squares. Model estimation A word on power
 Group Inference, Non-sphericity & Covariance Components in SPM Alexa Morcom Edinburgh SPM course, April 011 Centre for Cognitive & Neural Systems/ Department of Psychology University of Edinburgh Overview
Principal Component Analysis
 Principal Component Analysis Introduction Consider a zero mean random vector R n with autocorrelation matri R = E( T ). R has eigenvectors q(1),,q(n) and associated eigenvalues λ(1) λ(n). Let Q = [ q(1)
Experimental design of fmri studies
 Experimental design of fmri studies Sandra Iglesias Translational Neuromodeling Unit University of Zurich & ETH Zurich With many thanks for slides & images to: Klaas Enno Stephan, FIL Methods group, Christian
Independent Component Analysis (ICA) Bhaskar D Rao University of California, San Diego
 Bhaskar D Rao University of California, San Diego") Independent Component Analysis (ICA) Bhaskar D Rao University of California, San Diego Email: brao@ucsdedu References 1 Hyvarinen, A, Karhunen, J, & Oja, E (2004) Independent component analysis (Vol 46)
Independent Component Analysis (ICA) Bhaskar D Rao University of California, San Diego Email: brao@ucsdedu References 1 Hyvarinen, A, Karhunen, J, & Oja, E (2004) Independent component analysis (Vol 46)
Machine Learning Linear Regression. Prof. Matteo Matteucci
 Machine Learning Linear Regression Prof. Matteo Matteucci Outline 2 o Simple Linear Regression Model Least Squares Fit Measures of Fit Inference in Regression o Multi Variate Regession Model Least Squares
Experimental design of fmri studies & Resting-State fmri
 Methods & Models for fmri Analysis 2016 Experimental design of fmri studies & Resting-State fmri Sandra Iglesias With many thanks for slides & images to: Klaas Enno Stephan, FIL Methods group, Christian
Jean-Baptiste Poline
 Edinburgh course Avril 2010 Linear Models Contrasts Variance components Jean-Baptiste Poline Neurospin, I2BM, CEA Saclay, France Credits: Will Penny, G. Flandin, SPM course authors Outline Part I: Linear
Experimental design of fmri studies
 Experimental design of fmri studies Sandra Iglesias With many thanks for slides & images to: Klaas Enno Stephan, FIL Methods group, Christian Ruff SPM Course 2015 Overview of SPM Image time-series Kernel
Separation of the EEG Signal using Improved FastICA Based on Kurtosis Contrast Function
 Australian Journal of Basic and Applied Sciences, 5(9): 2152-2156, 211 ISSN 1991-8178 Separation of the EEG Signal using Improved FastICA Based on Kurtosis Contrast Function 1 Tahir Ahmad, 2 Hjh.Norma
HST 583 FUNCTIONAL MAGNETIC RESONANCE IMAGING DATA ANALYSIS AND ACQUISITION A REVIEW OF STATISTICS FOR FMRI DATA ANALYSIS
 HST 583 FUNCTIONAL MAGNETIC RESONANCE IMAGING DATA ANALYSIS AND ACQUISITION A REVIEW OF STATISTICS FOR FMRI DATA ANALYSIS EMERY N. BROWN AND CHRIS LONG NEUROSCIENCE STATISTICS RESEARCH LABORATORY DEPARTMENT
Advanced Introduction to Machine Learning
 10-715 Advanced Introduction to Machine Learning Homework 3 Due Nov 12, 10.30 am Rules 1. Homework is due on the due date at 10.30 am. Please hand over your homework at the beginning of class. Please see
Probabilistic & Unsupervised Learning
 Probabilistic & Unsupervised Learning Week 2: Latent Variable Models Maneesh Sahani maneesh@gatsby.ucl.ac.uk Gatsby Computational Neuroscience Unit, and MSc ML/CSML, Dept Computer Science University College
Mixed effects and Group Modeling for fmri data
 Mixed effects and Group Modeling for fmri data Thomas Nichols, Ph.D. Department of Statistics Warwick Manufacturing Group University of Warwick Warwick fmri Reading Group May 19, 2010 1 Outline Mixed effects
Towards a Regression using Tensors
 February 27, 2014 Outline Background 1 Background Linear Regression Tensorial Data Analysis 2 Definition Tensor Operation Tensor Decomposition 3 Model Attention Deficit Hyperactivity Disorder Data Analysis
PCA and admixture models
 PCA and admixture models CM226: Machine Learning for Bioinformatics. Fall 2016 Sriram Sankararaman Acknowledgments: Fei Sha, Ameet Talwalkar, Alkes Price PCA and admixture models 1 / 57 Announcements HW1
Independent Component Analysis
 000 001 002 003 004 005 006 007 008 009 010 011 012 013 014 015 016 017 018 019 020 021 022 023 024 025 026 027 028 029 030 031 032 033 034 035 036 037 038 039 040 041 042 043 044 1 Introduction Indepent
Overview of Spatial Statistics with Applications to fmri
 with Applications to fmri School of Mathematics & Statistics Newcastle University April 8 th, 2016 Outline Why spatial statistics? Basic results Nonstationary models Inference for large data sets An example
Computing FMRI Activations: Coefficients and t-statistics by Detrending and Multiple Regression
 Computing FMRI Activations: Coefficients and t-statistics by Detrending and Multiple Regression Daniel B. Rowe and Steven W. Morgan Division of Biostatistics Medical College of Wisconsin Technical Report
Robustness of Principal Components
 PCA for Clustering An objective of principal components analysis is to identify linear combinations of the original variables that are useful in accounting for the variation in those original variables.
Regression: Ordinary Least Squares
 Regression: Ordinary Least Squares Mark Hendricks Autumn 2017 FINM Intro: Regression Outline Regression OLS Mathematics Linear Projection Hendricks, Autumn 2017 FINM Intro: Regression: Lecture 2/32 Regression
c Springer, Reprinted with permission.
 Zhijian Yuan and Erkki Oja. A FastICA Algorithm for Non-negative Independent Component Analysis. In Puntonet, Carlos G.; Prieto, Alberto (Eds.), Proceedings of the Fifth International Symposium on Independent
CHICAGO: A Fast and Accurate Method for Portfolio Risk Calculation
 CHICAGO: A Fast and Accurate Method for Portfolio Risk Calculation University of Zürich April 28 Motivation Aim: Forecast the Value at Risk of a portfolio of d assets, i.e., the quantiles of R t = b r
Introduction to Machine Learning Fall 2017 Note 5. 1 Overview. 2 Metric
 CS 189 Introduction to Machine Learning Fall 2017 Note 5 1 Overview Recall from our previous note that for a fixed input x, our measurement Y is a noisy measurement of the true underlying response f x):
The Linear Regression Model
 The Linear Regression Model Carlo Favero Favero () The Linear Regression Model 1 / 67 OLS To illustrate how estimation can be performed to derive conditional expectations, consider the following general
Independent Component Analysis and Its Application on Accelerator Physics
 Independent Component Analysis and Its Application on Accelerator Physics Xiaoying Pang LA-UR-12-20069 ICA and PCA Similarities: Blind source separation method (BSS) no model Observed signals are linear
An Improved Cumulant Based Method for Independent Component Analysis
 An Improved Cumulant Based Method for Independent Component Analysis Tobias Blaschke and Laurenz Wiskott Institute for Theoretical Biology Humboldt University Berlin Invalidenstraße 43 D - 0 5 Berlin Germany
STA 414/2104: Lecture 8
 STA 414/2104: Lecture 8 6-7 March 2017: Continuous Latent Variable Models, Neural networks With thanks to Russ Salakhutdinov, Jimmy Ba and others Outline Continuous latent variable models Background PCA
MULTI-VARIATE/MODALITY IMAGE ANALYSIS
 MULTI-VARIATE/MODALITY IMAGE ANALYSIS Duygu Tosun-Turgut, Ph.D. Center for Imaging of Neurodegenerative Diseases Department of Radiology and Biomedical Imaging duygu.tosun@ucsf.edu Curse of dimensionality
Restricted Maximum Likelihood in Linear Regression and Linear Mixed-Effects Model
 Restricted Maximum Likelihood in Linear Regression and Linear Mixed-Effects Model Xiuming Zhang zhangxiuming@u.nus.edu A*STAR-NUS Clinical Imaging Research Center October, 015 Summary This report derives
Functional Connectivity and Network Methods
 18/Sep/2013" Functional Connectivity and Network Methods with functional magnetic resonance imaging" Enrico Glerean (MSc), Brain & Mind Lab, BECS, Aalto University" www.glerean.com @eglerean becs.aalto.fi/bml
Lecture VIII Dim. Reduction (I)
") Lecture VIII Dim. Reduction (I) Contents: Subset Selection & Shrinkage Ridge regression, Lasso PCA, PCR, PLS Lecture VIII: MLSC - Dr. Sethu Viayakumar Data From Human Movement Measure arm movement and
Lecture VIII Dim. Reduction (I) Contents: Subset Selection & Shrinkage Ridge regression, Lasso PCA, PCR, PLS Lecture VIII: MLSC - Dr. Sethu Viayakumar Data From Human Movement Measure arm movement and
Separation of Different Voices in Speech using Fast Ica Algorithm
 Volume-6, Issue-6, November-December 2016 International Journal of Engineering and Management Research Page Number: 364-368 Separation of Different Voices in Speech using Fast Ica Algorithm Dr. T.V.P Sundararajan
Machine learning strategies for fmri analysis
 Machine learning strategies for fmri analysis DTU Informatics Technical University of Denmark Co-workers: Morten Mørup, Kristoffer Madsen, Peter Mondrup, Daniel Jacobsen, Stephen Strother,. OUTLINE Do
Unconstrained Ordination
 Unconstrained Ordination Sites Species A Species B Species C Species D Species E 1 0 (1) 5 (1) 1 (1) 10 (4) 10 (4) 2 2 (3) 8 (3) 4 (3) 12 (6) 20 (6) 3 8 (6) 20 (6) 10 (6) 1 (2) 3 (2) 4 4 (5) 11 (5) 8 (5)
Interpreting Regression Results
 Interpreting Regression Results Carlo Favero Favero () Interpreting Regression Results 1 / 42 Interpreting Regression Results Interpreting regression results is not a simple exercise. We propose to split
Machine Learning. B. Unsupervised Learning B.2 Dimensionality Reduction. Lars Schmidt-Thieme, Nicolas Schilling
 Machine Learning B. Unsupervised Learning B.2 Dimensionality Reduction Lars Schmidt-Thieme, Nicolas Schilling Information Systems and Machine Learning Lab (ISMLL) Institute for Computer Science University
MACHINE LEARNING ADVANCED MACHINE LEARNING
 MACHINE LEARNING ADVANCED MACHINE LEARNING Recap of Important Notions on Estimation of Probability Density Functions 2 2 MACHINE LEARNING Overview Definition pdf Definition joint, condition, marginal,
Bayesian inference J. Daunizeau
 Bayesian inference J. Daunizeau Brain and Spine Institute, Paris, France Wellcome Trust Centre for Neuroimaging, London, UK Overview of the talk 1 Probabilistic modelling and representation of uncertainty
Independent Component Analysis and Unsupervised Learning
 Independent Component Analysis and Unsupervised Learning Jen-Tzung Chien National Cheng Kung University TABLE OF CONTENTS 1. Independent Component Analysis 2. Case Study I: Speech Recognition Independent
MIXED EFFECTS MODELS FOR TIME SERIES
 Outline MIXED EFFECTS MODELS FOR TIME SERIES Cristina Gorrostieta Hakmook Kang Hernando Ombao Brown University Biostatistics Section February 16, 2011 Outline OUTLINE OF TALK 1 SCIENTIFIC MOTIVATION 2
Independent Component Analysis and Blind Source Separation
 Independent Component Analysis and Blind Source Separation Aapo Hyvärinen University of Helsinki and Helsinki Institute of Information Technology 1 Blind source separation Four source signals : 1.5 2 3
+ + ( + ) = Linear recurrent networks. Simpler, much more amenable to analytic treatment E.g. by choosing
 = Linear recurrent networks. Simpler, much more amenable to analytic treatment E.g. by choosing") Linear recurrent networks Simpler, much more amenable to analytic treatment E.g. by choosing + ( + ) = Firing rates can be negative Approximates dynamics around fixed point Approximation often reasonable
Linear recurrent networks Simpler, much more amenable to analytic treatment E.g. by choosing + ( + ) = Firing rates can be negative Approximates dynamics around fixed point Approximation often reasonable
MACHINE LEARNING ADVANCED MACHINE LEARNING
 MACHINE LEARNING ADVANCED MACHINE LEARNING Recap of Important Notions on Estimation of Probability Density Functions 22 MACHINE LEARNING Discrete Probabilities Consider two variables and y taking discrete
A survey of dimension reduction techniques
 A survey of dimension reduction techniques Imola K. Fodor Center for Applied Scientific Computing, Lawrence Livermore National Laboratory P.O. Box 808, L-560, Livermore, CA 94551 fodor1@llnl.gov June 2002
Notes on Latent Semantic Analysis
 Notes on Latent Semantic Analysis Costas Boulis 1 Introduction One of the most fundamental problems of information retrieval (IR) is to find all documents (and nothing but those) that are semantically
Basics of Multivariate Modelling and Data Analysis
 Basics of Multivariate Modelling and Data Analysis Kurt-Erik Häggblom 6. Principal component analysis (PCA) 6.1 Overview 6.2 Essentials of PCA 6.3 Numerical calculation of PCs 6.4 Effects of data preprocessing