Principal Component Analysis-I Geog 210C Introduction to Spatial Data Analysis. Chris Funk. Lecture 17
|
|
|
- Shona Cain
- 5 years ago
- Views:
Transcription
1 Principal Component Analysis-I Geog 210C Introduction to Spatial Data Analysis Chris Funk Lecture 17
2 Outline Filters and Rotations Generating co-varying random fields Translating co-varying fields into independent data sets Principal Components and Empirical Orthogonal Functions Singular Value Decomposition The rank order of a data set how many degrees of freedom are there really? Examples - PCA 2
3 Class Calendar Classes Tuesday May 24 th Principal Components I Thursday May 26 th Principal Components II Lab - Principal Components Tuesday May 31 st Simulating Structured Data Thursday Empirical Orthogonal Distance Functions No Final 3

4 Revisit to Block Kriging-I 4
5 Revisit to Block Kriging-II SPI - 1 sd Avg SPI SPI + 1 sd Lower 95% Bound Mean SPI Upper 95% Bound
6 Backwards and Forwards decompositions Many Correlated Data Uncorrelated components Covariance Matrix De/composition 6 In general, given a set of correlated (covarying) data, of rank n, the covariance matrix can be used to translate this data into a set of n independent vectors While bearing many names, these independent vectors are often called principal components Because these components are uncorrelated They can be easily used in statistical estimation, significance testing, etc. The components can compactly describe multivariate datasets Sometimes (but sometimes not) the components can correspond to real things in the real world We can also go the other way: given a set of independent (uncorrelated) vectors, we can impose a specific correlation structure, creating a set of n C. dependent Funk Geog 210C vectors Spring 2011
7 Simulating co-varying data I Types of covarying data: Different process types, with interacting effects e.g. Weight and height Similar process types with spatial or temporal persistence Auto-regressive or moving average temporal process Correlated random fields in time Spatially co-varying processes Correlated random fields in time One way to simulate covariance is by a Choleski decomposition of the covariance matrix (C) The Cholesky decomposition (U) is like the square root of a matrix C = LU = U T U L U C 7 a 0 0 x b 0 y z c X a x y 0 b z 0 0 c = σ 1 σ 2,3 σ 1,3 σ 1,2 σ 2 σ 2,3 σ 1,3 σ 1,2 σ 3
8 Simulating co-varying data II Z Given a matrix Z of uncorrelated vectors, we can transform them into a new dataset (X) with covariance C by multiplying Z by U d 1 e 1 f 1 d 2 b 2 f 2 d n e n f n U A x y X 0 b z = 0 0 c d 1 a d 1 x+e 1 b yd 1 +e 1 z+f 1 c d 2 a d 2 x+e 2 b yd 2 +e 2 z+f 2 c d n a d n x+e n b yd n +e n z+f n c X Example spreadsheet: Here 8
9 Potential Application: Simulating time-series We can model many time-series by assuming they are a combination of lagged information + plus a random walk: 1 st order auto-regressive function (AR1) y t = b 1 y t-1 + z 2 nd st order auto-regressive function (AR2) y t = b 1 y t-1 + b 2 y t-2 +z 3 rd order auto-regressive function (AR3) y t = b 1 y t-1 + b 2 y t-2 + b 3 y t-3 + z The terms b 1, b 2 b n specify the temporal autocorrelation 9
10 Principal Component Analysis Also referred to as empirical orthogonal functions and factor analysis Translates a multivariate set of data into a set of uncorrelated principal components, such that The 1 st (and each successive component) explains the most variance possible X PC scores PC loadings d 1 e 1 f 1 d 2 b 2 f 2 d n e n f n = PC1 1 PC2 1. PC3 1 PC1 2 PC2 2. PC3 2 PC1 n PC1 n PC1 n X w d PC1 w d PC2 w d PC3 w e PC1 w e PC2 w e PC3 w n PC1 w n PC2 w e PCN 1 0
11 Formal Definition Let X be a centered multivariate dataset with m variables (columns) and n observations (rows) Let ε 1 be an m-length vector defining the pattern that explains the most variance in X ε 1 essentially describes a set of slopes along each variable in m-space Constrain the unit norm of ε 1 to unity ε 1 (Σε 12 )^0.5 = (ε 1T ε 1 )^0.5 = 1 Now find ε 1 that explains the most error by minimizing the residual Residual=E( X- Xε 1 2 ) 11
12 Bases of linear analysis A collection of vectors forms a linear basis for an m- dimensional vector space V if for any vector a in V there exists a set of coefficients a, I = 1. M such that a = Σ (α i ε i ) An orthogonal basis is a linear basis consisting of vectors ε i that are mutually orthogonal, i.e. ε it ε j = 0, for i j The set of vectors are orthonormal if ε i (Σε i2 )^0.5 = (ε it ε i )^0.5 = 1 For all i = 1 m 1 2
13 Eigenvalues and Eigenvectors-I The PCA transform is derived by decomposing the covariance matrix into its eigenvectors and eigenvalues Eigenvalues and Eigenvectors If C is an m by m matrix, then the number λ is said to be an eigenvalue of C if Cε = λ ε The vector ε is said to be an eigenvector of C ε uniquely determines a direction in the m-dimensional data space We can use eigenvalues and eigenvectors to solve for our PCA components Let E be a matrix of eigenvectors [ε 1, ε 2, ε m ] Let Λ be a diagonal matrix with the eigenvalues along the diagonal, Λ i,i = λ i Now C = EΛE Each eigenvalue is proportional to the total variance explained by the i th component 1 3
14 Eigenvalues and Eigenvectors-II The Eigenvector matrix has the property of being uncorrelated E T E= EE T = I I is the identity matrix Since the off-diagonal components are zero, the resulting PC timeseries will be uncorrelated ε i that are mutually orthogonal, i.e. ε it ε j = 0, for i j The set of vectors are orthonormal if ε i (Σε i2 )^0.5 = (ε it ε i )^0.5 = 1 For all i = 1 m Eigenvalues and Eigenvectors If C is an m by m matrix, then the number λ is said to be an eigenvalue of C if Cε = λ ε The vector ε is said to be an eigenvector of C ε uniquely determines a direction in the m-dimensional data space We can use eigenvalues and eigenvectors to solve for our PCA components Let E be a matrix of eigenvalues [ε 1, ε 2, ε m ] 1 4 Let Λ be a diagonal matrix with the eigenvalues along the diagonal, Λ i,i = λ i Now C = EΛE Each eigenvalue is proportional to the total variance explained by the i th component
15 PC Example Correlated data - I Covariance Matrix Data1 Data2 Data3 Data Data Data Importance of components: Comp.1 Comp.2 Comp.3 Standard deviation Proportion of Variance Cumulative Proportion
16 PC Example Correlated data - II Loadings: Comp.1 Comp.2 Comp.3 Data Data Data Comp.1 Comp.2 Comp.3 [1,] [2,] [3,]


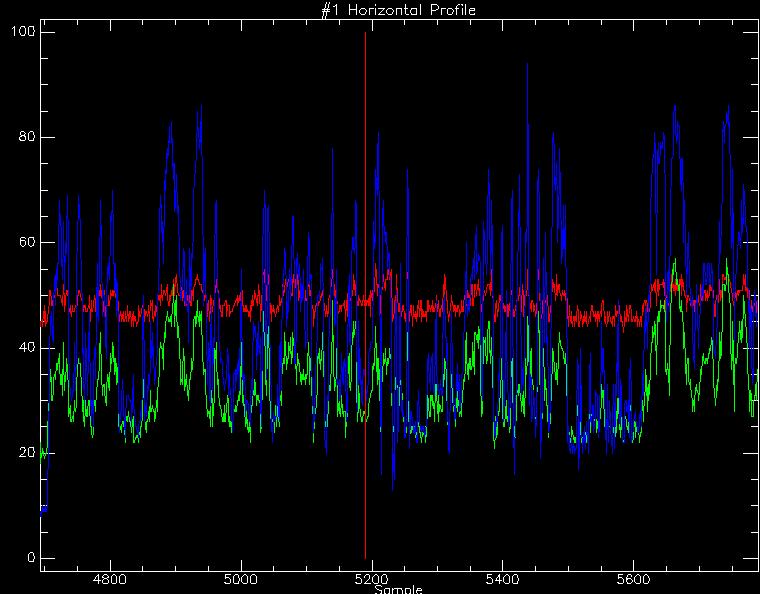
17 Example Landsat PCs Blue µ Green µ Red µ Near IR µ SW IR µ 1 7

18 Band 1, 3, 5 as RGB 1 8
19 Correlation Matrix & Eigenvectors Correlation Blue Green Red NIR SW IR Band Band Band Band Band Eigenvector Blue Green Red NIR SW IR Brightness Greenness PC1 = Brightness = R+G+B+SW IR + NIR PC2 = Greenness = R+G+B - SW IR - NIR 1 9


20 PC1 & PC2 PC1 = Brightness = R+G+B+SW IR + NIR PC2 = Greenness = R+G+B - SW IR - NIR PC1 = Red and Green PC2 = Blue 2 0
Multivariate Statistical Analysis
 Multivariate Statistical Analysis Fall 2011 C. L. Williams, Ph.D. Lecture 4 for Applied Multivariate Analysis Outline 1 Eigen values and eigen vectors Characteristic equation Some properties of eigendecompositions
Principal Components Analysis (PCA)
") Principal Components Analysis (PCA) Principal Components Analysis (PCA) a technique for finding patterns in data of high dimension Outline:. Eigenvectors and eigenvalues. PCA: a) Getting the data b) Centering
Principal Components Analysis (PCA) Principal Components Analysis (PCA) a technique for finding patterns in data of high dimension Outline:. Eigenvectors and eigenvalues. PCA: a) Getting the data b) Centering
PRINCIPAL COMPONENT ANALYSIS
 PRINCIPAL COMPONENT ANALYSIS 1 INTRODUCTION One of the main problems inherent in statistics with more than two variables is the issue of visualising or interpreting data. Fortunately, quite often the problem
Chapter 4: Factor Analysis
 Chapter 4: Factor Analysis In many studies, we may not be able to measure directly the variables of interest. We can merely collect data on other variables which may be related to the variables of interest.
Structure in Data. A major objective in data analysis is to identify interesting features or structure in the data.
 Structure in Data A major objective in data analysis is to identify interesting features or structure in the data. The graphical methods are very useful in discovering structure. There are basically two
Eigenvalues, Eigenvectors, and an Intro to PCA
 Eigenvalues, Eigenvectors, and an Intro to PCA Eigenvalues, Eigenvectors, and an Intro to PCA Changing Basis We ve talked so far about re-writing our data using a new set of variables, or a new basis.
Eigenvalues, Eigenvectors, and an Intro to PCA
 Eigenvalues, Eigenvectors, and an Intro to PCA Eigenvalues, Eigenvectors, and an Intro to PCA Changing Basis We ve talked so far about re-writing our data using a new set of variables, or a new basis.
STATISTICAL LEARNING SYSTEMS
 STATISTICAL LEARNING SYSTEMS LECTURE 8: UNSUPERVISED LEARNING: FINDING STRUCTURE IN DATA Institute of Computer Science, Polish Academy of Sciences Ph. D. Program 2013/2014 Principal Component Analysis
Principle Components Analysis (PCA) Relationship Between a Linear Combination of Variables and Axes Rotation for PCA
 Relationship Between a Linear Combination of Variables and Axes Rotation for PCA") Principle Components Analysis (PCA) Relationship Between a Linear Combination of Variables and Axes Rotation for PCA Principle Components Analysis: Uses one group of variables (we will call this X) In
Principle Components Analysis (PCA) Relationship Between a Linear Combination of Variables and Axes Rotation for PCA Principle Components Analysis: Uses one group of variables (we will call this X) In
18.S096 Problem Set 7 Fall 2013 Factor Models Due Date: 11/14/2013. [ ] variance: E[X] =, and Cov[X] = Σ = =
![18.S096 Problem Set 7 Fall 2013 Factor Models Due Date: 11/14/2013. [ ] variance: E[X] =, and Cov[X] = Σ = =](/thumbs/82/85647425.jpg "18.S096 Problem Set 7 Fall 2013 Factor Models Due Date: 11/14/2013. [ ] variance: E[X] =, and Cov[X] = Σ = =") 18.S096 Problem Set 7 Fall 2013 Factor Models Due Date: 11/14/2013 1. Consider a bivariate random variable: [ ] X X = 1 X 2 with mean and co [ ] variance: [ ] [ α1 Σ 1,1 Σ 1,2 σ 2 ρσ 1 σ E[X] =, and Cov[X]
18.S096 Problem Set 7 Fall 2013 Factor Models Due Date: 11/14/2013 1. Consider a bivariate random variable: [ ] X X = 1 X 2 with mean and co [ ] variance: [ ] [ α1 Σ 1,1 Σ 1,2 σ 2 ρσ 1 σ E[X] =, and Cov[X]
Factor models. March 13, 2017
 Factor models March 13, 2017 Factor Models Macro economists have a peculiar data situation: Many data series, but usually short samples How can we utilize all this information without running into degrees
GEOG 4110/5100 Advanced Remote Sensing Lecture 15
 GEOG 4110/5100 Advanced Remote Sensing Lecture 15 Principal Component Analysis Relevant reading: Richards. Chapters 6.3* http://www.ce.yildiz.edu.tr/personal/songul/file/1097/principal_components.pdf *For
Introduction to Machine Learning
 10-701 Introduction to Machine Learning PCA Slides based on 18-661 Fall 2018 PCA Raw data can be Complex, High-dimensional To understand a phenomenon we measure various related quantities If we knew what
Principal Component Analysis. Applied Multivariate Statistics Spring 2012
 Principal Component Analysis Applied Multivariate Statistics Spring 2012 Overview Intuition Four definitions Practical examples Mathematical example Case study 2 PCA: Goals Goal 1: Dimension reduction
COMP6237 Data Mining Covariance, EVD, PCA & SVD. Jonathon Hare
 COMP6237 Data Mining Covariance, EVD, PCA & SVD Jonathon Hare jsh2@ecs.soton.ac.uk Variance and Covariance Random Variables and Expected Values Mathematicians talk variance (and covariance) in terms of
VAR Model. (k-variate) VAR(p) model (in the Reduced Form): Y t-2. Y t-1 = A + B 1. Y t + B 2. Y t-p. + ε t. + + B p. where:
 VAR(p) model (in the Reduced Form): Y t-2. Y t-1 = A + B 1. Y t + B 2. Y t-p. + ε t. + + B p. where:") VAR Model (k-variate VAR(p model (in the Reduced Form: where: Y t = A + B 1 Y t-1 + B 2 Y t-2 + + B p Y t-p + ε t Y t = (y 1t, y 2t,, y kt : a (k x 1 vector of time series variables A: a (k x 1 vector
VAR Model (k-variate VAR(p model (in the Reduced Form: where: Y t = A + B 1 Y t-1 + B 2 Y t-2 + + B p Y t-p + ε t Y t = (y 1t, y 2t,, y kt : a (k x 1 vector of time series variables A: a (k x 1 vector
Dimensionality Reduction: PCA. Nicholas Ruozzi University of Texas at Dallas
 Dimensionality Reduction: PCA Nicholas Ruozzi University of Texas at Dallas Eigenvalues λ is an eigenvalue of a matrix A R n n if the linear system Ax = λx has at least one non-zero solution If Ax = λx
Lecture 8. Principal Component Analysis. Luigi Freda. ALCOR Lab DIAG University of Rome La Sapienza. December 13, 2016
 Lecture 8 Principal Component Analysis Luigi Freda ALCOR Lab DIAG University of Rome La Sapienza December 13, 2016 Luigi Freda ( La Sapienza University) Lecture 8 December 13, 2016 1 / 31 Outline 1 Eigen
Principal Components Theory Notes
 Principal Components Theory Notes Charles J. Geyer August 29, 2007 1 Introduction These are class notes for Stat 5601 (nonparametrics) taught at the University of Minnesota, Spring 2006. This not a theory
Learning with Singular Vectors
 Learning with Singular Vectors CIS 520 Lecture 30 October 2015 Barry Slaff Based on: CIS 520 Wiki Materials Slides by Jia Li (PSU) Works cited throughout Overview Linear regression: Given X, Y find w:
Factor models. May 11, 2012
 Factor models May 11, 2012 Factor Models Macro economists have a peculiar data situation: Many data series, but usually short samples How can we utilize all this information without running into degrees
Chapter 3 Transformations
 Chapter 3 Transformations An Introduction to Optimization Spring, 2014 Wei-Ta Chu 1 Linear Transformations A function is called a linear transformation if 1. for every and 2. for every If we fix the bases
Signal Analysis. Principal Component Analysis
 Multi dimensional Signal Analysis Lecture 2E Principal Component Analysis Subspace representation Note! Given avector space V of dimension N a scalar product defined by G 0 a subspace U of dimension M
Machine Learning 2nd Edition
 INTRODUCTION TO Lecture Slides for Machine Learning 2nd Edition ETHEM ALPAYDIN, modified by Leonardo Bobadilla and some parts from http://www.cs.tau.ac.il/~apartzin/machinelearning/ The MIT Press, 2010
Designing Information Devices and Systems II Fall 2015 Note 5
 EE 16B Designing Information Devices and Systems II Fall 01 Note Lecture given by Babak Ayazifar (9/10) Notes by: Ankit Mathur Spectral Leakage Example Compute the length-8 and length-6 DFT for the following
Principal Component Analysis (PCA) Theory, Practice, and Examples
 Theory, Practice, and Examples") Principal Component Analysis (PCA) Theory, Practice, and Examples Data Reduction summarization of data with many (p) variables by a smaller set of (k) derived (synthetic, composite) variables. p k n A
Principal Component Analysis (PCA) Theory, Practice, and Examples Data Reduction summarization of data with many (p) variables by a smaller set of (k) derived (synthetic, composite) variables. p k n A
MultiDimensional Signal Processing Master Degree in Ingegneria delle Telecomunicazioni A.A
 MultiDimensional Signal Processing Master Degree in Ingegneria delle elecomunicazioni A.A. 015-016 Pietro Guccione, PhD DEI - DIPARIMENO DI INGEGNERIA ELERICA E DELL INFORMAZIONE POLIECNICO DI BARI Pietro
Mathematical foundations - linear algebra
 Mathematical foundations - linear algebra Andrea Passerini passerini@disi.unitn.it Machine Learning Vector space Definition (over reals) A set X is called a vector space over IR if addition and scalar
Principal component analysis
 Principal component analysis Angela Montanari 1 Introduction Principal component analysis (PCA) is one of the most popular multivariate statistical methods. It was first introduced by Pearson (1901) and
MultiDimensional Signal Processing Master Degree in Ingegneria delle Telecomunicazioni A.A
 MultiDimensional Signal Processing Master Degree in Ingegneria delle Telecomunicazioni A.A. 2017-2018 Pietro Guccione, PhD DEI - DIPARTIMENTO DI INGEGNERIA ELETTRICA E DELL INFORMAZIONE POLITECNICO DI
Lecture 13. Principal Component Analysis. Brett Bernstein. April 25, CDS at NYU. Brett Bernstein (CDS at NYU) Lecture 13 April 25, / 26
 Lecture 13 April 25, / 26") Principal Component Analysis Brett Bernstein CDS at NYU April 25, 2017 Brett Bernstein (CDS at NYU) Lecture 13 April 25, 2017 1 / 26 Initial Question Intro Question Question Let S R n n be symmetric. 1
Principal Component Analysis Brett Bernstein CDS at NYU April 25, 2017 Brett Bernstein (CDS at NYU) Lecture 13 April 25, 2017 1 / 26 Initial Question Intro Question Question Let S R n n be symmetric. 1
Data Mining Lecture 4: Covariance, EVD, PCA & SVD
 Data Mining Lecture 4: Covariance, EVD, PCA & SVD Jo Houghton ECS Southampton February 25, 2019 1 / 28 Variance and Covariance - Expectation A random variable takes on different values due to chance The
Matrix decompositions
 Matrix decompositions Zdeněk Dvořák May 19, 2015 Lemma 1 (Schur decomposition). If A is a symmetric real matrix, then there exists an orthogonal matrix Q and a diagonal matrix D such that A = QDQ T. The
Dimensionality Reduction Techniques (DRT)
") Dimensionality Reduction Techniques (DRT) Introduction: Sometimes we have lot of variables in the data for analysis which create multidimensional matrix. To simplify calculation and to get appropriate,
Dimensionality Reduction Techniques (DRT) Introduction: Sometimes we have lot of variables in the data for analysis which create multidimensional matrix. To simplify calculation and to get appropriate,
1 Principal Components Analysis
 Lecture 3 and 4 Sept. 18 and Sept.20-2006 Data Visualization STAT 442 / 890, CM 462 Lecture: Ali Ghodsi 1 Principal Components Analysis Principal components analysis (PCA) is a very popular technique for
CS281 Section 4: Factor Analysis and PCA
 CS81 Section 4: Factor Analysis and PCA Scott Linderman At this point we have seen a variety of machine learning models, with a particular emphasis on models for supervised learning. In particular, we
Principal Component Analysis
 CSci 5525: Machine Learning Dec 3, 2008 The Main Idea Given a dataset X = {x 1,..., x N } The Main Idea Given a dataset X = {x 1,..., x N } Find a low-dimensional linear projection The Main Idea Given
Linear regression methods
 Linear regression methods Most of our intuition about statistical methods stem from linear regression. For observations i = 1,..., n, the model is Y i = p X ij β j + ε i, j=1 where Y i is the response
Example Linear Algebra Competency Test
 Example Linear Algebra Competency Test The 4 questions below are a combination of True or False, multiple choice, fill in the blank, and computations involving matrices and vectors. In the latter case,
Gopalkrishna Veni. Project 4 (Active Shape Models)
") Gopalkrishna Veni Project 4 (Active Shape Models) Introduction Active shape Model (ASM) is a technique of building a model by learning the variability patterns from training datasets. ASMs try to deform
Gopalkrishna Veni Project 4 (Active Shape Models) Introduction Active shape Model (ASM) is a technique of building a model by learning the variability patterns from training datasets. ASMs try to deform
MATH 829: Introduction to Data Mining and Analysis Principal component analysis
 1/11 MATH 829: Introduction to Data Mining and Analysis Principal component analysis Dominique Guillot Departments of Mathematical Sciences University of Delaware April 4, 2016 Motivation 2/11 High-dimensional
Multivariate Statistics (I) 2. Principal Component Analysis (PCA)
 2. Principal Component Analysis (PCA)") Multivariate Statistics (I) 2. Principal Component Analysis (PCA) 2.1 Comprehension of PCA 2.2 Concepts of PCs 2.3 Algebraic derivation of PCs 2.4 Selection and goodness-of-fit of PCs 2.5 Algebraic derivation
Multivariate Statistics (I) 2. Principal Component Analysis (PCA) 2.1 Comprehension of PCA 2.2 Concepts of PCs 2.3 Algebraic derivation of PCs 2.4 Selection and goodness-of-fit of PCs 2.5 Algebraic derivation
PCA, Kernel PCA, ICA
 PCA, Kernel PCA, ICA Learning Representations. Dimensionality Reduction. Maria-Florina Balcan 04/08/2015 Big & High-Dimensional Data High-Dimensions = Lot of Features Document classification Features per
Dimension reduction, PCA & eigenanalysis Based in part on slides from textbook, slides of Susan Holmes. October 3, Statistics 202: Data Mining
 Dimension reduction, PCA & eigenanalysis Based in part on slides from textbook, slides of Susan Holmes October 3, 2012 1 / 1 Combinations of features Given a data matrix X n p with p fairly large, it can
Eigenvalues and diagonalization
 Eigenvalues and diagonalization Patrick Breheny November 15 Patrick Breheny BST 764: Applied Statistical Modeling 1/20 Introduction The next topic in our course, principal components analysis, revolves
1 Singular Value Decomposition and Principal Component
 Singular Value Decomposition and Principal Component Analysis In these lectures we discuss the SVD and the PCA, two of the most widely used tools in machine learning. Principal Component Analysis (PCA)
Space-time data. Simple space-time analyses. PM10 in space. PM10 in time
 Space-time data Observations taken over space and over time Z(s, t): indexed by space, s, and time, t Here, consider geostatistical/time data Z(s, t) exists for all locations and all times May consider
Statistics 910, #5 1. Regression Methods
 Statistics 910, #5 1 Overview Regression Methods 1. Idea: effects of dependence 2. Examples of estimation (in R) 3. Review of regression 4. Comparisons and relative efficiencies Idea Decomposition Well-known
Quantitative Understanding in Biology Principal Components Analysis
 Quantitative Understanding in Biology Principal Components Analysis Introduction Throughout this course we have seen examples of complex mathematical phenomena being represented as linear combinations
Numerical Methods I Singular Value Decomposition
 Numerical Methods I Singular Value Decomposition Aleksandar Donev Courant Institute, NYU 1 donev@courant.nyu.edu 1 MATH-GA 2011.003 / CSCI-GA 2945.003, Fall 2014 October 9th, 2014 A. Donev (Courant Institute)
Lecture 2: Linear Algebra Review
 EE 227A: Convex Optimization and Applications January 19 Lecture 2: Linear Algebra Review Lecturer: Mert Pilanci Reading assignment: Appendix C of BV. Sections 2-6 of the web textbook 1 2.1 Vectors 2.1.1
SIO 211B, Rudnick, adapted from Davis 1
 SIO 211B, Rudnick, adapted from Davis 1 XVII.Empirical orthogonal functions Often in oceanography we collect large data sets that are time series at a group of locations. Moored current meter arrays do
7 Principal Components and Factor Analysis
 7 Principal Components and actor nalysis 7.1 Principal Components a oal. Relationships between two variables can be graphically well captured in a meaningful way. or three variables this is also possible,
Data Mining and Analysis: Fundamental Concepts and Algorithms
 Data Mining and Analysis: Fundamental Concepts and Algorithms dataminingbook.info Mohammed J. Zaki 1 Wagner Meira Jr. 2 1 Department of Computer Science Rensselaer Polytechnic Institute, Troy, NY, USA
Central limit theorem - go to web applet
 Central limit theorem - go to web applet Correlation maps vs. regression maps PNA is a time series of fluctuations in 500 mb heights PNA = 0.25 * [ Z(20N,160W) - Z(45N,165W) + Z(55N,115W) - Z(30N,85W)
EE16B Designing Information Devices and Systems II
 EE6B Designing Information Devices and Systems II Lecture 9B Geometry of SVD, PCA Uniqueness of the SVD Find SVD of A 0 A 0 AA T 0 ) ) 0 0 ~u ~u 0 ~u ~u ~u ~u Uniqueness of the SVD Find SVD of A 0 A 0
A Tutorial on Data Reduction. Principal Component Analysis Theoretical Discussion. By Shireen Elhabian and Aly Farag
 A Tutorial on Data Reduction Principal Component Analysis Theoretical Discussion By Shireen Elhabian and Aly Farag University of Louisville, CVIP Lab November 2008 PCA PCA is A backbone of modern data
Lecture: Face Recognition and Feature Reduction
 Lecture: Face Recognition and Feature Reduction Juan Carlos Niebles and Ranjay Krishna Stanford Vision and Learning Lab Lecture 11-1 Recap - Curse of dimensionality Assume 5000 points uniformly distributed
Eigenvalues, Eigenvectors, and an Intro to PCA
 Eigenvalues, Eigenvectors, and an Intro to PCA Eigenvalues, Eigenvectors, and an Intro to PCA Changing Basis We ve talked so far about re-writing our data using a new set of variables, or a new basis.
Independent Component Analysis and Its Application on Accelerator Physics
 Independent Component Analysis and Its Application on Accelerator Physics Xiaoying Pang LA-UR-12-20069 ICA and PCA Similarities: Blind source separation method (BSS) no model Observed signals are linear
Applications of Randomized Methods for Decomposing and Simulating from Large Covariance Matrices
 Applications of Randomized Methods for Decomposing and Simulating from Large Covariance Matrices Vahid Dehdari and Clayton V. Deutsch Geostatistical modeling involves many variables and many locations.
Principal Component Analysis -- PCA (also called Karhunen-Loeve transformation)
") Principal Component Analysis -- PCA (also called Karhunen-Loeve transformation) PCA transforms the original input space into a lower dimensional space, by constructing dimensions that are linear combinations
Principal Component Analysis -- PCA (also called Karhunen-Loeve transformation) PCA transforms the original input space into a lower dimensional space, by constructing dimensions that are linear combinations
Linear Algebra & Geometry why is linear algebra useful in computer vision?
 Linear Algebra & Geometry why is linear algebra useful in computer vision? References: -Any book on linear algebra! -[HZ] chapters 2, 4 Some of the slides in this lecture are courtesy to Prof. Octavia
Lecture 6, Sci. Comp. for DPhil Students
 Lecture 6, Sci. Comp. for DPhil Students Nick Trefethen, Thursday 1.11.18 Today II.3 QR factorization II.4 Computation of the QR factorization II.5 Linear least-squares Handouts Quiz 4 Householder s 4-page
Principal Component Analysis
 Principal Component Analysis CS5240 Theoretical Foundations in Multimedia Leow Wee Kheng Department of Computer Science School of Computing National University of Singapore Leow Wee Kheng (NUS) Principal
LECTURE 16: PCA AND SVD
 Instructor: Sael Lee CS549 Computational Biology LECTURE 16: PCA AND SVD Resource: PCA Slide by Iyad Batal Chapter 12 of PRML Shlens, J. (2003). A tutorial on principal component analysis. CONTENT Principal
Chemometrics. Matti Hotokka Physical chemistry Åbo Akademi University
 Chemometrics Matti Hotokka Physical chemistry Åbo Akademi University Linear regression Experiment Consider spectrophotometry as an example Beer-Lamberts law: A = cå Experiment Make three known references
Basics of Multivariate Modelling and Data Analysis
 Basics of Multivariate Modelling and Data Analysis Kurt-Erik Häggblom 6. Principal component analysis (PCA) 6.1 Overview 6.2 Essentials of PCA 6.3 Numerical calculation of PCs 6.4 Effects of data preprocessing
14 Singular Value Decomposition
 14 Singular Value Decomposition For any high-dimensional data analysis, one s first thought should often be: can I use an SVD? The singular value decomposition is an invaluable analysis tool for dealing
DYNAMIC AND COMPROMISE FACTOR ANALYSIS
 DYNAMIC AND COMPROMISE FACTOR ANALYSIS Marianna Bolla Budapest University of Technology and Economics marib@math.bme.hu Many parts are joint work with Gy. Michaletzky, Loránd Eötvös University and G. Tusnády,
Lecture 6: Selection on Multiple Traits
 Lecture 6: Selection on Multiple Traits Bruce Walsh lecture notes Introduction to Quantitative Genetics SISG, Seattle 16 18 July 2018 1 Genetic vs. Phenotypic correlations Within an individual, trait values
3.1. The probabilistic view of the principal component analysis.
 301 Chapter 3 Principal Components and Statistical Factor Models This chapter of introduces the principal component analysis (PCA), briefly reviews statistical factor models PCA is among the most popular
INDIAN INSTITUTE OF SCIENCE STOCHASTIC HYDROLOGY. Lecture -33 Course Instructor : Prof. P. P. MUJUMDAR Department of Civil Engg., IISc.
 INDIAN INSTITUTE OF SCIENCE STOCHASTIC HYDROLOGY Lecture -33 Course Instructor : Prof. P. P. MUJUMDAR Department of Civil Engg., IISc. Summary of the previous lecture Regression on Principal components
Principal Component Analysis
 Principal Component Analysis Yuanzhen Shao MA 26500 Yuanzhen Shao PCA 1 / 13 Data as points in R n Assume that we have a collection of data in R n. x 11 x 21 x 12 S = {X 1 =., X x 22 2 =.,, X x m2 m =.
Vectors and Matrices Statistics with Vectors and Matrices
 Vectors and Matrices Statistics with Vectors and Matrices Lecture 3 September 7, 005 Analysis Lecture #3-9/7/005 Slide 1 of 55 Today s Lecture Vectors and Matrices (Supplement A - augmented with SAS proc
Computation. For QDA we need to calculate: Lets first consider the case that
 Computation For QDA we need to calculate: δ (x) = 1 2 log( Σ ) 1 2 (x µ ) Σ 1 (x µ ) + log(π ) Lets first consider the case that Σ = I,. This is the case where each distribution is spherical, around the
FE670 Algorithmic Trading Strategies. Stevens Institute of Technology
 FE670 Algorithmic Trading Strategies Lecture 3. Factor Models and Their Estimation Steve Yang Stevens Institute of Technology 09/12/2012 Outline 1 The Notion of Factors 2 Factor Analysis via Maximum Likelihood
Forecasting 1 to h steps ahead using partial least squares
 Forecasting 1 to h steps ahead using partial least squares Philip Hans Franses Econometric Institute, Erasmus University Rotterdam November 10, 2006 Econometric Institute Report 2006-47 I thank Dick van
Linear Algebra in Computer Vision. Lecture2: Basic Linear Algebra & Probability. Vector. Vector Operations
 Linear Algebra in Computer Vision CSED441:Introduction to Computer Vision (2017F Lecture2: Basic Linear Algebra & Probability Bohyung Han CSE, POSTECH bhhan@postech.ac.kr Mathematics in vector space Linear
EE731 Lecture Notes: Matrix Computations for Signal Processing
 EE731 Lecture Notes: Matrix Computations for Signal Processing James P. Reilly c Department of Electrical and Computer Engineering McMaster University September 22, 2005 0 Preface This collection of ten
Lecture: Face Recognition and Feature Reduction
 Lecture: Face Recognition and Feature Reduction Juan Carlos Niebles and Ranjay Krishna Stanford Vision and Learning Lab 1 Recap - Curse of dimensionality Assume 5000 points uniformly distributed in the
LECTURE 7. Least Squares and Variants. Optimization Models EE 127 / EE 227AT. Outline. Least Squares. Notes. Notes. Notes. Notes.
 Optimization Models EE 127 / EE 227AT Laurent El Ghaoui EECS department UC Berkeley Spring 2015 Sp 15 1 / 23 LECTURE 7 Least Squares and Variants If others would but reflect on mathematical truths as deeply
High Dimensional Covariance and Precision Matrix Estimation
 High Dimensional Covariance and Precision Matrix Estimation Wei Wang Washington University in St. Louis Thursday 23 rd February, 2017 Wei Wang (Washington University in St. Louis) High Dimensional Covariance
Selection on Multiple Traits
 Selection on Multiple Traits Bruce Walsh lecture notes Uppsala EQG 2012 course version 7 Feb 2012 Detailed reading: Chapter 30 Genetic vs. Phenotypic correlations Within an individual, trait values can
LINEAR ALGEBRA KNOWLEDGE SURVEY
 LINEAR ALGEBRA KNOWLEDGE SURVEY Instructions: This is a Knowledge Survey. For this assignment, I am only interested in your level of confidence about your ability to do the tasks on the following pages.
PRINCIPAL COMPONENTS ANALYSIS
 121 CHAPTER 11 PRINCIPAL COMPONENTS ANALYSIS We now have the tools necessary to discuss one of the most important concepts in mathematical statistics: Principal Components Analysis (PCA). PCA involves
DATA MINING LECTURE 8. Dimensionality Reduction PCA -- SVD
 DATA MINING LECTURE 8 Dimensionality Reduction PCA -- SVD The curse of dimensionality Real data usually have thousands, or millions of dimensions E.g., web documents, where the dimensionality is the vocabulary
«Random Vectors» Lecture #2: Introduction Andreas Polydoros
 «Random Vectors» Lecture #2: Introduction Andreas Polydoros Introduction Contents: Definitions: Correlation and Covariance matrix Linear transformations: Spectral shaping and factorization he whitening
Multivariate Time Series: VAR(p) Processes and Models
 Processes and Models") Multivariate Time Series: VAR(p) Processes and Models A VAR(p) model, for p > 0 is X t = φ 0 + Φ 1 X t 1 + + Φ p X t p + A t, where X t, φ 0, and X t i are k-vectors, Φ 1,..., Φ p are k k matrices, with
Multivariate Time Series: VAR(p) Processes and Models A VAR(p) model, for p > 0 is X t = φ 0 + Φ 1 X t 1 + + Φ p X t p + A t, where X t, φ 0, and X t i are k-vectors, Φ 1,..., Φ p are k k matrices, with
GI07/COMPM012: Mathematical Programming and Research Methods (Part 2) 2. Least Squares and Principal Components Analysis. Massimiliano Pontil
 2. Least Squares and Principal Components Analysis. Massimiliano Pontil") GI07/COMPM012: Mathematical Programming and Research Methods (Part 2) 2. Least Squares and Principal Components Analysis Massimiliano Pontil 1 Today s plan SVD and principal component analysis (PCA) Connection
GI07/COMPM012: Mathematical Programming and Research Methods (Part 2) 2. Least Squares and Principal Components Analysis Massimiliano Pontil 1 Today s plan SVD and principal component analysis (PCA) Connection
1 Linear Difference Equations
 ARMA Handout Jialin Yu 1 Linear Difference Equations First order systems Let {ε t } t=1 denote an input sequence and {y t} t=1 sequence generated by denote an output y t = φy t 1 + ε t t = 1, 2,... with
Data Mining. Dimensionality reduction. Hamid Beigy. Sharif University of Technology. Fall 1395
 Data Mining Dimensionality reduction Hamid Beigy Sharif University of Technology Fall 1395 Hamid Beigy (Sharif University of Technology) Data Mining Fall 1395 1 / 42 Outline 1 Introduction 2 Feature selection
Exercises * on Principal Component Analysis
 Exercises * on Principal Component Analysis Laurenz Wiskott Institut für Neuroinformatik Ruhr-Universität Bochum, Germany, EU 4 February 207 Contents Intuition 3. Problem statement..........................................
ECE 521. Lecture 11 (not on midterm material) 13 February K-means clustering, Dimensionality reduction
 13 February K-means clustering, Dimensionality reduction") ECE 521 Lecture 11 (not on midterm material) 13 February 2017 K-means clustering, Dimensionality reduction With thanks to Ruslan Salakhutdinov for an earlier version of the slides Overview K-means clustering
ECE 521 Lecture 11 (not on midterm material) 13 February 2017 K-means clustering, Dimensionality reduction With thanks to Ruslan Salakhutdinov for an earlier version of the slides Overview K-means clustering
Machine Learning (Spring 2012) Principal Component Analysis
 Principal Component Analysis") 1-71 Machine Learning (Spring 1) Principal Component Analysis Yang Xu This note is partly based on Chapter 1.1 in Chris Bishop s book on PRML and the lecture slides on PCA written by Carlos Guestrin in
1-71 Machine Learning (Spring 1) Principal Component Analysis Yang Xu This note is partly based on Chapter 1.1 in Chris Bishop s book on PRML and the lecture slides on PCA written by Carlos Guestrin in
Review (Probability & Linear Algebra)
") Review (Probability & Linear Algebra) CE-725 : Statistical Pattern Recognition Sharif University of Technology Spring 2013 M. Soleymani Outline Axioms of probability theory Conditional probability, Joint
Review (Probability & Linear Algebra) CE-725 : Statistical Pattern Recognition Sharif University of Technology Spring 2013 M. Soleymani Outline Axioms of probability theory Conditional probability, Joint
Introduction to Machine Learning. PCA and Spectral Clustering. Introduction to Machine Learning, Slides: Eran Halperin
 1 Introduction to Machine Learning PCA and Spectral Clustering Introduction to Machine Learning, 2013-14 Slides: Eran Halperin Singular Value Decomposition (SVD) The singular value decomposition (SVD)
Linear Methods for Regression. Lijun Zhang
 Linear Methods for Regression Lijun Zhang zlj@nju.edu.cn http://cs.nju.edu.cn/zlj Outline Introduction Linear Regression Models and Least Squares Subset Selection Shrinkage Methods Methods Using Derived
Whitening and Coloring Transformations for Multivariate Gaussian Data. A Slecture for ECE 662 by Maliha Hossain
 Whitening and Coloring Transformations for Multivariate Gaussian Data A Slecture for ECE 662 by Maliha Hossain Introduction This slecture discusses how to whiten data that is normally distributed. Data
More Linear Algebra. Edps/Soc 584, Psych 594. Carolyn J. Anderson
 More Linear Algebra Edps/Soc 584, Psych 594 Carolyn J. Anderson Department of Educational Psychology I L L I N O I S university of illinois at urbana-champaign c Board of Trustees, University of Illinois