PIBC Annual Conference, 2016
|
|
|
- Marylou Thompson
- 5 years ago
- Views:
Transcription
1 Land Use Quantified PIBC Annual Conference, 2016 A collaboration between: Christy & Associated Planning Consultants The Sustainable Transportation Partnership of the Central Okanagan Hazel Christy Rafael Villarreal Cameron Taylor-Noonan Graham March City of Kelowna
2 Introduction & Moderator Hazel Christy, Christy and Associates Planning Consultants
3 What does Land Use Quantified mean to a planner? Rafael Villarreal, City of Kelowna and Sustainable Transportation Partnership of the Central Okanagan
4 What do we mean by quantified Land Use?
5 For this session, it means that: Motherhood statements aren t enough! Mixed use Compact urban form Compact walkable urban centers Balanced transportation
6 We need facts (numbers) to shape and plan our municipalities
7 Efficiently plan services and design services Source: Esri - Advanced Modeling of Transportation Networks With ArcGIS 9.1 Network Analyst Souce: Aquasense - Intelligent water management for your utilityintelligent water management for your utility

8 Quantify impacts of urban form Source: the cost of sprawl -
9 Enough talk, we need to quantify Challenges: What Where When
10 Enough talk, we need to quantify Challenge 1: What Where When
 Population (Type of Population) Employment (Type")


11 Land Use Quantified = Activity generators (demand for services and activities) Population (Type of Population) Employment (Type of Job) Enrolment (School Type) What Where When Icons the noun project (thenounproject.com): Small Town Collection - Olesya Kozlova, Smoothline Building Collection - Pham Thi Dieu Linh, Briefcase - Pham Thi Dieu Linh, Family Relationship Collection - Gerald Wildmoser
12 Enough talk, we need to quantify Challenge 2: What Where When
13 Geographic Resolution Region Province BC Stats Macro Mid-Long Term Micro What Where When
14 Regional Region/city wide Macro TAZ: Traffic Analysis Zones Long Range Urban Planning Micro Parcel/Lot Level Operational planning Short and Mid-term Short and Mid-Term (3 to 10 years) What Long-Range (10 to 20 years) Where When

15 Our Focus in this session! Graham Region Province- BC Stats Macro Mid-Long Term Cam What Micro Where When
16 Enough talk, we need to quantify Challenge 3: What Where When
17 The land use quantification process (an approach) What Where When Macro Micro Growth Assignment at Zone Level (Shape the City) Estimated Future Growth (Quantified) Aggregation of base Land Use at Zone Level Base year Land Use Quantification at Parcel/Lot Level FUTURE 25 years FUTURE 25 years TODAY Base TODAY Base
18 Let s get started with the land use quantification methods
19 Micro Level: human scale planning Regional Macro Micro Cameron Taylor-Noonan, City of Kelowna and SCARP

20 At What Scale Do We Quantify the City?
21 Traffic Analysis Zones (TAZs)
22 Traffic Analysis Zones (TAZs)

23 Traffic Analysis Zone (TAZ)
24 Traffic Analysis Zone (TAZ) Dissemination Area (DA)
25 Traffic Analysis Zone (TAZ) Dissemination Area (DA)
 Dissemination Area")
26 Traffic Analysis Zone (TAZ) Dissemination Area (DA)
27 Traffic Analysis Zone (TAZ) Dissemination Area (DA) Parcels
28 What is Activity? Population Employment Enrolment Icons the noun project (thenounproject.com): Small Town Collection - Olesya Kozlova, Smoothline Building Collection - Pham Thi Dieu Linh, Briefcase - Pham Thi Dieu Linh, Family Relationship Collection - Gerald Wildmoser
29 Components of Activity Population Employment Enrolment
30 Population Challenges Census only happens every five years Population varies throughout the year Tourists place demand on services too
31 Population Data Sources Census: Population at DA level Year-round occupancy rate Average household size (for different types of dwellings) BC Assessment: Type and number of units
: Small Town Collection - Olesya Kozlova, Smoothline Building Collection - Pham Thi Dieu Linh, Briefcase - Pham Thi Dieu Linh, Family Relationship")
32 Method Estimate the population based on type of dwelling, keeping in mind Icons the noun project (thenounproject.com): Small Town Collection - Olesya Kozlova, Smoothline Building Collection - Pham Thi Dieu Linh, Briefcase - Pham Thi Dieu Linh, Family Relationship Collection - Gerald Wildmoser


33 Method There are wide differences in household sizes... 53% 47% Icons the noun project (thenounproject.com): Small Town Collection - Olesya Kozlova, Smoothline Building Collection - Pham Thi Dieu Linh, Briefcase - Pham Thi Dieu Linh, Family Relationship Collection - Gerald Wildmoser
34 Method And big seasonal variations in occupancy 50% ~90% 100% Regional Average
35 Method Based on type of dwelling, nearby vacancy rate, and the percentage of nearby households with children:
36 Method Based on type of dwelling, nearby vacancy rate, and the percentage of nearby households with children:

37 Icons: the noun project, Method Based on type of dwelling, nearby vacancy rate, and the percentage of nearby households with children:
38 Components of Activity Population Employment Enrolment
39 Employment Challenges No census for employment Some jobs have no fixed location Others work from home
40 Icons from: the noun project, Employment Data Sources Canada Business Points: Addresses and employment counts for two-thirds of businesses Survey of Major Employers Business Licenses: Address and type of business BC Assessment: Type and floorspace of buildings
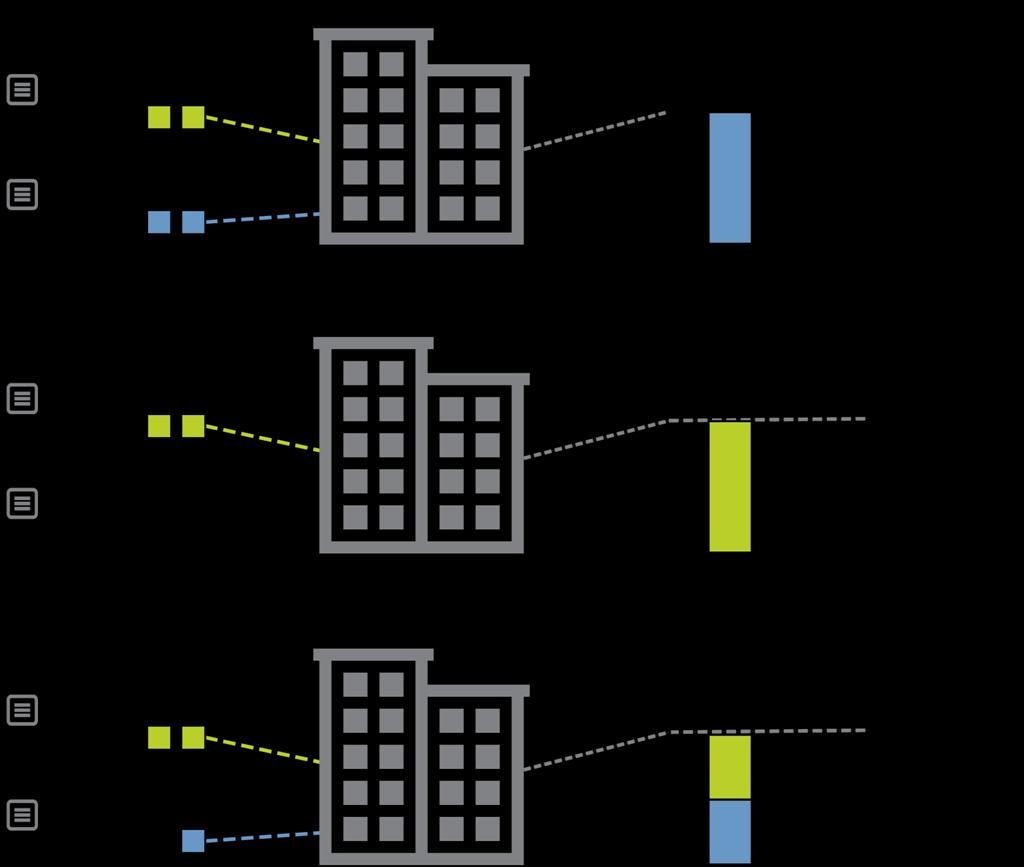
41 Icons the noun project (thenounproject.com): Small Town Collection - Olesya Kozlova, Smoothline Building Collection - Pham Thi Dieu Linh, Briefcase - Pham Thi Dieu Linh, Family Relationship Collection - Gerald Wildmoser Inputs Output
42 Inputs Output
43 Inputs Output
44 Inputs Output
45 Inputs Output
46
47 Components of Activity Population Employment Enrolment
48 Enrolment Data Sources School District 23 Post Secondary Institutions Survey of Private Schools
49 Population

50 Population Employment

51 Icons from: the noun project, Population Employment Enrolment
52 So, Now What?
53 Parcels

54 Traffic Analysis Zones

55 Traffic Analysis Zones

56 Macro Level: Long-range planning Region Macro Micro Graham March, City of Kelowna
57 Challenge How to become the city we envision for the future?


58 The vision for Kelowna s future is primarily described in our Official Community Plan (OCP) through qualitative, motherhood statements such as: Please don t try to read, I will read it for you!

59 Quantitative side but very incomplete And by assigning growth at a nebulous scale


60 Quantifying growth allows us to plan for the future Source: Esri - Advanced Modeling of Transportation Networks With ArcGIS 9.1 Network Analyst Source: Aquasense - Intelligent water management for your utilityintelligent water management for your utility
61 Before we start at the Macro level We first start with projections at Regional Level Region Macro Micro
62 Future Growth at a Regional Scale Challenges: Region-wide projections Need to distribute between municipalities Within each municipality, need to distribute geographically Region Macro Micro

63 Future Population BC Stats PEOPLE Projections Region-wide only, have to break up between municipalities
64 Future Employment 2040 Employment Forecast (HDR Consulting) Some employment is population-driven i.e. more people = more dentists Other employment depends the outlook for specific industries Employment forecast has to mesh with future labour force


: Small Town Collection - Olesya")

65 Employment Categories Retail Services Manufacturing Institutional School Jobs We have a forecast for the number of jobs for each category Icons the noun project (thenounproject.com): Small Town Collection - Olesya Kozlova, Smoothline Building Collection - Pham Thi Dieu Linh, Briefcase - Pham Thi Dieu Linh, Family Relationship Collection - Gerald Wildmoser
66 Now we can Start with Macro-Level: Macro Level: Long-range planning, how to allocate 25 years of growth Region Macro Micro

67 Distribute OCP growth at TAZ level Growth nodes
68 2040 Growth Allocation We have an idea of the future 2040 population and employment for the Region and the City Challenge: Where is this growth going to occur to realize motherhood objectives? Qualitative + Quantitative
69 Distribution methodology Distribution of the 2040 population and jobs projections was done using a combination of tools we created in-house: Vacant Land Inventory Tool (VLI-T) Development Potential Tool (DP-T)
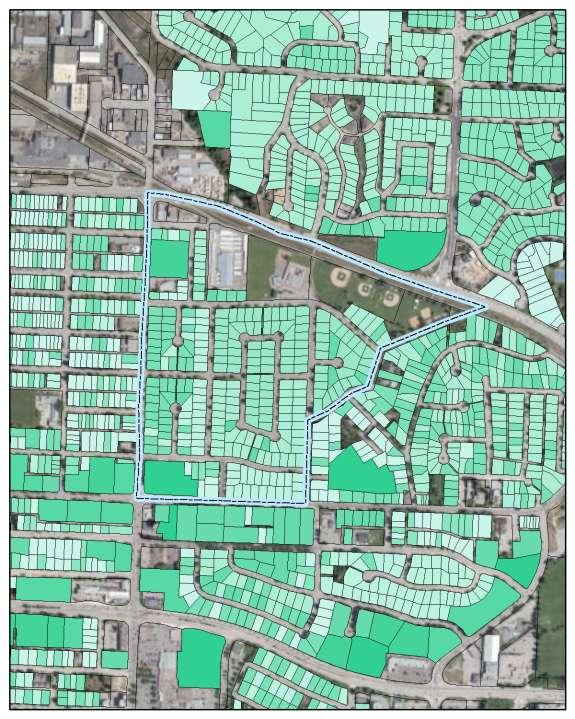
70 Vacant Land Inventory Tool Identifies lands that will likely redevelop in the near term

71 VLI Tool - Kelowna Core Value of Building Value of Land


72 Land to redevelop by 2040 (Vacant Land Inventory Tool)
73 Development Potential Tool Determines future population and employment of properties

74 Development Potential Tool: The Development Potential Tool converts property size and future land use designation into population and job yield these results are based on zoning regulations and other factors. We used this tool for the properties that will redevelop to get a sense of the units and jobs future capacity for each TAZ.

75 Development Potential of Site (Development Potential Tool)
76 Employment growth allocation methodology Employment assumption was to intensify where jobs already exist to create employment nodes Identify underutilized lands that are designated for commercial Determined square feet of potential commercial space Applied employment factors Future jobs COMM sq.ft. Employment factors Future jobs

77 2040 Landuse Projections Growth In Employment
78 Population growth allocation methodology Growth assigned to lands that is vacant or will likely redevelop by 2040 Growth assigned to parcels that are highest and best use (including desired future designation) Apply future growth to areas that will help realize the vision Balance of qualitative and quantitative

79 2040 Landuse Projections Growth In Population
80 How about Market realities? Experience is critical to apply the gut check to the numbers Realizing growth is a balance between the qualitative (vision/motherhood statements), and quantitative (growth numbers), and experience (does it feel right)

81 Successful growth projection balances Motherhood statements + Growth projections + Market reality (experience)
82 Conclusion (Long Range Quantification) Combining qualitative and quantitative, along with experience (knowledge of market), helps to shape the city s future vision

83 Now let s talk What Where When Hazel Christy, Christy and Associates Planning Consultants
84 Challenges - How to decide what land use to quantify? - Assumptions - Future is unknown - Population distribution - Qualitative vs. Quantitative vs. Market realities
The Attractive Side of Corpus Christi: A Study of the City s Downtown Economic Growth
 The Attractive Side of Corpus Christi: A Study of the City s Downtown Economic Growth GISC PROJECT DR. LUCY HUANG SPRING 2012 DIONNE BRYANT Introduction Background As a GIS Intern working with the City
Transportation Statistical Data Development Report OKALOOSA-WALTON OUTLOOK 2035 LONG RANGE TRANSPORTATION PLAN
 Transportation Statistical Data Development Report OKALOOSA-WALTON OUTLOOK 2035 LONG RANGE TRANSPORTATION PLAN Prepared for the Okaloosa-Walton Transportation Planning Organization and The Florida Department
Kitsap County 2016 Comprehensive Plan Update. Appendix A: Growth Estimates
 Kitsap County 2016 Comprehensive Plan Update Appendix A: Growth Estimates Appendix A 1 April 2016 Kitsap County 2016 Comprehensive Plan Update Appendix A: Growth Estimates Land Capacity Land capacity
Local Economic Activity Around Rapid Transit Stations
 Local Economic Activity Around Rapid Transit Stations The Case of Chicago s Orange Line Julie Cooper, MPP 2014 Harris School of Public Policy Transport Chicago June 6, 2014 Motivation Impacts of transit
Demographic Data in ArcGIS. Harry J. Moore IV
 Demographic Data in ArcGIS Harry J. Moore IV Outline What is demographic data? Esri Demographic data - Real world examples with GIS - Redistricting - Emergency Preparedness - Economic Development Next
Urban White Paper on Tokyo Metropolis 2002
 Urban White Paper on Tokyo Metropolis 2002 By Bureau of City Planning Tokyo Metropolitan Government Part I. "Progress in IT and City Building" Effects of computer networks on cities and cities' response
Preparing the GEOGRAPHY for the 2011 Population Census of South Africa
 Preparing the GEOGRAPHY for the 2011 Population Census of South Africa Sharthi Laldaparsad Statistics South Africa; E-mail: sharthil@statssa.gov.za Abstract: Statistics South Africa (Stats SA) s Geography
APPENDIX I: Traffic Forecasting Model and Assumptions
 APPENDIX I: Traffic Forecasting Model and Assumptions Appendix I reports on the assumptions and traffic model specifications that were developed to support the Reaffirmation of the 2040 Long Range Plan.
King City URA 6D Concept Plan
 King City URA 6D Concept Plan King City s Evolution Among the fastest growing cities 2000 Census 1,949 2010 Census 3,111 60% increase 2016 Census estimate 3,817 23% increase Average annual rate 4.3% Surpassing
Advancing Urban Models in the 21 st Century. Jeff Tayman Lecturer, Dept. of Economics University of California, San Diego
 Advancing Urban Models in the 21 st Century Jeff Tayman Lecturer, Dept. of Economics University of California, San Diego 1 Regional Decision System Better tools Better data Better access Better Decisions
Lee County, Florida 2015 Forecast Report Population, Housing and Commercial Demand
 Lee County, Florida 2015 Forecast Report Population, Housing and Commercial Demand Thank you for purchasing this report, which contains forecasts of population growth, housing demand and demand for commercial
APPENDIX D FOLSOM HOLDING CAPACITY METHODOLOGY
 APPENDIX D FOLSOM HOLDING CAPACITY METHODOLOGY This page intentionally left blank. APPENDIX D FOLSOM HOLDING CAPACITY METHODOLOGY 1. INTRODUCTION This document provides a description of the assumptions
MPOs SB 375 LAFCOs SCAG Practices/Experiences And Future Collaborations with LAFCOs
 Connecting LAFCOs and COGs for Mutual Benefits MPOs SB 375 LAFCOs SCAG Practices/Experiences And Future Collaborations with LAFCOs Frank Wen, Manager Research & Analysis Land Use & Environmental Planning
2040 MTP and CTP Socioeconomic Data
 SE Data 6-1 24 MTP and CTP Socioeconomic Data Purpose of Socioeconomic Data The socioeconomic data (SE Data) shows the location of the population and employment, median household income and other demographic
Introducing GIS analysis
 1 Introducing GIS analysis GIS analysis lets you see patterns and relationships in your geographic data. The results of your analysis will give you insight into a place, help you focus your actions, or
Economic Activity Economic A ctivity
 5 Economic Economic Activity Activity ECONOMIC ACTIVITY 5.1 EMPLOYMENT... 5-7 5.1.1 OBJECTIVE... 5-7 5.1.2 POLICIES... 5-7 5.2 PROTECTING THE AREA OF EMPLOYMENT... 5-9 5.2.1 OBJECTIVE... 5-9 5.2.2 POLICIES...
5.0 POPULATION, HOUSEHOLD AND EMPLOYMENT FORECASTS
 5.0 POPULATION, HOUSEHOLD AND EMPLOYMENT FORECASTS 5.1 Hemson Consulting Ltd. Forecasts Hemson Consulting Ltd. was retained in 03 to prepare new growth projections for the County as part of its Official
Lee County, Alabama 2015 Forecast Report Population, Housing and Commercial Demand
 Lee County, Alabama 2015 Forecast Report Population, Housing and Commercial Demand Thank you for purchasing this report, which contains forecasts of population growth, housing demand and demand for commercial
Planning for Sea Level Rise in the Matanzas Basin
 Planning for Sea Level Rise in the Matanzas Basin Appendix E: Matanzas Future Development Scenarios June, 2015 Prepared by: Dr. Paul Zwick University of Florida Department of Urban and Regional Planning
Date: March 31, 2014 PATE; fyril 2.3,2 >H
 aj BRAMPTON fifs Rower City XH-l-f r.t "»* City Council The Corporation of the City of Brampton SRAMPTON CITY COUNCIL Date: March 31, 2014 PATE; fyril 2.3,2 >H File: POO GR VisWhtoJed ^t'th-meeh'^a Subject:
PRIMA. Planning for Retailing in Metropolitan Areas
 PRIMA Planning for Retailing in Metropolitan Areas Metropolitan Dimension to sustainable retailing futures Metropolitan strategies Retailing in city and town centres will be a primary component of any
Typical information required from the data collection can be grouped into four categories, enumerated as below.
 Chapter 6 Data Collection 6.1 Overview The four-stage modeling, an important tool for forecasting future demand and performance of a transportation system, was developed for evaluating large-scale infrastructure
Attachment 3. Updating UBC s Regional Context Statement. University of British Columbia CONSIDERATION MEMORANDUM OF CONSULTATION INPUT
 Attachment 3 University of British Columbia Updating UBC s Regional Context Statement CONSIDERATION MEMORANDUM OF CONSULTATION INPUT Campus and Community Planning February 24, 2014 1 CONSIDERATION MEMORANDUM
Data Collection. Lecture Notes in Transportation Systems Engineering. Prof. Tom V. Mathew. 1 Overview 1
 Data Collection Lecture Notes in Transportation Systems Engineering Prof. Tom V. Mathew Contents 1 Overview 1 2 Survey design 2 2.1 Information needed................................. 2 2.2 Study area.....................................
Urban Transportation Planning Prof. Dr.V.Thamizh Arasan Department of Civil Engineering Indian Institute of Technology Madras
 Urban Transportation Planning Prof. Dr.V.Thamizh Arasan Department of Civil Engineering Indian Institute of Technology Madras Module #03 Lecture #12 Trip Generation Analysis Contd. This is lecture 12 on
Trip Generation Model Development for Albany
 Trip Generation Model Development for Albany Hui (Clare) Yu Department for Planning and Infrastructure Email: hui.yu@dpi.wa.gov.au and Peter Lawrence Department for Planning and Infrastructure Email: lawrence.peter@dpi.wa.gov.au
California Urban Infill Trip Generation Study. Jim Daisa, P.E.
 California Urban Infill Trip Generation Study Jim Daisa, P.E. What We Did in the Study Develop trip generation rates for land uses in urban areas of California Establish a California urban land use trip
CERTIFIED RESOLUTION. introduction: and dated May 29, 2017, as attached, as appropriate
 15322 Buena Vista Avenue, White Rock BC, Canada V4B 1Y6 www.whiterockcity.ca City of White Rock P: 604.541.22121 F: 604.541.9348 /2tC% City Clerk s Office IT E ROC K June 13,2017 Stephanie Lam, Deputy
Wasatch Front Region Small Area Socioeconomic Forecasts: Technical Report #49
 Regional Transportation Plan: 2011-2040 Appendix A APPENDIX A Wasatch Front Region Small Area Socioeconomic Forecasts: 2007-2040 Technical Report #49 July, 2010 295 N. Jimmy Doolittle Road Salt Lake City,
Population Density. Population density: A measure of how crowded a place is.
 Population Density Population density: A measure of how crowded a place is. Formula: Population Density = Population Total Area km 2 Overall Canada has a low population density of about 3 people per km
Date: June 19, 2013 Meeting Date: July 5, Consideration of the City of Vancouver s Regional Context Statement
 Section E 1.5 To: From: Regional Planning and Agriculture Committee Lee-Ann Garnett, Senior Regional Planner Planning, Policy and Environment Department Date: June 19, 2013 Meeting Date: July 5, 2013 Subject:
Proposed Scope of Work Village of Farmingdale Downtown Farmingdale BOA Step 2 BOA Nomination Study / Draft Generic Environmental Impact Statement
 Proposed Scope of Work Village of Farmingdale Downtown Farmingdale BOA Step 2 BOA Nomination Study / Draft Generic Environmental Impact Statement The scope of work that follows incorporates and covers
GROWTH MANAGEMENT REPORT Wiarton South Settlement Area
 GROWTH MANAGEMENT REPORT Wiarton South Settlement Area Designations in the Town of Wiarton Prepared for: The Municipality of South Bruce Peninsula P.O. Box 310 315 George St. Wiarton, ON N0H 2T0 Prepared
Port Cities Conference: How Regional Planning can Help Support a Competitive Port. Christina DeMarco Metro Vancouver
 Port Cities Conference: How Regional Planning can Help Support a Competitive Port Christina DeMarco Metro Vancouver June 12. 2008 Metro Vancouver Regional Growth Management Three ways to help support the
Dimantha I De Silva (corresponding), HBA Specto Incorporated
, HBA Specto Incorporated") Paper Author (s) Dimantha I De Silva (corresponding), HBA Specto Incorporated (dds@hbaspecto.com) Daniel Flyte, San Diego Association of Governments (SANDAG) (Daniel.Flyte@sandag.org) Matthew Keating,
Paper Author (s) Dimantha I De Silva (corresponding), HBA Specto Incorporated (dds@hbaspecto.com) Daniel Flyte, San Diego Association of Governments (SANDAG) (Daniel.Flyte@sandag.org) Matthew Keating,
Oakland County Parks and Recreation GIS Implementation Plan
 Oakland County Parks and Recreation GIS Implementation Plan TABLE OF CONTENTS 1.0 Introduction... 3 1.1 What is GIS? 1.2 Purpose 1.3 Background 2.0 Software... 4 2.1 ArcGIS Desktop 2.2 ArcGIS Explorer
Employment Capacity in Transit Station Areas in Maryland
 Employment Capacity in Transit Station Areas in Maryland Prepared by: The National Center for Smart Growth Research and Education at the University of Maryland* Gerrit Knaap, PhD, Director Terry Moore,
SA Geospatial Analysis Platform (GAP) Methodology*, collaborators & data sources
 Methodology*, collaborators & data sources") SA Geospatial Analysis Platform (GAP) Methodology*, collaborators & data sources Mesoframe CSIR, dti, the Presidency & GTZ Demarcation of South Africa into a grid of 50 Km 2 mesozones, nested within important
SA Geospatial Analysis Platform (GAP) Methodology*, collaborators & data sources Mesoframe CSIR, dti, the Presidency & GTZ Demarcation of South Africa into a grid of 50 Km 2 mesozones, nested within important
Los Alamos Planning Advisory Committee. Stephen Peterson March 19, 2007
 Los Alamos Planning Advisory Committee Stephen Peterson March 19, 2007 What makes Los Alamos so special? Very small, compact town surrounded by large parcel working agriculture and open space areas Old
Wasatch Front Region Small Area Socioeconomic Forecasts: Technical Report #49
 Wasatch Front Region Small Area Socioeconomic Forecasts: 2007-2040 Technical Report #49 July, 2010 Wasatch Front Regional Council 295 N. Jimmy Doolittle Road Salt Lake City, UT 84116 P (801) 363-4250 F
ArcGIS for Planning and Data Management at Interior Health Authority. Brent Harris, GIS Analyst Information Management
 ArcGIS for Planning and Data Management at Interior Health Authority Brent Harris, GIS Analyst Information Management About Interior Health 1 of 5 geographically-based Health Authorities in B.C. ~215,000
THE FUTURE OF FORECASTING AT METROPOLITAN COUNCIL. CTS Research Conference May 23, 2012
 THE FUTURE OF FORECASTING AT METROPOLITAN COUNCIL CTS Research Conference May 23, 2012 Metropolitan Council forecasts Regional planning agency and MPO for Twin Cities metropolitan area Operates regional
Local Area Key Issues Paper No. 13: Southern Hinterland townships growth opportunities
 Draft Sunshine Coast Planning Scheme Review of Submissions Local Area Key Issues Paper No. 13: Southern Hinterland townships growth opportunities Key Issue: Growth opportunities for Southern Hinterland
GLA small area population projection methodology
 Update 2017-04 GLA small area population projection methodology 2015-based projections February 2017 Introduction The GLA produces a range of annually updated demographic projections for London. Among
Public Transportation Infrastructure Study (PTIS) - 2 nd Technical Advisory Committee Meeting
 - 2 nd Technical Advisory Committee Meeting") Public Transportation Infrastructure Study (PTIS) - 2 nd Technical Advisory Committee Meeting Presentation to: Technical Advisory Committee (TAC) Presented by: and Team July 8th, 2009 Public Transportation
Public Transportation Infrastructure Study (PTIS) - 2 nd Technical Advisory Committee Meeting Presentation to: Technical Advisory Committee (TAC) Presented by: and Team July 8th, 2009 Public Transportation
Summary Description Municipality of Anchorage. Anchorage Coastal Resource Atlas Project
 Summary Description Municipality of Anchorage Anchorage Coastal Resource Atlas Project By: Thede Tobish, MOA Planner; and Charlie Barnwell, MOA GIS Manager Introduction Local governments often struggle
The Spatial Structure of Cities: International Examples of the Interaction of Government, Topography and Markets
 Module 2: Spatial Analysis and Urban Land Planning The Spatial Structure of Cities: International Examples of the Interaction of Government, Topography and Markets Alain Bertaud Urbanist Summary What are
INTELLIGENT CITIES AND A NEW ECONOMIC STORY CASES FOR HOUSING DUNCAN MACLENNAN UNIVERSITIES OF GLASGOW AND ST ANDREWS
 INTELLIGENT CITIES AND A NEW ECONOMIC STORY CASES FOR HOUSING DUNCAN MACLENNAN UNIVERSITIES OF GLASGOW AND ST ANDREWS THREE POLICY PARADOXES 16-11-08 1. GROWING FISCAL IMBALANCE 1. All orders of government
Model Classification
 Classification Variables Background information Model Classification Technical Platform/software Clue-s ICLUS I-Places3s IPM Own developed ArcGIS-based Web-based system, i.e. no specialized hardware/software
Egypt Public DSS. the right of access to information. Mohamed Ramadan, Ph.D. [R&D Advisor to the president of CAPMAS]
![Egypt Public DSS. the right of access to information. Mohamed Ramadan, Ph.D. [R&D Advisor to the president of CAPMAS]](/thumbs/89/98483713.jpg "Egypt Public DSS. the right of access to information. Mohamed Ramadan, Ph.D. [R&D Advisor to the president of CAPMAS]") Egypt Public DSS ì the right of access to information Central Agency for Public Mobilization and Statistics Arab Republic of Egypt Mohamed Ramadan, Ph.D. [R&D Advisor to the president of CAPMAS] Egypt
Egypt Public DSS ì the right of access to information Central Agency for Public Mobilization and Statistics Arab Republic of Egypt Mohamed Ramadan, Ph.D. [R&D Advisor to the president of CAPMAS] Egypt
Achieving the Vision Geo-statistical integration addressing South Africa s Developmental Agenda. geospatial + statistics. The Data Revolution
 Achieving the Vision Geo-statistical integration addressing South Africa s Developmental Agenda geospatial + statistics The Data Revolution humble beginnings, present & future - South Africa UN World Data
New Partners for Smart Growth: Building Safe, Healthy, and Livable Communities Mayor Jay Williams, Youngstown OH
 New Partners for Smart Growth: Building Safe, Healthy, and Livable Communities Mayor Jay Williams, Youngstown OH The City of Youngstown Youngstown State University Urban Strategies Inc. Youngstown needed
The role of community in urban regeneration: mixed use areas approach in USA
 The role of community in urban regeneration: mixed use areas approach in USA Outline 1. Thesis 2. Main topics 3. Urban regeneration and community 4. Community involvement methods 5. Policies: EU vs USA
City of Cambridge. HEMSON C o n s u l t i n g L t d.
 GROWTH MANAGEMENT STRATEGY LAND INVENTORY AND CAPACITY ANALYSIS City of Cambridge C o n s u l t i n g L t d. October 2009 EXECUTIVE SUMMARY This report examines the residential and employment land inventory
National planning report for Denmark
 National planning report for Denmark from the Minister for Environment and Energy Local identity and new challenges Summary 2000 1 CONTENTS 4 PREFACE: REGIONAL DEVELOPMENT AND SPATIAL PLANNING 6 1. BALANCED
Population 24/7. David Martin, University of Southampton
 Population 24/7 David Martin, University of Southampton Demographics User Group 18 March 2011 Presentation overview Acknowledgement: Samantha Cockings and Samuel Leung; ESRC award RES-062-23-181 Small
Application of GIS in Public Transportation Case-study: Almada, Portugal
 Case-study: Almada, Portugal Doutor Jorge Ferreira 1 FSCH/UNL Av Berna 26 C 1069-061 Lisboa, Portugal +351 21 7908300 jr.ferreira@fcsh.unl.pt 2 FSCH/UNL Dra. FCSH/UNL +351 914693843, leite.ines@gmail.com
Geodatabase for Sustainable Urban Development. Presented By Rhonda Maronn Maurice Johns Daniel Ashney Jack Anliker
 Geodatabase for Sustainable Urban Development Presented By Rhonda Maronn Maurice Johns Daniel Ashney Jack Anliker Objective Build a Geodatabase that will enable urban planners to create and assess the
Edexcel Geography Advanced Paper 2
 Edexcel Geography Advanced Paper 2 SECTION B: SHAPING PLACES Assessment objectives AO1 Demonstrate knowledge and understanding of places, environments, concepts, processes, interactions and change, at
CONSTRUCTING THE POVERTY AND OPPORTUNITIES/PUBLIC SERVICES MAPS INFORMATION MANAGEMENT. Background: Brazil Without Extreme Poverty Plan
 INFORMATION MANAGEMENT CONSTRUCTING THE POVERTY AND OPPORTUNITIES/PUBLIC SERVICES MAPS Background: Brazil Without Extreme Poverty Plan The Brazil Without Extreme Poverty Plan (BSM), designed to overcome
Are You Maximizing The Value Of All Your Data?
 Are You Maximizing The Value Of All Your Data? Using The SAS Bridge for ESRI With ArcGIS Business Analyst In A Retail Market Analysis SAS and ESRI: Bringing GIS Mapping and SAS Data Together Presented
Neighborhood Locations and Amenities
 University of Maryland School of Architecture, Planning and Preservation Fall, 2014 Neighborhood Locations and Amenities Authors: Cole Greene Jacob Johnson Maha Tariq Under the Supervision of: Dr. Chao
HORIZON 2030: Land Use & Transportation November 2005
 PROJECTS Land Use An important component of the Horizon transportation planning process involved reviewing the area s comprehensive land use plans to ensure consistency between them and the longrange transportation
Population, Housing and Employment Forecasts. Technical Report
 Population, Housing and Employment Forecasts Technical Report Population, Housing and Employment Forecasts Technical Report Research and Performance April 2013 A report by the Cambridgeshire County Council
The 3V Approach. Transforming the Urban Space through Transit Oriented Development. Gerald Ollivier Transport Cluster Leader World Bank Hub Singapore
 Transforming the Urban Space through Transit Oriented Development The 3V Approach Gerald Ollivier Transport Cluster Leader World Bank Hub Singapore MDTF on Sustainable Urbanization The China-World Bank
Thoughts toward autonomous land development. Introduction
 Thoughts toward autonomous land development Spatial Transformation of Regular grid Irrigation Frameworks Bangkok and Cairo A Work in Progress Information based on student workshop June 2009 and earlier
CRP 608 Winter 10 Class presentation February 04, Senior Research Associate Kirwan Institute for the Study of Race and Ethnicity
 CRP 608 Winter 10 Class presentation February 04, 2010 SAMIR GAMBHIR SAMIR GAMBHIR Senior Research Associate Kirwan Institute for the Study of Race and Ethnicity Background Kirwan Institute Our work Using
Land Use Advisory Committee. Updating the Transit Market Areas
 Land Use Advisory Committee Updating the Transit Market Areas March 20, 2014 Agenda Transit Market Areas Purpose of Transit Market Areas Transit Market Index Current Market Area boundaries Updating the
A Method for Mapping Settlement Area Boundaries in the Greater Golden Horseshoe
 A Method for Mapping Settlement Area Boundaries in the Greater Golden Horseshoe Purpose This paper describes a method for mapping and measuring the lands designated for growth and urban expansion in the
Figure 8.2a Variation of suburban character, transit access and pedestrian accessibility by TAZ label in the study area
 Figure 8.2a Variation of suburban character, transit access and pedestrian accessibility by TAZ label in the study area Figure 8.2b Variation of suburban character, commercial residential balance and mix
Individual Self-help Housing Reconstruction with Relocation: Transformation of Built Environment after the Great East Japan Earthquake
 Individual Self-help Housing Reconstruction with Relocation: Transformation of Built Environment after the Great East Japan Earthquake Tamiyo Kondo, Kobe University tamiyok@people.kobe-u.ac.jp Yuka Karatani,
A Note on Methods. ARC Project DP The Demand for Higher Density Housing in Sydney and Melbourne Working Paper 3. City Futures Research Centre
 A Note on Methods ARC Project DP0773388 The Demand for Higher Density Housing in Sydney and Melbourne Working Paper 3 City Futures Research Centre February 2009 A NOTE ON METHODS Dr Raymond Bunker, Mr
Volume Title: Empirical Models of Urban Land Use: Suggestions on Research Objectives and Organization. Volume URL:
 This PDF is a selection from an out-of-print volume from the National Bureau of Economic Research Volume Title: Empirical Models of Urban Land Use: Suggestions on Research Objectives and Organization Volume
2014 Certification Review Regional Data & Modeling
 2014 Certification Review Regional Data & Modeling July 22, 2014 Regional Data Census Program Coordination PAG works with and for member agencies to ensure full participation in all Census Bureau programs
3/21/2019. Q: What is this? What is in this area of the country? Q: So what is this? GEOG 3100 Next Week
 Tuesday: Thursday: GEOG 3100 Next Week Discussion of The South region (in this room) GIS Computer Lab Time (ENV Building, Room 340 more on this in class on Tuesday next week) Ahead of this lab time, please
MODULE 1 INTRODUCING THE TOWNSHIP RENEWAL CHALLENGE
 MODULE 1 INTRODUCING THE TOWNSHIP RENEWAL CHALLENGE FOCUS OF THE MODULE Township renewal challenges and developmental outcomes covered in this module: Historical origins of townships and the inherited
GIS-Based Analysis of the Commuting Behavior and the Relationship between Commuting and Urban Form
 GIS-Based Analysis of the Commuting Behavior and the Relationship between Commuting and Urban Form 1. Abstract A prevailing view in the commuting is that commuting would reconstruct the urban form. By
The Future of Met Council Forecasts
 The Future of Met Council Forecasts Todd Graham todd.graham@metc.state.mn.us Dennis Farmer dennis.farmer@metc.state.mn.us Metropolitan Council Research Today s Agenda Why we forecast, how we use forecasts
THE POPULATION PROJECTION METHODOLOGY OF
 SPECIAL PUBLICATION SJ2005-SP9 THE POPULATION PROJECTION METHODOLOGY OF THE ST. JOHNS RIVER WATER MANAGEMENT DISTRICT S 2003 DISTRICT WATER SUPPLY ASSESSMENT AND 2005 DISTRICT WATER SUPPLY PLAN The Population
Difference in regional productivity and unbalance in regional growth
 Difference in regional productivity and unbalance in regional growth Nino Javakhishvili-Larsen and Jie Zhang - CRT, Denmark, Presentation at 26 th International input-output conference in Brazil Aim of
Mapping UK. David Martin, University of Southampton. Open Data Workshop, Nottingham, 21 June 2011
 Mapping UK population over time David Martin, University of Southampton Open Data Workshop, Nottingham, 21 June 2011 Presentation overview Small area spatial population distributions The time dimension
OREGON POPULATION FORECAST PROGRAM
 OREGON POPULATION FORECAST PROGRAM PROGRAM OVERVIEW BACKGROUND Beginning in 1973 with the passage of Senate Bill (SB) 100, Oregon s growth management system has relied on population forecasts as the primary
Introduction and Project Overview
 Greater New Orleans Regional Land Use Modeling GIS Techniques in a P olitical C ontext Louisiana Remote Sensing and GIS Workshop Wednesday, April 24, 2013 Working Towards a Shared Regional Vision Introduction
You can't get there from here: Mapping access to Canada's teacher education programs
 You can't get there from here: Mapping access to Canada's teacher education programs Cameron William Smith, Peter Peller Werklund School of Education, University of Calgary Context/Process Initial, exploratory
TRAVEL DEMAND MODEL. Chapter 6
 Chapter 6 TRAVEL DEMAND MODEL As a component of the Teller County Transportation Plan development, a computerized travel demand model was developed. The model was utilized for development of the Transportation
Metrolinx Transit Accessibility/Connectivity Toolkit
 Metrolinx Transit Accessibility/Connectivity Toolkit Christopher Livett, MSc Transportation Planning Analyst Research and Planning Analytics Tweet about this presentation #TransitGIS OUTLINE 1. Who is
Webinar Series for Comprehensive Plan Updates. School Districts: More than just an affected jurisdiction
 Webinar Series for Comprehensive Plan Updates School Districts: More than just an affected jurisdiction Presented by Tara Beard, AICP March 9, 2017 Goals for this webinar City planning staff are more aware
Technical Documentation Demostats april 2018
 Technical Documentation Demostats 2018 april 2018 what it is DemoStats is a database of estimates and projections for a comprehensive set of demographic and socioeconomic attributes about the Canadian
Speakers: Jeff Price, Federal Transit Administration Linda Young, Center for Neighborhood Technology Sofia Becker, Center for Neighborhood Technology
 Speakers: Jeff Price, Federal Transit Administration Linda Young, Center for Neighborhood Technology Sofia Becker, Center for Neighborhood Technology Peter Haas, Center for Neighborhood Technology Craig
Task A4, Appendix A: Maryland Land Use and Impact Assessment Model
 Task A4, Appendix A: Maryland Land Use and Impact Assessment Model The LEAM Model During the last two decades, spatial analysis tools, geographic information systems (GIS), and remote-sensing (RS) technologies
Joanne N. Halls, PhD Dept. of Geography & Geology David Kirk Information Technology Services
 Joanne N. Halls, PhD Dept. of Geography & Geology David Kirk Information Technology Services Geographic Information Systems manage and analyze data to solve spatial problems. Real World Abstraction Analysis
ENVISIONING OUR CITY: 2041 PUBLIC INFORMATION CENTRE #2 November 16, 2017
 ENVISIONING OUR CITY: 2041 PUBLIC INFORMATION CENTRE #2 November 16, 2017 Purpose of the Public Information Centre The City of Brantford is undertaking three studies to guide future development to 2041
Opportunities and challenges of HCMC in the process of development
 Opportunities and challenges of HCMC in the process of development Lê Văn Thành HIDS HCMC, Sept. 16-17, 2009 Contents The city starting point Achievement and difficulties Development perspective and goals
Regional Snapshot Series: Transportation and Transit. Commuting and Places of Work in the Fraser Valley Regional District
 Regional Snapshot Series: Transportation and Transit Commuting and Places of Work in the Fraser Valley Regional District TABLE OF CONTENTS Complete Communities Daily Trips Live/Work Ratio Commuting Local
Understanding the modifiable areal unit problem
 Understanding the modifiable areal unit problem Robin Flowerdew School of Geography and Geosciences, University of St Andrews March 2009 Acknowledgements Mick Green (Lancaster) and David Steel (Wollongong),
Developing the Transit Demand Index (TDI) Gregory Newmark, Regional Transportation Authority Transport Chicago Presentation July 25, 2012
 Gregory Newmark, Regional Transportation Authority Transport Chicago Presentation July 25, 2012") Developing the Transit Demand Index (TDI) Gregory Newmark, Regional Transportation Authority Transport Chicago Presentation July 25, 2012 Outline Present RTA methodology Transit Demand Index (TDI) Demonstrate
Developing the Transit Demand Index (TDI) Gregory Newmark, Regional Transportation Authority Transport Chicago Presentation July 25, 2012 Outline Present RTA methodology Transit Demand Index (TDI) Demonstrate
Geography for the 2020 Round of Census
 Boundaries Key Census Data EA Id Population Male Female EA Id Area EA Id Num HH Avg HH size Geography for the 2020 Round of Census Linda Peters, Esri lpeters@esri.com Integration of Statistical and Geospatial
CHANGES IN THE STRUCTURE OF POPULATION AND HOUSING FUND BETWEEN TWO CENSUSES 1 - South Muntenia Development Region
 TERITORIAL STATISTICS CHANGES IN THE STRUCTURE OF POPULATION AND HOUSING FUND BETWEEN TWO CENSUSES 1 - South Muntenia Development Region PhD Senior Lecturer Nicu MARCU In the last decade, a series of structural
GIS in Community & Regional Planning
 GIS in Community & Regional Planning The The role role of of GIS GIS in in Re-writing the the Zoning Bylaw for for the the City City of of Vernon LandInfo Technologies Presentation Overview The GIS Initiative
Council Workshop on Neighbourhoods Thursday, October 4 th, :00 to 4:00 p.m. Burlington Performing Arts Centre
 Council Workshop on Neighbourhoods Thursday, October 4 th, 2012 1:00 to 4:00 p.m. Burlington Performing Arts Centre Agenda Introductions Warm-Up Exercise Presentation Exercise Neighbourhood Planning Break