Understanding the modifiable areal unit problem
|
|
|
- Terence Powers
- 5 years ago
- Views:
Transcription
1 Understanding the modifiable areal unit problem Robin Flowerdew School of Geography and Geosciences, University of St Andrews March 2009
2 Acknowledgements Mick Green (Lancaster) and David Steel (Wollongong), statisticians ESRC / JISC for purchase of Census data (Crown copyright) for UK academic community David Martin (Southampton) for use of AZTool University of Canterbury for Erskine Visiting Fellowship Clive Sabel, Jamie Pearce and David Manley for help with data manipulation
3 What is the Modifiable Areal Unit Problem (MAUP)? Investigating neighbourhood boundaries and health Why does it happen? Local and regional effects Spatial autocorrelation Local processes Identifying processes scales and areal zones Deriving data to reflect the processes Where does this leave us?
4 What is the MAUP? The same basic data yield different results when aggregated in different ways First First identified by Gehlke and Biehl (1934) Affects Affects many types of analysis, including correlation and regression Applies Applies where data are aggregated to areal units which could take many forms e.g. postcode sectors, local government units, store catchment areas, grid squares Work Work by (among others) Openshaw (1984), Fotheringham & Wong (1991), Tranmer & Steel (2001), on how and why the MAUP exists, and what can be done about it.
5 The MAUP scale and zonation issues Two aspects the scale effect,, showing major analytical differences depending on the size of units used (generally correlations more pronounced for bigger units) - the zonation effect (Openshaw calls it the aggregation effect), showing major differences depending on how the study area is divided up, even at the same scale
6 Zonation effect Simple example shows how different zonal systems give very different results from same data without major variations in zone sizes or elongated shapes
7 Variables X and Y are defined for a 3x3 grid 20 Zonation 1: X 15 X Y Y r(x,y) =.700 r 1 (X,Y) = r 2 (X,Y) =.913 Zonation 2: X Y
8 The MAUP in practice Taylor and Openshaw (1979) found that correlations in Iowa between Republican voting and percentage of old people could vary from -.97 to +.99 depending on how counties were aggregated. Openshaw and Rao (1995) achieved correlations between unemployment and no car households in Merseyside from to But shapes are convoluted and sizes variable Much less variation for more realistic zonal schemes

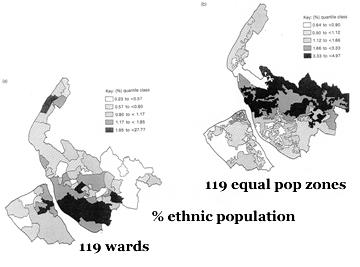
9 Shape and the MAUP
10 All shapes and sizes But shapes are convoluted and sizes variable Much less variation for more realistic zonal schemes Manley (2006) took pairs of census variables and correlated them at ward and ED level statistically significant differences in almost all cases
11 Example: the neighbourhood effect in health geography Often suggested health may be affected by contextual effects health in the neighbourhood may affect individuals health But how big is a neighbourhood? Does it matter where we draw the boundaries? Recent research (Flowerdew, Sabel and Manley 2008) looks at this and finds, for the case investigated, that the MAUP is not too worrying
12 Wards as neighbourhoods Ward-level and ED-level figures calculated for % limiting long-term illness (pcllti) ED-level pcllti then modelled as a function of other % variables Then ward-level pcllti added as a contextual effect Models weighted by population
13 Results ward system Ward-level Pcllti = pcpens pcnonw pcmunem R 2 =.870 ED-level (without neighbourhood effect) Pcllti = pcpens pcnonw pcmunem R 2 =.733 ED-level (with neighbourhood effect) Pcllti = pcpens pcnonw pcmunem pclltiwd R 2 =.747
14 Designing new zonal systems So far, assumed neighbourhood = ward But what if the boundaries were different? Zone design software will generate sets of pseudo-wards, based on several criteria: Pop. threshold Pop. target (e.g. average ward pop.) Shape (perimeter squared / area) Homogeneity
15 Northamptonshire example Study area needed Has to be reasonably sized No coastline Range of settlement sizes Knowledge of places


16

17

18
19 The zonal systems Differences in overall patterns, based on: a) the effect of constraints b) random variation (process starts from randomly selected seeds ) c) often, whether zones of different types happen to be grouped together
20 Regression results Run R 2 Pseudo-ward Standard Sig. coefficient error yes yes yes yes yes yes yes yes yes yes yes
21 Further analysis - Thamesdown District of 170,000 around Swindon 21 wards, urban centre, rural periphery

22 Thamesdown wards, 1991 Limiting long- term illness
23 Thamesdown EDs, 1991 Limiting long- term illness
24 Pseudo-ward systems Pseudo-ward systems can be generated with different constraints, of which population equality, shape and homogeneity are the main factors All systems had zones of reasonably equal populations and sensible shapes
25 Variations in correlation structure The zonation effect suggests that there could be important changes in correlation coefficients for different zonal systems X Y highest r lowest r Pcllti pcwhite Pcllti pckids Pcllti pcpens Pcllti pcunem Pcllti pcoo Pcllti pcla Pcunem pcla
26 Regression of illness on other variables At ED level, Pcllti = pcwhite pcpens pcunem pcla (R 2 =.847) Adding neighbourhood variable, gives Pcllti = pcwhite pcpens pcunem pcla nbdpw (s.e..049) (R 2 =.847) i.e. neighbourhood variable is not significant
27 The neighbourhood effect in other zonal systems To date, R 2 values have ranged from.849 to.995 In most cases, neighbourhood effect is positive and small but statistically significant Biggest impact was to raise R 2 from.980 to.995
28 Conclusions about neighbourhood boundaries Possible to generate pseudo-ward zonal systems, with different constraints When relevant, analysts should try different zonal systems to test robustness of results In Northamptonshire, the neighbourhood effect varies from.117 to.201 however it s s always +ve and significant it does not matter in this case how you draw the boundaries In Thamesdown, it varies from.084 to.731 not always significant perhaps it does matter here!
29 Why does it happen? Size of correlation coefficient r is greatly influenced by highest and lowest values: if high X associated with high Y (and low X with low Y), you get high positive r If high X associated with low Y (and low X with high Y) high negative r If aggregation groups zones with high X values (and / or high Y values) this effect is intensified If it groups high X zones with low X zones (or with average X zones), the effect is diluted
30 MAUP and spatial autocorrelation If the high values of X or Y are close together (positive spatial autocorrelation), grouping is likely to intensify the correlation of X and Y If high values are scattered around the study area (low spatial autocorrelation), grouping will diminish their effect MAUP effect results from interplay of these Effect of grouping may be largely a chance factor or may come from a desire for homogeneity from people drawing the boundaries
31 Local and regional effects Processes with spatial aspects may generate the MAUP E.g. the labour market unemployment in zone i depends on job vacancies not just in i but in surrounding zones too The housing market likewise i.e. local and regional effects Problem: identifying the region! Work assumed local = ED and regional = ward, but why should labour market respect ward boundaries?
32 Local processes Often our understanding of the distribution of X or Y reflects local knowledge we know a housing estate is located here, a good school is located there, an ethnic enclave is over there Such information can in part explain mapped patterns and correlations, and can suggest the configuration of zones that best reflects geographical reality i.e. descriptive empirical studies can inform modelling
33 Identifying processes scales and areal units Need to recognise that geographical processes occur at particular scales, and studying them at the wrong scale may not be very helpful Further, data are not always available at the right scale usually impossible to disaggregate data below its scale of supply Even if data are available for very small areas, it may not be clear how to aggregate them up
34 Finding data to reflect the processes MAUP has a zonation effect too even if data are at the right scale, they may not be configured in a way that reflects the processes going on Should we design a set of zones specifically to fit an empirical problem? (perhaps by finding a set of zones to maximise correlation) Would this be cheating?
35 Optimal scales may vary spatially Note also that appropriate scales may be different for different places social segregation for example may affect whole wards in big cities but a few EDs in towns Appropriate scales may be different even within the same study area
36 Where does this leave us? - 1 Scales of process are not always the same as scales for which we have data likewise for configurations We need to be critical of the data for these reasons as well as many others We need to think about the processes being studied and the scales of data needed
37 Where does this leave us? - 2 Most statistical work using modifiable areal unit data is deficient because zonal system doesn t fit processes - and probably underestimates the strength of relationships Statistical results are not independent of the zonal systems the data come from Probably worth analysing data at several different scales, noting the differences and using them to help identify processes Good zone design software becoming available
Geographical Inequalities and Population Change in Britain,
 Geographical Inequalities and Population Change in Britain, 1971-2011 Chris Lloyd, Nick Bearman, Gemma Catney Centre for Spatial Demographics Research, University of Liverpool, UK Email: c.d.lloyd@liverpool.ac.uk
Exploring Digital Welfare data using GeoTools and Grids
 Exploring Digital Welfare data using GeoTools and Grids Hodkinson, S.N., Turner, A.G.D. School of Geography, University of Leeds June 20, 2014 Summary As part of the Digital Welfare project [1] a Java
Spatial Analysis and Modeling (GIST 4302/5302) Guofeng Cao Department of Geosciences Texas Tech University
 Guofeng Cao Department of Geosciences Texas Tech University") Spatial Analysis and Modeling (GIST 4302/5302) Guofeng Cao Department of Geosciences Texas Tech University Outline of This Week Last week, we learned: Data representation: Object vs. Fieldbased approaches
Spatial Analysis and Modeling (GIST 4302/5302) Guofeng Cao Department of Geosciences Texas Tech University Outline of This Week Last week, we learned: Data representation: Object vs. Fieldbased approaches
Population health across space & time: geographical harmonisation of the ONS Longitudinal Study for England & Wales
 British Society for Population Studies Annual Conference, York, September 2011 Population health across space & time: geographical harmonisation of the ONS Longitudinal Study for England & Wales Paul Norman
Spatial Analysis 1. Introduction
 Spatial Analysis 1 Introduction Geo-referenced Data (not any data) x, y coordinates (e.g., lat., long.) ------------------------------------------------------ - Table of Data: Obs. # x y Variables -------------------------------------
Commuting in Northern Ireland: Exploring Spatial Variations through Spatial Interaction Modelling
 Commuting in Northern Ireland: Exploring Spatial Variations through Spatial Interaction Modelling 1. Introduction C. D. Lloyd, I. G. Shuttleworth, G. Catney School of Geography, Archaeology and Palaeoecology,
Ethnic and socioeconomic segregation in Belgium A multi-scalar approach using individualised neighbourhoods
 Ethnic and socioeconomic segregation in Belgium A multi-scalar approach using individualised neighbourhoods Rafael Costa and Helga de Valk PAA 2016 Annual Meeting Extended abstract (Draft: please do not
Mapping Welsh Neighbourhood Types. Dr Scott Orford Wales Institute for Social and Economic Research, Data and Methods WISERD
 Mapping Welsh Neighbourhood Types Dr Scott Orford Wales Institute for Social and Economic Research, Data and Methods WISERD orfords@cardiff.ac.uk WISERD Established in 2008 and funded by the ESRC and HEFCW
Understanding Your Community A Guide to Data
 Understanding Your Community A Guide to Data Alex Lea September 2013 Research and Insight Team LeicestershireCounty Council Understanding Geographies Important to understand the various geographies that
Understanding the 2011 Census Geographies December 2012
 Introduction Understanding the 2011 Census Geographies December 2012 10 21 Other useful documents: The release of the 2011 Census results has brought with it some changes to the geographies at which we
Nature of Spatial Data. Outline. Spatial Is Special
 Nature of Spatial Data Outline Spatial is special Bad news: the pitfalls of spatial data Good news: the potentials of spatial data Spatial Is Special Are spatial data special? Why spatial data require
Medical GIS: New Uses of Mapping Technology in Public Health. Peter Hayward, PhD Department of Geography SUNY College at Oneonta
 Medical GIS: New Uses of Mapping Technology in Public Health Peter Hayward, PhD Department of Geography SUNY College at Oneonta Invited research seminar presentation at Bassett Healthcare. Cooperstown,
National Statistics 2001 Area Classifications
 National Statistics 2001 Area Classifications John Charlton, ONS see http://neighbourhood.statistics.gov.uk areaclassifications@ons.gov.uk Copyright ONS What are the Area Classifications Summarise 2001
Urban GIS for Health Metrics
 Urban GIS for Health Metrics Dajun Dai Department of Geosciences, Georgia State University Atlanta, Georgia, United States Presented at International Conference on Urban Health, March 5 th, 2014 People,
Data Collection: What Is Sampling?
 Project Planner Data Collection: What Is Sampling? Title: Data Collection: What Is Sampling? Originally Published: 2017 Publishing Company: SAGE Publications, Inc. City: London, United Kingdom ISBN: 9781526408563
GIST 4302/5302: Spatial Analysis and Modeling
 GIST 4302/5302: Spatial Analysis and Modeling Basics of Statistics Guofeng Cao www.myweb.ttu.edu/gucao Department of Geosciences Texas Tech University guofeng.cao@ttu.edu Spring 2015 Outline of This Week
Thomas Vanoutrive University of Antwerp Faculty of Applied Economics Department of Transport and Regional Economics
 AUTOMATICALLY GENERATED PORT HINTERLANDS PRELIMINARY WORK Thomas Vanoutrive University of Antwerp Faculty of Applied Economics Department of Transport and Regional Economics abstract Competition between
PIBC Annual Conference, 2016
 Land Use Quantified PIBC Annual Conference, 2016 A collaboration between: Christy & Associated Planning Consultants The Sustainable Transportation Partnership of the Central Okanagan Hazel Christy Rafael
The Building Blocks of the City: Points, Lines and Polygons
 The Building Blocks of the City: Points, Lines and Polygons Andrew Crooks Centre For Advanced Spatial Analysis andrew.crooks@ucl.ac.uk www.gisagents.blogspot.com Introduction Why use ABM for Residential
What are we like? Population characteristics from UK censuses. Justin Hayes & Richard Wiseman UK Data Service Census Support
 What are we like? Population characteristics from UK censuses Justin Hayes & Richard Wiseman UK Data Service Census Support Who are we? Richard Wiseman UK Data Service / Jisc Justin Hayes UK Data Service
Spatial Data, Spatial Analysis and Spatial Data Science
 Spatial Data, Spatial Analysis and Spatial Data Science Luc Anselin http://spatial.uchicago.edu 1 spatial thinking in the social sciences spatial analysis spatial data science spatial data types and research
Understanding and accessing 2011 census aggregate data
 Understanding and accessing 2011 census aggregate data 4 July 11:00 to 16:00 BST Justin Hayes and Richard Wiseman UK Data Service Census Support UK censuses provide an unparalleled resource of high quality
GEOGRAPHIC INFORMATION SYSTEMS
 GEOGRAPHIC INFORMATION SYSTEMS 4-H Round-Up Community Transitions Workshop Daniel Hanselka June 14, 2011 Goals of the Workshop Answer the question: What is GIS? Uses of GIS. Some of the Common Terminology
USING CENSUS OUTPUT AREAS FOR MARKET RESEARCH SAMPLING
 USING CENSUS OUTPUT AREAS FOR MARKET RESEARCH SAMPLING Martin van Staveren Small Area Geography Planning for the Future MRS CGG Seminar, 5 th February 2007 INITIAL USE OF GEODEMOGRAPHICS BMRB was first
Assessing the impact of seasonal population fluctuation on regional flood risk management
 Assessing the impact of seasonal population fluctuation on regional flood risk management Alan Smith *1, Andy Newing 2, Niall Quinn 3, David Martin 1 and Samantha Cockings 1 1 Geography and Environment,
Geob 370 Lab Crime in the City
 Crime in the City In this lab you ll be introduced to some important GIScience concepts the modifiable areal unit problem and the effects it has on statistics derived from spatial data, and some cartographic
Problems In Large Cities
 Chapter 11 Problems In Large Cities Create a list of at least 10 problems that exist in large cities. Consider problems that you have read about in this and other chapters and/or experienced yourself.
Frans Thissen Department of Geography, Planning and International Development Studies Rural Poverty in Flanders
 Frans Thissen Department of Geography, Planning and International Development Studies Rural Poverty in Flanders a diversity of poverty in a diversity of places Rural poverty research in Flanders Henk Meert
USING DOWNSCALED POPULATION IN LOCAL DATA GENERATION
 USING DOWNSCALED POPULATION IN LOCAL DATA GENERATION A COUNTRY-LEVEL EXAMINATION CONTENT Research Context and Approach. This part outlines the background to and methodology of the examination of downscaled
CHANGES IN THE STRUCTURE OF POPULATION AND HOUSING FUND BETWEEN TWO CENSUSES 1 - South Muntenia Development Region
 TERITORIAL STATISTICS CHANGES IN THE STRUCTURE OF POPULATION AND HOUSING FUND BETWEEN TWO CENSUSES 1 - South Muntenia Development Region PhD Senior Lecturer Nicu MARCU In the last decade, a series of structural
Analysis of travel-to-work patterns and the identification and classification of REDZs
 Analysis of travel-to-work patterns and the identification and classification of REDZs Dr David Meredith, Teagasc, Spatial Analysis Unit, Rural Economy Development Programme, Ashtown, Dublin 15. david.meredith@teagasc.ie
Transport Planning in Large Scale Housing Developments. David Knight
 Transport Planning in Large Scale Housing Developments David Knight Large Scale Housing Developments No longer creating great urban spaces in the UK (Hall 2014) Transport Planning Transport planning processes
Geob 370 Lab Crime in the City
 Crime in the City In this lab you ll be introduced to some important GIScience concepts spatial autocorrelation (SA), which contributes to the modifiable areal unit problem (MAUP), the effects SA and MAUP
Neighborhood social characteristics and chronic disease outcomes: does the geographic scale of neighborhood matter? Malia Jones
 Neighborhood social characteristics and chronic disease outcomes: does the geographic scale of neighborhood matter? Malia Jones Prepared for consideration for PAA 2013 Short Abstract Empirical research
Types of spatial data. The Nature of Geographic Data. Types of spatial data. Spatial Autocorrelation. Continuous spatial data: geostatistics
 The Nature of Geographic Data Types of spatial data Continuous spatial data: geostatistics Samples may be taken at intervals, but the spatial process is continuous e.g. soil quality Discrete data Irregular:
Application Issues in GIS: the UCL Centre for Advanced Spatial Analysis. Paul Longley UCL
 Application Issues in GIS: the UCL Centre for Advanced Spatial Analysis Paul Longley UCL GIS: inclusive, shared understanding Geodemographics as a focus of interest Profiling public goods and services
GIS and Spatial Statistics: One World View or Two? Michael F. Goodchild University of California Santa Barbara
 GIS and Spatial Statistics: One World View or Two? Michael F. Goodchild University of California Santa Barbara Location as attribute The data table Census summary table What value is location as an explanatory
DATA DISAGGREGATION BY GEOGRAPHIC
 PROGRAM CYCLE ADS 201 Additional Help DATA DISAGGREGATION BY GEOGRAPHIC LOCATION Introduction This document provides supplemental guidance to ADS 201.3.5.7.G Indicator Disaggregation, and discusses concepts
Comparison of spatial methods for measuring road accident hotspots : a case study of London
 Journal of Maps ISSN: (Print) 1744-5647 (Online) Journal homepage: http://www.tandfonline.com/loi/tjom20 Comparison of spatial methods for measuring road accident hotspots : a case study of London Tessa
Exploring the Impact of Ambient Population Measures on Crime Hotspots
 Exploring the Impact of Ambient Population Measures on Crime Hotspots Nick Malleson School of Geography, University of Leeds http://nickmalleson.co.uk/ N.S.Malleson@leeds.ac.uk Martin Andresen Institute
Integrating GIS into Food Access Analysis
 GIS Day at Kansas University Integrating GIS into Food Access Analysis Daoqin Tong School of Geography and Development Outline Introduction Research questions Method Results Discussion Introduction Food
Introducing GIS analysis
 1 Introducing GIS analysis GIS analysis lets you see patterns and relationships in your geographic data. The results of your analysis will give you insight into a place, help you focus your actions, or
Chapter 9 Urban Geography (Making questions from notes)
") Chapter 9 Urban Geography (Making questions from notes) Remember that you book is laid out rather neatly in that it divides sections of the chapter into Key Questions. What you want to do is make up questions
Chapter 9 Urban Geography (Making questions from notes) Remember that you book is laid out rather neatly in that it divides sections of the chapter into Key Questions. What you want to do is make up questions
CONSTRUCTING THE POVERTY AND OPPORTUNITIES/PUBLIC SERVICES MAPS INFORMATION MANAGEMENT. Background: Brazil Without Extreme Poverty Plan
 INFORMATION MANAGEMENT CONSTRUCTING THE POVERTY AND OPPORTUNITIES/PUBLIC SERVICES MAPS Background: Brazil Without Extreme Poverty Plan The Brazil Without Extreme Poverty Plan (BSM), designed to overcome
Guilty of committing ecological fallacy?
 GIS: Guilty of committing ecological fallacy? David W. Wong Professor Geography and GeoInformation Science George Mason University dwong2@gmu.edu Ecological Fallacy (EF) Many slightly different definitions
Fuzzy Geographically Weighted Clustering
 Fuzzy Geographically Weighted Clustering G. A. Mason 1, R. D. Jacobson 2 1 University of Calgary, Dept. of Geography 2500 University Drive NW Calgary, AB, T2N 1N4 Telephone: +1 403 210 9723 Fax: +1 403
A national-scale application of the Huff gravity model for the estimation of town centre retail catchment area
 A national-scale application of the Huff gravity model for the estimation of town centre retail catchment area Michail Pavlis, Les Dolega, Alex Singleton Department of Geography and Planning, School of
Using flow and stock data from Censuses to compare trends in British city regions
 Using flow and stock data from Censuses to compare trends in British city regions Mike Coombes & Tony Champion CURDS, Newcastle University with acknowledgements colleagues: not only in CURDS (David Bradley,
Millennium Cohort Study:
 Millennium Cohort Study: Geographic Identifiers in MCS June 2009 Jon Johnson Centre for Longitudinal Studies Faculty of Policy and Society Institute of Education, University of London Page 1 Introduction
Gridded population. redistribution models and applications. David Martin 20 February 2009
 Gridded population data for the UK redistribution models and applications David Martin 20 February 2009 Overview UK gridded data history (brief!) Small area data availability Grid-based modelling responses
Chapter 9: Urban Geography
 Chapter 9: Urban Geography The Five Steps to Chapter Success Step 1: Read the Chapter Summary below, preview the Key Questions, and Geographic Concepts. Step 2: Complete the Pre-Reading Activity (PRA)
A possible solution for the centroid-to-centroid and intra-zonal trip length problems
 A possible solution for the centroid-to-centroid and intra-zonal trip length problems Maryam Kordi Centre for GeoInformatics (CGI) School of Geography & Geosciences University of St Andrews St Andrews,
Topic 4: Changing cities
 Topic 4: Changing cities Overview of urban patterns and processes 4.1 Urbanisation is a global process a. Contrasting trends in urbanisation over the last 50 years in different parts of the world (developed,
Evaluation of automated maintenance procedures
 Evaluation of automated maintenance procedures Samantha Cockings and Andrew Harfoot School of Geography University of Southampton September 2010 Produced by the Census2011Geog project (ESRC Census Programme
Administrative Data Research Facility Linked HMDA and ACS Database
 University of Pennsylvania ScholarlyCommons 2017 ADRF Network Research Conference Presentations ADRF Network Research Conference Presentations 11-2017 Administrative Data Research Facility Linked HMDA
The Efficacy of Focused Enumeration. Patten Smith, IpsosMORI Kevin Pickering, NatCen Joel Williams, TNS-BMRB Rachel Hay, Ipsos-MORI
 The Efficacy of Focused Enumeration Patten Smith, IpsosMORI Kevin Pickering, NatCen Joel Williams, TNS-BMRB Rachel Hay, Ipsos-MORI Structure of session 1. Introduction: identifying ethnic minorities in
Track 1: From CRM to decision support. Steven Halsall, Director, GeoBusiness Solutions Ltd
 the agi conference at GIS 2001 Track 1: From CRM to decision support t1.4 Identifying the Real Catchments of UK Shopping Locations Steven Halsall, Director, GeoBusiness Solutions Ltd Abstract One of the
GEOG 3340: Introduction to Human Geography Research
 GEOG 3340: Introduction to Human Geography Research Lecture 1: Course Overview Guofeng Cao www.myweb.ttu.edu/gucao Department of Geosciences Texas Tech University guofeng.cao@ttu.edu Fall 2015 Course Description
GIS Spatial Statistics for Public Opinion Survey Response Rates
 GIS Spatial Statistics for Public Opinion Survey Response Rates July 22, 2015 Timothy Michalowski Senior Statistical GIS Analyst Abt SRBI - New York, NY t.michalowski@srbi.com www.srbi.com Introduction
The geography of domestic energy consumption
 The geography of domestic energy consumption Anastasia Ushakova PhD student at CDRC UCL Ellen Talbot PhD student at CDRC Liverpool Some important research questions How can we classify energy consumption
A Guide to Census Geography
 Research Briefing 2013-05 July 2013 A Guide to Census Geography Contents 1 About this Briefing... 3 2 Sub Ward Geography... 3 3 The Geographical Hierarchies... 3 4 The Statistical Hierarchy... 4 5 Nesting...
Regionalizing and Understanding Commuter Flows: An Open Source Geospatial Approach
 Regionalizing and Understanding Commuter Flows: An Open Source Geospatial Approach Lorraine Barry School of Natural and Built Environment, Queen's University Belfast l.barry@qub.ac.uk January 2017 Summary
APPLIED FIELDWORK ENQUIRY SAMPLE ASSESSMENT MATERIALS
 GCSE GEOGRAPHY B Sample Assessment Materials 85 GCSE GEOGRAPHY B COMPONENT 3 APPLIED FIELDWORK ENQUIRY SAMPLE ASSESSMENT MATERIALS 1 hour 30 minutes For examiner s use only SPaG Part A 18 0 Part B 18 0
Sampling. Benjamin Graham
 Sampling Benjamin Graham Schedule This Week: Sampling and External Validity How many kids? Fertility rate in the US. could be interesting as an independent or a dependent variable. How many children did
DIFFERENT INFLUENCES OF SOCIOECONOMIC FACTORS ON THE HUNTING AND FISHING LICENSE SALES IN COOK COUNTY, IL
 DIFFERENT INFLUENCES OF SOCIOECONOMIC FACTORS ON THE HUNTING AND FISHING LICENSE SALES IN COOK COUNTY, IL Xiaohan Zhang and Craig Miller Illinois Natural History Survey University of Illinois at Urbana
Links between socio-economic and ethnic segregation at different spatial scales: a comparison between The Netherlands and Belgium
 Links between socio-economic and ethnic segregation at different spatial scales: a comparison between The Netherlands and Belgium Bart Sleutjes₁ & Rafael Costa₂ ₁ Netherlands Interdisciplinary Demographic
Key Issue 1: Why Do Services Cluster Downtown?
 Key Issue 1: Why Do Services Cluster Downtown? Pages 460-465 1. Define the term CBD in one word. 2. List four characteristics of a typical CBD. Using your knowledge of services from chapter 12, define
Key Issue 1: Why Do Services Cluster Downtown?
 Key Issue 1: Why Do Services Cluster Downtown? Pages 460-465 ***Always keep your key term packet out whenever you take notes from Rubenstein. As the terms come up in the text, think through the significance
CRP 608 Winter 10 Class presentation February 04, Senior Research Associate Kirwan Institute for the Study of Race and Ethnicity
 CRP 608 Winter 10 Class presentation February 04, 2010 SAMIR GAMBHIR SAMIR GAMBHIR Senior Research Associate Kirwan Institute for the Study of Race and Ethnicity Background Kirwan Institute Our work Using
Spatial Organization of Data and Data Extraction from Maptitude
 Spatial Organization of Data and Data Extraction from Maptitude N. P. Taliceo Geospatial Information Sciences The University of Texas at Dallas UT Dallas GIS Workshop Richardson, TX March 30 31, 2018 1/
2. What is a settlement? Why do services cluster in settlements?
 Chapter 12: Services Introduction and Case Study (p. 397-399) 1. What is a service? How do LDCs and MDCs differ in regards to the number of workers employed in service- sector jobs? 2. What is a settlement?
British Household Panel Survey, waves 1-17 ( )
") UK Data Archive Study Number 6032 - British Household Panel Survey, Waves 1-17, 1991-2008: Conditional Access, Rural-Urban s British Household Panel Survey, waves 1-17 (1991-2008) User Documentation: Rural-Urban
UK Data Archive Study Number 6032 - British Household Panel Survey, Waves 1-17, 1991-2008: Conditional Access, Rural-Urban s British Household Panel Survey, waves 1-17 (1991-2008) User Documentation: Rural-Urban
Techniques for Science Teachers: Using GIS in Science Classrooms.
 Techniques for Science Teachers: Using GIS in Science Classrooms. After ESRI, 2008 GIS A Geographic Information System A collection of computer hardware, software, and geographic data used together for
Center for Demography and Ecology
 Center for Demography and Ecology University of Wisconsin-Madison When Census Geography Doesn t Work: Using Ancillary Information to Improve the Spatial Interpolation of Demographic Data Paul R. Voss David
Megacity Research Project TP. Ho Chi Minh Adaptation to Global Climate Change in Vietnam: Integrative Urban and Environmental Planning Framework
 1. Organization 2. Global Warming 3. Starting Phase 4. Results, Transdisciplinarity, Low-Rise High Density 5. Risk of Flooding 6. Partners 7. Action Field 1 8. Action Field 2 9. Urban Development Trends
Irish Industrial Wages: An Econometric Analysis Edward J. O Brien - Junior Sophister
 Irish Industrial Wages: An Econometric Analysis Edward J. O Brien - Junior Sophister With pay agreements firmly back on the national agenda, Edward O Brien s topical econometric analysis aims to identify
The polygon overlay problem in electoral geography
 The polygon overlay problem in electoral geography Romain Louvet *1,2, Jagannath Aryal 2, Didier Josselin 1,3, Christèle Marchand-Lagier 4, Cyrille Genre-Grandpierre 1 1 UMR ESPACE 7300 CNRS, Université
Workshop on Modelling Population 24/7
 Workshop on Modelling Population 24/7 26 January 2010 Welcome, introductions and context Programme for day 10.30 Welcome, introductions and context 11.30 Guest presentations 12.30 Pop24/7 project overview
R E SEARCH HIGHLIGHTS
 Canada Research Chair in Urban Change and Adaptation R E SEARCH HIGHLIGHTS Research Highlight No.8 November 2006 THE IMPACT OF ECONOMIC RESTRUCTURING ON INNER CITY WINNIPEG Introduction This research highlight
Unit 8 Settlement Geography: Urban and Rural, Cities and City Life
 Unit 8 Settlement Geography: Urban and Rural, Cities and City Life 38:180 Human Geography Settlement Geography Principally urban, but a continuum: Hamlet Village Town City plus rural World is predominantly
THE DIFFICULTY OF LINKING TWO DIFFERENTLY AGGREGATED SPATIAL DATASETS: USING A LOOK-UP TABLE TO LINK POSTAL SECTORS AND 1991
 THE DIFFICULTY OF LINKING TWO DIFFERENTLY AGGREGATED SPATIAL DATASETS: USING A LOOK-UP TABLE TO LINK POSTAL SECTORS AND 1991 CENSUS ENUMERATION DISTRICTS Daniel Vickers School of Geography University of
How Geography Affects Consumer Behaviour The automobile example
 How Geography Affects Consumer Behaviour The automobile example Murtaza Haider, PhD Chuck Chakrapani, Ph.D. We all know that where a consumer lives influences his or her consumption patterns and behaviours.
Regression Analysis. A statistical procedure used to find relations among a set of variables.
 Regression Analysis A statistical procedure used to find relations among a set of variables. Understanding relations Mapping data enables us to examine (describe) where things occur (e.g., areas where
Population 24/7 Download: User Guide. Purpose
 Population 24/7 Download: User Guide Purpose The Population 24/7 Download application is designed to enable a user to navigate around a map of England and Wales; select an area of interest represented
How proximity to a city influences the performance of rural regions by Lewis Dijkstra and Hugo Poelman
 n 01/2008 Regional Focus A series of short papers on regional research and indicators produced by the Directorate-General for Regional Policy Remote Rural Regions How proximity to a city influences the
An Open Source Geodemographic Classification of Small Areas In the Republic of Ireland Chris Brunsdon, Martin Charlton, Jan Rigby
 An Open Source Geodemographic Classification of Small Areas In the Republic of Ireland Chris Brunsdon, Martin Charlton, Jan Rigby National Centre for Geocomputation National University of Ireland, Maynooth
(Department of Urban and Regional planning, Sun Yat-sen University, Guangzhou , China)
") DOI:10.13959/j.issn.1003-2398.2008.05.001 :1003-2398(2008)05-0061-06, (, 510275) RESIDENTIAL SEGREGATION OF FLOATING POPULATION AND DRIVING FORCES IN GUANGZHOU CITY YUAN Yuan, XU Xue-qiang (Department
DOI:10.13959/j.issn.1003-2398.2008.05.001 :1003-2398(2008)05-0061-06, (, 510275) RESIDENTIAL SEGREGATION OF FLOATING POPULATION AND DRIVING FORCES IN GUANGZHOU CITY YUAN Yuan, XU Xue-qiang (Department
Everything is related to everything else, but near things are more related than distant things.
 SPATIAL ANALYSIS DR. TRIS ERYANDO, MA Everything is related to everything else, but near things are more related than distant things. (attributed to Tobler) WHAT IS SPATIAL DATA? 4 main types event data,
Dorling fbetw.tex V1-04/12/2012 6:10 P.M. Page xi
 Dorling fbetw.tex V1-04/12/2012 6:10 P.M. Page xi List of figures P.1 Born in England, Scotland or Wales Britain 1981 (four levels each), ward map (wards are used to define most other administrative areas
Can we map ACS data with confidence?
 ACS User Conference, 2017 Alexandria, VA May 11-12, 2017 Can we map ACS data with confidence? David W Wong & Min Sun George Mason University Research reported in this presentation was partly supported
Simulating household location choice at different geographical levels with UrbanSim
 Simulating household location choice at different geographical levels with UrbanSim Laboratory of Transport Economics (LET) (CNRS, University of Lyon, ENTPE) Marko Kryvobokov, Dominique Bouf Nicolas Ovtracht,
Ch. 13: Urban Patterns
 Ch. 13: Urban Patterns Name: Introduction & Case Study (p. 430-432) 1. Describe some differences between urban and rural environments. 2. Why do MDCs have a higher percentage of people living in urban
Spatial Trends of unpaid caregiving in Ireland
 Spatial Trends of unpaid caregiving in Ireland Stamatis Kalogirou 1,*, Ronan Foley 2 1. NCG Affiliate, Thoukididi 20, Drama, 66100, Greece; Tel: +30 6977 476776; Email: skalogirou@gmail.com; Web: http://www.gisc.gr.
Frontier and Remote (FAR) Area Codes: A Preliminary View of Upcoming Changes John Cromartie Economic Research Service, USDA
 Area Codes: A Preliminary View of Upcoming Changes John Cromartie Economic Research Service, USDA") National Center for Frontier Communities webinar, January 27, 2015 Frontier and Remote (FAR) Area Codes: A Preliminary View of Upcoming Changes John Cromartie Economic Research Service, USDA The views
National Center for Frontier Communities webinar, January 27, 2015 Frontier and Remote (FAR) Area Codes: A Preliminary View of Upcoming Changes John Cromartie Economic Research Service, USDA The views
Secondary Towns, Population and Welfare in Mexico
 Public Disclosure Authorized Public Disclosure Authorized Public Disclosure Authorized Secondary Towns, Population and Welfare in Mexico Isidro Soloaga Department of Economics, Universidad Iberoamericana,
Summary and Implications for Policy
 Summary and Implications for Policy 1 Introduction This is the report on a background study for the National Spatial Strategy (NSS) regarding the Irish Rural Structure. The main objective of the study
Mapping UK. David Martin, University of Southampton. Open Data Workshop, Nottingham, 21 June 2011
 Mapping UK population over time David Martin, University of Southampton Open Data Workshop, Nottingham, 21 June 2011 Presentation overview Small area spatial population distributions The time dimension
Sampling Distribution Models. Chapter 17
 Sampling Distribution Models Chapter 17 Objectives: 1. Sampling Distribution Model 2. Sampling Variability (sampling error) 3. Sampling Distribution Model for a Proportion 4. Central Limit Theorem 5. Sampling
Geographically Weighted Regression and Kriging: Alternative Approaches to Interpolation A Stewart Fotheringham
 Geographically Weighted Regression and Kriging: Alternative Approaches to Interpolation A Stewart Fotheringham National Centre for Geocomputation National University of Ireland, Maynooth http://ncg.nuim.ie
Urban Geography. Unit 7 - Settlement and Urbanization
 Urban Geography Unit 7 - Settlement and Urbanization Unit 7 is a logical extension of the population theme. In their analysis of the distribution of people on the earth s surface, students became aware