Public Transportation Infrastructure Study (PTIS) - 2 nd Technical Advisory Committee Meeting
|
|
|
- Karen Hancock
- 5 years ago
- Views:
Transcription
 Presented by: and Team July")
1 Public Transportation Infrastructure Study (PTIS) - 2 nd Technical Advisory Committee Meeting Presentation to: Technical Advisory Committee (TAC) Presented by: and Team July 8th, 2009
2 Public Transportation Infrastructure Study (PTIS) 2 nd Technical Advisory Committee Meeting Current Conditions and Trend Analysis (Fregonese Associates) Key findings on current conditions and trend analysis Corridor workshop selection exercise
3 Existing Conditions Analysis Mapping Database GIS Scenario Planning The Virtual Present The Virtual Future Corridor Planning Small area concept maps Visual examples for communicating ideas Developing prototypes for countywide scenarios Alternative Scenarios
4 Aerial Photography
5 City Boundary
6 Sphere of Influence
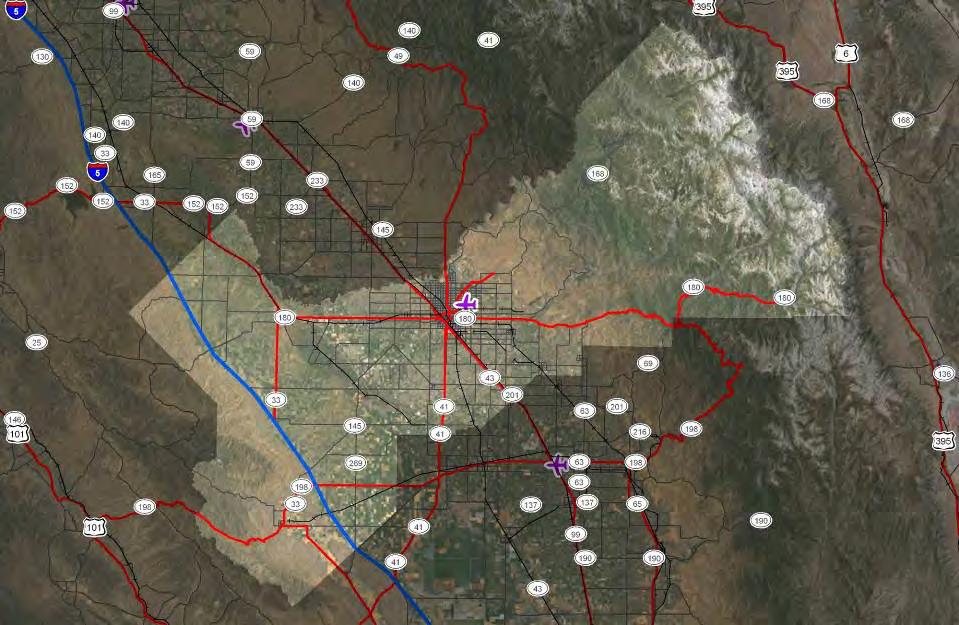
7 Transportation Network
8 Protected land Environmental Constraints: Open Water Riparian (50 ft buffer around streams and open water) Wetlands and 50ft wetland buffer 100-year floodplain (50% of land can be developed) Steep Slopes (25% and more) In Addition: Federal land
9 Open Water
10 Riparian
11 Wetlands
12 100 Year Floodplain
13 Steep Slopes (25% and greater)
14 Environmental Constraints
15 Federal Land
16 Environmental Constraints and Federal Land
17 Composite Constraints
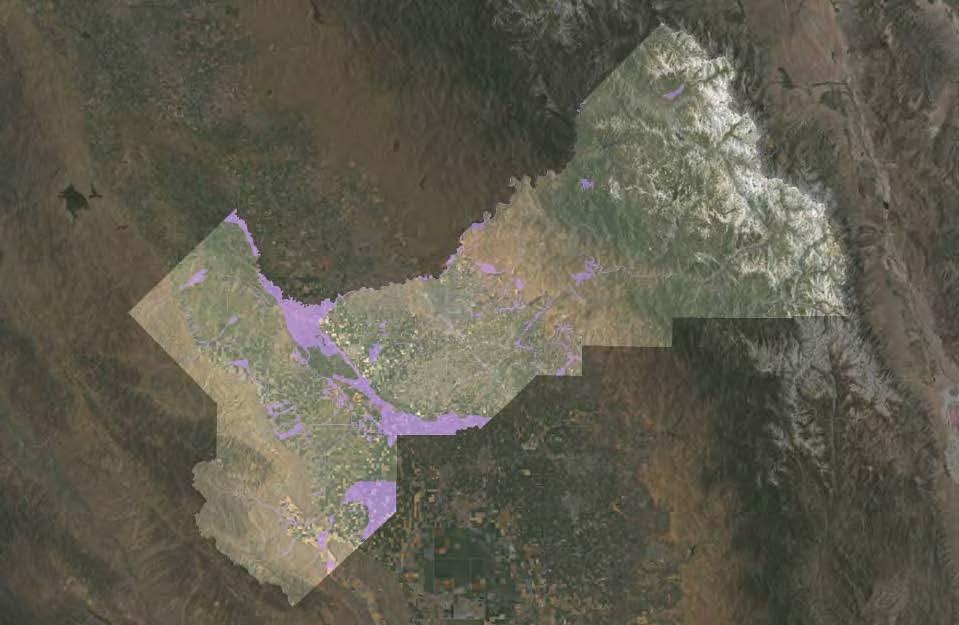
18 Land Use Fresno County covers an area of over 6,000 square miles Combination of two sources City of Fresno County of Fresno Newer land use from City of Fresno
19 Land Use County of Fresno City of Fresno
20 Land Use
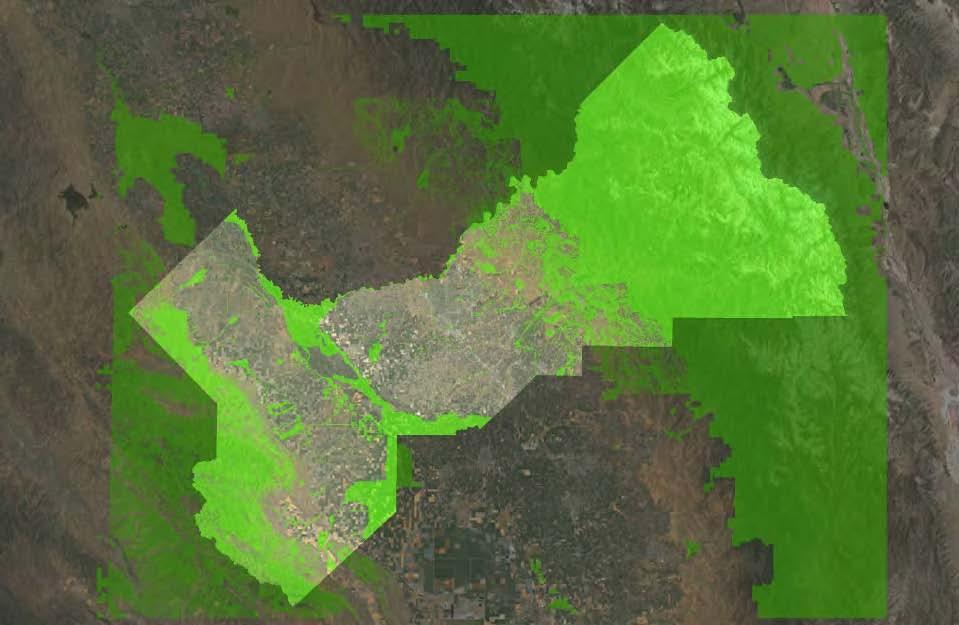
21 Land Use Vacant Land Analysis City of Fresno land use assumed to be vacant: Vacant parcels Rural residential part vacant (according to City data) Open space/ag RR (can be rural residential or railroad) with parcels that are equal or larger than 1 acre. Assuming that each parcel has one house, rural parcels that have housing on an acre lot or greater are considered vacant Vacant areas of land use categories that are partial vacant were digitized to include vacant parts (new data layer created by FAI) County of Fresno land use assumed to be vacant: Agriculture Vacant Single Family on 10 acres per unit or more County vacant land masked to extent of City of Fresno land use (City data overrode County) 38% of Fresno County is vacant and potentially available for new development (1.4 Mil. Acres) (includes farmland)


22 Vacant Land Partial Vacant Land use categories from City of Fresno include partial vacant land use Heavy industrial/part vacant Light industrial/part vacant

23 Vacant Land Rural Residential Issue City of Fresno Issues with capacity: Parcels identified as RR have a capacity of 3,588 units 1,360 HU for parcels between 1 and 2 acres 2,228 HU for parcels more than 2 acres Large Lot Living outside of the City Large Lot Living within the City

24 Vacant Land Rural Residential Issue Issues with virtual present: Parcels identified as vacant have no housing allocated No housing on rural lands Rural Residential assumed to be vacant


25 Vacant Land Rural Residential Issue County of Fresno Single Family on 10 acres or more assumed vacant Assumes low density rural if developed further Rural Lands In the mountains


26 Vacant Land Public Land Public land removed but can have growth potential i.e. California State University is expected to grow Housing Growth University Employment Growth

27 Vacant Land
28 Buildable Land Vacant land minus constrained land: Vacant mask includes all environmental constraints and federal land Vacant land in floodplains can be developed to up to 50% Vacant land within floodplains All constraints taken out
29 Composite Buildable Land
30 Buildable Land Polygrid
31 Capacity Analysis The capacity analysis looks at 4 different files: Zoning files from: City of Clovis (zoning.shp) City of Fresno (zoning.shp) County of Fresno (genplan-rev2.shp) General Plan from: County of Fresno (genplan_rev2.shp) For smaller cities based on LUname attribute For Fresno city zoning code (S-L and SPLIT) on PTIS attribute Capacity is assumed to be on vacant land only Accounting for underbuilt 25% for residential zoning types 60% for office and retail zoning types 90% for industrial zoning types
32 Zoning and General Plan Files are layered: City of Fresno - Zoning County of Fresno - General Plan (PTIS) City of Clovis Zoning County of Fresno - General Plan County of Fresno - Zoning


33 Zoning and General Plan Multiple components No Gis layer available for smaller towns Using County s general plan No zoning code designation Using County s general plan (PTIS)
34 Capacity Combined Files
35 Capacity On Vacant Land Floodplains Buildable Land
36 Capacity On Vacant Land
37 Capacity Analysis Results The capacity analysis results: About 112,000 new units The unincorporated areas get majority of housing Only 26,000 units are multi-family About 33,000 units within exiting city boundaries More than 480,000 new jobs County and City of Fresno can accommodate majority of jobs Industrial capacity is highest More capacity for retail jobs than office jobs On a side note: Over 45,000 units of rural/farm housing possible
38 Capacity Housing
39 Capacity Employment

40 Capacity Housing Clovis Fresno Sanger Fowler Selma Parlier Reedley Orange Cove Kingsburg
41 Capacity Employment Clovis Fresno Sanger Fowler Selma Parlier Reedley Orange Cove Kingsburg

42 Capacity Housing

43 Forecast Housing

44 Capacity vs. Forecast
45 Virtual Present Base year is 2003 Two sources for land use City of Fresno elu.shp County of Fresno land_use.shp Two sources for housing 2000 census blocks TAZ data One source for employment: TAZ data 2003 data information is calculated to fit the geography of the scenario layer (polygrid)
46 Virtual Present Polygrid The polygrid is a GIS shape file used for scenario building The polygrid has 2 resolutions: Within urban areas the resolution is 5.29 acres Rural areas have a resolution of 21.2 acres Each polygrid cell has a value for: Individual ID (gridcode) Amount of buildable land in acres Names of cities Names of sphere of influences Employment Centers TAZ ID Development type Capacity (units and jobs) Base year (units and jobs) Scenario (units and jobs)

47 Virtual Present Polygrid
48 Virtual Present Residential Land Use City of Fresno land use Residential land use types: Residential (low, medium, high, medium low, medium high) Mobile home park Includes partial vacant land use category that is residential County of Fresno land use Residential land use types: Residential (single family, multi family) Land use categories with at least one residential unit
49 Virtual Present Housing Analysis Residential land use Convert to a raster Census blocks Convert to raster masked/clipped to residential land Calculate amount of housing per raster cell Convert to a floating point grid Summarize on polygrid Adjust 2000 census number by 2003 TAZ numbers Summarize 2000 census number by TAZ Adjust/multiply 2000 numbers to reflect 2003 numbers TAZs with no housing in 2000 have 2003 number evenly dispersed throughout TAZ
50 Virtual Present Residential Land City of Fresno County of Fresno City of Fresno -part vacant
51 Virtual Present Residential Land

52 Virtual Present Residential Land Clovis Fresno Sanger Fowler Selma Parlier Reedley Orange Cove Kingsburg
53 Virtual Present Housing Analysis Census blocks masked to residential land: Gives true location of residential land Housing located on residential land only 2000 Census Residential raster Census blocks on residential land

54 Virtual Present Housing Analysis Housing value: Calculate number of housing units per raster cell Census raster Calculated cell value

55 Virtual Present Housing Analysis Housing value by polygrid cell: Summarize housing units raster cells by polygrid Add results to polygrid Housing cells summarized by polygrid Raster and polygrid
56 Virtual Present Housing Analysis Housing quantity by polygrid cell: Adjust housing numbers to reflect TAZ 2003 data Adjustment only on polygrid cells that intersect with residential land use Housing 2000 adjusted by TAZ quantity Census 2000 by polygrid

57 Virtual Present Housing Analysis Unassigned housing : Comparing the adjusted 2003 housing numbers to the actual TAZ numbers, it was obvious that some TAZ had no housing assigned TAZ with housing but no residential acres have housing located equally on each polygrid cell within the assigned TAZ


58 Virtual Present Housing Analysis Issues Census miscounts: 68 units assigned to a street island Mobile home park count puts all units into front office census block Mobile Home Park Street

59 Virtual Present Housing Analysis Issues TAZ vs polygrid: Data is calculated on a 900 sqft raster cell Data is assigned to a 5 or 21 acres polygrid cell Polygrid cell has fixed value for taz TAZ 2003 numbers vary from Census 2000 Allocated census housing is 322, TAZ itself assigns no housing
60 Virtual Present 2003 Housing
61 Virtual Present 2003 Housing Clovis Fresno Sanger Fowler Selma Parlier Reedley Orange Cove Kingsburg
62 Virtual Present Employment Land Use City of Fresno land use Employment land use types: Office types Commercial Industrial Public facilities (schools, airport, etc.) County of Fresno land use Urbanized areas: Attribute employment = Y Excluding agricultural and vacant land use (to avoid thinning of jobs on agricultural land for urban areas) Includes land use identified as unclassified and PTIS_Class = schools Rural areas: Employment number equally dispersed throughout taz
63 Virtual Present Employment Analysis Employment land use Convert to a raster Avoiding high counts of agricultural employment within cities: Calculating employment density based on employment land within cities (as identified by TAZ coverage) Convert TAZ to raster masked/clipped to employment land Calculate amount of jobs per raster cell Convert to a floating point grid Summarize on polygrid Calculating employment density throughout rural TAZs equally
64 Virtual Present Employment Land City of Fresno County of Fresno City of Fresno -part vacant
65 Virtual Present Employment Land Clovis Fresno Sanger Fowler Selma Parlier Reedley Orange Cove Kingsburg

66 Virtual Present Employment Analysis TAZ TAZs masked to employment land: Gives true location of employment land TAZs for cities only Employment raster TAZ on employment land

67 Virtual Present Employment Analysis Employment value: Calculate number of jobs per raster cell TAZ raster Calculated cell value

68 Virtual Present Employment Analysis Unassigned jobs : Employment land was identified for TAZs within cities only TAZs outside of cities have jobs located equally on each polygrid cell within the assigned TAZ

 TAZs and Employment Land TAZs and")
69 Virtual Present Employment Analysis Issues TAZ vs polygrid: Data is calculated on a 900 sqft raster cell Data is assigned to a 5 or 21 acres polygrid cell Polygrid cell has fixed value for taz TAZ and polygrid overlap (jobs in TAZ 603 are not assigned to actual location, polygrid cells fall within TAZ 606) TAZs and Employment Land TAZs and Employment Cell
70 2003 Jobs by TAZ
71 2035 Jobs by TAZ
72 Job Gain by TAZ
73 Virtual Present 2003 Employment
74 Virtual Future Delta Employment
75 Virtual Future 2035 Employment

76 2003 Jobs by TAZ Clovis Fresno Sanger Fowler Selma Parlier Reedley Orange Cove Kingsburg

77 2035 Jobs by TAZ Clovis Fresno Sanger Fowler Selma Parlier Reedley Orange Cove Kingsburg

78 Job Gain by TAZ Clovis Fresno Sanger Fowler Selma Parlier Reedley Orange Cove Kingsburg

79 Virtual Present 2003 Employment Clovis Fresno Sanger Fowler Parlier Orange Cove Selma Reedley Kingsburg

80 Virtual Future Delta Employment Clovis Fresno Sanger Fowler Parlier Orange Cove Selma Reedley Kingsburg
Kitsap County 2016 Comprehensive Plan Update. Appendix A: Growth Estimates
 Kitsap County 2016 Comprehensive Plan Update Appendix A: Growth Estimates Appendix A 1 April 2016 Kitsap County 2016 Comprehensive Plan Update Appendix A: Growth Estimates Land Capacity Land capacity
King City URA 6D Concept Plan
 King City URA 6D Concept Plan King City s Evolution Among the fastest growing cities 2000 Census 1,949 2010 Census 3,111 60% increase 2016 Census estimate 3,817 23% increase Average annual rate 4.3% Surpassing
Chapter 6. Fundamentals of GIS-Based Data Analysis for Decision Support. Table 6.1. Spatial Data Transformations by Geospatial Data Types
 Chapter 6 Fundamentals of GIS-Based Data Analysis for Decision Support FROM: Points Lines Polygons Fields Table 6.1. Spatial Data Transformations by Geospatial Data Types TO: Points Lines Polygons Fields
GIS in Community & Regional Planning
 GIS in Community & Regional Planning The The role role of of GIS GIS in in Re-writing the the Zoning Bylaw for for the the City City of of Vernon LandInfo Technologies Presentation Overview The GIS Initiative
GIS for the Non-Expert
 GIS for the Non-Expert Ann Forsyth University of Minnesota February 2006 GIS for the Non-Expert 1. Definitions and problems 2. Measures being tested in Twin Cities Walking Study Basic approach, data, variables
Great California Delta Trail Blueprint for Contra Costa and Solano Counties GIS AND MAPPING MEMORANDUM JULY 2010
 Great California Delta Trail Blueprint for Contra Costa and Solano Counties GIS AND MAPPING MEMORANDUM JULY 2010 {DRAFT} July 2010 Introduction Geographic Information Systems (GIS) are computer-based
FSUTMS Framework for Integrating Land Use Modeling
 FSUTMS Framework for Integrating Land Use Modeling presented to MTF Data Committee presented by Wade L. White, Whitehouse Group Walter Anderson, Whitehouse Group March 6, 2012 Agenda Background Previous
Riocan Centre Study Area Frontenac Mall Study Area Kingston Centre Study Area
 OVERVIEW the biggest challenge of the next century (Dunham Jones, 2011). New books are continually adding methods and case studies to a growing body of literature focused on tackling this massive task.
Transportation Statistical Data Development Report OKALOOSA-WALTON OUTLOOK 2035 LONG RANGE TRANSPORTATION PLAN
 Transportation Statistical Data Development Report OKALOOSA-WALTON OUTLOOK 2035 LONG RANGE TRANSPORTATION PLAN Prepared for the Okaloosa-Walton Transportation Planning Organization and The Florida Department
Regional Growth Strategy Regional TOD Advisory Committee
 Regional Strategy Regional TOD Advisory Committee September 21, 2018 Overview Regional Geographies Transit-Oriented Development Goal Scenarios Next Steps 2 Schedule + Process September 6 Management Policy
City of Chino Hills General Plan Update 13GPA02 Scoping Meeting. June 4, 2013
 13GPA02 Scoping Meeting June 4, 2013 Every California city must adopt a comprehensive, long-term general plan. The General Plan is the City s constitution or blueprint for its long-range physical development.
Presented by: Bryan Bloch GIS Specialist DNREC Division of Watershed Stewardship
 Presented by: Bryan Bloch GIS Specialist DNREC Division of Watershed Stewardship Bryan Hall, AICP Sussex County Circuit Rider Planner, Office of State Planning Coordination, OMB November 19, 2012 UD Sustainable
Analyzing Suitability of Land for Affordable Housing
 Analyzing Suitability of Land for Affordable Housing Vern C. Svatos Jarrod S. Doucette Abstract: This paper explains the use of a geographic information system (GIS) to distinguish areas that might have
ZIP Code Tabulation Areas For Census 2000
 ZIP Code Tabulation Areas For Census 2000 NCHS, CDC Andrew Flora June 13, 2000 TIGER Operations Branch Geography Division U S C E N S U S B U R E A U Helping You Make Informed Decisions ZIP Code Tabulations
PPT Slide. Slide 1 of 32. Notes:
 Slide 1 of 32 This presentaion will describe the background of establishing an agricultural district in Westchester County and how GIS was used to map the district. file:///volumes/web/www/ce/conferences/gis%20present/testfarm/sld001.htm[4/6/11
Summary Description Municipality of Anchorage. Anchorage Coastal Resource Atlas Project
 Summary Description Municipality of Anchorage Anchorage Coastal Resource Atlas Project By: Thede Tobish, MOA Planner; and Charlie Barnwell, MOA GIS Manager Introduction Local governments often struggle
Hillsborough County MPO Transit Study. Technical Team August 23, 2007
 Hillsborough County MPO Transit Study Technical Team August 23, 2007 Meeting Agenda Technology Choices Needs and Opportunities Transit Concepts Comparative Land Use Analysis Measures of Effectiveness System
APPENDIX PHASE 1 GREEN INFRASTRUCTURE FRAMEWORK
 APPENDIX PHASE 1 GREEN INFRASTRUCTURE FRAMEWORK KANSAS MISSOURI CONTENTS A DATA WISHLIST 4 B PRECEDENTS 7 C WORKSHOP MATERIALS 13 D ANALYSIS PROCESS 124 E ATLAS & PLAYBOOK DETAILS 156 F POLICY ANALYSIS
Regional Transit Development Plan Strategic Corridors Analysis. Employment Access and Commuting Patterns Analysis. (Draft)
") Regional Transit Development Plan Strategic Corridors Analysis Employment Access and Commuting Patterns Analysis (Draft) April 2010 Contents 1.0 INTRODUCTION... 4 1.1 Overview and Data Sources... 4 1.2
Regional Transit Development Plan Strategic Corridors Analysis Employment Access and Commuting Patterns Analysis (Draft) April 2010 Contents 1.0 INTRODUCTION... 4 1.1 Overview and Data Sources... 4 1.2
High Speed / Commuter Rail Suitability Analysis For Central And Southern Arizona
 High Speed / Commuter Rail Suitability Analysis For Central And Southern Arizona Item Type Reports (Electronic) Authors Deveney, Matthew R. Publisher The University of Arizona. Rights Copyright is held
Spatial Analysis using Vector GIS THE GOAL: PREPARATION:
 PLAN 512 GIS FOR PLANNERS Department of Urban and Environmental Planning University of Virginia Fall 2006 Prof. David L. Phillips Spatial Analysis using Vector GIS THE GOAL: This tutorial explores some
Final City of Colusa STREETS & ROADWAYS MASTER PLAN. October J Street Suite 390 Sacramento, CA 95814
 Final City of Colusa STREETS & ROADWAYS MASTER PLAN October 2009 660 J Street Suite 390 Sacramento, CA 95814 TABLE OF CONTENTS I. INTRODUCTION... 1 Report Organization...1 II. ANALYSIS METHODOLOGY... 2
Geodatabase for Sustainable Urban Development. Presented By Rhonda Maronn Maurice Johns Daniel Ashney Jack Anliker
 Geodatabase for Sustainable Urban Development Presented By Rhonda Maronn Maurice Johns Daniel Ashney Jack Anliker Objective Build a Geodatabase that will enable urban planners to create and assess the
Louisiana Transportation Engineering Conference. Monday, February 12, 2007
 Louisiana Transportation Engineering Conference Monday, February 12, 2007 Agenda Project Background Goal of EIS Why Use GIS? What is GIS? How used on this Project Other site selection tools I-69 Corridor
MPOs SB 375 LAFCOs SCAG Practices/Experiences And Future Collaborations with LAFCOs
 Connecting LAFCOs and COGs for Mutual Benefits MPOs SB 375 LAFCOs SCAG Practices/Experiences And Future Collaborations with LAFCOs Frank Wen, Manager Research & Analysis Land Use & Environmental Planning
APPENDIX D FOLSOM HOLDING CAPACITY METHODOLOGY
 APPENDIX D FOLSOM HOLDING CAPACITY METHODOLOGY This page intentionally left blank. APPENDIX D FOLSOM HOLDING CAPACITY METHODOLOGY 1. INTRODUCTION This document provides a description of the assumptions
HORIZON 2030: Land Use & Transportation November 2005
 PROJECTS Land Use An important component of the Horizon transportation planning process involved reviewing the area s comprehensive land use plans to ensure consistency between them and the longrange transportation
Transect Code Manual
 Transect Code Manual A Step-by-Step Guide Emily Talen Transect Code Manual 1 Contents Introduction Who this Manual is for A brief history of how we got into this predicament Part I. The Basics A new approach
Planning for Sea Level Rise in the Matanzas Basin
 Planning for Sea Level Rise in the Matanzas Basin Appendix E: Matanzas Future Development Scenarios June, 2015 Prepared by: Dr. Paul Zwick University of Florida Department of Urban and Regional Planning
Regional Growth Strategy Work Session Growth Management Policy Board
 Regional Growth Strategy Work Session Growth Management Policy Board September 6, 2018 1 Overview Recap June GMPB work session Objectives and outcomes Regional geographies Growth scenarios Breakout Discussion:
APPENDIX I: Traffic Forecasting Model and Assumptions
 APPENDIX I: Traffic Forecasting Model and Assumptions Appendix I reports on the assumptions and traffic model specifications that were developed to support the Reaffirmation of the 2040 Long Range Plan.
Regional Growth Strategy Regional Staff Committee
 Regional Growth Strategy Regional Staff Committee June 21, 2018 1 Overview Summary of June Growth Management Policy Board Regional Growth Strategy Objectives Regional Geographies Regional Growth Strategy
Developing a Subdivision Build- Out Study and Site Suitability Tool; Enabling Access Through a Web GIS Application
 Developing a Subdivision Build- Out Study and Site Suitability Tool; Enabling Access Through a Web GIS Application DOUG SEXTON GEOG 596A SUMMER 2017 ADVISOR: DR. JAMES O BRIEN Project Outline Introduction
Regional Performance Measures
 G Performance Measures Regional Performance Measures Introduction This appendix highlights the performance of the MTP/SCS for 2035. The performance of the Revenue Constrained network also is compared to
METHODOLOGICAL ISSUES IN CREATING A REGIONAL NEIGHBORHOOD TYPOLOGY
 METHODOLOGICAL ISSUES IN CREATING A REGIONAL NEIGHBORHOOD TYPOLOGY Z. Asligul Gocmen Urban and Regional Planning Program, University of Michigan Ann Arbor, MI 48109 Tel: +1 734-904-2762 (c) Fax: +1 734-763-2322
3D - Boulder Valley Comprehensive Plan. Lesli Ellis Comprehensive Planning Manager City of Boulder
 3D - Boulder Valley Comprehensive Plan Lesli Ellis Comprehensive Planning Manager City of Boulder Presentation Boulder s use of 3D GIS and other tools in Comprehensive Planning (e.g., story maps, CityEngine,
SBCAG Travel Model Upgrade Project 3rd Model TAC Meeting. Jim Lam, Stewart Berry, Srini Sundaram, Caliper Corporation December.
 SBCAG Travel Model Upgrade Project 3rd Model TAC Meeting Jim Lam, Stewart Berry, Srini Sundaram, Caliper Corporation December. 7, 2011 1 Outline Model TAZs Highway and Transit Networks Land Use Database
Local Economic Activity Around Rapid Transit Stations
 Local Economic Activity Around Rapid Transit Stations The Case of Chicago s Orange Line Julie Cooper, MPP 2014 Harris School of Public Policy Transport Chicago June 6, 2014 Motivation Impacts of transit
Appendix: Development Patterns and Design
 Appendix: Development Patterns and Design Development Patterns Figure 1 lists the amount of land converted from undeveloped to some other form of land for the 13 county and 20 county Atlanta Region. In
Airport Employment Growth District
 Legend Employment Area Boundary* Industrial - Heavy Parcel Fabric Utilities Farm with Retail/Industrial Use Institutional Potential Area for Redevelopment Redevelopment Vacant Land Industrial - Light Non-Developable
The CRP stresses a number of factors that point to both our changing demographics and our future opportunities with recommendations for:
 Plan Overview The CRP represents the first broad planning initiative covering Lake, Porter and LaPorte counties. Unlike previous plans released by NIRPC, which focused primarily on transportation, the
Port Cities Conference: How Regional Planning can Help Support a Competitive Port. Christina DeMarco Metro Vancouver
 Port Cities Conference: How Regional Planning can Help Support a Competitive Port Christina DeMarco Metro Vancouver June 12. 2008 Metro Vancouver Regional Growth Management Three ways to help support the
KENTUCKY HAZARD MITIGATION PLAN RISK ASSESSMENT
 KENTUCKY HAZARD MITIGATION PLAN RISK ASSESSMENT Presentation Outline Development of the 2013 State Hazard Mitigation Plan Risk Assessment Determining risk assessment scale Census Data Aggregation Levels
BASIC SPATIAL ANALYSIS TOOLS IN A GIS. data set queries basic statistics buffering overlay reclassification
 BASIC SPATIAL ANALYSIS TOOLS IN A GIS data set queries basic statistics buffering overlay reclassification GIS ANALYSIS TOOLS GIS ANALYSIS TOOLS Database tools: query and summarize (similar to spreadsheet
Introduction and Project Overview
 Greater New Orleans Regional Land Use Modeling GIS Techniques in a P olitical C ontext Louisiana Remote Sensing and GIS Workshop Wednesday, April 24, 2013 Working Towards a Shared Regional Vision Introduction
Vector Analysis: Farm Land Suitability Analysis in Groton, MA
 Vector Analysis: Farm Land Suitability Analysis in Groton, MA Written by Adrienne Goldsberry, revised by Carolyn Talmadge 10/9/2018 Introduction In this assignment, you will help to identify potentially
Hennepin GIS. Tree Planting Priority Areas - Analysis Methodology. GIS Services April 2018 GOAL:
 Hennepin GIS GIS Services April 2018 Tree Planting Priority Areas - Analysis Methodology GOAL: To create a GIS data layer that will aid Hennepin County Environment & Energy staff in determining where to
Los Alamos Planning Advisory Committee. Stephen Peterson March 19, 2007
 Los Alamos Planning Advisory Committee Stephen Peterson March 19, 2007 What makes Los Alamos so special? Very small, compact town surrounded by large parcel working agriculture and open space areas Old
TRAVEL DEMAND MODEL. Chapter 6
 Chapter 6 TRAVEL DEMAND MODEL As a component of the Teller County Transportation Plan development, a computerized travel demand model was developed. The model was utilized for development of the Transportation
Appendixx C Travel Demand Model Development and Forecasting Lubbock Outer Route Study June 2014
 Appendix C Travel Demand Model Development and Forecasting Lubbock Outer Route Study June 2014 CONTENTS List of Figures-... 3 List of Tables... 4 Introduction... 1 Application of the Lubbock Travel Demand
Acknowledgments xiii Preface xv. GIS Tutorial 1 Introducing GIS and health applications 1. What is GIS? 2
 Acknowledgments xiii Preface xv GIS Tutorial 1 Introducing GIS and health applications 1 What is GIS? 2 Spatial data 2 Digital map infrastructure 4 Unique capabilities of GIS 5 Installing ArcView and the
Huron Creek Watershed 2005 Land Use Map
 Huron Creek Watershed 2005 Land Use Map Created By: Linda Kersten, 12/20/06 Created For: MTU Introduction to GIS Class (FW 5550) The Huron Creek Watershed Advisory Committee Michigan Technological University,
Long Island Breast Cancer Study and the GIS-H (Health)
") Long Island Breast Cancer Study and the GIS-H (Health) Edward J. Trapido, Sc.D. Associate Director Epidemiology and Genetics Research Program, DCCPS/NCI COMPREHENSIVE APPROACHES TO CANCER CONTROL September,
Long Island Breast Cancer Study and the GIS-H (Health) Edward J. Trapido, Sc.D. Associate Director Epidemiology and Genetics Research Program, DCCPS/NCI COMPREHENSIVE APPROACHES TO CANCER CONTROL September,
Reminder that we update the website: with new information, project updates, etc.
 1 Reminder that we update the website: http://www.njfishandwildlife.com/ensp/connectivity_proj.htm with new information, project updates, etc. regularly. Any suggestions are welcome on how to make the
2014 Certification Review Regional Data & Modeling
 2014 Certification Review Regional Data & Modeling July 22, 2014 Regional Data Census Program Coordination PAG works with and for member agencies to ensure full participation in all Census Bureau programs
TABLE OF CONTENTS Page 1.0 Introduction 2.0 Data Review 3.0 Land Use Model Development 4.0 Allocation Results 5.0 Land Use Alternative
 i ii TABLE OF CONTENTS Page 1.0 Introduction... 1 2.0 Data Review... 4 3.0 Land Use Model Development... 5 3.1 Base Year Data... 5 3.2 Highway Networks... 5 3.3 ULAM Default Values... 5 3.4 Population
Urban Planning Word Search Level 1
 Urban Planning Word Search Level 1 B C P U E C O S Y S T E M P A R E U O E U R B A N P L A N N E R T N S T D H E C O U N T Y G E R E R D W R E N I C I T Y C O U N C I L A A A S U G G C I L A G P R I R
How GIS based Visualizations Support Land Use and Transportation Modeling
 How GIS based Visualizations Support Land Use and Transportation Modeling ESRI International Users Conference San Diego, CA - July 23, 2015 Prepared by: Troy Hightower Introduction This presentation will
Employment Capacity in Transit Station Areas in Maryland
 Employment Capacity in Transit Station Areas in Maryland Prepared by: The National Center for Smart Growth Research and Education at the University of Maryland* Gerrit Knaap, PhD, Director Terry Moore,
Regional Performance Measures
 G Performance Measures Regional Performance Measures Introduction This appendix highlights the performance of the MTP/SCS for 2035. The performance of the Revenue Constrained network also is compared to
Wasatch Front Region Small Area Socioeconomic Forecasts: Technical Report #49
 Regional Transportation Plan: 2011-2040 Appendix A APPENDIX A Wasatch Front Region Small Area Socioeconomic Forecasts: 2007-2040 Technical Report #49 July, 2010 295 N. Jimmy Doolittle Road Salt Lake City,
DefinitionofAlternatives
 4. DefinitionofAlternatives After approximately two years of outreach and public input, PSRC has identified four alternatives for evaluation in this Draft Environmental Impact Statement: Growth Targets
Wasatch Front Region Small Area Socioeconomic Forecasts: Technical Report #49
 Wasatch Front Region Small Area Socioeconomic Forecasts: 2007-2040 Technical Report #49 July, 2010 Wasatch Front Regional Council 295 N. Jimmy Doolittle Road Salt Lake City, UT 84116 P (801) 363-4250 F
2040 MTP and CTP Socioeconomic Data
 SE Data 6-1 24 MTP and CTP Socioeconomic Data Purpose of Socioeconomic Data The socioeconomic data (SE Data) shows the location of the population and employment, median household income and other demographic
III. FORECASTED GROWTH
 III. FORECASTED GROWTH In order to properly identify potential improvement projects that will be required for the transportation system in Milliken, it is important to first understand the nature and volume
The Use of Geographic Information Systems (GIS) by Local Governments. Giving municipal decision-makers the power to make better decisions
 by Local Governments. Giving municipal decision-makers the power to make better decisions") The Use of Geographic Information Systems (GIS) by Local Governments Giving municipal decision-makers the power to make better decisions Case Study: Examples of GIS Usage by Local Governments in North
The Use of Geographic Information Systems (GIS) by Local Governments Giving municipal decision-makers the power to make better decisions Case Study: Examples of GIS Usage by Local Governments in North
Local Area Key Issues Paper No. 13: Southern Hinterland townships growth opportunities
 Draft Sunshine Coast Planning Scheme Review of Submissions Local Area Key Issues Paper No. 13: Southern Hinterland townships growth opportunities Key Issue: Growth opportunities for Southern Hinterland
presents challenges related to utility infrastructure planning. Many of these challenges
 1 Introduction: - a. Purpose According to U.S. Census Bureau the population of stark county was 367,585 in 1990, and in 2000 it was increase to 378,098. Thus County is experiencing a growth that presents
SIE 509 Principles of GIS Exercise 5 An Introduction to Spatial Analysis
 SIE 509 Principles of GIS Exercise 5 An Introduction to Spatial Analysis Due: Oct. 31, 2017 Total Points: 50 Introduction: The Governor of Maine is asking communities to look at regionalization for major
CITY OF RIVERSIDE USING HAZUS TO CREATE A EARTHQUAKE PLANNING GUIDE FOR A UNIFIED FIELD RESPONSE
 CITY OF RIVERSIDE USING HAZUS TO CREATE A EARTHQUAKE PLANNING GUIDE FOR A UNIFIED FIELD RESPONSE Presented by the Phil McCormick City of Riverside Office of Emergency Management HISTORY The City had several
A Method for Mapping Settlement Area Boundaries in the Greater Golden Horseshoe
 A Method for Mapping Settlement Area Boundaries in the Greater Golden Horseshoe Purpose This paper describes a method for mapping and measuring the lands designated for growth and urban expansion in the
3.0 ANALYSIS OF FUTURE TRANSPORTATION NEEDS
 3.0 ANALYSIS OF FUTURE TRANSPORTATION NEEDS In order to better determine future roadway expansion and connectivity needs, future population growth and land development patterns were analyzed as part of
East Bay BRT. Planning for Bus Rapid Transit
 East Bay BRT Planning for Bus Rapid Transit Regional Vision Draper Prison The Bottleneck is a State-Level issue, Salt Lake County 2050 Population: 1.5M Draper Prison hopefully with some State-Level funding!
The Attractive Side of Corpus Christi: A Study of the City s Downtown Economic Growth
 The Attractive Side of Corpus Christi: A Study of the City s Downtown Economic Growth GISC PROJECT DR. LUCY HUANG SPRING 2012 DIONNE BRYANT Introduction Background As a GIS Intern working with the City
Appendix 8I. Population and Community Use Analysis. December 2010
 Appendix 8I Population and Community Use Analysis December 2010 APPENDIX 8I Population and Community Use Analysis December 2010 Prepared for: Prepared by: 20 Bay Street, Suite 901 Toronto ON M5J 2N8 In
Schuyler County Idle Farmland Analysis. Conducted by Cornell Cooperative Extension of Schuyler County
 Schuyler County Idle Farmland Analysis Conducted by Cornell Cooperative Extension of Schuyler County June 15, 2010 Schuyler County Idle Farmland Analysis Purpose: The purpose of this analysis is to approximate
Smart Solutions for Spatial Planning
 Smart Solutions for Spatial Planning Aedas R&D [Computational Design Research] Centre for Evolutionary Computing in Architecture [CECA @ UEL] Knowledge Transfer [breaking silos] * constructing consensus
BRIEFING BOOK. Natural Gas Energy Parcel Level GIS
 Natural Gas Energy Parcel Level GIS BRIEFING BOOK Examination of techniques & protocols for incorporating National Parcel Layer content to vastly reduce cost of transaction to better meet accelerating
Creation of built environment indices
 Creation of built environment indices Daniel A. Rodriguez, Ph.D Department of City and Regional Planning, University of North Carolina, Chapel Hill with Lawrence J. Frank, Ph.D. Department of Community
GROWTH MANAGEMENT REPORT Wiarton South Settlement Area
 GROWTH MANAGEMENT REPORT Wiarton South Settlement Area Designations in the Town of Wiarton Prepared for: The Municipality of South Bruce Peninsula P.O. Box 310 315 George St. Wiarton, ON N0H 2T0 Prepared
Understanding China Census Data with GIS By Shuming Bao and Susan Haynie China Data Center, University of Michigan
 Understanding China Census Data with GIS By Shuming Bao and Susan Haynie China Data Center, University of Michigan The Census data for China provides comprehensive demographic and business information
Understanding Land Use and Walk Behavior in Utah
 Understanding Land Use and Walk Behavior in Utah 15 th TRB National Transportation Planning Applications Conference Callie New GIS Analyst + Planner STUDY AREA STUDY AREA 11 statistical areas (2010 census)
SxD STUDIO MAPPING THE SPIKES TEAM VANAGAIN.
 SxD STUDIO MAPPING THE SPIKES 10.21.05 TEAM VANAGAIN. Elise Menard + Lesya Fesiak + Mo Rouhi + Xenia Semenianuk SxD STUDIO MAPPING THE SPIKES 10.21.05 Transportation Transit Ridership Population Density
THE POPULATION PROJECTION METHODOLOGY OF
 SPECIAL PUBLICATION SJ2005-SP9 THE POPULATION PROJECTION METHODOLOGY OF THE ST. JOHNS RIVER WATER MANAGEMENT DISTRICT S 2003 DISTRICT WATER SUPPLY ASSESSMENT AND 2005 DISTRICT WATER SUPPLY PLAN The Population
PIBC Annual Conference, 2016
 Land Use Quantified PIBC Annual Conference, 2016 A collaboration between: Christy & Associated Planning Consultants The Sustainable Transportation Partnership of the Central Okanagan Hazel Christy Rafael
Internet GIS Sites. 2 OakMapper webgis Application
 Internet GIS Sites # Name URL Description 1 City of Sugar Land http://www.sugarlandtx.gov/index.htm It is a city in Texas with 65,000 Residents. The City of Sugar Land, Texas, provides ArcIMS-based maps
Identifying Wildfire Risk Areas in Western Washington State
 Identifying Wildfire Risk Areas in Western Washington State Matthew Seto University of Washington Tacoma GIS Certification Program URISA 2015 Undergraduate Geospatial Skills Competition Introduction 2014
GEOGRAPHIC INFORMATION SYSTEMS
 GEOGRAPHIC INFORMATION SYSTEMS 4-H Round-Up Community Transitions Workshop Daniel Hanselka June 14, 2011 Goals of the Workshop Answer the question: What is GIS? Uses of GIS. Some of the Common Terminology
Appendix B. Land Use and Traffic Modeling Documentation
 Appendix B Land Use and Traffic Modeling Documentation Technical Memorandum Planning Level Traffic for Northridge Sub-Area Study Office of Statewide Planning and Research Modeling & Forecasting Section
GIS SERVICE CENTER MAP ORDER FORM
 Steven V. Stenger County Executive Pam Reitz Director of Administration GIS SERVICE CENTER MAP ORDER FORM 1. Print this form. 2. Fill out the form calculate and include the total cost of your order. 3.
Write a report (6-7 pages, double space) on some examples of Internet Applications. You can choose only ONE of the following application areas:
 on some examples of Internet Applications. You can choose only ONE of the following application areas:") UPR 6905 Internet GIS Homework 1 Yong Hong Guo September 9, 2008 Write a report (6-7 pages, double space) on some examples of Internet Applications. You can choose only ONE of the following application
UPR 6905 Internet GIS Homework 1 Yong Hong Guo September 9, 2008 Write a report (6-7 pages, double space) on some examples of Internet Applications. You can choose only ONE of the following application
GIS Monroe Geographic Information System March 14, 2018
 GIS Monroe Geographic Information System March 14, 2018 Goals Maintain Enterprise/County-wide geo-database Increase spatial accuracy of data Build and acquire more data layers Increase use of GIS; as another
The Road to Data in Baltimore
 Creating a parcel level database from high resolution imagery By Austin Troy and Weiqi Zhou University of Vermont, Rubenstein School of Natural Resources State and local planning agencies are increasingly
StanCOG Transportation Model Program. General Summary
 StanCOG Transportation Model Program Adopted By the StanCOG Policy Board March 17, 2010 What are Transportation Models? General Summary Transportation Models are technical planning and decision support
GIS Lecture 4: Data. GIS Tutorial, Third Edition GIS 1
 GIS Lecture 4: Data GIS 1 Outline Data Types, Tables, and Formats Geodatabase Tabular Joins Spatial Joins Field Calculator ArcCatalog Functions GIS 2 Data Types, Tables, Formats GIS 3 Directly Loadable
Evaluating Sex Offender Exclusion Laws Alan Murray
 Evaluating Sex Offender Exclusion Laws Alan Murray Center for Urban and Regional Analysis and Department of Geography Ohio State University Columbus, OH 43210, USA Email: murray.308@osu.edu Outline Context
Internal Capture in Mixed-Use Developments (MXDs) and Vehicle Trip and Parking Reductions in Transit-Oriented Developments (TODs)
 and Vehicle Trip and Parking Reductions in Transit-Oriented Developments (TODs)") Internal Capture in Mixed-Use Developments (MXDs) and Vehicle Trip and Parking Reductions in Transit-Oriented Developments (TODs) Reid Ewing City and Metropolitan Planning University of Utah ewing@arch.utah.edu
Internal Capture in Mixed-Use Developments (MXDs) and Vehicle Trip and Parking Reductions in Transit-Oriented Developments (TODs) Reid Ewing City and Metropolitan Planning University of Utah ewing@arch.utah.edu
APPENDIX I - AREA PLANS
 ROUTE 37 WEST LAND USE PLAN ROUTE 37 WEST LAND USE PLAN Recent land use decisions and development trends have drawn attention to the land within the Route 37 western by-pass area between Route 50 and
Forecasting Land Use Change in Pike and Wayne Counties, Pennsylvania
 April 2009 Forecasting Land Use Change in Pike and Wayne Counties, Pennsylvania Prepared by: Dr. Claire A. Jantz Shippensburg University Department of Geography-Earth Science Shippensburg University Center
California Urban and Biodiversity Analysis (CURBA) Model
 Model") California Urban and Biodiversity Analysis (CURBA) Model Presentation Overview Model Overview Urban Growth Model Policy Simulation and Evaluation Model Habitat Fragmentation Analysis Case Study: Santa
California Urban and Biodiversity Analysis (CURBA) Model Presentation Overview Model Overview Urban Growth Model Policy Simulation and Evaluation Model Habitat Fragmentation Analysis Case Study: Santa