September 22, Metropolitan Washington Council of Governments National Capital Region Transportation Planning Board
|
|
|
- Marlene Stanley
- 5 years ago
- Views:
Transcription
1 Metropolitan Washington Council of Governments National Capital Region Transportation Planning Board Review of MPO External Trip Forecasting Methods September 22, Boone Blvd, Suite 700 Vienna, VA (703)
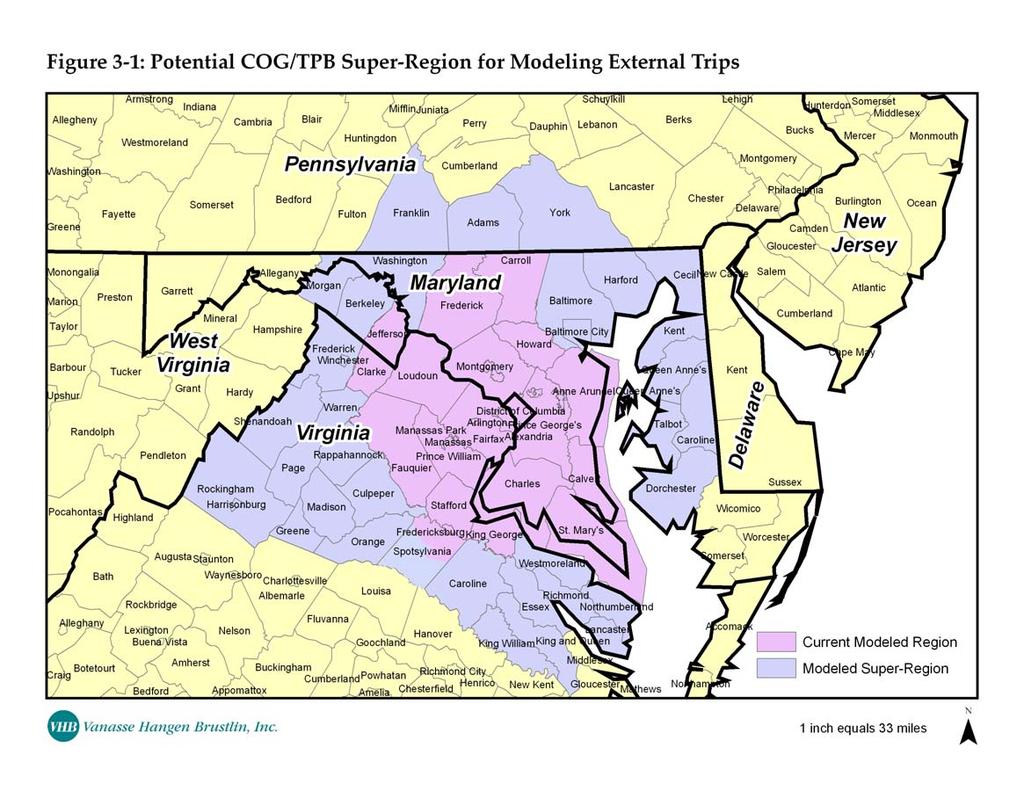
2 Executive Summary The Metropolitan Washington Council of Governments, National Capital Region Transportation Planning Board (TPB) engaged Vanasse Hangen Brustlin (VHB) to review how high-growth MPOs forecast productions and attractions at external stations. TPB is interested in considering alternative approaches for forecasting external trips. The current 6,800 square-mile TPB 2,191 traffic analysis zone (TAZ) system contains 47 external stations. TPB s last auto external survey was conducted in 1994 and consisted of a license plate survey of inbound vehicles crossing the expanded cordon, and a follow-up mail-out/ mail-back postcard survey that yielded 16,000 responses. TPB s last truck external survey was conducted in 1996 and consisted of 5,000 surveyed trucks at 12 sites near the cordon. All surveyed trucks were inbound except at the Chesapeake Bay Bridge (William Preston Lane, Jr. Memorial Bridge) in Anne Arundel County, where information was collected from outbound trucks (east to the Eastern Shore of Maryland). Together these two surveys form the current external trip base data for the TPB model. The literature review and survey of MPOs resulted in the conclusion that the methodology for forecasting future external trips is not a hot issue at this time and thus, is not receiving very much attention either from MPOs or the transportation research community. MPOs are quite focused (like TPB) on making improvements to the model chain that improve the ability to forecast travel within the modeled region. MPOs that do not use a statewide model to forecast external trips are not doing anything significantly different than TPB s current process. However, in both high-growth regions and complex moderate-growth areas like the National Capital Region, the issue of forecasting external trips is growing in importance as jobs and household continue to locate farther away from traditional urban core areas and contribute to an increased share of external trips in overall regional travel. TPB is planning in the Version 2.2 model release to make some model improvements to address the issue of external trips. 1 There are pieces of the various approaches seen in this review that can be applied to the TPB process. A possible approach is to combine elements of two procedures. First, TPB could create a model super-region at the super-district or county level extending as far as 150 miles from Washington, D.C. based on data available from the 2000 Census Transportation Planning Package (CTPP) and anticipated changes to the areas that regularly interact with the TPB area. The number of external stations in the model network could be increased to match each station with a super-regional county or super-district. In Maryland, Virginia, and Pennsylvania, it may be worth considering adopting the statewide model network for those areas outside the current TPB modeled area for compatibility. Following the collection of external station base counts through traditional counts and surveys, the data could be supplemented by the super-regional jurisdictions and MPOs, similar to the coordination TPB already does with BMC and FAMPO, just over a larger area. For future year external trip forecasts, rather than extrapolating or using a growth-factor, TPB could use the updated population / household and employment forecasts for the super-regional jurisdictions and convert the growth to productions and attractions and ultimately external (E-E, E-I, and I-E) trips. 1 See COG/TPB (2006), Section Refinement of Growth Assumptions at External Stations. 2
3 Special attention will need to be paid to coordination with existing small MPOs in or near the super-region who may have existing modeling programs, such as the Hagerstown, Cumberland, and Winchester MPOs. These agencies will benefit from the use of the TPB model to produce external trip matrices for their areas. 2 Those areas that may have a designated MPO following the 2010 census, such as the Gettysburg, PA area, should also be considered. Background: Current TPB External Trip Forecasting Process The current 6,800 square-mile TPB 2,191 traffic analysis zone (TAZ) system contains 47 external stations. TPB s last auto external survey was conducted in 1994 and consisted of a license plate survey of inbound vehicles crossing the expanded cordon, and a follow-up mail-out / mail-back postcard survey that yielded 16,000 responses. TPB s last truck external survey was conducted in 1996 and consisted of 5,000 surveyed trucks at 12 sites near the cordon. All surveyed trucks were inbound except at the Chesapeake Bay Bridge (William Preston Lane, Jr. Memorial Bridge) in Anne Arundel County, where information was collected from outbound trucks (east to the Eastern Shore of Maryland). Together these two surveys form the current external trip base data for the TPB model. TPB also coordinates with the Baltimore Metropolitan Council (BMC) to ensure consistency in trip forecasts in the overlap area between the two agencies modeled regions and to receive output from the BMC model for Baltimore County, which is internal to the BMC model but immediately external to the TPB modeled area. Finally, TPB coordinates with staff from the Virginia Department of Transportation (VDOT) and the Fredericksburg Area MPO (FAMPO) to ensure consistency in trip forecasts in the Fredericksburg area, the majority of which is within the TPB modeled area 3. In general, future year external trips are determined using annual growth based on the growth in the area served by each external station, or by using the growth in trips from neighboring MPOs where available. The current TPB work program includes data collection for an auto external survey during FY2006, and processing, cleaning, and submission of the final survey report during FY2007. Literature Review VHB staff reviewed the available literature about procedures for forecasting external trips in high-growth metropolitan areas. This review did not discover any recent documents of direct significance, although the travel modeling procedures for a range of MPOs were studied for possible relevance. Most MPOs use physical cordon counts as the basis for estimating external trips, like TPB. Some variation was found in how the MPOs applied these counts to their models, but the methods for data collection were strikingly similar. 2 The potential benefits have led to this type of coordination being planned in Arizona;, the Pima Association of Governments, the Tucson MPO, plans to perform its upcoming (next year) external survey in conjunction with MAG in Phoenix. The two cities are approximately 110 miles apart. 3 FAMPO has a separate model administered by VDOT. The MWCOG modeled area does not include the area of Spotsylvania County south of VA
4 The Model Validation and Reasonableness Checking Manual published in 1997 by FHWA indicates the need for a cordon count in order to determine the number of externally-based trips that will not be included in the regional trip generation model. A report produced in 2001 for the Puget Sound Regional Council also indicated this as the only method for updating external trip tables. The number of external stations used to collect this data varies greatly according to the geography and infrastructure of the region, although all major routes should be counted and should include a range of different facility types. This type of count can be performed as an intercept survey that gathers detailed origin and destination data as was completed for the Maricopa Association of Governments which allows the counts to be used as a supplement to the trip distribution table and preloaded onto the network. In areas that elect to only take volume counts at the external stations (as is done in Rhode Island) a gravity model is required to assign the externally-based trips onto the internal network. In metropolitan regions that are completely enclosed within a single state, there may be a statewide model that utilizes this procedure that allows the MPO to use the state s forecasted internal trips as external trips instead of performing physical counts. Adjacent MPOs can also check their external trip forecasts with each other as is done between the Northeast Ohio Areawide Coordinating Agency (NOACA) in Cleveland and the Akron Metropolitan Area Transportation Study (ATAMS). While cordon counts are used almost universally as the values for the base year model, several methods were found for estimating the growth of external trips. Some MPOs grow these trips based on socioeconomic forecasts from nearby cities. Linear regression using historical trip rate data is the most common method of growth estimation. NOACA uses the Fratar method to estimate the growth in external through (external-external) trips while assuming that the percentage of external trips at each station remains constant. One final issue that was mentioned frequently in the literature was the estimation of externally based truck trips. Trucks are frequently making trips through the metropolitan areas and cannot be surveyed in the same way as passenger vehicles. Other methods, including the electronic tracking of trucks and license plate tracking can be used to determine the routes taken by these heavy vehicles. Alternatively, truck traffic can be assumed to be equal to a certain percentage of the counted passenger traffic. Survey of MPOs VHB staff contacted 14 MPOs to obtain information about their procedures for forecasting external trips, and received responses from nine. 4 VHB staff also had informal, face-to-face conversations with representatives of four other MPOs to inquire about their procedures for forecasting external trips. 4 The MPOs were chosen either because they modeled a region similar to the TPB region, or because they had been identified as high-growth in the Transportation Research Board (TRB) MPO State of the Practice Survey. In the TRB survey, high-growth MPOs are those where the percent difference between previous growth (generally through 2005) and forecast future growth (to 2025 or 2030) in population and employment was in the top 25% of those MPOs surveyed. 4
5 The results of the survey closely mirror the results of the literature review: MPOs either essentially follow the same process as TPB, or obtain external trips from a statewide model s internal trips. MPOs That Essentially Follow the Same Process as TPB As noted in the literature review, most MPOs throughout the United States use procedures similar to those currently employed at TPB to collect base data for and forecast future external trips: collecting base data at external stations through a combination of traditional link traffic counts and license plate or mailout / mailback surveys, and forecasting future trips by using a straight-line extrapolation or a simple growth-factor. According to the survey responses, these methods are used in the following metropolitan areas: Atlanta, Georgia; Charlotte, North Carolina; Tampa, Florida; San Antonio, Texas; and Las Vegas, Nevada. Atlanta The Atlanta Regional Council (ARC) reports using a growth-factor method to forecast future external trips in its model set. For reasons of air quality / conformity analysis, ARC has recently expanded its modeled area to 20 counties, so the regional cordon and external stations have been relocated as many of the old external stations are now internal to the model. ARC gave no indication that their external trip forecasting procedures would change as a result of the expanded modeled area. Charlotte The City of Charlotte Department of Transportation (CDOT) is the lead agency for development and application of the Metrolina (Metropolitan Carolina) Regional Model, which models travel in the Charlotte area, an 11-county, bi-state area encompassing four separate MPOs that previously each had their own separate model. 5 The Metrolina Regional Model uses historical trends to prepare growth factors for forecasting future external trips, with the resulting growth averaging 2.5% per year through Tampa The Florida Department of Transportation (FDOT) District 7 is the lead agency for development and application of the Tampa Bay Regional Planning Model (TBRPM) for a five-county area. 6 Forecasts of external trips in the TBRPM use growth factors developed from historical trends and coordination with other outside agencies to account for special sources of travel growth. San Antonio The San Antonio-Bexar County MPO forecasts external trips by reviewing the regional population and employment forecasts and converting the resulting growth into total regional trips 5 Charlotte, NC; Concord; NC; Gastonia, NC; and Rock Hill, SC 6 Hillsborough, Pinellas, Pasco, Hernando, and Citrus counties. In Florida, counties frequently serve as MPOs, so the TBRPM covers four MPOs (Citrus County does not currently have a designated MPO) 5
6 for use in their travel demand model. A fixed percentage of these trips are then designated as external trips. Although external surveys are typically planned for every 3-5 years, prior to their 2005 external survey the previous survey was conducted in Las Vegas While the Las Vegas area has and is continuing to experience very high growth, most of the growth appears to be occurring within the area already modeled by the Regional Transportation Commission of Southern Nevada (RTC), the Las Vegas MPO. Furthermore, the geography of the Las Vegas Valley and its immediate surroundings dictate a limited number of routes in and out of the area and extremely low population density along those routes; consequently there are a limited number of major cordon crossings in the RTC model and only ten external stations. RTC forecasts growth in external trips using the internal regional population projections and assumes a fixed percentage of external trips. RTC has added a new external TAZ for the location of the Ivanpah Valley International Airport, a major new airport to be located approximately 25 miles south of Las Vegas. 7 The new airport is just beginning its Environmental Impact Statement (EIS) and currently is expected to be open in the year 2017, but is likely to have an impact on both the travel and development patterns in region before that time. RTC has indicated they are likely to consider a new approach for forecasting external trips in 2007, but did not indicate what alternatives are being considered. It is probable that during that review consideration will be given to expanding the modeled region to fully include the area around the new airport; such an expansion would bring the southern portion of the modeled region to the Nevada / California border, meaning RTC could use the California statewide model as a source of external trip forecasts. MPOs That Obtain External Trips from a Statewide Model Increasingly, individual states are developing statewide travel demand models. States with fully implemented statewide models include (but are not limited to) Rhode Island, New Hampshire, Wisconsin, Kentucky, New Jersey, Oregon, Michigan, Massachusetts and Pennsylvania. Not all of the existing statewide models are sophisticated enough to provide good information on trips in areas bordering MPO modeled regions and serve as external trip inputs to the MPO models; however, this method is being employed by the following MPOs: Boston, Massachusetts; San Francisco, California; Los Angeles, California; and Sacramento, California. 8 7 This is approximately the same distance from downtown Washington to Dulles International Airport. 8 Boston, San Francisco, and Los Angeles are included because their size and level of complexity is similar to Metropolitan Washington; Sacramento is considered a high-growth region. VHB also contacted the MPO in Modesto (Stanislaus County COG), a rapidly growing area that is ninety minutes drive time from Sacramento and two hours from both San Francisco and San Jose. StanCOG indicated that they did not know their procedure for forecasting external trips and that a consultant performed the work, but VHB could not obtain a response from the consultant; however, it is reasonable to assume that StanCOG forecasts its external trips from a combination of coordination with adjacent MPOs (particularly for I-E trips to the north, west, and south) and the use of the statewide model. 6
7 California Statewide Model The California Statewide Model was developed by the California Department of Transportation (Caltrans) with consultant support from Dowling Associates. The model is implemented in TP+ and was specifically intended to provide external trips for the various MPOs statewide, in addition to modeling intra-state travel. Representatives from the California MPOs expressed satisfaction with the statewide model as a source for external trip forecasts for their area, stating that it made that aspect of regional forecasting easier. Massachusetts Statewide Model The Massachusetts Statewide Model was developed by the Massachusetts Executive Office of Transportation (EOT) and is the source of external trips for the Central Transportation Planning Study (CTPS, the Boston MPO) model. Because EOT also works directly with the MPOs and their member jurisdictions to prepare statewide population and employment forecasts 9 that are used as inputs to the statewide model, coordination and consistency across the state is assured. Recommendations The literature review and survey of MPOs resulted in the conclusion that the methodology for forecasting future external trips is not a hot issue at this time and thus, is not receiving very much attention neither from MPOs nor the transportation research community. MPOs are quite focused (like TPB) on making improvements to the model chain that improve the ability to forecast travel within the modeled region. MPOs that do not use a statewide model to forecast external trips are not doing anything significantly different than TPB s current process. However, in both high-growth regions and complex moderate-growth areas like the National Capital Region, the issue of forecasting external trips is growing in importance as jobs and household continue to locate farther away from traditional urban core areas and contribute to an increased share of external trips in overall regional travel. TPB is planning in the Version 2.2 model release to make some model improvements to address the issue of external trips. 10 There are pieces of the various approaches seen in the above review that can be applied to the TPB process. Clearly, the use of internal trips from a statewide travel demand model as external trips for the TPB model is not a feasible approach at this time. Maryland lacks a statewide model 11, and 9 Like the rest of New England, Massachusetts has extremely weak counties and strong towns and cities and no unincorporated areas; thus a state-level agency like EOT can work with an MPO and towns and cities to create detailed, micro-level statewide forecasts. 10 See COG/TPB (2006), Section Refinement of Growth Assumptions at External Stations. 11 Although Maryland does not have a statewide model, URS Corporation created a model for use in the Maryland Transportation Authority (MdTA) Bay Crossing Task Force study that is examining options for increasing capacity across the Chesapeake Bay. The URS model includes all of Maryland except for Washington, Allegany, and Garrett counties. Information from URS may be helpful in developing the super-regional approach described in the memo. 7
8 although Virginia does have a statewide model, 12 the Virginia Department of Transportation (VDOT) has encountered problems with its application. VDOT modeling resources are currently focused on developing and applying the regional models in smaller MPOs statewide, and they expect it will be 2-3 years before the statewide model is available for regular use. A possible approach is to combine elements of both of the above procedures. First, TPB could create a model super-region at the super-district or county level extending as far as 150 miles from Washington, D.C. based on data available from the 2000 Census Transportation Planning Package (CTPP) and anticipated changes to the areas that regularly interact with the TPB area (see Figure 3-1). The number of external stations in the model network could be increased to match each station with a super-regional county or super-district. In Virginia and Pennsylvania, it may be worth considering adopting the statewide model network for those areas outside the current TPB modeled area for compatibility. Following the collection of external station base counts through traditional counts and surveys, the data could be supplemented by the superregional jurisdictions and MPOs, similar to the coordination TPB already does with BMC and FAMPO, just over a larger area. For future year external trip forecasts, rather than extrapolating or using a growth-factor, TPB could use the updated population / household and employment forecasts for the super-regional jurisdictions and convert the growth to productions and attractions and ultimately external (E-E, E-I, and I-E) trips. Special attention will need to be paid to coordination with existing small MPOs in or near the super-region who may have existing modeling programs, such as the Hagerstown, Cumberland, and Winchester MPOs. These agencies will benefit from the use of the TPB model to produce external trip matrices for their areas. 13 Those areas that may have a designated MPO following the 2010 census, such as the Gettysburg, PA area, should also be considered. Finally, the superregion could encompass most or all of the State of Maryland, thus creating a de facto Maryland statewide model. In addition to improving TPB s forecasting process, this model could be useful to the Baltimore Metropolitan Council (BMC), Hagerstown Eastern Panhandle MPO and other areas throughout the state. In view of the benefits accrued to areas in Maryland outside the Capital Region, this effort may be undertaken jointly with BMC and the Maryland DOT. It could also be expanded to create statewide modeling capabilities in Maryland. In view of the benefits to Maryland, TPB may wish to seek additional funding from BMC and the Maryland Department of Transportation (MDOT) to support development of this process for forecasting external trips. 12 Developed by Wilbur Smith Associates and completed in 2004, the Virginia statewide model implemented in TP+ breaks the Commonwealth into 200 TAZs, and contains both a macro-level model to forecast E-E trips through Virginia and a micro-level to forecast intra-state (I-I) and external (E-I and I-E) trip flows. 13 The potential benefits have led to this type of coordination being planned in Arizona;, the Pima Association of Governments, the Tucson MPO, plans to perform its upcoming (next year) external survey in conjunction with MAG in Phoenix. The two cities are approximately 110 miles apart. 8
9
10 References Boston MPO, Travel Modeling and Other Techniques Used for SIP Project Analysis, es.pdf. Cambridge Systematics & Urban Analytics, September 24, Travel Demand Model Improvement Program, presented to Southern California Association of Governments Modeling Task Force. t#326,2,technical Approach Charlotte Department of Transportation. Metrolina Regional Travel Demand Model, DRAFT Technical Documentation. Denver Regional Council of Governments, Travel in the Denver Region. from Aichong Sun, Pima Area of Governments from Anna Gallop, City of Charlotte Department of Transportation from Elaine Martino, Florida Department of Transportation, District Seven from Hongxiang (Sarah) Sun, Regional Transportation Commission of Southern Nevada from Lark Downs, Stanislaus Council of Governments Federal Highway Administration, Model Validation and Reasonableness Checking Manual. Horowitz, A. J., Tests of a Family of Trip Table Refinements for Long-Range, Quick- Response Travel Forecasting, Transportation Research Record. Metropolitan Washington Council of Governments, National Capital Regional Transportation Planning Board, Fiscal Year 2006 Development Program for TPB Travel Forecasting Models. Murthy, S. & Salem, R. The Rhode Island Statewide Travel Demand Forecasting Model. Parsons Transportation Group, Inc., March 5, PHOENIX EXTERNAL TRAVEL SURVEY: EXECUTIVE SUMMARY. 10
11 Personal conversation with Bruce Griesenbeck, Sacramento Area Council of Governments Personal conversation with Chuck Purvis, Metropolitan Transportation Commission Personal conversation with Guy Rousseau, Atlanta Regional Commission Personal conversation with Keith Killough, Southern California Assocation of Governments Personal and telephone conversation with Paul Agnello, Virginia Department of Transportation Regional Transportation Commission of Southern Nevada, Regional Transportation Plan FY Appendix IIB, Travel Demand Model Documentation. Santa Barbara County Association of Governments, September 16, The 2030 Travel Forecast For Santa Barbara County: Final Report. Sharag-Eldin, A. & Chow, L., June External Stations Forecast Analysis for NOACA 2025 Model Update. Sharma, S., Lyford, R. & Rossi, T. The New Hampshire Statewide Travel Model System. New Hampshire Department of Transportation & Cambridge Systematics, Telephone Conversation with Deardra Sprott, San Antonio / Bexar County MPO. Telephone conversation with Scott Peterson, Central Transportation Planning Staff. Contact at Massachusetts Executive Office of Transportation for Statewide Model is Bob Frey, (617) University of Washington, Cambridge Systematics & Bhat, C., June 30, Recommendations for Integrated Land Use and Travel Models. 11
November 16, Metropolitan Washington Council of Governments National Capital Region Transportation Planning Board
 Metropolitan Washington Council of Governments National Capital Region Transportation Planning Board Summary of the State of the Practice and State of the Art of Modeling Peak Spreading November 16, 2007
Cipra D. Revised Submittal 1
 Cipra D. Revised Submittal 1 Enhancing MPO Travel Models with Statewide Model Inputs: An Application from Wisconsin David Cipra, PhD * Wisconsin Department of Transportation PO Box 7913 Madison, Wisconsin
Draft. Butte County Long-Term Regional Growth Forecasts
 Draft Butte County Long-Term Regional Growth Forecasts 2014 2040 Prepared by: November 25 th, 2014 2580 Sierra Sunrise Terrace, Suite 100 Chico, CA 95928 Phone: 530-879-2468 FAX: 530-879-244 www.bcag.org
3.0 ANALYSIS OF FUTURE TRANSPORTATION NEEDS
 3.0 ANALYSIS OF FUTURE TRANSPORTATION NEEDS In order to better determine future roadway expansion and connectivity needs, future population growth and land development patterns were analyzed as part of
Intercity Bus Stop Analysis
 by Karalyn Clouser, Research Associate and David Kack, Director of the Small Urban and Rural Livability Center Western Transportation Institute College of Engineering Montana State University Report prepared
Appendixx C Travel Demand Model Development and Forecasting Lubbock Outer Route Study June 2014
 Appendix C Travel Demand Model Development and Forecasting Lubbock Outer Route Study June 2014 CONTENTS List of Figures-... 3 List of Tables... 4 Introduction... 1 Application of the Lubbock Travel Demand
Technical Memorandum #2 Future Conditions
 Technical Memorandum #2 Future Conditions To: Dan Farnsworth Transportation Planner Fargo-Moorhead Metro Council of Governments From: Rick Gunderson, PE Josh Hinds PE, PTOE Houston Engineering, Inc. Subject:
StanCOG Transportation Model Program. General Summary
 StanCOG Transportation Model Program Adopted By the StanCOG Policy Board March 17, 2010 What are Transportation Models? General Summary Transportation Models are technical planning and decision support
Status Report: Ongoing review of O-D cellular data for the TPB modeled area
 Item #4 Status Report: Ongoing review of O-D cellular data for the TPB modeled area Presentation to the Travel Forecasting Subcommittee September 19, 2014 Ronald Milone, COG/TPB staff National Capital
, District of Columbia
 State Capitals These are the State Seals of each state. Fill in the blank with the name of each states capital city. (Hint: You may find it helpful to do the word search first to refresh your memory.),
III. FORECASTED GROWTH
 III. FORECASTED GROWTH In order to properly identify potential improvement projects that will be required for the transportation system in Milliken, it is important to first understand the nature and volume
APPENDIX IV MODELLING
 APPENDIX IV MODELLING Kingston Transportation Master Plan Final Report, July 2004 Appendix IV: Modelling i TABLE OF CONTENTS Page 1.0 INTRODUCTION... 1 2.0 OBJECTIVE... 1 3.0 URBAN TRANSPORTATION MODELLING
FHWA GIS Outreach Activities. Loveland, Colorado April 17, 2012
 FHWA GIS Outreach Activities Loveland, Colorado April 17, 2012 GIS for Improved Decision Making FHWA believes that geographic information systems and other geospatial technologies (remote sensing and GPS)
Regional Transit Development Plan Strategic Corridors Analysis. Employment Access and Commuting Patterns Analysis. (Draft)
") Regional Transit Development Plan Strategic Corridors Analysis Employment Access and Commuting Patterns Analysis (Draft) April 2010 Contents 1.0 INTRODUCTION... 4 1.1 Overview and Data Sources... 4 1.2
Regional Transit Development Plan Strategic Corridors Analysis Employment Access and Commuting Patterns Analysis (Draft) April 2010 Contents 1.0 INTRODUCTION... 4 1.1 Overview and Data Sources... 4 1.2
DCHC MPO. Socioeconomic Data (SE Data) Guide Totals. Purpose. Actions. Use of Guide Totals. Partial Counties and Map. Population Guide Totals
 Guide Totals. Purpose. Actions. Use of Guide Totals. Partial Counties and Map. Population Guide Totals") DCHC MPO Socioeconomic Data (SE Data) Guide Totals Purpose This document presents: Information on how guide totals are used; Population and employment guide totals for counties in the Triangle Regional
DCHC MPO Socioeconomic Data (SE Data) Guide Totals Purpose This document presents: Information on how guide totals are used; Population and employment guide totals for counties in the Triangle Regional
Expanding the GSATS Model Area into
 Appendix A Expanding the GSATS Model Area into North Carolina Jluy, 2011 Table of Contents LONG-RANGE TRANSPORTATION PLAN UPDATE 1. Introduction... 1 1.1 Background... 1 1.2 Existing Northern Extent of
Hillsborough County MPO Transit Study. Technical Team August 23, 2007
 Hillsborough County MPO Transit Study Technical Team August 23, 2007 Meeting Agenda Technology Choices Needs and Opportunities Transit Concepts Comparative Land Use Analysis Measures of Effectiveness System
Modeling Mode in a Statewide Context
 Modeling Mode in a Statewide Context CDM Smith ADOT Transportation Planning Applications Conference May 6, 2013 Presentation Overview Development Team AZTDM3 Overview AZTDM3 Modes of Travel Transit Abstraction
STAFF REPORT. MEETING DATE: July 3, 2008 AGENDA ITEM: 7
 STAFF REPORT SUBJECT: Travel Models MEETING DATE: July 3, 2008 AGENDA ITEM: 7 RECOMMENDATION: Receive information on status of travel model development in Santa Barbara County and review factors to achieve
APPENDIX V VALLEYWIDE REPORT
 APPENDIX V VALLEYWIDE REPORT Page Intentionally Left Blank 1.2 San Joaquin Valley Profile Geography The San Joaquin Valley is the southern portion of the Great Central Valley of California (Exhibit 1-1).
Impact of Metropolitan-level Built Environment on Travel Behavior
 Impact of Metropolitan-level Built Environment on Travel Behavior Arefeh Nasri 1 and Lei Zhang 2,* 1. Graduate Research Assistant; 2. Assistant Professor (*Corresponding Author) Department of Civil and
2014 Certification Review Regional Data & Modeling
 2014 Certification Review Regional Data & Modeling July 22, 2014 Regional Data Census Program Coordination PAG works with and for member agencies to ensure full participation in all Census Bureau programs
California Urban Infill Trip Generation Study. Jim Daisa, P.E.
 California Urban Infill Trip Generation Study Jim Daisa, P.E. What We Did in the Study Develop trip generation rates for land uses in urban areas of California Establish a California urban land use trip
Market Street PDP. Nassau County, Florida. Transportation Impact Analysis. VHB/Vanasse Hangen Brustlin, Inc. Nassau County Growth Management
 Transportation Impact Analysis Market Street PDP Nassau County, Florida Submitted to Nassau County Growth Management Prepared for TerraPointe Services, Inc. Prepared by VHB/Vanasse Hangen Brustlin, Inc.
2040 MTP and CTP Socioeconomic Data
 SE Data 6-1 24 MTP and CTP Socioeconomic Data Purpose of Socioeconomic Data The socioeconomic data (SE Data) shows the location of the population and employment, median household income and other demographic
TPB Version 2.3 Travel Forecasting Model for the 3,722 Zone Area System: Calibration Report Draft Report
 National Capital Region Transportation Planning Board TPB Version 2.3 Travel Forecasting Model for the 3,722 Zone Area System: Calibration Report Draft Report February 28, 2011 (Updated April 29, 2011)
Study Overview. the nassau hub study. The Nassau Hub
 Livable Communities through Sustainable Transportation the nassau hub study AlternativeS analysis / environmental impact statement The Nassau Hub Study Overview Nassau County has initiated the preparation
Prepared for: San Diego Association Of Governments 401 B Street, Suite 800 San Diego, California 92101
 Activity-Based Travel Model Validation for 2012 Using Series 13 Data: Coordinated Travel Regional Activity Based Modeling Platform (CT-RAMP) for San Diego County Prepared for: San Diego Association Of
FHWA Peer Exchange Meeting on Transportation Systems Management during Inclement Weather
 Travel Demand Modeling & Simulation at GBNRTC Matt Grabau Kimberly Smith Mike Davis Why Model? Travel modeling is a tool for transportation planners and policy makers, to observe impacts of a transportation
NAVIGATION AND VESSEL INSPECTION CIRCULAR NO
 COMDTPUB P16700.4 NVIC 13-92 15 Dec 1992 NAVIGATION AND VESSEL INSPECTION CIRCULAR NO. 13-92 Electronic Version for Distribution Via the World Wide Web Subj: Captain of the Port Zone Boundaries 1. PURPOSE.
Introduction of Information Feedback Loop To Enhance Urban Transportation Modeling System
 TRANSPORTATION RESEARCH RECORD 1493 81 Introduction of Information Feedback Loop To Enhance Urban Transportation Modeling System KYLE B. WINSLOW, ATHANASSIOS K. BLADIKAS, KENNETH J. HAUSMAN, AND LAZAR
HORIZON 2030: Land Use & Transportation November 2005
 PROJECTS Land Use An important component of the Horizon transportation planning process involved reviewing the area s comprehensive land use plans to ensure consistency between them and the longrange transportation
Developing and Validating Regional Travel Forecasting Models with CTPP Data: MAG Experience
 CTPP Webinar and Discussion Thursday, July 17, 1-3pm EDT Developing and Validating Regional Travel Forecasting Models with CTPP Data: MAG Experience Kyunghwi Jeon, MAG Petya Maneva, MAG Vladimir Livshits,
Forecasts for the Reston/Dulles Rail Corridor and Route 28 Corridor 2010 to 2050
 George Mason University Center for Regional Analysis Forecasts for the Reston/Dulles Rail Corridor and Route 28 Corridor 21 to 25 Prepared for the Fairfax County Department of Planning and Zoning Lisa
Sketch Transit Modeling Based on 2000 Census Data. Norm Marshall and Brian Grady. Norm Marshall
 Sketch Transit Modeling Based on 2000 Census Data Norm Marshall and Brian Grady Norm Marshall nmarshall@smartmobility.com Brian Grady bgrady@smartmobility.com Both at Smart Mobility Inc. P. O. Box 750
6 th Line Municipal Class Environmental Assessment
 6 th Line Municipal Class Environmental Assessment County Road 27 to St John s Road Town of Innisfil, ON September 6, 2016 APPENDIX L: TRAVEL DEMAND FORECASTING MEMORANDUM Accessible formats are available
Vibrancy and Property Performance of Major U.S. Employment Centers. Appendix A
 Appendix A DOWNTOWN VIBRANCY SCORES Atlanta 103.3 Minneapolis 152.8 Austin 112.3 Nashville 83.5 Baltimore 151.3 New Orleans 124.3 Birmingham 59.3 New York Midtown 448.6 Charlotte 94.1 Oakland 157.7 Chicago
Calibration Report for the TPB Travel Forecasting Model, Version 2.3, on the 3,722 Zone Area System Final Report
 National Capital Region Transportation Planning Board Metropolitan Washington Council of Governments Calibration Report for the TPB Travel Forecasting Model, Version 2.3, on the 3,722 Zone Area System
Transportation Statistical Data Development Report OKALOOSA-WALTON OUTLOOK 2035 LONG RANGE TRANSPORTATION PLAN
 Transportation Statistical Data Development Report OKALOOSA-WALTON OUTLOOK 2035 LONG RANGE TRANSPORTATION PLAN Prepared for the Okaloosa-Walton Transportation Planning Organization and The Florida Department
New Educators Campaign Weekly Report
 Campaign Weekly Report Conversations and 9/24/2017 Leader Forms Emails Collected Text Opt-ins Digital Journey 14,661 5,289 4,458 7,124 317 13,699 1,871 2,124 Pro 13,924 5,175 4,345 6,726 294 13,086 1,767
Standard Indicator That s the Latitude! Students will use latitude and longitude to locate places in Indiana and other parts of the world.
 Standard Indicator 4.3.1 That s the Latitude! Purpose Students will use latitude and longitude to locate places in Indiana and other parts of the world. Materials For the teacher: graph paper, globe showing
Data Collection. Lecture Notes in Transportation Systems Engineering. Prof. Tom V. Mathew. 1 Overview 1
 Data Collection Lecture Notes in Transportation Systems Engineering Prof. Tom V. Mathew Contents 1 Overview 1 2 Survey design 2 2.1 Information needed................................. 2 2.2 Study area.....................................
Wesley Chapel Area Roadway Needs Study Build-Out Analysis (Beardsley Dr/Oldwoods Ave Need Study) Project Progress Meeting 1
 Project Progress Meeting 1") Build-Out Analysis (Beardsley Dr/Oldwoods Ave Need Study) Project Progress Meeting 1 9:30 AM Pasco County Development Services Conference Room 1. Welcome/Introductions 2. Project Overview Purpose Major
Build-Out Analysis (Beardsley Dr/Oldwoods Ave Need Study) Project Progress Meeting 1 9:30 AM Pasco County Development Services Conference Room 1. Welcome/Introductions 2. Project Overview Purpose Major
Traffic Impact Study
 Traffic Impact Study Statham DRI One University Parkway Prepared for: Barrow County Prepared by: October 2012 Table of Contents Executive Summary i Section 1. Introduction 1 Project Description 1 Methodology
MPOs SB 375 LAFCOs SCAG Practices/Experiences And Future Collaborations with LAFCOs
 Connecting LAFCOs and COGs for Mutual Benefits MPOs SB 375 LAFCOs SCAG Practices/Experiences And Future Collaborations with LAFCOs Frank Wen, Manager Research & Analysis Land Use & Environmental Planning
ACCESSIBILITY OF INTERMODAL CENTERS STUDY
 ACCESSIBILITY OF INTERMODAL CENTERS STUDY Presentation for VDOT Forum - Coordinating Transportation Planning and Land Use Wednesday, April 2, 2014 Vlad Gavrilovic, AICP - Renaissance Planning Group Tasks
WOODRUFF ROAD CORRIDOR ORIGIN-DESTINATION ANALYSIS
 2018 WOODRUFF ROAD CORRIDOR ORIGIN-DESTINATION ANALYSIS Introduction Woodruff Road is the main road to and through the commercial area in Greenville, South Carolina. Businesses along the corridor have
Overview of Improved Data and Tools for Integrated Land Use-Transportation Planning in California Caltrans Planning Horizons program November 7, 2012
 Overview of Improved Data and Tools for Integrated Land Use-Transportation Planning in California Caltrans Planning Horizons program November 7, 2012 Presentation Outline Part 1. Overview - Terry Parker,
2015 Grand Forks East Grand Forks TDM
 GRAND FORKS EAST GRAND FORKS 2015 TRAVEL DEMAND MODEL UPDATE DRAFT REPORT To the Grand Forks East Grand Forks MPO October 2017 Diomo Motuba, PhD & Muhammad Asif Khan (PhD Candidate) Advanced Traffic Analysis
Density and Walkable Communities
 Density and Walkable Communities Reid Ewing Professor & Chair City and Metropolitan Planning University of Utah ewing@arch.utah.edu Department of City & Metropolitan Planning, University of Utah MRC Research
An Integrated Approach to Statewide Travel Modeling Applications in Delaware
 TRB 88 th Annual Meeting Washington, D.C. January 14 th, 29 An Integrated Approach to Statewide Travel Modeling Applications in Delaware The Context: Challenges for Today s Modelers: Personnel: Vacant
Facts and Findings. Exhibit A-1
 Exhibit A-1 Facts and Findings The county periodically prepares coordinated countywide forecasts for all the cities in the county and the unincorporated area. These forecasts can be used by cities as a
Understanding Land Use and Walk Behavior in Utah
 Understanding Land Use and Walk Behavior in Utah 15 th TRB National Transportation Planning Applications Conference Callie New GIS Analyst + Planner STUDY AREA STUDY AREA 11 statistical areas (2010 census)
FHWA Planning Data Resources: Census Data Planning Products (CTPP) HEPGIS Interactive Mapping Portal
 HEPGIS Interactive Mapping Portal") FHWA Planning Data Resources: Census Data Planning Products (CTPP) HEPGIS Interactive Mapping Portal Jeremy Raw, P.E. FHWA, Office of Planning, Systems Planning and Analysis August 2017 Outline Census
FHWA Planning Data Resources: Census Data Planning Products (CTPP) HEPGIS Interactive Mapping Portal Jeremy Raw, P.E. FHWA, Office of Planning, Systems Planning and Analysis August 2017 Outline Census
Use of US Census Data for Transportation Modeling and Planning
 Use of US Census Data for Transportation Modeling and Planning Yongqiang Wu, P.E. CTS Engineering, Inc. Southeast Florida FSUTMS User Group Meeting September 14, 2018 Outline Overview of Census Products
Improving the Model s Sensitivity to Land Use Policies and Nonmotorized Travel
 Improving the Model s Sensitivity to Land Use Policies and Nonmotorized Travel presented to MWCOG/NCRTPB Travel Forecasting Subcommittee presented by John (Jay) Evans, P.E., AICP Cambridge Systematics,
Typical information required from the data collection can be grouped into four categories, enumerated as below.
 Chapter 6 Data Collection 6.1 Overview The four-stage modeling, an important tool for forecasting future demand and performance of a transportation system, was developed for evaluating large-scale infrastructure
Forecasts from the Strategy Planning Model
 Forecasts from the Strategy Planning Model Appendix A A12.1 As reported in Chapter 4, we used the Greater Manchester Strategy Planning Model (SPM) to test our long-term transport strategy. A12.2 The origins
TRAVEL DEMAND MODEL. Chapter 6
 Chapter 6 TRAVEL DEMAND MODEL As a component of the Teller County Transportation Plan development, a computerized travel demand model was developed. The model was utilized for development of the Transportation
The Elusive Connection between Density and Transit Use
 The Elusive Connection between Density and Transit Use Abstract: The connection between density and transportation is heralded by planners, yet results are often elusive. This paper analyzes two regions,
Regional Haze Metrics Trends and HYSPLIT Trajectory Analyses. May 2017
 Regional Haze Metrics Trends and HYSPLIT Trajectory Analyses May 2017 Principal Contributors: Tom Downs, CCM, ME DEP Project manager Martha Webster, ME DEP Trajectory analyses and GIS mapping Rich Greves,
Simplified Trips-on-Project Software (STOPS): Strategies for Successful Application
: Strategies for Successful Application") Simplified Trips-on-Project Software (STOPS): Strategies for Successful Application presented to Transit Committee Florida Model Task Force presented by Cambridge Systematics, Inc. John (Jay) Evans, AICP
Simplified Trips-on-Project Software (STOPS): Strategies for Successful Application presented to Transit Committee Florida Model Task Force presented by Cambridge Systematics, Inc. John (Jay) Evans, AICP
Correction to Spatial and temporal distributions of U.S. winds and wind power at 80 m derived from measurements
 JOURNAL OF GEOPHYSICAL RESEARCH, VOL. 109,, doi:10.1029/2004jd005099, 2004 Correction to Spatial and temporal distributions of U.S. winds and wind power at 80 m derived from measurements Cristina L. Archer
محاضرة رقم 4. UTransportation Planning. U1. Trip Distribution
 UTransportation Planning U1. Trip Distribution Trip distribution is the second step in the four-step modeling process. It is intended to address the question of how many of the trips generated in the trip
The History Behind Census Geography
 The History Behind Census Geography Michael Ratcliffe Geography Division US Census Bureau Kentucky State Data Center Affiliate Meeting August 5, 2016 Today s Presentation A brief look at the history behind
Appendix BAL Baltimore, Maryland 2003 Annual Report on Freeway Mobility and Reliability
 (http://mobility.tamu.edu/mmp) Office of Operations, Federal Highway Administration Appendix BAL Baltimore, Maryland 2003 Annual Report on Freeway Mobility and Reliability This report is a supplement to:
Tier 2 Final Environmental Assessment I-66 Transportation Technical Report. Appendix E. Travel Demand Forecasting Model Validation Memorandum
 Tier 2 Final Environmental Assessment I-66 Transportation Technical Report Appendix E Travel Demand Forecasting Model Validation Memorandum FINAL AUGUST 216 MEMORANDUM To: Robert Josef, VDOT Northern Virginia
106 PURDUE ENGINEERING EXTENSION DEPARTMENT
 106 PURDUE ENGINEERING EXTENSION DEPARTMENT distribution by stations can best be studied by examining Figs. 3 and 4. Figure 4 shows the frequency distribution between stations, and Fig. 3 shows the actual
Kathryn Robinson. Grades 3-5. From the Just Turn & Share Centers Series VOLUME 12
 1 2 From the Just Turn & Share Centers Series VOLUME 12 Temperature TM From the Just Turn & Share Centers Series Kathryn Robinson 3 4 M Enterprises WriteMath Enterprises 2303 Marseille Ct. Suite 104 Valrico,
REFINEMENT OF FSUTMS TRIP DISTRIBUTION METHODOLOGY
 REFINEMENT OF FSUTMS TRIP DISTRIBUTION METHODOLOGY Percentage of Trips (%) 10.00 9.00 8.00 7.00 6.00 5.00 4.00 3.00 2.00 1.00 Survey Destination Choice Model with Spatial Variables Destination Choice Model
Advancing Urban Models in the 21 st Century. Jeff Tayman Lecturer, Dept. of Economics University of California, San Diego
 Advancing Urban Models in the 21 st Century Jeff Tayman Lecturer, Dept. of Economics University of California, San Diego 1 Regional Decision System Better tools Better data Better access Better Decisions
Environmental Analysis, Chapter 4 Consequences, and Mitigation
 Environmental Analysis, Chapter 4 4.17 Environmental Justice This section summarizes the potential impacts described in Chapter 3, Transportation Impacts and Mitigation, and other sections of Chapter 4,
GAMPO 2018 FALL MEETING. National Performance Research Data Set GAMPO 2018 FALL MEETING (NPMRDS) CASE STUDY GAMPO FALL MEETING SEPTEMBER 2018
 CASE STUDY GAMPO FALL MEETING SEPTEMBER 2018") GAMPO 2018 FALL MEETING National Performance Research Data Set GAMPO 2018 FALL MEETING (NPMRDS) CASE STUDY Agenda Introduction and Overview NPMRDS Tool Access Use / Applications Examples Questions 2 Establish
GAMPO 2018 FALL MEETING National Performance Research Data Set GAMPO 2018 FALL MEETING (NPMRDS) CASE STUDY Agenda Introduction and Overview NPMRDS Tool Access Use / Applications Examples Questions 2 Establish
Updating the Urban Boundary and Functional Classification of New Jersey Roadways using 2010 Census data
 Updating the Urban Boundary and Functional Classification of New Jersey Roadways using 2010 Census data By: Glenn Locke, GISP, PMP 1 GIS-T May, 2013 Presentation Overview Purpose of Project Methodology
NATHAN HALE HIGH SCHOOL PARKING AND TRAFFIC ANALYSIS. Table of Contents
 Parking and Traffic Analysis Seattle, WA Prepared for: URS Corporation 1501 4th Avenue, Suite 1400 Seattle, WA 98101-1616 Prepared by: Mirai Transportation Planning & Engineering 11410 NE 122nd Way, Suite
Rank University AMJ AMR ASQ JAP OBHDP OS PPSYCH SMJ SUM 1 University of Pennsylvania (T) Michigan State University
 Michigan State University") Rank University AMJ AMR ASQ JAP OBHDP OS PPSYCH SMJ SUM 1 University of Pennsylvania 4 1 2 0 2 4 0 9 22 2(T) Michigan State University 2 0 0 9 1 0 0 4 16 University of Michigan 3 0 2 5 2 0 0 4 16 4 Harvard
Rank University AMJ AMR ASQ JAP OBHDP OS PPSYCH SMJ SUM 1 University of Pennsylvania 4 1 2 0 2 4 0 9 22 2(T) Michigan State University 2 0 0 9 1 0 0 4 16 University of Michigan 3 0 2 5 2 0 0 4 16 4 Harvard
Trip Distribution Review and Recommendations
 Trip Distribution Review and Recommendations presented to MTF Model Advancement Committee presented by Ken Kaltenbach The Corradino Group November 9, 2009 1 Purpose Review trip distribution procedures
Guidelines on Using California Land Use/Transportation Planning Tools
 Guidelines on Using California Land Use/Transportation Planning Tools 1. Selecting Ds Analysis Modules Appropriate to a Region In almost all cases, the appropriate Ds Analysis Module to use for analysis
Beginning to Enjoy the Outside View A Glance at Transit Forecasting Uncertainty & Accuracy Using the Transit Forecasting Accuracy Database
 Beginning to Enjoy the Outside View A Glance at Transit Forecasting Uncertainty & Accuracy Using the Transit Forecasting Accuracy Database presented by David Schmitt, AICP with very special thanks to Hongbo
Abortion Facilities Target College Students
 Target College Students By Kristan Hawkins Executive Director, Students for Life America Ashleigh Weaver Researcher Abstract In the Fall 2011, Life Dynamics released a study entitled, Racial Targeting
City of Grand Island Tuesday, August 14, 2018 Council Session
 City of Grand Island Tuesday, August 14, 2018 Council Session Item I-1 #2018-240 - Consideration of Approving Update to Resolution No. 2015-120; Designated Truck Routes within the City of Grand Island
ADDRESSING TITLE VI AND ENVIRONMENTAL JUSTICE IN LONG-RANGE TRANSPORTATION PLANS
 ADDRESSING TITLE VI AND ENVIRONMENTAL JUSTICE IN LONG-RANGE TRANSPORTATION PLANS Activities from the National Capital Region Transportation Planning Board Sergio Ritacco Transportation Planner 2017 Association
Summary of Terminal Master s Degree Programs in Philosophy
 Summary of Terminal Master s Degree Programs in Philosophy Faculty and Student Demographics All data collected by the ican Philosophical Association. The data in this publication have been provided by
final report A Recommended Approach to Delineating Traffic Analysis Zones in Florida Florida Department of Transportation Systems Planning Office
 A Recommended Approach to Delineating Traffic Analysis Zones in Florida final report prepared for Florida Department of Transportation Systems Planning Office September 27, 2007 final report A Recommended
Cambridge Systematics, Inc., New York, NY, Associate, Cambridge Systematics, Inc., New York, NY, Senior Professional,
 Xia Jin, Ph.D., AICP Assistant Professor, Transportation Engineering Department of Civil and Environmental Engineering, EC 3603, Florida International University 10555 W Flagler St., Miami, FL 33174. Phone:
The Use of Geographic Information Systems (GIS) by Local Governments. Giving municipal decision-makers the power to make better decisions
 by Local Governments. Giving municipal decision-makers the power to make better decisions") The Use of Geographic Information Systems (GIS) by Local Governments Giving municipal decision-makers the power to make better decisions Case Study: Examples of GIS Usage by Local Governments in North
The Use of Geographic Information Systems (GIS) by Local Governments Giving municipal decision-makers the power to make better decisions Case Study: Examples of GIS Usage by Local Governments in North
NRS 509 Applications of GIS for Environmental Spatial Data Analysis Project. Fall 2005
 NRS 509 Applications of GIS for Environmental Spatial Data Analysis Project. Fall 2005 GIS in Urban and Regional Transportation Planning Alolade Campbell Department of Civil and Environmental Engineering
VHD Daily Totals. Population 14.5% change. VMT Daily Totals Suffolk 24-hour VMT. 49.3% change. 14.4% change VMT
 6.9 Suffolk 6-54 VMT Population and Travel Characteristics Population 14.5% change 2014 1,529,202 VHD Daily Totals 2014 251,060 49.3% change 2040 1,788,175 2040 374,850 VMT Daily Totals 2014 39,731,990
15.0 Operations and Maintenance Cost Calculations
 15.0 Operations and Maintenance Cost Calculations 15.1 Introduction Operations and Maintenance (O&M) costs were calculated for each of the four alternatives being considered in the analysis. No Build Alternative
2014 UTP Public Meeting July 18, 2013
 2014 UTP Public Meeting July 18, 2013 What is the Unified Transportation Program (UTP)? 3 UTP is Updated Annually by August 31st Spring - Summer 2013 UTP 2014 UTP UTP Development Process 4 UTP Connects
THE FUTURE OF FORECASTING AT METROPOLITAN COUNCIL. CTS Research Conference May 23, 2012
 THE FUTURE OF FORECASTING AT METROPOLITAN COUNCIL CTS Research Conference May 23, 2012 Metropolitan Council forecasts Regional planning agency and MPO for Twin Cities metropolitan area Operates regional
Final City of Colusa STREETS & ROADWAYS MASTER PLAN. October J Street Suite 390 Sacramento, CA 95814
 Final City of Colusa STREETS & ROADWAYS MASTER PLAN October 2009 660 J Street Suite 390 Sacramento, CA 95814 TABLE OF CONTENTS I. INTRODUCTION... 1 Report Organization...1 II. ANALYSIS METHODOLOGY... 2
The Census, Urbanized Areas, and Your MPO/RPO
 The Census, Urbanized Areas, and Your MPO/RPO Alex Bond, AICP NADO Rural Transportation Peer Learning Conference August 25, 2011 1 Issues to Discuss Census background Definitions of Census geographies
Employment Capacity in Transit Station Areas in Maryland
 Employment Capacity in Transit Station Areas in Maryland Prepared by: The National Center for Smart Growth Research and Education at the University of Maryland* Gerrit Knaap, PhD, Director Terry Moore,
SUPPLEMENTAL NUTRITION ASSISTANCE PROGRAM QUALITY CONTROL ANNUAL REPORT FISCAL YEAR 2008
 SUPPLEMENTAL NUTRITION ASSISTANCE PROGRAM QUALITY CONTROL ANNUAL REPORT FISCAL YEAR 2008 U.S. DEPARTMENT OF AGRICULTURE FOOD AND NUTRITION SERVICE PROGRAM ACCOUNTABILITY AND ADMINISTRATION DIVISION QUALITY
Transferability of Household Travel Data Across Geographic Areas Using NHTS 2001
 Transferability of Household Travel Data Across Geographic Areas Using NHTS 2001 Jane Lin PhD Assistant Professor Department of Civil and Materials Engineering Institute for Environmental Science and Policy
Crime Analysis. GIS Solutions for Intelligence-Led Policing
 Crime Analysis GIS Solutions for Intelligence-Led Policing Applying GIS Technology to Crime Analysis Know Your Community Analyze Your Crime Use Your Advantage GIS aids crime analysis by Identifying and
Enhancing State and MPO Transportation Planning Using National Household Travel Survey Add-On Data: The Wisconsin Experience
 Proussaloglou 1 Enhancing State and MPO Transportation Planning Using National Household Travel Survey Add-On Data: The Wisconsin Experience Kimon E. Proussaloglou and Yasasvi D. Popuri Cambridge Systematics
Abstract. [Map 1] [Map 2] [Map 3] [Figures 1, 2, and 3] Metropolitan Transportation Commission - Oakland, California. Defining Communities of Concern
![Abstract. [Map 1] [Map 2] [Map 3] [Figures 1, 2, and 3] Metropolitan Transportation Commission - Oakland, California. Defining Communities of Concern](/thumbs/77/75685724.jpg "Abstract. [Map 1] [Map 2] [Map 3] [Figures 1, 2, and 3] Metropolitan Transportation Commission - Oakland, California. Defining Communities of Concern") Environmental Justice for Long-Range Regional Transportation Plans: Using Census Data to Target Communities of Concern Presented By: Rachel Gossen Project Team: Therese Knudsen, Chuck Purvis, Rachel Gossen
Environmental Justice for Long-Range Regional Transportation Plans: Using Census Data to Target Communities of Concern Presented By: Rachel Gossen Project Team: Therese Knudsen, Chuck Purvis, Rachel Gossen
Date: March 31, 2014 PATE; fyril 2.3,2 >H
 aj BRAMPTON fifs Rower City XH-l-f r.t "»* City Council The Corporation of the City of Brampton SRAMPTON CITY COUNCIL Date: March 31, 2014 PATE; fyril 2.3,2 >H File: POO GR VisWhtoJed ^t'th-meeh'^a Subject: