Developing and Validating Regional Travel Forecasting Models with CTPP Data: MAG Experience
|
|
|
- Vernon Gardner
- 6 years ago
- Views:
Transcription


1 CTPP Webinar and Discussion Thursday, July 17, 1-3pm EDT Developing and Validating Regional Travel Forecasting Models with CTPP Data: MAG Experience Kyunghwi Jeon, MAG Petya Maneva, MAG Vladimir Livshits, MAG Acknowledgements: Ken Cervenka, FTA 1
2 ACS Data Including CTPP Products and PUMS Data Were Used in MAG Model Development and Validation: Trip Generation Model Development Destination Choice Model Development Auto Ownership Model Development Model Validations 2

3 Focus of this Presentation is on Comparing Commuter Flows between the MAG Model and CTPP 5-year estimates CTPP American Community Survey (ACS) 5-year estimates are PERIOD estimates MAG Model Socioeconomic data is based on a single point in time estimate ACS estimates are controlled to the Census Bureau s annual population estimates over the 5 year period 3


4 MAG Modeling Area: Where We Are Area: 16 thousand square miles 211 Population: 4.5 million people 211 Employment: 1.8 million jobs Traffic Analysis Zones: 3,9 4
5 MAG 211 Socio-Economic Projections VS. CTPP 5-year Estimates: Not Directly Comparable but Comparison of Distributions of Commuter Flows on an Aggregate Level is still of Interest Population 211 MAG Model CTPP Difference Perc. Difference Maricopa 4,14,542 3,751, ,97 9% Pinal 395, ,26 66,694 2% Total 4,5,496 4,8,75 419,791 1% Employment 211 MAG Model CTPP Difference Perc. Difference Maricopa 1,744,641 1,442,481 32,16 21% Pinal 59,313 69,879-1,566-15% Total 1,83,954 1,512,36 291,594 19% 5
6 Seasonal and Transient Populations Are Included in MAG Projections but Are not Reflected in CTPP Data 211 MAG Model Population Categories: Residential Group Quarters Seasonal Transient ACS Database Population Categories: Residential Group Quarters Other Differences in Employment Calculations 6
7 Socio-Economic data is not directly comparable between CTPP estimates and MAG annual forecast We can t compare absolute trip numbers and need to look at comparison of proportional distribution of travel between CTPP and MAG model. 7

8 Biggest Population Difference is on the Edge of the Region in Pinal County Proportion of Trips Going To/From this District Does Not Affect Substantially Other Trip Interchanges 8

9 Pinal County is the Only District with Higher CTPP Employment Estimates than MAG Data 9
10 How we Delineated Districts: the Starting Point Initial districts (32) that were used to reweight 28 NHTS - Homogenous median household income for the district s block groups - No less than 1 households surveyed in NHTS 1

11 Income Distribution as a Criterion 11
12 How We Delineated Districts Previous MAG experience showed that in order to facilitate manual analysis of the largest travel patterns in the region 1 to 15 districts are most appropriate. Other factors to consider: - Average trip length for HBW trips: 12.7 miles - Margins of error in CTPP data sets - Land use and socio-economic data 12


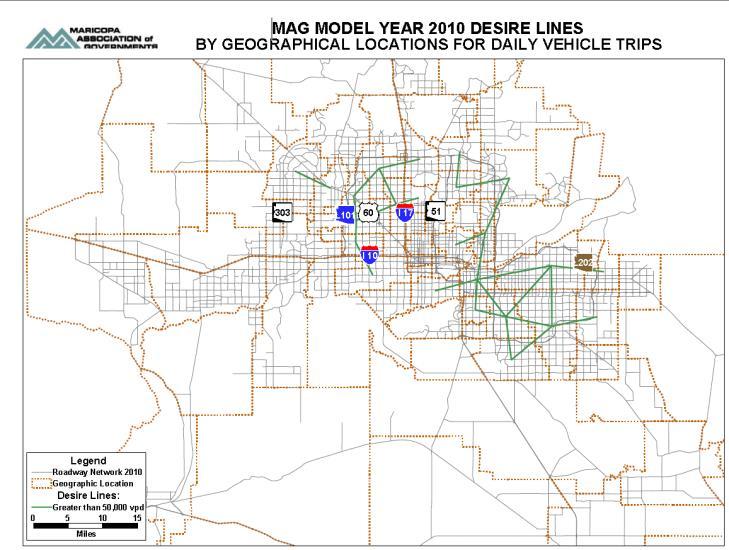
13 Analysis of Largest Desire Lines and Spider Networks can Help to Determine Number and Configuration of Districts 13
14 How to Draw Districts Somewhat Similar to Delineating TAZ and Creating Screenlines Starting point can be districts created for another purpose Look for socio-economic homogeneity inside a district but ensure that level of aggregation is sufficient for meaningful comparison Let freeways, jurisdictional limits and major physical barriers serve as boundaries as appropriate Exclude peripheral zones/districts A few iterations might be required 14

15 Sequence of District Delineation 15

16 Defining Districts: Conforming to Jurisdictional Boundaries and Freeways 16
17 Aggregation of TAZs to Districts Model: Select contiguous TAZs in Agency s dataset Aggregate sets of TAZs to districts CTPP: Generate centroids point for CTTP TAZs Overlay CTPP centroids with district polygons Assign whole CTTP TAZs to districts Map both sets of districts for quality assurance 17

18 Final District System Excluded from comparisons because of lack of spatial overlap between the district and the MAG modeling Area Excluded from comparisons because of lack of spatial overlap between the district and the MAG modeling Area 18
19 Creating Tables for Comparison 211 MAG Model PA person trip tables are used pk_hbw_aggregated + op_hbw_aggregated CTPP Database CTPP Flows - TAZ-to-TAZ home-to-work trips, aggregated to district level 19
20 Modeled District-to-District HBW Trips 211 MAG Model District Total 1 6,153 1, ,613 4,417 7,837 3, , ,427 4,68 19,735 21,586 17,64 5, , ,246 15,313 24,79 6,998 1, ,438 4,183 1, , ,57 7,816 9,446 41,687 6, ,718 4,782 3, , ,347 3,132 41,59 91,778 21, ,695 1,44 1, , ,635 1,913 28,39 91, ,19 11,84 2,429 4,974 1,325 1, ,21 7 2,145 7, ,435 15,671 31,498 38,934 4, , , ,452 7,694 11,144 5,658 17, , ,15 15,67 2, ,756 2,953 7, , ,24 27,197 14,64 1, ,129 5,427 27,77 1,83 135, ,481 28,97 21,146 3, ,881 27,785 94,544 1,92 21, ,478 6,98 1, ,49 1,66 23,137 45,778 17,261 Total 1,44 75,275 41, , , ,481 71,749 28,87 16,34 13, ,133 49,847 1,498,11 2
21 CTPP District-to-District Flows CTPP Data District Total 1 5, ,15 3,718 5,47 1, , ,744 3,335 16,4 2,948 17,194 4, ,242 1, , ,848 16,52 14,284 6,264 1, ,49 2,278 2, , ,64 7,23 87,48 38,73 11,234 1, ,891 5,62 5, , ,84 4,152 38,918 92,122 27,521 3,563 1,143 5,426 3,172 3, , ,168 2,971 35,932 85, ,116 16,127 4,793 5,68 5,397 6, , ,533 5, ,998 19,178 28,761 38,17 4,584 1,26 1,25 1, , ,926 7,496 9,189 5,38 15, , ,34 1,16 16,64 15,281 3, ,376 3,51 7,786 1,27 78, ,745 3,592 17,22 13,213 4,872 1, ,835 55,941 21,368 2,82 128, ,217 3,277 26,36 23,349 6,797 1, ,537 25,6 84,988 4,817 21, ,778 5,812 2, ,572 8,576 13,22 55,996 98,526 Total 1,69 8,598 44,127 27, , ,27 78,956 31,625 81, ,419 15,382 67,73 1,49,361 21
22 Difference in Number of Trips 211 MAG Model CTPP Data District Total ,79 1, , ,683 1,345 3, , , ,27 1, , , , ,966 2,957-5,145-1, , , ,2 2, ,961-2, ,768-2, , ,533-1,58-7,542 6, ,287-2, ,72-5, , , ,563-3,57 2, , , , , , , , , , , , ,32-1, ,294-5,514 5,79-1,17 7, , ,737-2,23-3,666-1, ,344 2,779 9,556-2,897 9, ,7 1, ,918 1,49 9,917-1,218 8,735 Total 335-5,323-2,43 22,59 6,429-14,546-7,27-2,818 25,121-8,423 11,751-17,226 7,749 22
23 Things to Consider when Comparing Number of Trips: Differences in population and employment do not directly translate in differences in proportional distribution of commuter trips between trip interchanges. Most of the trips to work in Pinal County are to Maricopa County. Other trip interchanges are not affected by much. Trip rates fluctuate and are different between CTPP period estimates and 211 MAG point estimate. 23


24 D2D Trips MODEL D2D Trips CTPP Total Trips CTPP (211 MAG Model CTPP Trips) / Total CTPP Trips District Total 1.5%.4% -.1%.% -.3%.5%.19%.11% -.1% -.2% -.2%.%.5% 2.1%.18%.9%.25%.4%.3%.8% -.4% -.2% -.4% -.5% -.1%.1% 3.%.3% -.8%.7%.5%.% -.2% -.1%.%.13% -.3%.1%.% 4 -.1% -.21%.4%.2%.2% -.35% -.1% -.3%.6% -.2% -.13% -.3% -.1% 5 -.2% -.5% -.7%.17% -.2% -.4% -.17% -.6%.2% -.12% -.16% -.3% -.2% 6 -.3% -.1% -.7% -.51%.41% -.1% -.29% -.16% -.4% -.27% -.36% -.5% -.3% 7.4%.12% -.1% -.1% -.24%.18%.6%.% -.1% -.7% -.11% -.1%.4% 8.3% -.4% -.2% -.3%.1%.13%.2%.14%.2% -.4% -.3% -.1%.3% 9.% -.6% -.3% -.11%.3% -.11% -.4% -.3%.36% -.4%.% -.6%.% 1 -.1% -.1%.3%.67%.6% -.2% -.8% -.4%.22% -.37%.38% -.7% -.1% % -.13% -.5%.12% -.15% -.25% -.1% -.4%.63%.19%.64% -.19% -.3% 12.% -.5%.1%.11%.8% -.6% -.3% -.3%.46%.1%.67% -.69%.% Total.2% -.36% -.16% 1.48%.43% -.98% -.48% -.19% 1.69% -.57%.79% -1.16%.52% 24
25 Modeled Modeled versus CTTP Commuter Flows 14, 12, 1, y = 1.29x R² = , 6, 4, 2, 2, 4, 6, 8, 1, 12, 14, CTPP %RMSE=27.66 Each data point represents number of trips for a district-to-district trip interchange. 25
26 Distribution of Commuter Trips from District 1 Distribution of Commuter Trips to District Distribution of Commuter Trips from District 2 Distribution of Commuter Trips to District
27 Distribution of Commuter Trips from District Distribution of Commuter Trips to District 3 Distribution of Commuter Trips from District 4 Distribution of Commuter Trips to District
28 .6 Distribution of Commuter Trips from District 5.6 Distribution of Commuter Trips to District Distribution of Commuter Trips from District 6 Distribution of Commuter Trips to District
29 Distribution of Commuter Trips from District 7 Distribution of Commuter Trips to District Distribution of Commuter Trips from District 8 Distribution of Commuter Trips to District
30 Distribution of Commuter Trips from District 9 Distribution of Commuter Trips to District Distribution of Commuter Trips from District 1.5 Distribution of Commuter Trips to District
31 .5 Distribution of Commuter Trips from District 11.5 Distribution of Commuter Trips to District Distribution of Commuter Trips from District 12 Distribution of Commuter Trips to District
32 Takeaways Comparison between models and CTPP travel data is possible despite some apparent differences in population and employment statistics and the way data is produced. Comparison with CTPP data provides valuable insight and can be used as a validation tool for trip distribution purposes, for example. In the scarcity of independent data sets such validations provide a unique additional layer of checking trip distributions on regional level. Careful analysis of modeling and CTPP data should precede comparisons. Districts delineations should provide for sufficient level of aggregation to allow for meaningful comparisons and should be based on network topology, socio-economic and travel characteristics in the region. In large regions proper development of the regional travel demand sub-models and comparisons should ensure relatively close match with aggregated CTPP flows with RMSE below 3% and R 2 exceeding.9. 32
33 Possible Next Steps Analyze possible changes to CTPP products to make annual comparisons more meaningful. Experiment with different district delineations and more detailed districts. Establish an iterative process to delineate districts leading to more homogeneous districts in terms of number of intra-district and inter-district trips. 33

34 Questions? 34
Spatiotemporal Analysis of Commuting Patterns in Southern California Using ACS PUMS, CTPP and LODES
 Spatiotemporal Analysis of Commuting Patterns in Southern California Using ACS PUMS, CTPP and LODES 2017 ACS Data Users Conference May 11-12, 2017 Alexandria, VA Jung Seo, Tom Vo, Frank Wen and Simon Choi
Spatial and Socioeconomic Analysis of Commuting Patterns in Southern California Using LODES, CTPP, and ACS PUMS
 Spatial and Socioeconomic Analysis of Commuting Patterns in Southern California Using LODES, CTPP, and ACS PUMS Census for Transportation Planning Subcommittee meeting TRB 95th Annual Meeting January 11,
Spatiotemporal Analysis of Commuting Patterns: Using ArcGIS and Big Data
 Spatiotemporal Analysis of Commuting Patterns: Using ArcGIS and Big Data 2017 ESRI User Conference July 13, 2017 San Diego, VA Jung Seo, Tom Vo, Frank Wen and Simon Choi Research & Analysis Southern California
2040 MTP and CTP Socioeconomic Data
 SE Data 6-1 24 MTP and CTP Socioeconomic Data Purpose of Socioeconomic Data The socioeconomic data (SE Data) shows the location of the population and employment, median household income and other demographic
CIV3703 Transport Engineering. Module 2 Transport Modelling
 CIV3703 Transport Engineering Module Transport Modelling Objectives Upon successful completion of this module you should be able to: carry out trip generation calculations using linear regression and category
Data Collection. Lecture Notes in Transportation Systems Engineering. Prof. Tom V. Mathew. 1 Overview 1
 Data Collection Lecture Notes in Transportation Systems Engineering Prof. Tom V. Mathew Contents 1 Overview 1 2 Survey design 2 2.1 Information needed................................. 2 2.2 Study area.....................................
HORIZON 2030: Land Use & Transportation November 2005
 PROJECTS Land Use An important component of the Horizon transportation planning process involved reviewing the area s comprehensive land use plans to ensure consistency between them and the longrange transportation
Geospatial Analysis of Job-Housing Mismatch Using ArcGIS and Python
 Geospatial Analysis of Job-Housing Mismatch Using ArcGIS and Python 2016 ESRI User Conference June 29, 2016 San Diego, CA Jung Seo, Frank Wen, Simon Choi and Tom Vo, Research & Analysis Southern California
Typical information required from the data collection can be grouped into four categories, enumerated as below.
 Chapter 6 Data Collection 6.1 Overview The four-stage modeling, an important tool for forecasting future demand and performance of a transportation system, was developed for evaluating large-scale infrastructure
SBCAG Travel Model Upgrade Project 3rd Model TAC Meeting. Jim Lam, Stewart Berry, Srini Sundaram, Caliper Corporation December.
 SBCAG Travel Model Upgrade Project 3rd Model TAC Meeting Jim Lam, Stewart Berry, Srini Sundaram, Caliper Corporation December. 7, 2011 1 Outline Model TAZs Highway and Transit Networks Land Use Database
2014 Certification Review Regional Data & Modeling
 2014 Certification Review Regional Data & Modeling July 22, 2014 Regional Data Census Program Coordination PAG works with and for member agencies to ensure full participation in all Census Bureau programs
Impact of Metropolitan-level Built Environment on Travel Behavior
 Impact of Metropolitan-level Built Environment on Travel Behavior Arefeh Nasri 1 and Lei Zhang 2,* 1. Graduate Research Assistant; 2. Assistant Professor (*Corresponding Author) Department of Civil and
Regional Transit Development Plan Strategic Corridors Analysis. Employment Access and Commuting Patterns Analysis. (Draft)
") Regional Transit Development Plan Strategic Corridors Analysis Employment Access and Commuting Patterns Analysis (Draft) April 2010 Contents 1.0 INTRODUCTION... 4 1.1 Overview and Data Sources... 4 1.2
Regional Transit Development Plan Strategic Corridors Analysis Employment Access and Commuting Patterns Analysis (Draft) April 2010 Contents 1.0 INTRODUCTION... 4 1.1 Overview and Data Sources... 4 1.2
Status Report: Ongoing review of O-D cellular data for the TPB modeled area
 Item #4 Status Report: Ongoing review of O-D cellular data for the TPB modeled area Presentation to the Travel Forecasting Subcommittee September 19, 2014 Ronald Milone, COG/TPB staff National Capital
2015 Grand Forks East Grand Forks TDM
 GRAND FORKS EAST GRAND FORKS 2015 TRAVEL DEMAND MODEL UPDATE DRAFT REPORT To the Grand Forks East Grand Forks MPO October 2017 Diomo Motuba, PhD & Muhammad Asif Khan (PhD Candidate) Advanced Traffic Analysis
Census Transportation Planning Products (CTPP)
") Census Transportation Planning Products (CTPP) Penelope Weinberger CTPP Program Manager - AASHTO September 15, 2010 1 What is the CTPP Program Today? The CTPP is an umbrella program of data products, custom
Census Transportation Planning Products (CTPP) Penelope Weinberger CTPP Program Manager - AASHTO September 15, 2010 1 What is the CTPP Program Today? The CTPP is an umbrella program of data products, custom
URBAN TRANSPORTATION SYSTEM (ASSIGNMENT)
") BRANCH : CIVIL ENGINEERING SEMESTER : 6th Assignment-1 CHAPTER-1 URBANIZATION 1. What is Urbanization? Explain by drawing Urbanization cycle. 2. What is urban agglomeration? 3. Explain Urban Class Groups.
BRANCH : CIVIL ENGINEERING SEMESTER : 6th Assignment-1 CHAPTER-1 URBANIZATION 1. What is Urbanization? Explain by drawing Urbanization cycle. 2. What is urban agglomeration? 3. Explain Urban Class Groups.
Douglas County/Carson City Travel Demand Model
 Douglas County/Carson City Travel Demand Model FINAL REPORT Nevada Department of Transportation Douglas County Prepared by Parsons May 2007 May 2007 CONTENTS 1. INTRODUCTION... 1 2. DEMOGRAPHIC INFORMATION...
Analyzing the Market Share of Commuter Rail Stations using LEHD Data
 Analyzing the Market Share of Commuter Rail Stations using LEHD Data Using Census Data for Transportation Applications Conference, Irvine, CA October 26, 2011 1. What is the size of Metrolink s commute
Figure 8.2a Variation of suburban character, transit access and pedestrian accessibility by TAZ label in the study area
 Figure 8.2a Variation of suburban character, transit access and pedestrian accessibility by TAZ label in the study area Figure 8.2b Variation of suburban character, commercial residential balance and mix
StanCOG Transportation Model Program. General Summary
 StanCOG Transportation Model Program Adopted By the StanCOG Policy Board March 17, 2010 What are Transportation Models? General Summary Transportation Models are technical planning and decision support
Speakers: Jeff Price, Federal Transit Administration Linda Young, Center for Neighborhood Technology Sofia Becker, Center for Neighborhood Technology
 Speakers: Jeff Price, Federal Transit Administration Linda Young, Center for Neighborhood Technology Sofia Becker, Center for Neighborhood Technology Peter Haas, Center for Neighborhood Technology Craig
BROOKINGS May
 Appendix 1. Technical Methodology This study combines detailed data on transit systems, demographics, and employment to determine the accessibility of jobs via transit within and across the country s 100
APPLICATION OF SPATIAL STRATIFICATION FOR SURVEY SAMPLE DESIGN
 APPLICATION OF SPATIAL STRATIFICATION FOR SURVEY SAMPLE DESIGN Petya Maneva, Maricopa Association of Governments Presenter PROJECT TEAM Maricopa Association of Governments: Vladimir Livshits Petya Maneva
STAFF REPORT. MEETING DATE: July 3, 2008 AGENDA ITEM: 7
 STAFF REPORT SUBJECT: Travel Models MEETING DATE: July 3, 2008 AGENDA ITEM: 7 RECOMMENDATION: Receive information on status of travel model development in Santa Barbara County and review factors to achieve
APPENDIX C-6 - TRAFFIC MODELING REPORT, SRF CONSULTING GROUP
 APPENDIX C-6 - TRAFFIC MODELING REPORT, SRF CONSULTING GROUP Scott County 2030 Comprehensive Plan Update Appendix C Scott County Traffic Model Final Report and Documentation March 2008 Prepared for: Scott
Traffic Demand Forecast
 Chapter 5 Traffic Demand Forecast One of the important objectives of traffic demand forecast in a transportation master plan study is to examine the concepts and policies in proposed plans by numerically
APPENDIX IV MODELLING
 APPENDIX IV MODELLING Kingston Transportation Master Plan Final Report, July 2004 Appendix IV: Modelling i TABLE OF CONTENTS Page 1.0 INTRODUCTION... 1 2.0 OBJECTIVE... 1 3.0 URBAN TRANSPORTATION MODELLING
GIS Analysis of Crenshaw/LAX Line
 PDD 631 Geographic Information Systems for Public Policy, Planning & Development GIS Analysis of Crenshaw/LAX Line Biying Zhao 6679361256 Professor Barry Waite and Bonnie Shrewsbury May 12 th, 2015 Introduction
APPENDIX C-3 Equitable Target Areas (ETA) Technical Analysis Methodology
 Technical Analysis Methodology") APPENDIX C-3 Equitable Target Areas (ETA) Technical Analysis Methodology Contents Introduction... 1 ETA Index Methodology... 1 ETA Index Development... 1 Other EJ Measures... 4 The Limited English Proficiency
APPENDIX C-3 Equitable Target Areas (ETA) Technical Analysis Methodology Contents Introduction... 1 ETA Index Methodology... 1 ETA Index Development... 1 Other EJ Measures... 4 The Limited English Proficiency
DCHC MPO. Socioeconomic Data (SE Data) Guide Totals. Purpose. Actions. Use of Guide Totals. Partial Counties and Map. Population Guide Totals
 Guide Totals. Purpose. Actions. Use of Guide Totals. Partial Counties and Map. Population Guide Totals") DCHC MPO Socioeconomic Data (SE Data) Guide Totals Purpose This document presents: Information on how guide totals are used; Population and employment guide totals for counties in the Triangle Regional
DCHC MPO Socioeconomic Data (SE Data) Guide Totals Purpose This document presents: Information on how guide totals are used; Population and employment guide totals for counties in the Triangle Regional
Neighborhood Locations and Amenities
 University of Maryland School of Architecture, Planning and Preservation Fall, 2014 Neighborhood Locations and Amenities Authors: Cole Greene Jacob Johnson Maha Tariq Under the Supervision of: Dr. Chao
A Joint Tour-Based Model of Vehicle Type Choice and Tour Length
 A Joint Tour-Based Model of Vehicle Type Choice and Tour Length Ram M. Pendyala School of Sustainable Engineering & the Built Environment Arizona State University Tempe, AZ Northwestern University, Evanston,
final report A Recommended Approach to Delineating Traffic Analysis Zones in Florida Florida Department of Transportation Systems Planning Office
 A Recommended Approach to Delineating Traffic Analysis Zones in Florida final report prepared for Florida Department of Transportation Systems Planning Office September 27, 2007 final report A Recommended
Texas Transportation Institute The Texas A&M University System College Station, Texas
 1. Report No. FHWA/TX-03/4198-2 4. Title and Subtitle CALIBRATION OF A PAST YEAR TRAVEL DEMAND MODEL FOR MODEL EVALUATION Technical Report Documentation Page 2. Government Accession No. 3. Recipient's
The effects of impact fees on urban form and congestion in Florida
 The effects of impact fees on urban form and congestion in Florida Principal Investigators: Andres G. Blanco Ruth Steiner Presenters: Hyungchul Chung Jeongseob Kim Urban and Regional Planning Contents
Metrolinx Transit Accessibility/Connectivity Toolkit
 Metrolinx Transit Accessibility/Connectivity Toolkit Christopher Livett, MSc Transportation Planning Analyst Research and Planning Analytics Tweet about this presentation #TransitGIS OUTLINE 1. Who is
Travel behavior of low-income residents: Studying two contrasting locations in the city of Chennai, India
 Travel behavior of low-income residents: Studying two contrasting locations in the city of Chennai, India Sumeeta Srinivasan Peter Rogers TRB Annual Meet, Washington D.C. January 2003 Environmental Systems,
Mapping Accessibility Over Time
 Journal of Maps, 2006, 76-87 Mapping Accessibility Over Time AHMED EL-GENEIDY and DAVID LEVINSON University of Minnesota, 500 Pillsbury Drive S.E., Minneapolis, MN 55455, USA; geneidy@umn.edu (Received
Transit Modeling Update. Trip Distribution Review and Recommended Model Development Guidance
 Transit Modeling Update Trip Distribution Review and Recommended Model Development Guidance Contents 1 Introduction... 2 2 FSUTMS Trip Distribution Review... 2 3 Proposed Trip Distribution Approach...
Trip Distribution Modeling Milos N. Mladenovic Assistant Professor Department of Built Environment
 Trip Distribution Modeling Milos N. Mladenovic Assistant Professor Department of Built Environment 25.04.2017 Course Outline Forecasting overview and data management Trip generation modeling Trip distribution
Technical Memorandum #2 Future Conditions
 Technical Memorandum #2 Future Conditions To: Dan Farnsworth Transportation Planner Fargo-Moorhead Metro Council of Governments From: Rick Gunderson, PE Josh Hinds PE, PTOE Houston Engineering, Inc. Subject:
Visualization of Commuter Flow Using CTPP Data and GIS
 Visualization of Commuter Flow Using CTPP Data and GIS Research & Analysis Department Southern California Association of Governments 2015 ESRI User Conference l July 23, 2015 l San Diego, CA Jung Seo,
Trip Generation Model Development for Albany
 Trip Generation Model Development for Albany Hui (Clare) Yu Department for Planning and Infrastructure Email: hui.yu@dpi.wa.gov.au and Peter Lawrence Department for Planning and Infrastructure Email: lawrence.peter@dpi.wa.gov.au
Regional Performance Measures
 G Performance Measures Regional Performance Measures Introduction This appendix highlights the performance of the MTP/SCS for 2035. The performance of the Revenue Constrained network also is compared to
THE FUTURE OF FORECASTING AT METROPOLITAN COUNCIL. CTS Research Conference May 23, 2012
 THE FUTURE OF FORECASTING AT METROPOLITAN COUNCIL CTS Research Conference May 23, 2012 Metropolitan Council forecasts Regional planning agency and MPO for Twin Cities metropolitan area Operates regional
Assessment of Models to Estimate Bus-Stop Level Transit Ridership using Spatial Modeling Methods
 Assessment of Models to Estimate Bus-Stop Level Transit Ridership using Spatial Modeling Methods Assessment of Models to Estimate Bus-Stop Level Transit Ridership using Spatial Modeling Methods Srinivas
Appendixx C Travel Demand Model Development and Forecasting Lubbock Outer Route Study June 2014
 Appendix C Travel Demand Model Development and Forecasting Lubbock Outer Route Study June 2014 CONTENTS List of Figures-... 3 List of Tables... 4 Introduction... 1 Application of the Lubbock Travel Demand
Comparative Analysis of Zonal Systems for Macro-level Crash Modeling: Census Tracts, Traffic Analysis Zones, and Traffic Analysis Districts
 Comparative Analysis of Zonal Systems for Macro-level Crash Modeling: Census Tracts, Traffic Analysis Zones, and Traffic Analysis Districts Qing Cai* Mohamed Abdel-Aty Jaeyoung Lee Naveen Eluru Department
ADDRESSING TITLE VI AND ENVIRONMENTAL JUSTICE IN LONG-RANGE TRANSPORTATION PLANS
 ADDRESSING TITLE VI AND ENVIRONMENTAL JUSTICE IN LONG-RANGE TRANSPORTATION PLANS Activities from the National Capital Region Transportation Planning Board Sergio Ritacco Transportation Planner 2017 Association
Using Tourism-Based Travel Demand Model to Estimate Traffic Volumes on Low-Volume Roads
 International Journal of Traffic and Transportation Engineering 2018, 7(4): 71-77 DOI: 10.5923/j.ijtte.20180704.01 Using Tourism-Based Travel Demand Model to Estimate Traffic Volumes on Low-Volume Roads
AUTOMATED METERED WATER CONSUMPTION ANALYSIS
 AUTOMATED METERED WATER CONSUMPTION ANALYSIS Shane Zhong 1, Nick Turich 1, Patrick Hayde 1 1. Treatment and Network Planning, SA Water, Adelaide, SA, Australia ABSTRACT Water utilities collect and store
3.0 ANALYSIS OF FUTURE TRANSPORTATION NEEDS
 3.0 ANALYSIS OF FUTURE TRANSPORTATION NEEDS In order to better determine future roadway expansion and connectivity needs, future population growth and land development patterns were analyzed as part of
= 5342 words + 5 tables + 2 figures (250 words each) = 7092 words
 = 7092 words") Influence of Neighborhood Types on Trip Distances A Case Study of Central Ohio Gulsah Akar, PhD (Corresponding Author) Assistant Professor City and Regional Planning Knowlton School of Architecture The
Influence of Neighborhood Types on Trip Distances A Case Study of Central Ohio Gulsah Akar, PhD (Corresponding Author) Assistant Professor City and Regional Planning Knowlton School of Architecture The
Population Trends Along the Coastal United States:
 Coastal Trends Report Series Population Trends Along the Coastal United States: 1980-2008 U.S. Department of Commerce National Oceanic and Atmospheric Administration National Ocean Service Assessing the
Expanding the GSATS Model Area into
 Appendix A Expanding the GSATS Model Area into North Carolina Jluy, 2011 Table of Contents LONG-RANGE TRANSPORTATION PLAN UPDATE 1. Introduction... 1 1.1 Background... 1 1.2 Existing Northern Extent of
Case Study: Orange County, California. Overview. Context
 Case Study: Orange County, California Overview The Orange County Transportation Authority (OCTA) provides transit service in a generally automobile-oriented part of southern California. Consequently, OCTA
Environmental Analysis, Chapter 4 Consequences, and Mitigation
 Environmental Analysis, Chapter 4 4.17 Environmental Justice This section summarizes the potential impacts described in Chapter 3, Transportation Impacts and Mitigation, and other sections of Chapter 4,
FHWA Peer Exchange Meeting on Transportation Systems Management during Inclement Weather
 Travel Demand Modeling & Simulation at GBNRTC Matt Grabau Kimberly Smith Mike Davis Why Model? Travel modeling is a tool for transportation planners and policy makers, to observe impacts of a transportation
Visualization of Origin- Destination Commuter Flow Using CTPP Data and ArcGIS
 Visualization of Origin- Destination Commuter Flow Using CTPP Data and ArcGIS Research & Analysis Department Southern California Association of Governments 2015 ESRI User Conference l July 23, 2015 l San
Regional Performance Measures
 G Performance Measures Regional Performance Measures Introduction This appendix highlights the performance of the MTP/SCS for 2035. The performance of the Revenue Constrained network also is compared to
Passenger Transportation Networks & Urbanization Level: A Comparison of Classification Schemes
 Pyrialakou, Nlenanya, Gkritza 0 0 Passenger Transportation Networks & Urbanization Level: A Comparison of Classification Schemes V. Dimitra Pyrialakou (Corresponding author) Graduate Research Assistant,
Changes in the Spatial Distribution of Mobile Source Emissions due to the Interactions between Land-use and Regional Transportation Systems
 Changes in the Spatial Distribution of Mobile Source Emissions due to the Interactions between Land-use and Regional Transportation Systems A Framework for Analysis Urban Transportation Center University
National Household Travel Survey Conference: Understanding Our Nation s Travel
 Transportation Research Board National Household Travel Survey Conference: Understanding Our Nation s Travel Resource Paper Household Travel Survey Data Fusion Issues Mohan Venigalla George Mason University
Secondary Towns and Poverty Reduction: Refocusing the Urbanization Agenda
 Secondary Towns and Poverty Reduction: Refocusing the Urbanization Agenda Luc Christiaensen and Ravi Kanbur World Bank Cornell Conference Washington, DC 18 19May, 2016 losure Authorized Public Disclosure
TRAFFIC ANALYSIS ZONES - HOW DO WE MOVE FORWARD?
 TRAFFIC ANALYSIS ZONES - HOW DO WE MOVE FORWARD? Huimin Zhao (Corresponding author) Independent Consultant hzhao88@gmail.com Yong Zhao Senior Transportation Planner Jacobs Engineering Group 2705 Bee Cave
The Church Demographic Specialists
 The Church Demographic Specialists Easy-to-Use Features Map-driven, Web-based Software An Integrated Suite of Information and Query Tools Providing An Insightful Window into the Communities You Serve Key
Lecture-1: Introduction to Econometrics
 Lecture-1: Introduction to Econometrics 1 Definition Econometrics may be defined as 2 the science in which the tools of economic theory, mathematics and statistical inference is applied to the analysis
Assessing spatial distribution and variability of destinations in inner-city Sydney from travel diary and smartphone location data
 Assessing spatial distribution and variability of destinations in inner-city Sydney from travel diary and smartphone location data Richard B. Ellison 1, Adrian B. Ellison 1 and Stephen P. Greaves 1 1 Institute
Economic and Social Urban Indicators: A Spatial Decision Support System for Chicago Area Transportation Planning
 Economic and Social Urban Indicators: A Spatial Decision Support System for Chicago Area Transportation Planning Piyushimita Thakuriah (Vonu), P.S. Sriraj, Paul Metaxatos, Inshu Minocha & Tanushri Swarup
APPENDIX G Halton Region Transportation Model
 APPENDIX G Halton Region Transportation Model Halton Region Transportation Master Plan Working Paper No. 1 - Legislative Context Working Paper No. 2 - Active Transportation Halton Transportation Model
The Census, Urbanized Areas, and Your MPO/RPO
 The Census, Urbanized Areas, and Your MPO/RPO Alex Bond, AICP NADO Rural Transportation Peer Learning Conference August 25, 2011 1 Issues to Discuss Census background Definitions of Census geographies
MOBILITIES AND LONG TERM LOCATION CHOICES IN BELGIUM MOBLOC
 MOBILITIES AND LONG TERM LOCATION CHOICES IN BELGIUM MOBLOC A. BAHRI, T. EGGERICKX, S. CARPENTIER, S. KLEIN, PH. GERBER X. PAULY, F. WALLE, PH. TOINT, E. CORNELIS SCIENCE FOR A SUSTAINABLE DEVELOPMENT
Understanding Land Use and Walk Behavior in Utah
 Understanding Land Use and Walk Behavior in Utah 15 th TRB National Transportation Planning Applications Conference Callie New GIS Analyst + Planner STUDY AREA STUDY AREA 11 statistical areas (2010 census)
Land Use Modeling at ABAG. Mike Reilly October 3, 2011
 Land Use Modeling at ABAG Mike Reilly michaelr@abag.ca.gov October 3, 2011 Overview What and Why Details Integration Use Visualization Questions What is a Land Use Model? Statistical relationships between
VALIDATING THE RELATIONSHIP BETWEEN URBAN FORM AND TRAVEL BEHAVIOR WITH VEHICLE MILES TRAVELLED. A Thesis RAJANESH KAKUMANI
 VALIDATING THE RELATIONSHIP BETWEEN URBAN FORM AND TRAVEL BEHAVIOR WITH VEHICLE MILES TRAVELLED A Thesis by RAJANESH KAKUMANI Submitted to the Office of Graduate Studies of Texas A&M University in partial
Improving the Model s Sensitivity to Land Use Policies and Nonmotorized Travel
 Improving the Model s Sensitivity to Land Use Policies and Nonmotorized Travel presented to MWCOG/NCRTPB Travel Forecasting Subcommittee presented by John (Jay) Evans, P.E., AICP Cambridge Systematics,
Use of US Census Data for Transportation Modeling and Planning
 Use of US Census Data for Transportation Modeling and Planning Yongqiang Wu, P.E. CTS Engineering, Inc. Southeast Florida FSUTMS User Group Meeting September 14, 2018 Outline Overview of Census Products
FHWA Planning Data Resources: Census Data Planning Products (CTPP) HEPGIS Interactive Mapping Portal
 HEPGIS Interactive Mapping Portal") FHWA Planning Data Resources: Census Data Planning Products (CTPP) HEPGIS Interactive Mapping Portal Jeremy Raw, P.E. FHWA, Office of Planning, Systems Planning and Analysis August 2017 Outline Census
FHWA Planning Data Resources: Census Data Planning Products (CTPP) HEPGIS Interactive Mapping Portal Jeremy Raw, P.E. FHWA, Office of Planning, Systems Planning and Analysis August 2017 Outline Census
November 16, Metropolitan Washington Council of Governments National Capital Region Transportation Planning Board
 Metropolitan Washington Council of Governments National Capital Region Transportation Planning Board Summary of the State of the Practice and State of the Art of Modeling Peak Spreading November 16, 2007
Palmerston North Area Traffic Model
 Palmerston North Area Traffic Model Presentation to IPWEA 7 November 2014 PNATM Presentation Overview Model Scope and type Data collected The model Forecasting inputs Applications PNCC Aims and Objectives
INSIDE. Metric Descriptions by Topic Area. Data Sources and Methodology by Topic Area. Technical Appendix
 As part of the Chicago Neighborhoods 2015 (CN2015) project, the Institute for Housing Studies at DePaul University collected data and built metrics to help The Chicago Community Trust and the City of Chicago
Urban Transportation Planning Prof. Dr.V.Thamizh Arasan Department of Civil Engineering Indian Institute of Technology Madras
 Urban Transportation Planning Prof. Dr.V.Thamizh Arasan Department of Civil Engineering Indian Institute of Technology Madras Module #03 Lecture #12 Trip Generation Analysis Contd. This is lecture 12 on
Develop Trip Generation Model for Alexandria City - Egypt
 Develop Trip Generation Model for Alexandria City - Egypt AHMED ELKAFOURY 1,*, ABDELAZIM M. NEGM 1, MOHAMED H. ALY 2, MAHMOUD F. BADY 3 1 Environmental Engineering Department, Egypt-Japan University of
Development of modal split modeling for Chennai
 IJMTES International Journal of Modern Trends in Engineering and Science ISSN: 8- Development of modal split modeling for Chennai Mr.S.Loganayagan Dr.G.Umadevi (Department of Civil Engineering, Bannari
March 31, diversity. density. 4 D Model Development. submitted to: design. submitted by: destination
 March 31, 2010 diversity density 4 D Model Development submitted to: design submitted by: destination 4 D Model Development Team SANDAG: Mike Calandra Rick Curry Rob Rundle Parsons Brinckerhoff: Bill Davidson
Forecasts from the Strategy Planning Model
 Forecasts from the Strategy Planning Model Appendix A A12.1 As reported in Chapter 4, we used the Greater Manchester Strategy Planning Model (SPM) to test our long-term transport strategy. A12.2 The origins
The I-81 Challenge: Study update and overview of travel demand model CNY Engineering Expo November 12, 2012
 The I-81 Challenge: Study update and overview of travel demand model CNY Engineering Expo November 12, 2012 Presented by: Meghan Vitale, SMTC Jason Deshaies, SMTC Presentation overview Part 1: Overview
Transportation Statistical Data Development Report OKALOOSA-WALTON OUTLOOK 2035 LONG RANGE TRANSPORTATION PLAN
 Transportation Statistical Data Development Report OKALOOSA-WALTON OUTLOOK 2035 LONG RANGE TRANSPORTATION PLAN Prepared for the Okaloosa-Walton Transportation Planning Organization and The Florida Department
TRAVEL DEMAND MODEL. Chapter 6
 Chapter 6 TRAVEL DEMAND MODEL As a component of the Teller County Transportation Plan development, a computerized travel demand model was developed. The model was utilized for development of the Transportation
WOODRUFF ROAD CORRIDOR ORIGIN-DESTINATION ANALYSIS
 2018 WOODRUFF ROAD CORRIDOR ORIGIN-DESTINATION ANALYSIS Introduction Woodruff Road is the main road to and through the commercial area in Greenville, South Carolina. Businesses along the corridor have
REFINEMENT OF FSUTMS TRIP DISTRIBUTION METHODOLOGY
 REFINEMENT OF FSUTMS TRIP DISTRIBUTION METHODOLOGY Percentage of Trips (%) 10.00 9.00 8.00 7.00 6.00 5.00 4.00 3.00 2.00 1.00 Survey Destination Choice Model with Spatial Variables Destination Choice Model
Estimation of Travel demand from the city commuter region of Muvattupuzha municipal area Mini.M.I 1 Dr.Soosan George.T 2 Rema Devi.M.
 Estimation of Travel demand from the city commuter region of Muvattupuzha municipal area Mini.M.I 1 Dr.Soosan George.T 2 Rema Devi.M. 3 Professor, Department of Civil Engg., M.A.College of Engg, Kothamangalam,
Lee County, Florida 2015 Forecast Report Population, Housing and Commercial Demand
 Lee County, Florida 2015 Forecast Report Population, Housing and Commercial Demand Thank you for purchasing this report, which contains forecasts of population growth, housing demand and demand for commercial
Appendix B. Land Use and Traffic Modeling Documentation
 Appendix B Land Use and Traffic Modeling Documentation Technical Memorandum Planning Level Traffic for Northridge Sub-Area Study Office of Statewide Planning and Research Modeling & Forecasting Section
Sensitivity of estimates of travel distance and travel time to street network data quality
 Sensitivity of estimates of travel distance and travel time to street network data quality Paul Zandbergen Department of Geography University of New Mexico Outline Street network quality Approaches to
Identifying Inaccessible Areas with Potential to Enhance Transit Market
 Identifying Inaccessible Areas with Potential to Enhance Transit Market Srinivas S. Pulugurtha, Venkata Ramana Duddu, Rakesh Mora The University of North Carolina at Charlotte Abstract The focus of this
DEVELOPING DECISION SUPPORT TOOLS FOR THE IMPLEMENTATION OF BICYCLE AND PEDESTRIAN SAFETY STRATEGIES
 DEVELOPING DECISION SUPPORT TOOLS FOR THE IMPLEMENTATION OF BICYCLE AND PEDESTRIAN SAFETY STRATEGIES Deo Chimba, PhD., P.E., PTOE Associate Professor Civil Engineering Department Tennessee State University
Tourist Season. presented by Thomas Hill, Florida Department of Transportation. October 19, 2017
 Tourist Season presented by Thomas Hill, Florida Department of Transportation October 19, 2017 Outline Introduction Tourist Component to the FLSWM Data Collection and Verification Process Next Steps Project
A Comprehensive Method for Identifying Optimal Areas for Supermarket Development. TRF Policy Solutions April 28, 2011
 A Comprehensive Method for Identifying Optimal Areas for Supermarket Development TRF Policy Solutions April 28, 2011 Profile of TRF The Reinvestment Fund builds wealth and opportunity for lowwealth communities