Use of US Census Data for Transportation Modeling and Planning
|
|
|
- Ella Quinn
- 5 years ago
- Views:
Transcription
1 Use of US Census Data for Transportation Modeling and Planning Yongqiang Wu, P.E. CTS Engineering, Inc. Southeast Florida FSUTMS User Group Meeting September 14, 2018
2 Outline Overview of Census Products Examples of Applying Census Data for Modeling/Planning Census Transportation Planning Product (CTPP) from American Community Survey (ACS) Longitudinal Employer-Household Dynamics (LEHD) New Developments for Census Data Update on South Florida Residence Job Linkage (SFRJL) Tool 2
3 Census Data and Modeling/Planning Census data used in all aspects of modeling and planning Socioeconomic input data Cross classification trip generation model Trip distribution model Mode Choice model Auto availability model Destination choice model Performance measurements Transit market analysis 3
 Longitudinal Employer Household Dynamics (LEHD) Data Micro Data Public Use Micro Samples")
4 Census Products Sources of Data Decennial Census The American Community Survey (ACS) National Household Travel Survey (NHTS) Summary Data Census Transportation Planning Products (CTPP) Longitudinal Employer Household Dynamics (LEHD) Data Micro Data Public Use Micro Samples (PUMS) 4
 1969, 1977, 1983, 1990, 1995 National")

5 NPTS/NHTS Historical Background Started in 1969 Eight (8) Surveys Nationwide Personal Transportation Survey (NPTS) 1969, 1977, 1983, 1990, 1995 National Household Travel Survey (NHTS) 2001, 2009, 2017 The core data in the NPTS/NHTS series: Information collected about all trips made by household members over a 24-hour period 5
6 Comparison of HPTS/NHTS Surveys ( Survey year Sample size Sample selection Interview method(s) Travel day data Response rate Add-Ons 1969 NPTS 15, NPTS 18, NPTS 6, NPTS 1995 NPTS 2001 NHTS 2009 NHTS 2017 NHTS 6 22,317 (18,000 national and 4,300 add-ons) 42,031 (21,000 national and 21,031 add-ons) 26,038 national and approx. 40,000 add-ons 150,147 (25,510 national and 124,637 add-ons) 129,696 (26,099 national and 103,597 add-ons) 235 primary sampling units outgoing panels of Census Quarterly Housing Survey 376 primary sampling units outgoing panels of Census Current Population Survey 376 primary sampling units outgoing panels of Census Current Population Survey - RDD sample - Stratified by 34 geographic units - RDD Sample - Stratified by 70 geographic units in-home interviews with some telephone follow-up in-home interviews with some telephone follow up in-home interviews with some telephone follow-up from memory Not available none from memory 85.30% none from memory 94.00% none telephone interviews from memory 73.10% New York, Connecticut, Indianapolis MPO telephone interviews Travel Diary 37.20% RDD sample telephone interviews Travel Diary 41.00% RDD Sample telephone interviews Travel Diary 19.80% Random sample of residential addresses selected from the US Postal Service formed an Address Based Sample (ABS) Mail-back (recruit survey), Web and telephone for both recruit and retrieval surveys Travel Log 15.60% New York. Massachusetts, Oklahoma City, OK, Tulsa, OK Baltimore MPO, Des Moines MPO, Hawaii, Kentucky (4 counties), Lancaster, PA MPO, New York, Oahu (Honolulu MPO), Texas, Wisconsin California, Cedar Rapids, IA, Florida, Georgia, Iowa, Indiana, North Carolina, New York, Omaha, NE, Phoenix, AZ, Piedmont, NC, South Carolina, South Dakota, Tennessee, Texas, Tucson, AZ, Virginia, Chittenden County, VT, Vermont, Wisconsin Arizona, California, Dallas-Fort Worth, TX, Des Moines, IA, Georgia, Maryland, North Carolina, New York, South Carolina, Tulsa, OK, Texas, Waterloo, IA, Wisconsin Source: 2017 NHTS Data User Guide, Westat
7 Census Transportation Planning Package (CTPP) The CTPP is a set of special tabulations From 1970 to 2000, the CTPP /Urban Transportation Planning Package (UTPP), was based decennial census long form The decennial census long form has now been replaced with a continuous survey called the American Community Survey (ACS) Include three-parts: Part 1: Residence-based tabulations summarizing worker and household characteristics Part 2: Workplace-based tabulations summarizing worker characteristics Part 3: Worker flows between home and work, including travel mode 7

8 ACS/CTPP Data Release Frequencies 3-year average at county level with population > 20,000 5-year average at TAZ level with more variables More variables available Current: year Large amount of Information Means of Transportation Age Groups Industry Sectors Race Time left for work Travel time to work 8
9 Miami-Dade County Work Flows Residents (1,082,360) Workers (1,145,501) Palm Beach Palm Beach 4,230 (0.4%) 8,225 (0.7%) Broward 71,750 (6.6%) Broward 127,220 (11.1%) 6,355 (0.6%) 12,471(1.1%) Monroe Monroe 996,435 (92.1%) 996,435 (87.0%) 3,590 (0.3%) 1,150 (0.1%) Miami-Dade Miami-Dade 9 Source: ACS/CTPP Journey-to-Work Flow Data
")
10 ACS/CTPP Online Tool ( Year CTPP) 10
11 ACS/CTPP Online Tool Available Information 11
12 CTPP Usage Ridership Forecasting with STOPS Model Initially using 2000 CTPP, now ACS/CTPP Large sample data Available for all areas and no new data collection is needed Represents true O-D travel patterns for automobile, transit, and nonmotorized travel Used as direct input for the model Home-based-work: 50% of transit market (CTPP) Home-based-other: 40% of transit market (derived by scaling factors) Non-home-based: 10% of transit market (derived by scaling factors) Used with local on-board survey data 12
13 Year CTPP Data To be released in March 2019 Will have the same structure: Residence, Workplace, and JTW Will no longer include data at TAZ or TAD level Instead, data will be tabulated at Census Block Group level In conjunction with 2020 Decennial Survey Review the relationship between model TAZ and Census geography (block, block groups, or tracts) Familiarize with the Participant Statistical Areas Program (PSAP) Agency review and modify select statistical boundaries Use free software Geographic Update Partnership Software (GUPS) Joint efforts between Census Bureau and local agencies 13
14 Longitudinal Employer-Household Dynamics A Program Conducted by the US Census Bureau Combines Three Major Data Sources State Unemployment Insurance (UI) earnings data Individual wages and employment Federal Census Administrative Records Demographic Information (age, gender, and place of residence) Joint State and Bureau of Labor Statistics ES 202/ Quarterly Census of Employment and Wages (QCEW) Information on employers (e.g., industry, employment, revenues) Creates a Longitudinal (Annual) Linked Employer-Employee Dataset 14
15 LEHD Origin-Destination Employment Statistics (LODES) Data Residence Place Workplace Total Number of Jobs Number of Jobs by Age Groups 29 or younger; 30-54; 55 or older Number of Jobs by Monthly Earning Groups $1250 or less; $1250 to $3333; $3333 or more Number of Jobs by Industry Sectors Goods producing; Trade/Transportation/utilities; Other Services Available at Census Block Level from 2002 to

16 OnTheMap Online Tool 16
17 Comparison of CTPP, LEHD, and NHTS Data Data Type CTPP (ACS) LODES (LEHD) NHTS Data Source American Community Survey (ACS) Administrative records. Household Surveys Sample Size year estimates (approximately 10% of U.S. HHs). Administrative records from 50 states via UI program and Office of Personnel NHTS surveyed roughly 129,696 households Data Coverage Entire US Participating States (most) Representative Simple from US Update Frequency 5-year data appr. every 5 years. Annually from 2012 to 2015 Every 5-8 years Workplace Information Include 115 workplace-based tables for over 200,000 geographies. Standard tables include workplace location, commute mode, departure time from home, arrival time to work, travel time (minutes), sex, age, race, ethnicity, language spoken, earnings, poverty status, occupation, industry, class of worker, hours worked each week, weeks worked in the past 12 months, earnings, number of vehicles available, household size, number of workers. Provides workplace characteristics (i.e., firm size, firm age, NAICS industry sector, work location) and worker characteristics (i.e., primary, secondary job, earnings, education, age, gender, ethnicity, house location). The dataset does not include travel mode or travel time information. Provides detailed location information of origin and destination address. The main data files includes characteristics for each household, person, worker, vehicle, and daily travel data. For each worker, NHTS provides information on full/part-time, number of jobs, job types, workplace location, usual mode, distance, and arrival time to work, mode of transportation, and flexibility in work arrival time. Smallest geographic unit TAZs Census blocks Latitude and longitude of trip ends Who is included in the survey? Collects employment characteristics from workers of 16 years and over including telework and noninstitutional group quarters (i.e., college dormitories and military barracks). Does not capture secondary job and excludes workers living in group quarters such as prisoners and nursing homes. Includes all ages of workers. It includes all jobs under state UI law, which is 95% of private sector wage and salary employment. Also, it covers most of civilian federal employment using records from the Office of Personnel. Does not cover selfemployment, military, the U.S. Postal Service, and informal employment. Includes US population 5 years and older. Source: Transportation Research Circular E
 5-year PUMS (e.g.: 2012-2016 5-year PUMS) 18")
18 ACS PUMS Data Public Use Microdata Sample Individual Reponses (raw data) At PUMA (100K+ Population) level only Why PUMS Data Not available from standard tables More sophisticated statistical analysis Create new measures Availability 2 PUMS files every year 1-year PUMS (e.g.: year PUMS) 5-year PUMS (e.g.: year PUMS) 18
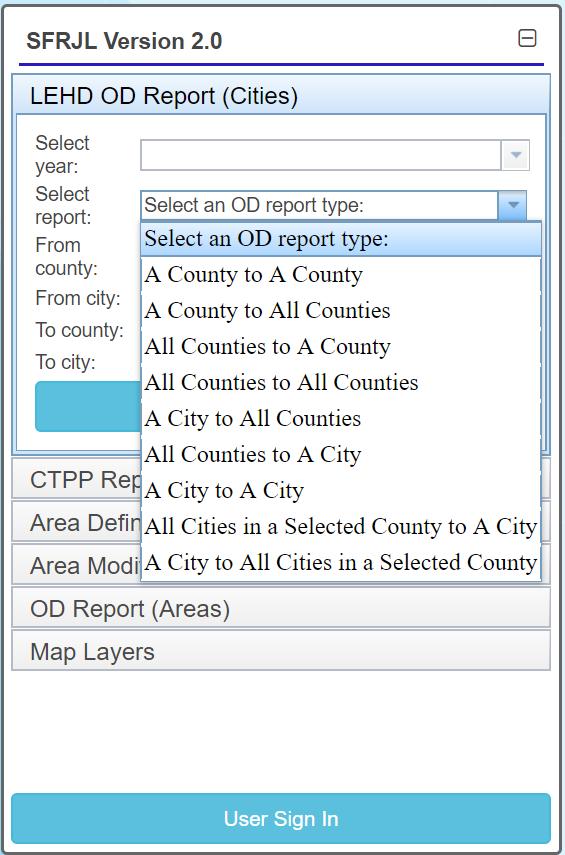
19 The South Florida Residence Job Linkage (SFRJL) Tool Make LEHD/CTPP Simple and Easy-to-Use Focus on Cities/Census Designated Places (CDP) in Seven South Florida Counties Indian River, St. Lucie, Martin (TCRPM Model Area) Palm Beach, Broward, Miami-Dade (SERPM Area) Monroe Included five (5) Urbanized Areas (UA) in Florida Tampa, Orlando, Jacksonville, Tallahassee, Pensacola Display Data in Tabular and Graphic Format Export Reports in Different Formats 19

20 SFRJL Tool ( ) 20

21 SFRJL Accordion Menu and User Login Interface Accordion Interface User Login Interface 21
22 SFRJL Including LEHD and ACS/CTPP Data 22

23 SFRJL Predefined Report at County/City/CDP Levels 23

24 SFRJL User Defined Areas 24

25 SFRJL Report (From Weston to Miami 2015 LEHD) 25
26 SFRJL Report (From Weston to Miami MOT CTPP) 26
 27")
27 SFRJL Report (From Weston to Miami Time Left for Work) 27

28 Questions and Comments 28
The CTPP Workplace Data for Transportation Planning: A Systematic Review
 The CP Workplace Data for Transportation Planning: A Systematic Review Commissioned Paper for: 2017 Applying Census Data for Transportation Conference September 29 th, 2017 Jung H. Seo a, Tom Vo a, Shinhee
FHWA Planning Data Resources: Census Data Planning Products (CTPP) HEPGIS Interactive Mapping Portal
 HEPGIS Interactive Mapping Portal") FHWA Planning Data Resources: Census Data Planning Products (CTPP) HEPGIS Interactive Mapping Portal Jeremy Raw, P.E. FHWA, Office of Planning, Systems Planning and Analysis August 2017 Outline Census
FHWA Planning Data Resources: Census Data Planning Products (CTPP) HEPGIS Interactive Mapping Portal Jeremy Raw, P.E. FHWA, Office of Planning, Systems Planning and Analysis August 2017 Outline Census
Geospatial Analysis of Job-Housing Mismatch Using ArcGIS and Python
 Geospatial Analysis of Job-Housing Mismatch Using ArcGIS and Python 2016 ESRI User Conference June 29, 2016 San Diego, CA Jung Seo, Frank Wen, Simon Choi and Tom Vo, Research & Analysis Southern California
Census Transportation Planning Products (CTPP)
") Census Transportation Planning Products (CTPP) Penelope Weinberger CTPP Program Manager - AASHTO September 15, 2010 1 What is the CTPP Program Today? The CTPP is an umbrella program of data products, custom
Census Transportation Planning Products (CTPP) Penelope Weinberger CTPP Program Manager - AASHTO September 15, 2010 1 What is the CTPP Program Today? The CTPP is an umbrella program of data products, custom
Spatiotemporal Analysis of Commuting Patterns in Southern California Using ACS PUMS, CTPP and LODES
 Spatiotemporal Analysis of Commuting Patterns in Southern California Using ACS PUMS, CTPP and LODES 2017 ACS Data Users Conference May 11-12, 2017 Alexandria, VA Jung Seo, Tom Vo, Frank Wen and Simon Choi
Spatial and Socioeconomic Analysis of Commuting Patterns in Southern California Using LODES, CTPP, and ACS PUMS
 Spatial and Socioeconomic Analysis of Commuting Patterns in Southern California Using LODES, CTPP, and ACS PUMS Census for Transportation Planning Subcommittee meeting TRB 95th Annual Meeting January 11,
A User s Guide to the Federal Statistical Research Data Centers
 A User s Guide to the Federal Statistical Research Data Centers Mark Roberts Professor of Economics and Director PSU FSRDC September 2016 M. Roberts () RDC User s Guide September 2016 1 / 14 Outline Introduction
Spatiotemporal Analysis of Commuting Patterns: Using ArcGIS and Big Data
 Spatiotemporal Analysis of Commuting Patterns: Using ArcGIS and Big Data 2017 ESRI User Conference July 13, 2017 San Diego, VA Jung Seo, Tom Vo, Frank Wen and Simon Choi Research & Analysis Southern California
Visualization of Commuter Flow Using CTPP Data and GIS
 Visualization of Commuter Flow Using CTPP Data and GIS Research & Analysis Department Southern California Association of Governments 2015 ESRI User Conference l July 23, 2015 l San Diego, CA Jung Seo,
Using American Factfinder
 Using American Factfinder What is American Factfinder? American Factfinder is a search engine that provides access to the population, housing and economic data collected by the U.S. Census Bureau. It can
OnTheMap for Emergency Management
 OnTheMap for Emergency Management Robert Pitts Geographer/Project Manager Longitudinal Employer Household Dynamics (LEHD) Center for Economic Studies U.S. Census Bureau Jody Hoon-Star Geographer/Application
HORIZON 2030: Land Use & Transportation November 2005
 PROJECTS Land Use An important component of the Horizon transportation planning process involved reviewing the area s comprehensive land use plans to ensure consistency between them and the longrange transportation
The Church Demographic Specialists
 The Church Demographic Specialists Easy-to-Use Features Map-driven, Web-based Software An Integrated Suite of Information and Query Tools Providing An Insightful Window into the Communities You Serve Key
Activity-Based Models and ACS Data: What are the implications for use? D.A. Niemeier
 Activity-Based Models and ACS Data: What are the implications for use? D.A. Niemeier Introduction The Census is transitioning to the American Community Survey (ACS) for replacement of the decennial census
Spatial Organization of Data and Data Extraction from Maptitude
 Spatial Organization of Data and Data Extraction from Maptitude N. P. Taliceo Geospatial Information Sciences The University of Texas at Dallas UT Dallas GIS Workshop Richardson, TX March 30 31, 2018 1/
Simplified Trips-on-Project Software (STOPS): Strategies for Successful Application
: Strategies for Successful Application") Simplified Trips-on-Project Software (STOPS): Strategies for Successful Application presented to Transit Committee Florida Model Task Force presented by Cambridge Systematics, Inc. John (Jay) Evans, AICP
Simplified Trips-on-Project Software (STOPS): Strategies for Successful Application presented to Transit Committee Florida Model Task Force presented by Cambridge Systematics, Inc. John (Jay) Evans, AICP
2040 MTP and CTP Socioeconomic Data
 SE Data 6-1 24 MTP and CTP Socioeconomic Data Purpose of Socioeconomic Data The socioeconomic data (SE Data) shows the location of the population and employment, median household income and other demographic
Public Transit in America: Analysis of Access Using the 2001 National Household Travel Survey
 Public Transit in America: Analysis of Access Using the 2001 National Household Travel Survey Center for Urban Transportation Research University of South Florida, Tampa February 2007 BD 549-30 Public
GIS Lecture 5: Spatial Data
 GIS Lecture 5: Spatial Data GIS 1 Outline Vector Data Formats Raster Data Formats Map Projections Coordinate Systems US Census geographic files US Census data files GIS Data Sources GIS 2 Vector Data Formats
THE FUTURE OF FORECASTING AT METROPOLITAN COUNCIL. CTS Research Conference May 23, 2012
 THE FUTURE OF FORECASTING AT METROPOLITAN COUNCIL CTS Research Conference May 23, 2012 Metropolitan Council forecasts Regional planning agency and MPO for Twin Cities metropolitan area Operates regional
Intercity Bus Stop Analysis
 by Karalyn Clouser, Research Associate and David Kack, Director of the Small Urban and Rural Livability Center Western Transportation Institute College of Engineering Montana State University Report prepared
Demographic Data in ArcGIS. Harry J. Moore IV
 Demographic Data in ArcGIS Harry J. Moore IV Outline What is demographic data? Esri Demographic data - Real world examples with GIS - Redistricting - Emergency Preparedness - Economic Development Next
final report A Recommended Approach to Delineating Traffic Analysis Zones in Florida Florida Department of Transportation Systems Planning Office
 A Recommended Approach to Delineating Traffic Analysis Zones in Florida final report prepared for Florida Department of Transportation Systems Planning Office September 27, 2007 final report A Recommended
BROOKINGS May
 Appendix 1. Technical Methodology This study combines detailed data on transit systems, demographics, and employment to determine the accessibility of jobs via transit within and across the country s 100
TRAFFIC ANALYSIS ZONES - HOW DO WE MOVE FORWARD?
 TRAFFIC ANALYSIS ZONES - HOW DO WE MOVE FORWARD? Huimin Zhao (Corresponding author) Independent Consultant hzhao88@gmail.com Yong Zhao Senior Transportation Planner Jacobs Engineering Group 2705 Bee Cave
Can Public Transport Infrastructure Relieve Spatial Mismatch?
 Can Public Transport Infrastructure Relieve Spatial Mismatch? Evidence from Recent Light Rail Extensions Kilian Heilmann University of California San Diego April 20, 2015 Motivation Paradox: Even though
National Household Travel Survey Conference: Understanding Our Nation s Travel
 Transportation Research Board National Household Travel Survey Conference: Understanding Our Nation s Travel Resource Paper Household Travel Survey Data Fusion Issues Mohan Venigalla George Mason University
Understanding China Census Data with GIS By Shuming Bao and Susan Haynie China Data Center, University of Michigan
 Understanding China Census Data with GIS By Shuming Bao and Susan Haynie China Data Center, University of Michigan The Census data for China provides comprehensive demographic and business information
SUPPLEMENTAL NUTRITION ASSISTANCE PROGRAM QUALITY CONTROL ANNUAL REPORT FISCAL YEAR 2008
 SUPPLEMENTAL NUTRITION ASSISTANCE PROGRAM QUALITY CONTROL ANNUAL REPORT FISCAL YEAR 2008 U.S. DEPARTMENT OF AGRICULTURE FOOD AND NUTRITION SERVICE PROGRAM ACCOUNTABILITY AND ADMINISTRATION DIVISION QUALITY
Economic Analysis of Public Transportation in Reno, Nevada
 A Tier 1 university transportation center led by the University of Nevada, Reno. Final Report August 2017 Economic Analysis of Public Transportation in Reno, Nevada SOLARIS Consortium, Tier 1 University
Speakers: Jeff Price, Federal Transit Administration Linda Young, Center for Neighborhood Technology Sofia Becker, Center for Neighborhood Technology
 Speakers: Jeff Price, Federal Transit Administration Linda Young, Center for Neighborhood Technology Sofia Becker, Center for Neighborhood Technology Peter Haas, Center for Neighborhood Technology Craig
INSIDE. Metric Descriptions by Topic Area. Data Sources and Methodology by Topic Area. Technical Appendix
 As part of the Chicago Neighborhoods 2015 (CN2015) project, the Institute for Housing Studies at DePaul University collected data and built metrics to help The Chicago Community Trust and the City of Chicago
What are we like? Population characteristics from UK censuses. Justin Hayes & Richard Wiseman UK Data Service Census Support
 What are we like? Population characteristics from UK censuses Justin Hayes & Richard Wiseman UK Data Service Census Support Who are we? Richard Wiseman UK Data Service / Jisc Justin Hayes UK Data Service
Visualization of Origin- Destination Commuter Flow Using CTPP Data and ArcGIS
 Visualization of Origin- Destination Commuter Flow Using CTPP Data and ArcGIS Research & Analysis Department Southern California Association of Governments 2015 ESRI User Conference l July 23, 2015 l San
Down East RPO. Strategic Prioritization Office of Transportation Local Input Point Assignment Methodology. Introduction
 Down East RPO Introduction Strategic Prioritization Office of Transportation Local Input Point Assignment Methodology The Down East Rural Planning Organization (DERPO) is required by state law to develop
Bureau of Economic and Business Research May 29, Measuring Population Density for Counties in Florida
 Bureau of Economic and Business Research May 29, 2015 Measuring Population Density for Counties in Florida By: Stefan Rayer, PhD; Ying Wang, PhD https://www.bebr.ufl.edu/content/measuring-population-density-counties-florida
Hourly Precipitation Data Documentation (text and csv version) February 2016
 February 2016") I. Description Hourly Precipitation Data Documentation (text and csv version) February 2016 Hourly Precipitation Data (labeled Precipitation Hourly in Climate Data Online system) is a database that gives
I. Description Hourly Precipitation Data Documentation (text and csv version) February 2016 Hourly Precipitation Data (labeled Precipitation Hourly in Climate Data Online system) is a database that gives
Access to public transportation: An exploration of the National Household Travel Survey appended data
 University of South Florida Scholar Commons Graduate Theses and Dissertations Graduate School 2006 Access to public transportation: An exploration of the National Household Travel Survey appended data
Developing and Validating Regional Travel Forecasting Models with CTPP Data: MAG Experience
 CTPP Webinar and Discussion Thursday, July 17, 1-3pm EDT Developing and Validating Regional Travel Forecasting Models with CTPP Data: MAG Experience Kyunghwi Jeon, MAG Petya Maneva, MAG Vladimir Livshits,
Economic and Social Urban Indicators: A Spatial Decision Support System for Chicago Area Transportation Planning
 Economic and Social Urban Indicators: A Spatial Decision Support System for Chicago Area Transportation Planning Piyushimita Thakuriah (Vonu), P.S. Sriraj, Paul Metaxatos, Inshu Minocha & Tanushri Swarup
Impact of Metropolitan-level Built Environment on Travel Behavior
 Impact of Metropolitan-level Built Environment on Travel Behavior Arefeh Nasri 1 and Lei Zhang 2,* 1. Graduate Research Assistant; 2. Assistant Professor (*Corresponding Author) Department of Civil and
What Lies Beneath: A Sub- National Look at Okun s Law for the United States.
 What Lies Beneath: A Sub- National Look at Okun s Law for the United States. Nathalie Gonzalez Prieto International Monetary Fund Global Labor Markets Workshop Paris, September 1-2, 2016 What the paper
Transit Modeling Update. Trip Distribution Review and Recommended Model Development Guidance
 Transit Modeling Update Trip Distribution Review and Recommended Model Development Guidance Contents 1 Introduction... 2 2 FSUTMS Trip Distribution Review... 2 3 Proposed Trip Distribution Approach...
2005 Mortgage Broker Regulation Matrix
 2005 Mortgage Broker Regulation Matrix Notes on individual states follow the table REG EXEMPTIONS LIC-EDU LIC-EXP LIC-EXAM LIC-CONT-EDU NET WORTH BOND MAN-LIC MAN-EDU MAN-EXP MAN-EXAM Alabama 1 0 2 0 0
Transferability of Household Travel Data Across Geographic Areas Using NHTS 2001
 Transferability of Household Travel Data Across Geographic Areas Using NHTS 2001 Jane Lin PhD Assistant Professor Department of Civil and Materials Engineering Institute for Environmental Science and Policy
Regional Performance Measures
 G Performance Measures Regional Performance Measures Introduction This appendix highlights the performance of the MTP/SCS for 2035. The performance of the Revenue Constrained network also is compared to
Trip Generation Model Development for Albany
 Trip Generation Model Development for Albany Hui (Clare) Yu Department for Planning and Infrastructure Email: hui.yu@dpi.wa.gov.au and Peter Lawrence Department for Planning and Infrastructure Email: lawrence.peter@dpi.wa.gov.au
Transit as Solution for Spatial Mismatch
 Transit as Solution for Spatial Mismatch Tianran Zeng Georgia Institute of Technology Abstract From the late 1980s, as the trend of suburbanization and welfare reform draw researchers and policymaker s
MINERALS THROUGH GEOGRAPHY
 MINERALS THROUGH GEOGRAPHY INTRODUCTION Minerals are related to rock type, not political definition of place. So, the minerals are to be found in a variety of locations that doesn t depend on population
2014 Certification Review Regional Data & Modeling
 2014 Certification Review Regional Data & Modeling July 22, 2014 Regional Data Census Program Coordination PAG works with and for member agencies to ensure full participation in all Census Bureau programs
Status Report: Ongoing review of O-D cellular data for the TPB modeled area
 Item #4 Status Report: Ongoing review of O-D cellular data for the TPB modeled area Presentation to the Travel Forecasting Subcommittee September 19, 2014 Ronald Milone, COG/TPB staff National Capital
Census Urban Area Comparisons, 2000 to 2010
 THE HONORABLE ROGERS Mayor ANDERSON, Karl Dean, CHAIRMAN Chairman Census Urban Area Comparisons, 2000 to 2010 TCC May 2, 2012 MPOs/RPOs in Tennessee Regional Geographies in Middle TN Nashville MPO Clarksville
Using the ACS to track the economic performance of U.S. inner cities
 Using the ACS to track the economic performance of U.S. inner cities 2017 ACS Data Users Conference May 11, 2017 Austin Nijhuis, Senior Research Analyst Initiative for a Competitive Inner (ICIC) ICIC ICIC
2010 Census Data Release and Current Geographic Programs. Michaellyn Garcia Geographer Seattle Regional Census Center
 2010 Census Data Release and Current Geographic Programs Michaellyn Garcia Geographer Seattle Regional Census Center 2010 Center of Population Located approximately 2.7 miles northeast of Plato, Missouri
Urban Revival in America
 Urban Revival in America Victor Couture 1 Jessie Handbury 2 1 University of California, Berkeley 2 University of Pennsylvania and NBER May 2016 1 / 23 Objectives 1. Document the recent revival of America
Administrative Data Research Facility Linked HMDA and ACS Database
 University of Pennsylvania ScholarlyCommons 2017 ADRF Network Research Conference Presentations ADRF Network Research Conference Presentations 11-2017 Administrative Data Research Facility Linked HMDA
ACS Multiyear PUMS Estimates and Usage: User-Created PUMS Files. Nate Ramsey U.S. Department of Education
 ACS Multiyear PUMS Estimates and Usage: User-Created PUMS Files Nate Ramsey U.S. Department of Education Research Questions 1. How accurate are concatenated single-year PUMS file estimates? 2. How often
Using Geospatial Methods with Other Health and Environmental Data to Identify Populations
 Using Geospatial Methods with Other Health and Environmental Data to Identify Populations Ellen K. Cromley, PhD Consultant, Health Geographer ellen.cromley@gmail.com Purpose and Outline To illustrate the
Travel behavior of low-income residents: Studying two contrasting locations in the city of Chennai, India
 Travel behavior of low-income residents: Studying two contrasting locations in the city of Chennai, India Sumeeta Srinivasan Peter Rogers TRB Annual Meet, Washington D.C. January 2003 Environmental Systems,
Life, Physical, and Social Science Occupations in Allegheny County
 Life, Physical, and Social Science Occupations in Allegheny County 2015-2025 1 Life, Physical, and Social Science Occupations Regions Code Description 42003 Allegheny County, PA Timeframe 2015-2025 Datarun
New Educators Campaign Weekly Report
 Campaign Weekly Report Conversations and 9/24/2017 Leader Forms Emails Collected Text Opt-ins Digital Journey 14,661 5,289 4,458 7,124 317 13,699 1,871 2,124 Pro 13,924 5,175 4,345 6,726 294 13,086 1,767
Abortion Facilities Target College Students
 Target College Students By Kristan Hawkins Executive Director, Students for Life America Ashleigh Weaver Researcher Abstract In the Fall 2011, Life Dynamics released a study entitled, Racial Targeting
Summary of Natural Hazard Statistics for 2008 in the United States
 Summary of Natural Hazard Statistics for 2008 in the United States This National Weather Service (NWS) report summarizes fatalities, injuries and damages caused by severe weather in 2008. The NWS Office
The econ Planning Suite: CPD Maps and the Con Plan in IDIS for Consortia Grantees Session 1
 The econ Planning Suite: CPD Maps and the Con Plan in IDIS for Consortia Grantees Session 1 1 Training Objectives Use CPD Maps to analyze, assess, and compare levels of need in your community Use IDIS
Population Trends Along the Coastal United States:
 Coastal Trends Report Series Population Trends Along the Coastal United States: 1980-2008 U.S. Department of Commerce National Oceanic and Atmospheric Administration National Ocean Service Assessing the
GROWING APART: THE CHANGING FIRM-SIZE WAGE PREMIUM AND ITS INEQUALITY CONSEQUENCES ONLINE APPENDIX
 GROWING APART: THE CHANGING FIRM-SIZE WAGE PREMIUM AND ITS INEQUALITY CONSEQUENCES ONLINE APPENDIX The following document is the online appendix for the paper, Growing Apart: The Changing Firm-Size Wage
Regional Performance Measures
 G Performance Measures Regional Performance Measures Introduction This appendix highlights the performance of the MTP/SCS for 2035. The performance of the Revenue Constrained network also is compared to
Massachusetts Institute of Technology Department of Urban Studies and Planning
 Massachusetts Institute of Technology Department of Urban Studies and Planning 11.204: Planning, Communications & Digital Media Fall 2002 Lecture 6: Tools for Transforming Data to Action Lorlene Hoyt October
Chapter. Organizing and Summarizing Data. Copyright 2013, 2010 and 2007 Pearson Education, Inc.
 Chapter 2 Organizing and Summarizing Data Section 2.1 Organizing Qualitative Data Objectives 1. Organize Qualitative Data in Tables 2. Construct Bar Graphs 3. Construct Pie Charts When data is collected
Orien Ori t en a t tion a Webi W nar: ebi CPD Maps 2
 Orientation Webinar: CPD Maps 2 Agenda 1. Background - econ Planning Suite 2. Expanded Planning Data 3. CPD Maps Overview 4. Demonstration Guide Me Wizard Map Selection Identify Tool Printing and Saving
Transportation Statistical Data Development Report OKALOOSA-WALTON OUTLOOK 2035 LONG RANGE TRANSPORTATION PLAN
 Transportation Statistical Data Development Report OKALOOSA-WALTON OUTLOOK 2035 LONG RANGE TRANSPORTATION PLAN Prepared for the Okaloosa-Walton Transportation Planning Organization and The Florida Department
Neighborhood social characteristics and chronic disease outcomes: does the geographic scale of neighborhood matter? Malia Jones
 Neighborhood social characteristics and chronic disease outcomes: does the geographic scale of neighborhood matter? Malia Jones Prepared for consideration for PAA 2013 Short Abstract Empirical research
Working with Census 2000 Data from MassGIS
 Tufts University GIS Tutorial Working with Census 2000 Data from MassGIS Revised September 26, 2007 Overview In this tutorial, you will use pre-processed census data from Massachusetts to create maps of
Boundary and Annexation Survey (BAS)
") Boundary and Annexation Survey (BAS) New Mexico SDC Meeting Chris Wingate Geography Division U.S. Census Bureau 1 Agenda Boundary and Annexation Survey (BAS) BAS Overview American Community Survey (ACS)
Boundary and Annexation Survey (BAS) New Mexico SDC Meeting Chris Wingate Geography Division U.S. Census Bureau 1 Agenda Boundary and Annexation Survey (BAS) BAS Overview American Community Survey (ACS)
Presentation of Travel Demand. And. Relationships to Land Use. Prepared for The Delaware Transportation Institute. David P. Racca
 Presentation of Travel Demand And Relationships to Land Use Prepared for The Delaware Transportation Institute By David P. Racca Center for Applied Demography and Survey Research College of Human Services,
Mapping Accessibility Over Time
 Journal of Maps, 2006, 76-87 Mapping Accessibility Over Time AHMED EL-GENEIDY and DAVID LEVINSON University of Minnesota, 500 Pillsbury Drive S.E., Minneapolis, MN 55455, USA; geneidy@umn.edu (Received
GIS Spatial Statistics for Public Opinion Survey Response Rates
 GIS Spatial Statistics for Public Opinion Survey Response Rates July 22, 2015 Timothy Michalowski Senior Statistical GIS Analyst Abt SRBI - New York, NY t.michalowski@srbi.com www.srbi.com Introduction
Crop Progress. Corn Mature Selected States [These 18 States planted 92% of the 2017 corn acreage]
![Crop Progress. Corn Mature Selected States [These 18 States planted 92% of the 2017 corn acreage]](/thumbs/89/98128758.jpg "Crop Progress. Corn Mature Selected States [These 18 States planted 92% of the 2017 corn acreage]") Crop Progress ISSN: 00 Released October, 0, by the National Agricultural Statistics Service (NASS), Agricultural Statistics Board, United s Department of Agriculture (USDA). Corn Mature Selected s [These
Crop Progress ISSN: 00 Released October, 0, by the National Agricultural Statistics Service (NASS), Agricultural Statistics Board, United s Department of Agriculture (USDA). Corn Mature Selected s [These
OREGON POPULATION FORECAST PROGRAM
 OREGON POPULATION FORECAST PROGRAM PROGRAM OVERVIEW BACKGROUND Beginning in 1973 with the passage of Senate Bill (SB) 100, Oregon s growth management system has relied on population forecasts as the primary
Developing Innovation Village, Baltimore
 Developing Innovation Village, Baltimore Rick Jenarine, Ridhima Mehrotra, Andrew Seguin, Claire Warner Under the supervision of Professor Chao Liu URSP688L: Planning Technologies The University of Maryland
Are You Maximizing The Value Of All Your Data?
 Are You Maximizing The Value Of All Your Data? Using The SAS Bridge for ESRI With ArcGIS Business Analyst In A Retail Market Analysis SAS and ESRI: Bringing GIS Mapping and SAS Data Together Presented
Demographic Data. How to get it and how to use it (with caution) By Amber Keller
 By Amber Keller") Demographic Data How to get it and how to use it (with caution) By Amber Keller 101 Where does it come from? o The American Community Survey o Socio-economic characteristics of a population o Administered
Demographic Data How to get it and how to use it (with caution) By Amber Keller 101 Where does it come from? o The American Community Survey o Socio-economic characteristics of a population o Administered
The effects of impact fees on urban form and congestion in Florida
 The effects of impact fees on urban form and congestion in Florida Principal Investigators: Andres G. Blanco Ruth Steiner Presenters: Hyungchul Chung Jeongseob Kim Urban and Regional Planning Contents
DOWNLOAD OR READ : STATISTICS FOR GEOSCIENTISTS PDF EBOOK EPUB MOBI
 DOWNLOAD OR READ : STATISTICS FOR GEOSCIENTISTS PDF EBOOK EPUB MOBI Page 1 Page 2 statistics for geoscientists statistics for geoscientists pdf statistics for geoscientists MEMBER REGISTRATION Flowcharts.
Correction to Spatial and temporal distributions of U.S. winds and wind power at 80 m derived from measurements
 JOURNAL OF GEOPHYSICAL RESEARCH, VOL. 109,, doi:10.1029/2004jd005099, 2004 Correction to Spatial and temporal distributions of U.S. winds and wind power at 80 m derived from measurements Cristina L. Archer
River North Multi-Modal Transit Analysis
 River North Multi-Modal Transit Analysis November 7, 2006 Dan Meyers, AICP URS Corporation 612-373-6446 / dan_meyers@urscorp.com River North Study Area Reasons for initiating the study Downtown areas north
AFFH-T User Guide September 2017 AFFH-T User Guide U.S. Department of Housing and Urban Development
 AFFH-T User Guide Affirmatively Furthering Fair Housing Data and Mapping Tool v. 4.1 U.S. Department of Housing and Urban Development September 2017 Version 4.1 ❿ September 2017 Page 1 Document History
, District of Columbia
 State Capitals These are the State Seals of each state. Fill in the blank with the name of each states capital city. (Hint: You may find it helpful to do the word search first to refresh your memory.),
Crossing Boundaries Building Tools to Combine Public-Use (and Misaligned) Data
 Data") Crossing Boundaries Building Tools to Combine Public-Use (and Misaligned) Data Matthew Graham LEHD Program Center for Economic Studies U.S. Census Bureau 2018 FCSM Research and Policy Conference 1 Disclaimer
Crossing Boundaries Building Tools to Combine Public-Use (and Misaligned) Data Matthew Graham LEHD Program Center for Economic Studies U.S. Census Bureau 2018 FCSM Research and Policy Conference 1 Disclaimer
John Laznik 273 Delaplane Ave Newark, DE (302)
") Office Address: John Laznik 273 Delaplane Ave Newark, DE 19711 (302) 831-0479 Center for Applied Demography and Survey Research College of Human Services, Education and Public Policy University of Delaware
Office Address: John Laznik 273 Delaplane Ave Newark, DE 19711 (302) 831-0479 Center for Applied Demography and Survey Research College of Human Services, Education and Public Policy University of Delaware
Evaluating Physical, Chemical, and Biological Impacts from the Savannah Harbor Expansion Project Cooperative Agreement Number W912HZ
 Evaluating Physical, Chemical, and Biological Impacts from the Savannah Harbor Expansion Project Cooperative Agreement Number W912HZ-13-2-0013 Annual Report FY 2018 Submitted by Sergio Bernardes and Marguerite
Policy Paper Alabama Primary Care Service Areas
 Aim and Purpose Policy Paper Alabama Primary Care Service Areas Produced by the Office for Family Health Education & Research, UAB School of Medicine To create primary care rational service areas (PCSA)
= 5342 words + 5 tables + 2 figures (250 words each) = 7092 words
 = 7092 words") Influence of Neighborhood Types on Trip Distances A Case Study of Central Ohio Gulsah Akar, PhD (Corresponding Author) Assistant Professor City and Regional Planning Knowlton School of Architecture The
Influence of Neighborhood Types on Trip Distances A Case Study of Central Ohio Gulsah Akar, PhD (Corresponding Author) Assistant Professor City and Regional Planning Knowlton School of Architecture The
A. Geography Students know the location of places, geographic features, and patterns of the environment.
 Learning Targets Elementary Social Studies Grade 5 2014-2015 A. Geography Students know the location of places, geographic features, and patterns of the environment. A.5.1. A.5.2. A.5.3. A.5.4. Label North
Standard Indicator That s the Latitude! Students will use latitude and longitude to locate places in Indiana and other parts of the world.
 Standard Indicator 4.3.1 That s the Latitude! Purpose Students will use latitude and longitude to locate places in Indiana and other parts of the world. Materials For the teacher: graph paper, globe showing
Population Research Center (PRC) Oregon Population Forecast Program
 Oregon Population Forecast Program") Population Research Center (PRC) Oregon Population Forecast Program 2013 Oregon League of Cities Conference Risa S. Proehl Jason R. Jurjevich, Ph.D. Population Research Center (PRC) Population Research
Population Research Center (PRC) Oregon Population Forecast Program 2013 Oregon League of Cities Conference Risa S. Proehl Jason R. Jurjevich, Ph.D. Population Research Center (PRC) Population Research
EICCARS WORKBOOK FOR INITIATING COMMUNITY PROFILES WITH STATISTICAL AND OTHER SECONDARY DATA
 The Cultural Ecology of Health and Change (CEHC) Working Papers Ethnographically Informed Community and Cultural Assessment Research Systems (EICCARS) Workbooks EICCARS WORKBOOK FOR INITIATING COMMUNITY
PopStats Data Resource Manual. Demographic and Socio-Economic Data
 PopStats Data Resource Manual Demographic and Socio-Economic Data This page is intentionally left blank. Table of Contents 1 Introduction and How to Use this Guide 2 Using PopStats 3 Data Sources and Methodology
Data Matrix User Guide
 Data Matrix User Guide 1. Introduction The 2017 Data Matrix is designed to support the 2017 iteration of the Regional Skills Assessments (RSAs) in Scotland. The RSAs align with the Regional Outcome Agreement
REFINEMENT OF FSUTMS TRIP DISTRIBUTION METHODOLOGY
 REFINEMENT OF FSUTMS TRIP DISTRIBUTION METHODOLOGY Percentage of Trips (%) 10.00 9.00 8.00 7.00 6.00 5.00 4.00 3.00 2.00 1.00 Survey Destination Choice Model with Spatial Variables Destination Choice Model