Presentation of Travel Demand. And. Relationships to Land Use. Prepared for The Delaware Transportation Institute. David P. Racca
|
|
|
- Emory Jones
- 5 years ago
- Views:
Transcription
1 Presentation of Travel Demand And Relationships to Land Use Prepared for The Delaware Transportation Institute By David P. Racca Center for Applied Demography and Survey Research College of Human Services, Education, and Public Policy University of Delaware Newark, Delaware February 2001
2 The University of Delaware is committed to assuring equal opportunity to all persons and does not discriminate on the basis of race, color, gender, religion, ancestry, national origin, sexual preference, veteran status, age, or disability in its educational programs, activities, admissions, or employment practices as required by Title IX of the Educational Amendments of 1972, Title VI of the Civil Rights Act of 1964, the Rehabilitation Act of 1973, the Americans with Disabilities Act, and other application statutes and University policy. Inquiries concerning these statutes and information regarding campus accessibility and Title VI should be referred to the Affirmative Action Office, 305 Hullihen Hall, 302/ (voice), 302/ (TDD). ii
3 Table of Contents Page List of Figures... iv Executive Summary ix Introduction: Focus of the Research...1 Summary of Findings...2 Sources of Data...16 Travel Characteristics and Trends...18 Travel Mode - Walking, Bicycling, and Transit...43 Where People Live and Travel in Delaware...54 Characteristics Of the Transportation System...72 A Brief Review of the Relationship of Land Use and Transportation...78 Delaware Trip Characteristics and the Relationship with Population Density...84 Demographics and Trends...93 Bibliography iii
4 List of Figures Figure Page 1. Average Trip Times for Various Purposes and Population Densities Summary of Weekday Trip Distribution in Delaware Trip Distribution by County Percentage of Weekday Trips to Destinations in Delaware NPTS Average Distribution of Trips by Purpose Weekday Trip Chaining Type Average Number of Stops in a Chain Trip Purpose Distribution for Chained Trips Trip Distribution for Non-Chained Trips Comparison of Average Trip Times / Distances for Chained and Non-Chained Trips Percent of Men and Women Who Make Stops Persons Per Car Trip Vehicle Occupancy (NPTS 1995) Average Trip Times for Various Purposes and Population Densities Internal Delaware Distance and Speed Estimates by Land Use Densities Percentage of Respondents Mode by Population Density Trip Chaining by Land Use Density Population and Employment Figures From Year 2000 DelDOT Population Projections Population Estimates for The Year Distribution of Destinations Employment Estimates for The Year Where Would You Most Like to Live Average Trip Times for Higher Density Suburban Areas in Delaware Travel Mode (%) of Respondent in The DelDOT Household Survey Average Trip Time by Mode Travel Characteristics of Trips Originating and Ending in Delaware Reason for No Trip Percentage of Those Who Made No Trips Within Different Age Groups State and County Trip Making Summary Number of Daily Trips Expansion Number of Estimated Daily Trips by Purpose Data Comparison of Expected and Estimated Number of Work Trips Average Trip Time by Year and Purpose Average Trip Time by County Average Trip Time for Trips to State Destinations Trip Time Distribution - All Trips Trip Time Distribution - Work Trips Trip Time Distribution - Shopping Trips Trip Time Distribution - Other Trips Estimated Average Distance in Miles for Trips Beginning and Ending in Delaware Average Trip Distance by Purpose in Miles Internal Delaware Distance Estimates by Land Use Densities Average Vehicle Trip Length Departure Time, All Trips, Statewide Departure Time, Work Trips, Statewide...25 iv
5 List of Figures Page 46. Trip Departure Time, Shopping Trips, Statewide Departure Time, School / Daycare Trips, Statewide Departure Time, Other Trips, Statewide Summary of Weekday Trip Distribution in Delaware Person Trips NPTS Trip Distribution by County Percentage of Weekday Trips to Destinations in Delaware Trip Chaining Average Number of Stops in a Chain Trip Purpose Distribution for Chained Trips Trip Purpose Distribution for Non-Chained Trips Comparison of Average Trip Times and Distances for Chained and Non-Chained Trips Percentage of Incidental Stops by Purpose Percent of Men and Women Who Make Stops - Home to Work Percent of Men and Women Who Make Stops - Work to Home Mean Number of Stops by Tour Type Mean Number of Stops by Purpose Percentage of Trips to Take Someone Somewhere by Tour Type Percentage of Work and Non-Work Trip Chains for Men and Women that are Complex Work Trip Travel Length, Time, and Speed (NPTS 1995) Median Time Commuting to Work for Delaware Residents Employees by Time Leaving Home for Work Percent of Employees by Time Leaving Home for Work Employees by Time Leaving Home for Work Work/Non-Work Trips Percent of Shopping Trips on Weekdays and Weekends Pickup / Dropoff Trips Travel by Children Average Annual Miles by Driver Age and Sex Travel by Elderly Average Annual Miles Driven by Driver Age Percentage of Urban Shopping Trips Made by Alternative Modes by Cohort Annual Miles Driven by People 65+ Residing in Different Locations by Cohort Distribution of Urban and Rural Non-Work Vehicle Trips by Cohort Over Vehicle Occupancy by Purpose Percent of Vehicle Trips Workers Per Vehicle, Journey to Work During Peak Period Persons Per Car Trip Daily Time Spent Driving Means of Travel Travel Mode Share Employees by Travel Mode, State of Delaware Percent of Employees by Travel Mode...44 v
6 List of Figures Page 89. Travel Mode by County Travel Mode by Gender Travel Mode by Ethnicity Travel Mode by Age Group Average Earnings by Travel Mode Travel Mode by Income Percentage Persons Using Particular Modes by Purpose Service Type Guidelines Service Frequency Guidelines Housing Densities in New Castle County With 1/4 Mile Buffer Around Transit Routes CCD Origin / Destination Pairs with Total Workers > 500 and Transit Share > 2% CCD Origin / Destination Pairs with Total Workers > 2000 and Transit Share < 2% How often do you Use Dart First State Seniors What is the Purpose of this Transit Trip How Long Have you Been Using Dart Time of Day for Boarding Transit Travel Between Wilmington and New Castle County Suburbs Population Estimates for the Year Percent Housing Units Within a 6 Minute Walk Vs Number of Local Stops Demand Reached and Collector Miles Traveled by Number of Local Stops Journey to Work New Castle County Census County Division Total Workers by Census County Division in New Castle County Kent County Census County Divisions and Densities Total Workers by Census County Division in Kent County New Castle County CCD Work Flows Journey to Work Origins and Destinations in New Castle County Census County Division Work Destinations from the Mot Area Census County Division Work Destinations From the Central Pencader Area Kent and Sussex County Journey to Work Flows Kent / Sussex Journey to Work by CCD Estimates of Daily Shopping Trips, Productions and Attractions for NCC Shopping Trip Flows in New Castle County Estimates of Daily Shopping Trips, Productions and Attractions Kent and Sussex Shopping Flows Estimates of Daily Home Based Other Trips in New Castle County Estimates of Daily Home Based Other Trips in Kent / Sussex Origin Places in New Castle County Destination Places in New Castle County Total Workers > 200 at Transit Share 10% Or More Total Workers > 200 and 5% < Transit Share < 10% Total Workers > 300 and Transit Share < 5% Journey to Work Flows Between New Castle County Places Origin / Destination Table for Places in New Castle County Traffic Volumes From the DelDOT TDF Model...73 vi
7 List of Figures Page 134. Volume to Capacity Ratios Brandywine Area Time Contours Wilmington Time Contours Middletown Time Contours Dover Time Contours Lewes / Rehoboth Time Contours Summary of Data for Three Types of Land Use Summary of Trip Distribution for Three Land Use Types Mode Distribution (%) by Land Use Where Respondents to DelDOT Household Survey Said they Lived Year 2000 Population Density Descriptions Associated with Population Per Square Mile Population Living in Various Densities by County in the Year Percentage Population at Various Densities by County in Year Employment in Various Densities by County in the Year Statistics for 6 Population Densities Average Trip Times for Various Purposes and Population Densities Mode Distribution by Population Density Internal Delaware Distance and Speed Estimates by Land Use Densities Travel Statistics by Density of Home Zone by County Time, Distance, and Speed for internal Delaware Trips by County by Density Percentage of Destinations in the Six Density Categories All Trips Percentage of Destinations in the Six Density Categories - Work Trips Average Trip Times for Higher Density Suburban Areas in Delaware Population of Delaware and Counties State of Delaware County Population Sources of Population Growth in Delaware Migration in New Castle County Migration in Sussex County by Age Group Age Structure in Delaware Population and Households in Delaware Distribution of Land Uses. State of Delaware Occupied Year Round Housing Stock in Delaware Where Would you Most Like to Live Population Figures and Employment Figures From Year Population Estimates for the Year 2020 by Density Maps of Year 2020 DelDOT Projections by CCD Distribution of Destinations Estimated Population Change by CCD Maps of Summer Populations by CCD vii
8 Executive Summary The formulation and implementation of successful transportation policies depends on an understanding of travel demand and the transportation system (supply). The DelDOT Travel Demand Forecasting Model (TDFM), the DelDOT Household Survey, the National Personal Travel Survey (NPTS), population and employment projections, and U.S. Census data are examples of data that are available to understand travel demand in Delaware and its implications. Studying this large amount of information and presenting findings in this report was the main focus of the project and numerous views of travel demand data are available in this report. Another goal was to address the connections between land use and transportation. Residential land use was viewed in this project in terms of population density (persons per square mile) and employment density. The Statewide figure for average trips per person for weekday travel as calculated from 5 years of data from the DelDOT Household Survey for all persons in the sample is 2.6 trips per person per weekday * For those respondents who said they made a trip in the day sampled, the figure is about 3.2 trips per person. The numbers are virtually the same for each county. No difference is seen in regards to various land use densities. The DelDOT Household Survey showed that the average trip time over all types of week day trips for the five year sample was about 23.4 minutes. Average weekday trip time is 23.4 minutes, the median trip time is about 15 minutes. The median trip time for shopping, school, and other trips is 15 minutes, and the median trip time for work trips is 20 minutes. Over a third of all trips are 10 minutes or less and more than half of the trips are 15 minutes or less. Half of work trips are 20 minutes or less by private auto. In general as population density decreased, average trip time increased. Trip times between rural and urban densities differ by about 50%. Average trip times for all weekday trips ranged from 29.3 minutes for rural areas to 20.9 minutes for urban densities. The most striking transportation differences related to population densities are in average trip distance. Average trip distances for all weekday trips within Delaware range from 11.5 miles for rural densities to 4.2 miles for urban densities, almost 3 times further. Differences in average trip distances in relation to density are much larger than differences in trip times because there are higher speeds in low density areas. This is in line with national results that show that trip times are not increasing at the same rate as trip distances. Average trip speeds were shown to be as much as 2 to 3 faster in lowest density areas compared to urban densities. Lower density areas offer less congestion and are more often serviced by expressways that allow more distance with less impact on trip time. On a national level, average travel speeds have been increasing. The percentage of trips for various purposes is referred to as trip distribution. About 37% of weekday trips are work related, 21% for shopping, 6 % for school and daycare, and about another third are for other purposes. Trip distribution, and trips per person like many travel characteristics, are properties most related to life cycles and demographic factors such as age, race, income, gender, and employment status, rather than to land use type or densities. Trip chaining, the grouping of trips(stops) for various purposes in one "outing" is a feature of travel that has been traditionally overlooked but has very significant effects. A trip that is not * For clarification, a trip to the store and then home, is considered to be two trips. viii
9 chained is one where a person would go directly to work from home, directly to home from work, or from home to a destination and then back with no other stops. About a third of all trips involve more than one stop. Shopping, social, drop off/pickup, miscellaneous trips are those purpose that most involve a chain of trips. Non-work related travel has been increasing nationally and also non-work trip making has been growing rapidly during peak commuting times. As the private automobile provides flexibility in organizing daily activities, non-work activities can be more easily coordinated with commuting. Studies indicate that 10 to 20 percent of non-work trips are linked to the commute trip *. In regards to trip chaining, the data indicated only very slight differences in trip chaining in regards to population density. By 1995 NPTS (that includes weekend travel) occupancy rates for all travel is 1.59 person miles per vehicle mile, ranging from a low of 1.14 for work trips to 2.17 for other social and recreational purposes. There is a general view that occupancy rates are much lower because typically the focus is on the work trip. Actually the national survey indicates that about a third of all trips are multi-occupant. The DelDOT Household Survey 5 year sample estimates the percentage of all statewide weekday trips by transit to be about one percent, by walking 1.4%, and by private auto (passenger or driver) to be 96.4%. High density suburban and urban areas differ significantly in their use of transit, 1.6 and 5.0 percent respectively, and by walking, 2.9 and 7.9 percent. For suburban areas of medium density and below, use of other modes falls below 1% in each non-auto mode. In most of the lower density areas transit service is not available for many trips. Use of bicycles is generally 0.2 percent or lower even for urban and high density suburban areas (DelDOT Household Survey). As over a third of weekday trips in Delaware are 10 minutes, it was thought that the bicycle mode would be viable and show a higher share of trips, at least in urban areas, but the evidence suggests that the use of bicycles beyond recreation is very limited indeed. Delaware is reaching the bulk of the transit market. When transit service guidelines used in longrange transit plans are viewed in relation to existing transit service, as they were in the WILMAPCO Regional Transit Service Needs Analysis (1996), existing transit service is in line with what guidelines would warrant. Service type guidelines warrant fixed transit in areas where there are 4 to 12 households per acre. All such areas in northern Delaware are within a quarter mile of fixed transit service. Compared to other counties in the country, New Castle County has average to above-average use of the transit system. The average transit trip is estimated to take almost twice as long as the average trip by personal auto. In models of transit ridership produced by CADSR, the most significant factor for ridership besides population density is the availability of direct service. Practically all new population and employment growth in the future will be in suburban areas. The effect is that there are increasingly less origin-destination pairs that exist where for a particular locale there are a sufficient number of riders that can be identified to warrant direct or slightly indirect service. A previous study by CADSR showed that for medium density suburban areas such as the Pike Creek and Kirkwood Highway areas in New Castle County, a large percentage (34% to 68%) of the housing units were not within a 6 minute walking distance of bus stops located on adjoining roads, and that circulating such areas to pick up passengers involves large time costs. The effect of dispersed origins and destinations, prohibitively long travel times, the need of many for the flexibility of the private auto and to chain trips, the expense necessary to offer direct service to suburban areas, the time necessary to circulate suburban areas to collect * James G. Strathman and Kenneth J. Dueker. "Understanding Trip Chaining", 1990 NPTS Special Reports on Trip and Vehicle Attributes, pg 1-7 ix
10 passengers, and the number of areas not served, all greatly limit the market that can be served by transit. The mode share for transit in Delaware is expected to decrease. About 90% of the journey to work market involves trips from or to suburban areas (1990 CTPP), and enhancements to the current transit system will have to better address the suburban market. Park and Ride is seen as the only effective local collection strategy for transit to reach the medium to low density suburban market. In New Castle County about 10% of transit ridership originates at Park and Rides. In many rural areas car pooling is used in place of transit for some populations. Car pooling is not addressed in this report or in the data, but given the increasingly medium to low density development trends, it may be the most successful and cost effective strategy of getting cars off the road. Where people choose to live is determined by many factors that include quality of life, quality of schools, age, ethnicity, proximity to family and friends, jobs of other family members, and socioeconomic features of locations. A 1980 national survey sampled workers who lived more than 5 miles from work and they were asked to state the most important reason why they did not live close to their jobs. About 38% cited good schools, 24% said they liked their house, 17% said they liked their neighborhoods, and 10% said their own jobs were too far from the jobs of other family members *. A goal of most Americans is to own single-family detached homes with private open space next to each dwelling. In a Delaware survey done by CADSR that asked "Where Would You Most Like to Live?", over 70% wished to live in a suburban development or lower density area. Travel is often less costly to the average household than land or housing. There is often a benefit to moving into the suburbs and rural areas since housing costs can be greatly reduced by increasing transportation costs somewhat. In Delaware where there is relatively low congestion and large amounts of lower cost housing and land in lower density areas, many people are willing to accept slightly longer drive times for an increased quality of life. Lifestyle preferences and economic opportunity together have driven land use patterns, and they are both in the direction of continued low density development. Raising the cost of transportation or cost or availability of suburban development such as with higher fuel costs, congestion or peak hour pricing, higher taxes, parking fees, restricted growth areas, higher land values in low density areas, and suburban impact fees would be the most promising steps to redirecting development, but such measures have low public support. Over 80% of the State population is in medium suburban densities or less. Kent County has over a third and Sussex County has over half of the population in very low suburban and rural areas. Employment is spread in a similar way with slightly larger concentrations in higher density areas. Future growth is expected to occur in the medium suburban densities or less throughout the State. Additional urban or high density suburban areas are not expected to develop and those existing areas are for the most part showing a drop in population largely due to a continuing decline in population per household that is expected to continue over the next 20 years. Areas that are now classified as high density suburban or urban have low quantities of developable land, higher land prices, and/or low amounts of available housing stock. Location of new work places in the suburbs is a continuing trend.. Declining household size will ensure that household formation will rise faster than population and put substantial pressure on new housing construction in lower * William M. Rohe and others, Travel to Work Patterns: A Preliminary Analysis of Selected Data from the Annual Housing Survey Travel-to-Work File, University of North Carolina, Department of City and Regional Planning 1980, p 145, As seen in Stuck in Traffic, pg 1 x
11 density areas. The increasing number of single person households will tend to choose single family detached housing. While there was not much data, the DelDOT Household Survey numbers suggest that small pockets of high density development amid otherwise low density suburban development would not be expected to have similar travel characteristics as high density development in larger areas of high density as in northern New Castle County. Rather than an area with a couple large subdivisions and commercial centers, a much larger (if not subregional) high density surrounding area would be expected to be needed to achieve travel characteristics now seen in high density suburban and urban areas of Northern Delaware. In cases of planned communities designed to have people live near where they work, some studies show that commuting behavior is not different from unplanned communities. Large percentages (80 and 90 percent) still choose to work at some distance from their homes for a large number of reasons * (SIT pg104) As the baby boomers age, there will be an increasing need to address the mobility of elderly populations. With the baby boomers in the high earnings stages of their life cycles, they will be less likely influenced by the costs of owning a car and should be even less sensitive to increases in gasoline taxes and other costs of transportation. * Robert B. Zehner, "Access, Travel, and Transportation in New Communities (Cambridge, Mass.: Ballinger, 1977). As seen in Stuck in Traffic by Anthony Downs, pg. 104 xi
12 Introduction: Focus of the Research There have been a number of ongoing efforts conducted by the Delaware Department of Transportation (DelDOT), the Delaware Transportation Institute, the U.S. Census Bureau, and the University of Delaware to compile information about travel demand in Delaware. This data allows an understanding of the travel needs and patterns within the State and is important to addressing appropriate policies. Due to the large amount of data available and because it is most often used for very specific applications, a large portion of the data has not been thoroughly analyzed and presented. Travel demand is often discussed in terms of current and future housing development in Delaware. With the expected increased congestion and costs associated with new development in Delaware, there is increasing interest in the relationship of land use and transportation and the promotion of land use policies that can address the effects of ever increasing travel demand. This research has four primary goals: Develop a better understanding of travel demand and the transportation system. Take advantage of current investments in data collection. Investigate the relationship between land use and transportation. Compilation and presentation of travel demand and travel pattern data particularly as it relates to land use. Understanding what we know about travel demand also helps in identifying what we don't know and in seeing where data and data collection methods can be improved. The information is only as useful to the extent it can be understood, presented, and used. 1
13 Summary of Findings The formulation and implementation of successful transportation policies depends on an understanding of travel demand and the transportation system (supply). The DelDOT Travel Demand Forecasting Model (TDFM), the DelDOT Household Survey, the National Personal Travel Survey, population and employment projections, and U.S. Census data are examples of data that are available to understand travel demand in Delaware and its implications. Some of this data has been used effectively in the past by a few planners whose job it is to work with and maintain the data. However, many people who are involved with transportation have minimal exposure to such specific data about Delaware. Among the reasons why this information has not been more readily available or understood in that past are that preparing, analyzing, and presenting these large data sets is very time consuming and challenging. Also, until this work, the DelDOT Household Survey had not been examined in detail beyond its primary function of updating models for trip generation, since the survey was started in Studying this large amount of information and presenting findings in this report was the main focus of the project. This report is not an exhaustive view of available information but seeks to take advantage of our investments in these valuable data resources. Another goal of the project was to address the connections between land use and transportation. There are great concerns currently about urban sprawl and the low density development now seen in Delaware and how it may lead to increased congestion, poor air quality, and other social costs. Residential land use was addressed in this project in terms of population density (persons per square mile) and employment density. There are other land use factors of course, such as the connectivity and density of lane miles in an area, and the degree to which development is mixed (residential/commercial), that could have an effect on the distances or frequencies that people travel. * Population density is, however, the main indicator of the types and extent of travel in an area, and the types of transportation modes that can be successfully employed to meet the demand. For purposes of this analysis land use densities were divided into six categories: Persons per square mile Land use category 0 to 100 Rural 101 to 500 Very low density suburban 501 to 1000 Low density suburban 1001 to 5000 Medium density suburban 5001 to 10,000 High density suburban 10,001 to 64,000 Urban Whichever was greater, employment per square mile or residential population per square mile, was the figure used to classify density areas. So for instance, by this classification most areas in Brandywine Hundred and Pike Creek (New Castle County) were considered as medium density suburban. Areas such as Elsmere and Claymont fall within the high density suburban category and areas in central Newark or Wilmington make up most of the area in Delaware classified as Urban. * Another example of where the layout of development is of concern, is "non-friendly" transit development such as those areas that feature large set backs from major transportation corridors and low connectivity between developments. 2
14 Highlights of project findings are presented below under various categories. Travel Characteristics The Statewide figure for average trips per person for weekday travel as calculated from 5 years of data from the DelDOT Household Survey for all persons in the sample is 2.6 trips per person per weekday * For those respondents who said they made a trip in the day sampled, the figure is about 3.2 trips per person. The numbers are virtually the same for each county. No difference is seen in regards to various land use densities. Areas classified as Rural, Suburban, and Urban showed no difference in calculated trips per person per weekday. National figures as available from the 1995 Nationwide Transportation Survey for trips per person per day are higher, in the neighborhood of 4 trips per person per day, but these figures take into account weekend travel which is not addressed in the DelDOT Household Survey. The DelDOT Household Survey showed that the average trip time over all types of week day trips for the five year sample was about 23.4 minutes. There were no significant differences in average trip times between counties. In general as population density decreased, average trip time increased. Large differences in average trip time do exist of course in terms of trip purpose, as also shown in Figure 1. Work trips tend to take the longest time and shopping trips the shortest time. Figure 1. Average Trip Times for Various Purposes and Population Densities In Delaware (in minutes, weekday travel) Source: DelDOT Household Survey Very Low Low Med High Density Purpose Rural Suburb. Suburb. Suburb. Suburb. Urban All Densities All Trips Work Trips Shop Trips School Trips Other Trips It is important to note that while the average trip time is 23.4 minutes, the median trip time is about 15 minutes. The median trip time for shopping, school, and other trips is 15 minutes, and the median trip time for work trips is 20 minutes. It can be seen from trip distributions presented later in this report that over a third of the trips are 10 minutes or less. Trip time distributions are similar for various population densities as well. The average driving time per day for all drivers by 1995 National Personal Travel Survey is 1 hour and 13 minutes. Women drive 60 to 70 percent as many miles as men of the same age. The percentage of trips for various purposes is referred to as trip distribution. Figures 2 and 3 provide two views, one showing distributions for each of the survey years and another showing trip distributions by county. * For clarification, a trip to the store and then home, is considered to be two trips. 3
15 Figure 2. Summary of Weekday Trip Distribution in Delaware Percentage of Weekday Travel Source: DelDOT HH Survey , All Work Shop School/Daycare Other Figure 2 indicates an increase in the work trip percentage of daily travel with a corresponding increase in School/Daycare percentage, and a decrease in other categories. Trip distribution is similar when the county figures are compared. Sussex County with a larger percentage of retirees, would be expected to show a lower percentage of work trips and school/daycare trips. Figure 3. Trip Distribution by County (percentage trips by purpose) Source: DelDOT Household Survey, Weekday Travel Kent New Castle Sussex Work Shop School/Daycare Other The "Other" category used in the figures above results from a grouping of destinations tabulated in the DelDOT Household Survey. Figure 4 shows a more detailed breakdown for the 5 year sample. Figure 4. Percentage of Weekday Trips to Destinations in Delaware DelDOT Household Survey (does not include Home destination) % Work 37 Shop 20.7 School 4.7 Drop Off./Pick Up 8.5 Social 9.7 Recreation 4.1 Eat Out 4.2 Child Care 0.7 Other 11.7 Over the entire week, work trips represent a lower percentage. The 1995 Nationwide Personal Travel Survey (NPTS) provides trip distributions for national trip distributions as shown in Figure 5. 4
16 Figure 5. Average Distribution of Trips by Purpose. From "Our Nation's Travel:1995 NPTS Early Results Report Person Trips Work 17.7% Work-related 2.6% Other 0.2% Shopping 20.2% Other Social & Recreational 16.7% Social & Recreational Family & Personal Doctor/Dent. 1.5% Visiting 8.2% 8.8% School & Church 24.1% Other Family & Personal Trip chaining, the grouping of trips(stops) for various purposes in one "outing" is a feature of travel that has been traditionally overlooked but has very significant effects. Analysis of trip distribution, travel patterns, and average distances can be very complicated when one considers the effects of grouping trips. Typically, trip chaining is studied in terms of whether a series of trips began or ended at home or work. A trip that is not chained is one where a person would go directly to work from home, directly to home from work, or from home to a destination and then back with no other stops. Figures 6 and 7 below provide data about chaining as available from the DelDOT Household Survey and show that almost a third of trips are part of a chain. As also shown in national data people tend to chain trips more often in the journey from work to home and make more stops than in the home to work journey. Figure 6. Weekday Trip Chaining Types (percentage of trips) DelDOT Household Survey Trip/Stops %Trips (includes incidental stops) Home to Home Chains Home to Work Chains Work to Home Chains No Chains (Stops) Figure 7. Average number of stops in a Chain (not including incidental) DelDOT Household Survey Stops Home to Home 1.7 Home to Work 1.2 Work to Home 1.4 5
17 Certain types of trips are more often part of trip chains as shown in Figure 8 and 9. Figure 8. Trip Purpose Distribution for Chained Trips DelDOT Household Survey Purpose % of chained trips Child Care 1.7 School 2.9 Recreation 5.0 Eat Out 6.3 Work 6.6 Social 13.4 Drop Off / Pickup 18.0 Other 18.9 Shop 30.1 Figure 9. Trip Purpose Distribution for Non-Chained Trips DelDOT Household Survey Purpose %of non-chained trips Child Care 0.2 Eat Out 3.2 Recreation 3.7 Drop Off / Pick Up 4.0 School 5.6 Social 8.0 Other 8.4 Shop 16.3 Work 51.2 Since most of the shorter distance type trips are more likely to be taken as part of a chain, comparison of trip times and distances between chained and non-chained trips must be in terms of trip purpose, as presented in Figure 10. For the most part, the efficiencies of organizing trips in chains is reflected with trip times for chained trips being slightly lower, except for the Shop purpose. Figure 10. Comparison of Average Trip Times and Distances for Chained and Non-Chained Trips by Trip Purpose (minutes and miles), DelDOT Household Survey Average Trip Time Average Trip Distance Chained Non-Chained Chained Non-Chained Work Shop School-Daycare Other Non-work related travel has been increasing nationally and also non-work trip making has been growing rapidly during peak commuting times. As the private automobile provides flexibility in organizing daily activities, non-work activities can be more easily coordinated with commuting. Studies indicate that 10 to 20 percent of non-work trips are linked to the commute trip * The shift to single occupancy vehicles from transit contributes to congestion in the growth of vehicle trips directly, but also contributes to congestion indirectly through the stimulation of non-work based * James G. Strathman and Kenneth J. Dueker. "Understanding Trip Chaining", 1990 NPTS Special Reports on Trip and Vehicle Attributes, pg 1-7 6
18 travel during peak periods. In terms of travel efficiency there is a benefit though in that individuals can structure their trips to minimize their travel times. There is also a benefit of trip chaining in that it has been estimated from national data that non-work trips made independent of the work trip are 10 to 20 percent longer and about 2/3 of these trips involve trips to a single destination. Trip chaining patterns are very related to household characteristics and life cycle. A detailed study of trip chaining and its effects in Delaware was beyond the scope of this project, but it is certainly a very important issue to address in understanding travel demand and policies to address it. Figure 11 below using national data provides a good view of the extent of trip chaining. Figure 11. Percent of Men and Women Who Make Stops 1 Home to Work Trips No Stops One or more stops Women 67% 33% Men 80.2% 18.8% Work to Home Trips No Stops One or more stops Women 38.8% 61.2% Men 53.7% 46.4% Figure 11 above also demonstrates an example of how travel differs depending on demographics. Differences in the travel characteristics of an area are greatly influenced by age, race, income, gender, employment status, and household structure. This report includes a number of findings related to various demographics. In particular, as Delaware's population ages, meeting the elderly's mobility needs will be an increasingly important issue. Vehicle occupancy for various trip purposes was tabulated for week day trips from the DelDOT Household Survey, and is presented in Figure 12. By 1995 NPTS (that includes weekend travel) occupancy rates for all travel is 1.59 person miles per vehicle mile, ranging from a low of 1.14 for work trips to 2.17 for other social and recreational purposes. There is a general view that occupancy rates are much lower because typically the focus is on the work trip with occupancy just over 1.0. Actually the national survey indicates that about a third of all trips are multioccupant. Figure 12. Persons per Car Trip DelDOT Household Survey Purpose All Years Social Dropoff/Pickup Other School Shop Recreation Eat Out Child Care Work Nancy McGuckin, "Examining Trip-Chaining Behavior: A Comparison of Travel by Men and Women", FHWA Document on NPTS 1995 Web Site, Washington, D.C., pg. 6 7
19 Figure 13. Vehicle Occupancy 2 (NPTS 1995) Travel Characteristics and Land Use Trip time, trip distribution, and trips per person seem to be properties most related to demographic factors and life cycles rather than to land use type. The most striking transportation differences related to population densities are in average trip distances. The DelDOT Household Survey asked each respondent how much time each trip took. The location of the trip origin and destination was located based on address, closest intersection, or residential development name. Surveyed trips were geocoded to a Modified Grid, which is a demographic unit smaller that a traffic zone used in Delaware for planning and projections. From this information, an estimated distance was calculated for each trip originating and ending in Delaware. Given this distance, and the trip time from the survey, an estimated average speed was also calculated for trips. The results are shown in Figure 14. Figure 14. Average Trip Times for Various Purposes and Population Densities In Delaware (in minutes, weekday travel) Source: DelDOT Household Survey Very Low Low Med High Density Purpose Rural Suburb. Suburb. Suburb. Suburb. Urban All Densities All Trips Work Trips Shop Trips School Trips Other Trips Federal Highway Administration, "Our Nation's Travel: 1995 NPTS Early Results Report", U.S. Department of Transportation. 8
20 Figure 15. Internal Delaware Distance and Speed Estimates by Land Use Densities. Source: DelDOT Household Survey and GIS Road Network Model Distance in Miles, Speed in Miles per Hour. Rural V.Low Low Medium H.Sub Urban All Densities Avg Trip Distance Avg Work Distance Avg Shop Distance Avg School Distance Avg Other Distance Avg Trip Speed Avg Work Speed Avg Shop Speed Avg School Speed Avg Other Speed Differences in average trip distances in relation to density are much larger than differences in trip times because lower density areas allow for higher speeds. This is in line with national results that show that trip times are not increasing at the same rate as trip distances. As development is taking place more and more outside of urban areas, it would seem reasonable that these lower density areas offer less congestion and higher speeds. On a national level, average travel speeds have been increasing. Trip time is more of a driving factor as to where people locate than trip distance. Suburban development does make for more VMT but not as much an increase in travel time. In terms of use of alternative travel modes, high density suburban and urban areas differ significantly in their use of transit, 1.6 and 5.0 percent respectively, and by walking, 2.9 and 7.9 percent. At lower densities use of other modes falls below 1% in each non-auto mode. In most of the lower density areas transit service is not available for many trips. Figure 16. Percentage of Respondent's Mode by Population Density Source: DelDOT Household Survey 5 year sample Rural V.Low Low Medium H.Sub Urban All Densities Driver Passenger Public Bus Walked School Bus Bike In regards to trip chaining, the data indicated only very slight differences in trip chaining. Lowest density areas tended to have more Home to Home chains and less Home to Work chains. Figure 17. Trip Chaining by Land Use Density (percentage of total trips) DelDOT Household Survey Very Low Low Med High Density Chain Type Rural Suburb. Suburb. Suburb. Suburb. Urban All Densities H - H Chain H - W Chain W-H Chain No Chains Incidental Trips H-W or W-H 9
21 Comparisons of average trip times for Chained and Non-Chained trips by the various population densities showed minor differences. Demographic and Land Use Trends As seen below in Figure 18 that tabulates current DelDOT population and population figures by the various land use densities, over 80% of the State population is in medium suburban densities or less. Kent County has over a third and Sussex County has over half of the population in very low suburban and rural areas. Employment is spread in a similar way with slightly larger concentrations in higher density areas. Figure 18. Population and Employment Figures From Year 2000 DelDOT Population Projections Rural V.Low Low Medium H.Sub Urban DE Pop DE Pop 2000 Dist % 13.7% KC Pop 2000 Dist % 10.3% NC Pop 2000 Dist % 11.7% SC Pop 2000 Dist % DE Emp DE Emp 2000 Dist % 5.0% KC Emp 2000 Dist % NC Emp 2000 Dist % SC Emp 2000 Dist % Future growth is expected to occur in the medium suburban densities or less throughout the State. Additional urban or high density suburban areas are not expected to develop and those existing areas are now showing a drop in population largely due to a continuing decline in population per household that is expected to continue over the next 20 years. Areas that are now classified as high density suburban or urban have very low quantities of developable land, higher land prices, and/or low amounts of available housing stock. Residential and employment growth continue to develop widely across the State. Destinations for all trips are spread widely. Figure 19. Population Estimates for the Year 2020 Year 2000 DelDOT Population Projections (CADSR) Rural V.Low Low Medium H.Sub Urban DE Pop DE Dif to ,856 35,641 9,339 3, KC Dif to NC Dif 2000 to ,394 16, SC Dif 2000 to
22 Figure 20. Distribution of Destinations Source: DelDOT Household Survey Purpose All trips Work Trips Urban High Density Suburb Medium Suburban Low Suburban Very Low Suburban Rural Location of new work places in the suburbs has also been a trend. Figure 21 shows DelDOT projections for the year 2020 and changes in the next 20 years. In 1989, a Coldwell Banker study of office space in 50 metropolitan areas showed that the suburbs attracted 72 percent of the new office space built and 74 percent of the office space actually absorbed. Figure 21. Employment Estimates for the Year 2020 Year 2000 DelDOT Employment Projections Rural V.Low Low Medium H.Sub Urban DE Dif to ,111 KC Dif to NC Dif 2000 to , SC Dif 2000 to Where people live is affected by many factors that include quality of life, quality of schools, age ethnicity, proximity to family and friends, jobs of other family members, and socioeconomic features of locations. A 1980 national survey sampled workers who lived more than 5 miles from work and they were asked to state the most important reason why they did not live close to their jobs. About 38% cited good schools, 24% said they liked their house, 17% said they liked their neighborhoods, and 10% said their own jobs were too far from the jobs of other family members 3. A goal of most Americans is to own single-family detached homes with private open space next to each dwelling. In a Delaware survey that asked "Where Would You Most Like to Live?", over 70% wished to live in a suburban development or lower density area. Figure 22. Where Would You Most Like To Live? (% respondents) By Survey Year 4 City Small Town Suburban Dev. Rural Dev. Home in Country William M. Rohe and others, Travel to Work Patterns: A Preliminary Analysis of Selected Data from the Annual Housing Survey Travel-to-Work File, University of North Carolina, Department of City and Regional Planning 1980, p 145, As seen in Stuck in Traffic, pg 17 4 Ratledge, Edward C., Delawareans' Attitudes Toward Economic Growth: Survey Results, Center for Applied Demography and Survey Research, University of Delaware 11
23 Lower housing costs, tax incentives, low fuel prices, and availability of expressways encourage suburban development as well. Travel is often less costly to the average household than land or housing. In 1990, the average household spent 16.7% of its annual income for transportation, not counting the time spent traveling, but it spent 26% for housing (Bureau of the Census, Statistical Abstract of the United States, 1990). There is often a benefit to moving into the suburbs and rural areas since housing costs can be greatly reduced by increasing transportation costs somewhat. This is of course why many households make very long commuting trips in high-housing cost metropolitan areas. In Delaware where there is relatively low congestion and large amounts of lower cost housing and land in lower density areas, many people are willing to accept slightly longer drive times for an increased quality of life. The data certainly show that people drive larger distances in lower density areas. There has been increased support for higher density development, clustered development, mixed use development, and planned communities. There is some question as to the effect of the scale of the development and its proximity to similarly high density areas. One might think, for instance, that the residents in an isolated subdivision of high density in an otherwise low density suburban area would not have travel characteristics much different than their neighbors. There is some difficulty in investigating what travel patterns might result from a suburban pocket of high density or mixed use mostly because very few areas in Delaware would qualify as examples, and data is less available for those areas. Average trip times for the Middletown area, the Smyrna area, and for high density suburban and urban areas in Kent County (includes Dover) were tabulated and shown below in Figure 23. The average trip times for Middletown and Smyrna areas were more in line with figures for very low density suburban areas as presented previously, particularly the figures for the work trip. Middletown and Smyrna areas both had unusual numbers of long duration trips. The Kent County high density areas mostly involve locations in Dover, and travel in general in Kent County is focused on Dover. Average trip times are more in line with previous numbers for medium density and high density suburban areas. While there was not much data, the numbers suggest that areas of high density development amid otherwise low density suburban development would not be expected to have similar travel characteristics as high density development in larger areas of high density as in northern New Castle County. In all three areas the percent of walking trips was a little more or less than one percent. Figure 23. Average Trip Times For Higher Density Suburban Areas in Delaware Smyrna Area Middletown Area Kent High Density Areas Sample Trips Avg Work Time 43.7 (minutes) Avg Shop Time Avg Other Time Lifestyle preferences and economic opportunity together have driven land use patterns, and they are both in the direction of continued low density development. Raising the cost of transportation or cost or availability of suburban development such as with higher fuel costs, congestion or peak hour pricing, higher taxes, parking fees, restricted growth areas, higher land values in low density areas, and suburban impact fees would be the most promising steps to redirecting development, but that is the area of least public support. People are very accustomed to low transportation costs, an effective and uncongested transportation network, and a significant public subsidy in terms of publicly financed infrastructure to support the lifestyle they desire. 12
24 The increasing number of adults in the population will generate significant new needs for "drive time" transportation capacity. As the baby boomers age, there will be an increasing need to address the mobility of elderly populations. With the baby boomers in the high earnings stages of their life cycles, they will be less likely influenced by the costs of owning a car and should be even less sensitive to increases in gasoline taxes and other costs of transportation. Declining household size will ensure that household formation will rise faster than population and put substantial pressure on new housing construction in lower density areas. The increasing number of single person households will tend to choose single family detached housing. Transit and Other Modes of Travel Delaware is reaching the bulk of the transit market. When transit service guidelines used in longrange transit plans are viewed in relation to existing transit service, as they were in the WILMAPCO Regional Transit Service Needs Analysis (1996), existing transit service is in line with what guidelines would warrant. Service type guidelines warrant fixed transit in areas where there are 4 to 12 households per acre. All such areas in northern Delaware are within a quarter mile of fixed transit service. Compared to other counties in the country, New Castle County has average to above-average use of the transit system. New Castle County in 1990 was the 112 th most populous county in the country and it had the 117 th highest population density. In 1990, New Castle County ranked 97 th in terms of the number taking public transit to work, and this was before large ridership increases were achieved through the 1990's (Bureau of Census, 1990). The Deldot Household Survey 5 year sample estimates the percentage of all statewide week day trips by transit to be about one percent, by walking 1.4%, and by private auto (passenger or driver) to be 96.4%. The frequency of walking or using transit is much higher in urban areas where the survey estimates 4.6% of total weekday trips are by transit and 7.2% by walking. Figure 24. Travel Mode (%) of Respondent in the DelDOT Household Survey All Driver Passenger Public Bus Walked School Bus Bike Other Use of bicycles is generally 0.2 percent or lower even for urban and high density suburban areas (DelDOT Household Survey). The only tabulations that listed the bicycle travel mode as more than one percent were for the lowest income bracket in New Castle County (1.1% of weekday trips), and the Asian-Pacific Island ethnicity class (2.2% of weekday trips in a sample of 109 trips from this ethnicity). As over a third of weekday trips in Delaware are 10 minutes, it was thought that the bicycle mode would be viable and show a higher share of trips, at least in urban areas but the evidence suggests that the use of bicycles beyond recreation is very limited indeed. 13
25 Because of the many relatively short distance trips and because of the nature of transit trips (i.e. waiting for the bus, stops, and boarding) the average transit trip is estimated to take almost twice as long as the average trip by personal auto. Figure 25. Average Trip Time By Mode (minutes) Source: DelDOT Household Survey Average Trip Time Driver 22.9 Passenger 25.2 Public Bus 38.3 Walk 12.2 School Bus 31.4 Bicycle 18.2 All modes 23.4 Figure 26, Travel Characteristics of Trips Originating and Ending in Delaware Source: DelDOT Household Survey Avg. Trip Time Avg.Trip Distance Avg. Trip Speed Driver Passenger Public Bus Walk * 4.0* School Bus Bicycle All Modes * Because of the resolution of the way the origin and destinations are geocoded, short distance trips are expected to be estimated longer than they actually are and this would be shown in higher than actual estimated average speeds. More than half of the trips are 15 minutes or less, and over a third of all trips are 10 minutes or less. Half of work trips are 20 minutes or less by private auto. With such low travel times, and where there is relatively low or no congestion, transit will have difficultly competing for "choice" riders. In models of transit ridership produced by CADSR the most significant factor for ridership besides population density is the availability of direct service. Origins and destinations are increasingly more dispersed throughout the State. Practically all new population and employment growth in the future will be in suburban areas. The effect is that there are increasingly less origin-destination pairs that exist where for a particular locale (an area serving several subdivisions for instance) there are a sufficient number of riders that can be identified to warrant direct or slightly indirect service. A previous study by CADSR showed that for medium density suburban areas such as the Pike Creek/ Kirkwood Highway area, a large percentage (34% to 68%) of the housing units were not within a 6 minute walking distance of bus stops located on adjoining roads, and that circulating such areas to pick up passengers involves large time costs. Two thirds of all trips are 20 minutes or less, and most origin destination pairs involving 200 or more workers have travel times by auto of 25 minutes or less. About 90% of the journey to work market involves trips from or to suburban areas (1990 CTPP), and enhancements to the current transit system will have to better address the suburban market. 14
26 Park and Ride is seen as the only effective local collection strategy to reach the medium to low density suburban market. In New Castle County about 10% of transit ridership originates at Park and Rides. In many rural areas car pooling is used in place of transit for some populations. Ride share is not addressed in this report or in the data, but given the increasingly medium to low density development trends, ride share programs may be the primary and most successful strategy of increasing vehicle occupancy. The effect of dispersed origins and destinations, prohibitively long travel times, the need of many for the flexibility of the private auto and to chain trips, the expense necessary to offer direct service to suburban areas, the time necessary to circulate suburban areas to collect passengers, and the number of areas not served, all greatly limit the market that can be served by transit. The mode share for transit in Delaware is expected to decrease. Nationally, transit share has been decreasing. As most of the markets for transit are now being reached, efforts to increase or maintain share of travel will require more intensive marketing efforts. The collection and use of travel demand data can greatly assist these efforts. In particular, origin and destination information as offered by the DelDOT Travel Demand Forecasting Model, the Census Transportation Planning Package (CTPP), and the DelDOT Household Survey, is very valuable information to help focus efforts. As an example, the 1990 CTPP for New Castle County, indicates a number of possible areas for transit development that include areas in and around western portions of Kirkwood Highway, Chestnut Hill Road, Milltown Road, northern portions around the City of New Castle, and lower portions of Route 40. Suburban destinations involving thousands of workers such as the Zeneca/Dupont, East Newark, and Newport/Boxwood areas are shown as markets that transit service may better reach. 15
27 Sources of Data DelDOT Household Survey The DelDOT Household Telephone Survey, as part of the Delaware Statewide Model Improvement Project, is an ongoing survey in its 6 th year that gathers information about the travel behaviors and preferences of drivers, 16 years and older, across the State. It began initially to update DelDOT trip generation models and takes the place of trip diaries used by other States. In a random process, respondents are selected and asked to list the origin, destination, time, and trip method (mode) of every trip made in the preceding day. Demographic data is compiled for each respondent. Public opinion on transportation issues is also surveyed. As of January 2000, there had been 8372 people surveyed, and over 21,000 trips have been documented. This represents a continually growing body of knowledge specific to Delaware and has yet to be fully taken advantage of for planning. This research analyzes information from the DelDOT Household Survey to study the trip distributions, travel patterns, and travel time for various trip purposes and land use densities. It is important to remember when looking at the data that only those 16 years and older were surveyed and it did not include travel on Saturday and Sunday. Before analysis the data was weighted back to Delaware demographics to account for sample bias. There is a substantial amount of information available in the survey that was not studied. This report includes highlights of travel demand and relationships to land use density. DelDOT Travel Demand Forecasting Model The Division of Planning at DelDOT has maintained the Travel Demand Forecasting Model for many years to predict travel demand over a 20 year projection period. This model predicts the number of trips for various purposes, trip productions and attractions, and volume to capacity ratios. It takes into account future improvements to the transportation system, projected growth, and is able to estimate the performance of the system at a general planning level for various types of growth scenarios. Model parameters are adjusted primarily to have outputs that are consistent with traffic counts and other sources of information. The model has gone through substantial improvement in the past years. The version of the model available for analysis was divided into two pieces, one for New Castle County and another for Kent and Sussex together. A new Delmarva Peninsula wide model will be available soon that includes substantial improvements to model inputs. It is a traditional 4-Step modeling approach that seeks to capture travel demand at a general planning scale rather than producing results at a subdivision level. Census Transportation Planning Package The 1990 Census Transportation Planning Package produced from the 14% sample of the U.S. Census provides a large amount of information about journey to work travel patterns and mode of travel in Delaware. The data for northern Delaware and Cecil County (MPO) is available for much smaller demographic units than for other areas in the state with data at a traffic zone level or smaller. It represents the most detailed origin - destination information available for Delaware. 16
28 1995 Nationwide Personal Transportation Survey The Nationwide Personal Transportation Survey (NPTS) is a national inventory of daily passenger travel. The 1995 Survey is the fifth in a series that began in 1969 (1977, 1983, 1990). The survey is collected from a sample of U.S. households and collects information on all trips, by all modes, for all purposes, and in various types of areas (urban, rural). NPTS is a survey of travel by the civilian, non-institutionalized population of the U.S. age five and older. It does not include residents of group quarters, such as nursing homes, college dormitories, and long term medical facilities. Sample size for the 1995 NPTS was 42,033 households. Among other information the data includes: - trip purpose - trip mode - trip time - trip length - trip time of day and day of the week - vehicle occupancy - driver and vehicle characteristics The NPTS is used in this report as a comparison to local figures and also as a source for information that considers weekend travel and travel of those under 16 years of age. Numerous studies have been conducted with this information and results on some studies are included. Year 2000 Delaware Population and Employment Projections The Delaware Population Consortium prepares the official population projections each year in Delaware. Figures are available at the county level and include age, race, and gender distributions. The Center for Applied Demography and Survey Research at the University of Delaware uses these figures, tax assessment records, zoning information, historical development information, Department of Labor records, historical population and employment records, and a wide range of other available data to allocate county level projections to the DelDOT Traffic Zone level and for Kent and Sussex counties the Modified Grid Level (a demographic unit smaller than a traffic zone). Some figures from the projections used in this report are still being reviewed. 17
29 Travel Characteristics and Trends Introduction This chapter presents information available from the DelDOT Household Survey, the Census Transportation Planning Package (CTPP), the Nationwide Personal Transportation Survey, and CADSR studies concerning travel demand and characteristics. Numbers of Trips The DelDOT Household Survey continues to produce a large amount of information specific to Delaware travel patterns and preferences. Figure 29 on the next page summarizes what is known about the number of weekday trips for those 16 years and older. Travel from an origin to a destination is one trip, so for instance a trip to work from home and then the return trip is considered to be two trips. There is no significant difference between those living in different counties in regard to the average number of trips per day. Perhaps the most striking information shown in Figure 29 is that the number of trips per person per weekday, showed a steady decline in the five years of data analyzed. This is true for those making trips, and also there was an increased number of respondents who said they made no trips in the previous day. Declines were mostly in the "Shopping" or "Other" purposes with only small variations in Work or School/Day Care trips. This decrease in trip taking appears to occur across all demographics. An aging population and more retirees moving into southern Delaware would tend to decrease trips. Steady increases in vehicle miles traveled (VMT), as calculated from traffic counts and the general perception by many that traffic volumes have increased, would not seem to be consistent with a drop in trip taking. Staff have considered a number of checks to verify the trend, and survey staff have been instructed to prompt respondents more as to trips that do not immediately come to mind, perhaps a shopping trip or other travel. CADSR will soon review 2000 figures and follow up with survey staff. Possible increases in travel not covered in the survey, such as commercial travel, are being considered. It does not seem likely that respondents erroneously answered the simple question "Did you go anywhere yesterday?". Data was analyzed for those making no trips as shown in Figures 27 and 28. No major differences were seen between counties in regard to those not making trips in the preceding day. In the 1999 survey a question was added to find out the reason no trips were made (as shown in Figure 27) and hopefully this will provide some explanation and trend information about those making no trips in the future. This question also provides an estimate of those working at home. Figure 27. Reason for No Trip. (% of no trip respondents) Source: 1999 DelDOT Household Survey Working at home 9.8 Sick 11.5 Vacation 7.0 Retired or unemployed 52.5 Other
30 Figure 28. Percentage of Those Who Made No Trips Within Different Age Groups Source: DelDOT Household Survey Age Total Sample % Under to over Figure 29. State and County Trip Making Summary, Source: DelDOT Household Survey Delaware All Sample size Sample no trip Sample w trip %no trip Trips Trips/person Trips/per (mt) (of those who made trips, mt) Avg trip time Kent County All Sample size Trips Trips/person Sample no trip Sample w trip %no trip Trips/per (mt) (of those who made trips, mt) Avg trip time Sussex All Sample size Trips Trips/person Sample no trip Sample w trip %no trip Trips/per (mt) (of those who made trips, mt) Avg trip time New Castle All Sample size Trips Trips/person Sample no trip Sample w trip %no trip Trips/per (mt) (of those who made trips, mt) Avg trip time
31 Figures 30 and 31 show estimates of daily trips by county and purpose. Figure 31 clearly shows that while decreases in work trips are shown, decreases in Shopping and Other purposes are much greater. This would be inconsistent with national trends Figure 30. Number of Daily Trips Expansion From the DelDOT Household Survey Kent New Castle Sussex ,700,243 1, Figure 31. Number of Estimated Daily Trips by Purpose, DelDOT Household Survey Work Shop School/Daycare Other Comparison with other data is the best way to examine the estimated trip totals, though there is considerable difficulty in finding data with which to compare them. Work trips are the easiest, and one comparison is shown in Figure 32. It would seem that the estimated total trips, as expanded from the survey, is a little low but not necessarily since it is unknown how many people work shifts on weekends or outside of the usual Monday thru Friday work week. Since the survey only studied weekday travel, people could be reached who indicated that they made no work trip in the previous day, though they may work a full time job. If only 5% were missed in this way or in another manner that would make expected trips and estimated trips roughly the same. Figure 32. Data Comparison of Expected and Estimated Number of Work Trips Number of workers living in Delaware = 385,000 Expected number of work trips = 770,000 trips Less sick/vacation rate (10%) - 77,000 trips Less carpool to work (3.6%) - 27,700 trips Work at home group (3%?) - 23,000 trips Those working on weekend shifts -??? 642,300 -??? trips expected Estimated work trips from survey (to and from) = 603,700 trips (five year average) Similar comparisons for other trip purposes are much more difficult if not impossible to determine because of the lack of data. As the survey continues and additional controls are put in place,. the accuracy of estimates will be better known. If declines or lower trip making is seen month after month in the future, then this would be an important finding from a public policy standpoint and contrary to national trends that show personal travel increasing. Estimated increases in VMT would then have to be a result of other sources. The types of other sources not covered in the survey include, among others, work related travel, commercial travel, delivery services, and public safety services. 20
32 Trip Time In the DelDOT Household Survey, respondents were asked how much time (in minutes) each trip took. The figures below present a few views of that information. Figure 33. Average Trip Time ( in minutes) by Year and Purpose DelDOT Household Survey Purpose All Years Work Shop School Other All Trips Figure 34. Average Trip Time by County (DelDOT Household Survey ) Kent New Castle Sussex Work time Shop School/Daycare Other All Trips Figure 35. Average Trip Time for Trips to State Destinations, (minutes) DE PA MD NJ It is important to note that while the average trip time is 23.3 minutes, the median trip time is about 15 minutes. The median trip time for shopping, school, and other trips is 15 minutes and the median trip time for work trips is 20 minutes. It can be seen from trip distributions presented on the next pages that over a third of the trips are 10 minutes or less. 30 Figure 36 Trip Time Distribution All Trips Percent TIMEINT Cases weighted by WT2 21
33 Figure 37 Trip Time Distribution 30 Work Trips Percent TIMEINT Cases weighted by WT2 Figure 38 Trip Time Distribution 30 Shopping Trips Percent TIMEINT Cases weighted by WT2 22
34 Figure 39 Trip Time Distribution 30 Other Trips Percent TIMEINT Cases weighted by WT2 Trip Distance The distances people travel are also of great interest. In the DelDOT Survey respondents are not asked for the distance of their trips. People generally know the time their trips take with much more accuracy than distance. In the survey, respondents provide an origin and a destination address that is then geocoded by survey staff to the Modified Grid, which is a demographic unit smaller than a traffic zone that is used by various planning groups in Delaware. To analyze trip distance in this project, geographical information system minimum path algorithms were used to estimate grid to grid distances for each trip. The path was calculated along the roads as represented in the DelDOT Center Line File. This method seemed to provide a reasonable estimate. Figures 40 thru 43 show information on distance. For travel out of the State of Delaware a distance estimate was not calculated, so that all distance estimates calculated from the DelDOT Household Survey are only for trips beginning and ending in Delaware (internal). For these trips there is some indication that average trip distances are increasing. Figure 40. Estimated Average Distance in Miles for Trips Beginning and Ending in Delaware. DelDOT Household Survey All Delaware Kent New Castle Sussex
35 Figure 41. Average Trip Distance by Purpose in Miles (Statewide) Internal trips. Source: DelDOT Household Survey All Work Shop School/Daycare Other All Certainly various types of trips have differing average distances. As discussed in a later section of this report that addresses transportation patterns and land use, trip distances are seen to vary in relation to land use density as show in Figure 42. Figure 42. Internal Delaware Distance Estimates by Land Use Densities. Source: DelDOT Household Survey and GIS Road Network Model Distance in Miles, Speed in Miles per Hour. Rural V.Low Low Medium H.Sub Urban All Densities Avg Trip Distance Avg Work Distance Avg Shop Distance Avg School Distance Avg Other Distance National data show that trip lengths over all trip purposes have not increased. However, the trip lengths for the journey to work have increased by about 26% in the years between the 1969 NPTS and 1995 NPTS. Work trips are those trips that people have the least control over, and with more and more people moving into the suburbs and with the increase in households with two or more workers, this increase is expected. Figure 43. Average Vehicle Trip Length (miles) Nationwide Personal Transportation Survey All Purposes To and from work Shopping Other Fam. & Personal Social and Recreational Departure time The following figures show the departure time for various trip purposes from the DelDOT Household Survey. Shopping and Other trips occur throughout the day. About a third of the trips that occur during the weekday morning peak are non-work related, and over half of the trips in the evening peak period are non-work. 5 Patricia S. Hu and Jennifer R. Young, "Summary of Travel Trends:1995 Nationwide Personal Transportation Survey". Pg
36 Figure 44. Departure Time, All Trips, Statewide (military time) Value TOTAL HOUR Figure 45. Departure Time, Work Trips, Statewide Value WORK HOUR 25
37 Figure 46. Trip Departure Time, Shopping Trips, Statewide Value SHOP HOUR 200 Figure 47. Departure Time, School/Daycare Trips, Statewide 100 Value SCHOOL HOUR 26
38 Figure 48. Departure Time, Other Trips, Statewide Value OTHER HOUR Trip Distribution The Nationwide Personal Transportation Survey (NPTS) is a national inventory of daily passenger travel and is collected from a sample of U.S. households and collects information on all trips, by all modes, for all purposes, and in various types of areas (urban, rural). Figure 50 on the next page is taken from the results of the 1995 NPTS and shows the average distribution of trips by purpose. The most prevalent reason for travel and the area that has seen the greatest growth in the last few decades is for family and personal travel that includes shopping, running errands, dropping and picking up others, and in medical visits. Since the NPTS survey in 1969, there has been a 66% increase in average annual vehicle trips overall. Trip distribution data available for Delaware can be derived from the DelDOT Household Survey and is presented in Figure 49. These figures only address weekday travel for those 16 years of age or older. Figure 49. Summary of Weekday Trip Distribution in Delaware DelDOT HH Survey , Percentage of Weekday Travel All Work Shop School/Daycare Other
39 Figure 50. Person Trips, NPTS Early Results Report Person Trips Work 17.7% Work-related 2.6% Other 0.2% Shopping 20.2% Other Social & Recreational 16.7% Social & Recreational Family & Personal Doctor/Dent. 1.5% Visiting 8.2% 8.8% School & Church 24.1% Other Family & Personal Figure 51, Trip Distribution by County DelDOT Household Survey Kent New Castle Sussex Work Shop School/Daycare Other Survey numbers indicate an increase in the percentage of work trips and a slight increase in the percentage of School/Daycare trips in the last two years but that is because shopping and "other" types of trips declined more. As mentioned in the previous section there were declines in trips for all purposes. Figure 52 provides a more detailed look at some of the types of trips that make up the Other category in the Delaware survey. Figure 52, Percentage of Weekday Trips to Destinations in Delaware DelDOT Household Survey Work 37% Shop 20.7 Other 11.7 Social 9.7 Drop Off./Pick Up 8.5 School 4.7 Recreation 4.1 Eat Out 4.2 Child Care
40 Trip Chaining Trip chaining, the grouping of trips (stops) for various purposes in one "outing" is a feature of travel that has been traditionally overlooked but has very significant effects. Analysis of trip distribution, travel patterns, and average distances can be very complicated when one considers the effects of grouping trips. Typically, trip chaining is studied in terms of whether a series of trips began or ended at home or work. A trip that is not chained is one where a person would go directly to work from home, directly to home from work, or from home to a destination and then back with no other stops. Figures 53 and 54 below provide data about chaining as available from the DelDOT Household Survey and show that almost a third of trips are part of a chain. As also shown in national data, people tend to chain trips more often in the journey from work to home and make more stops than in the home to work journey. Figure 53, Trip Chaining (percentage of trips) DelDOT Household Survey Trip/Stops %Trips (includes incidental stops) Home to Home Chains Home to Work Chains Work to Home Chains No Chains (Stops) Figure 54. Average Number of Stops in a Chain (not including incidental) DelDOT Household Survey Home to Home 1.7 stops Home to Work 1.2 Work to Home 1.4 Certain types of trips are more often part of trip chains as shown in Figure 55 and 56. Figure 55. Trip Purpose Distribution for Chained Trips Purpose % of chained trips Child Care 1.7 School 2.9 Recreation 5.0 Eat Out 6.3 Work 6.6 Social 13.4 Drop Off / Pickup 18.0 Other 18.9 Shop 30.1 Figure 56, Trip Purpose Distribution for Non-Chained Trips Purpose %of non-chained trips Child Care 0.2 Eat Out 3.2 Recreation 3.7 Drop Off / Pick Up 4.0 School 5.6 Social 8.0 Other 8.4 Shop 16.3 Work
41 Since most of the shorter distance type trips are more likely to be taken as part of a chain, comparison of trip times and distances between chained and non-chained trips must be in terms of trip purpose, as presented in Figures 57 and 58. For the most part, the efficiencies of organizing trips in chains is reflected with trip times for chained trips being slightly lower, except for the Shop purpose. Figure 57. Comparison of Average Trip Times and Distances for Chained and Non-Chained Trips by Trip Purpose (minutes and miles), DelDOT Household Survey Average Trip Time Average Trip Distance Chained Non-Chained Chained Non-Chained Work Shop School-Daycare Other The DelDOT Household Survey also included a tabulation of trips called "incidental trips" for the home to work or work to home journey. These are trips considered to add little time or distance and were not coded in separate trip records as other trips. About 11% of Home to Work trips and a little over 9% of Work to Home trips involved incidental trips. The types of incidental trips and relative proportions (percentages) of the total incidental trips are shown in Figure 58. Most of these are convenience store and gas trips. Figure 58. Percentage of Incidental Stops by Purpose. (423 stop Home-Work, 334 stops Work to Home in 5years of sampling) DelDOT Household Survey Home-Work Work-Home Convenience Store 38.3% 21.6% Gas DropOff/Pick up at Daycare Fast Food/take out DropOff Pick up child at school Bank Personal Business Post Office Grocery Pickup/Dropoff person Eat Work Related Video Store Drug Store Nationally, non-work related travel has been increasing and also non-work trip making has been growing rapidly during peak commuting times. Rather than a situation where people choose to schedule more discretionary travel during peak times, this is in part due to trip chaining. People consider their travel needs and in any outing will often structure their travel behavior around several purposes. So for instance in a commute to or from work, a person may drop their child off at school or daycare, stop by the cleaners, purchase something at the grocery store, or whatever else is convenient to their particular needs. As the private automobile provides flexibility in organizing daily activities, non-work activities can be more easily coordinated with commuting. The shift to single occupancy vehicles from transit contributes to congestion in the growth of vehicle trips directly, but also contributes to congestion indirectly through the 30
42 stimulation of non-work based travel during peak periods. National studies indicate that 10 to 20 percent of non-work trips are linked to the commute trip 6. Understanding the circumstances where people choose to combine various trips is important to a better understanding of travel behavior and for examining transportation policy issues. The overall effects of trip chaining on policy are often not clear. For example, while trip chaining may create more congestion in the peak travel periods by stimulating more non-work related trips there is a travel efficiency benefit that is clear to the individuals who structure their trips to minimize their travel time. It has been estimated that non-work trips made independent of the work trip are 10 to 20 percent longer, and about two thirds of these trips involve trips to a single destination. 7 When one considers trip chaining, sometimes policies are not as clear. If trip chaining during the work trip was discouraged through more transit use, for instance, there could be more efficient use of the transportation system during peak times, but there could be increased emissions and cold starts that could result in undesirable environmental effects. Trip chaining patterns are very related to household characteristics and life cycle. They also vary with gender, income, race, and other demographic variables. A study by McGuckin and Murakami 8 that examined trip chaining behavior differences among men and women as indicated from the 1995 NPTS, provides a good view of the extent of trip chaining. Figures below from this study (pages 31 and 32) illustrate that there are far more chained trips for the journey from work as opposed to the journey to work especially among men. On average women make fifty percent more stops on the way home from work and eighty percent more work-based tours than men. Figure 59. Percent of Men and Women Who Make Stops Home to Work Trips, NPTS 1995 (McGuckin) No Stops One or more stops Women 67% 33% Men 80.2% 18.8% Figure 60 Percent of Men and Women Who Make Stops Work to Home Trips, NPTS 1995 (McGuckin) No Stops One or more stops Women 38.8% 61.2% Men 53.7% 46.4% Figure 61,. Mean Number of Stops By Tour Type NPTS 1995 (McGuckin) Men Women All tours Home -Home Work-Work Work -Home Home-Work James G. Strathman and Kenneth J. Dueker. "Understanding Trip Chaining", 1990 NPTS Special Reports on Trip and Vehicle Attributes, pg Oster, C. 1978, "Household Tripmaking to Multiple Destinations:The Overlooked Urban Travel Pattern", Traffic Quarterly, 32: Nancy McGuckin and Elaine Murakami, "Examining Trip-Chaining Behaviour - A Comparison of Travel by Men and Women", NPTS 1995 publication, available at NPTS 1995 web site 31
43 Figure 62. Mean Number of Stops by Purpose Work to Home Tours, NPTS 1995 (McGuckin) Men Women Social/Recreational Pickup / Dropoff Shopping Family/Personal Figure 63. Percentage of Trips to Take Someone Somewhere By Tour Type -- Adult Men and Women NPTS 1995, (McGuckin) Men Women Home-Home Work-Work Work-Home Home-Work Strathman and Dueker's study of 1990 NPTS data found similar results with the figure below as an example. A "simple" work chain is where worker goes directly to work and from work directly home. A simple non-work trip is where a person leaves home, goes directly to a non-work destination, and then directly home again. All other chains intermediate stops and are called complex. Figure 64. Percentage of Work and Non-Work Trip Chains For Men and Women That Are Complex NPTS Men Women Work Commutes Non-Work Journeys All Journeys Findings derived from this study among others include: non-work stops were twice as likely to be contained in the homeward leg as in the commute to work trip chaining is by far more reliant on the automobile. Dispersion of work and non-work activities in metropolitan areas means that pedestrian and transit systems face a growing disadvantage in serving the mobility needs of a population that is increasingly engaging in complex trip chaining. Trip chaining patterns are quite distinct with respect to demographic factors. Higher income households are more likely to trip chain and tend to organize a larger share of trips around the commute. Contributions of trip chaining research have benefited an understanding of travel behavior rather than improvements in urban transportation models. Legislative and legal 9 Strathmore and Duecker, pg
44 mandates addressing economic efficiency, land use, and environmental quality require a shift of planning focus toward travel behavior rather than traditional four step models. Next generation travel models would require greater ability to derive travel outcomes from household activity and transportation system conditions and research would be facilitated by activity based survey of households rather than the current trip based format. Work Trips Work trips are often a focus of transportation studies because they occur during the peak travel periods of the day. They involve relatively fewer destinations than other purposes and occur at more predictable times of the day, so they are markets for public transit. However, they account for only about 25% or less of all trips. While the average commute to work has increased in length, the travel time to work has not shown corresponding increases. Nationally, commute speeds have increased by more than 20 % over the past 12 years. There are three reasons most often cited for the increase in speed of travel time to work: the continued decentralization of metropolitan areas the expansion of the peak period, because of greater flexibility in hours of work the switch from carpool and transit to single occupancy vehicle trips, which are usually more time-efficient for the individual worker, even though less efficient for the overall transportation systems Figure 65. Work Trip Travel Length, Time, and Speed From NPTS %chg avg work trip length (miles) avg work travel time (minutes) avg work trip speed (MPH) This is evident in data for Delaware as well. As people and employment move to the suburban areas, speeds relative to high density city areas have increased, and as restricted access highways are built such as Route 1 in Delaware, people are able to move to desirable suburban areas while not increasing drive times at the same rate as their distance increases. Figure 66 Median Time Commuting to Work for Delaware Residents (minutes) Year State Kent New Castle Sussex Source: Center for Applied Demography and Survey Research, University of Delaware US Bureau of Census The trend of greater trip distances with less of an increase in travel time is contrary to the notion that suburban sprawl results in congestion. Low density settlement only causes congestion if 33
45 areas are not well served by expressways and other road systems, the workers have to converge on a few jobsites or bottlenecks, and/or the number of travelers greatly exceeds the capacity of the road systems 10. Travel distance, time, and patterns are investigated more in a later section that describes travel characteristics in terms of density. Figure 67 Employees by Time Leaving Home for Work: State of Delaware Time State Percent Kent Percent New Castle Percent Sussex Percent 12:00am - 4:59am 6, , , , :00am - 5:29am 5, , , , :30am - 5:59am 9, , , , :00am - 6:29am 22, , , , :30am - 6:59am 38, , , , :00am - 7:29am 62, , , , :30am - 7:59am 57, , , , :00am - 8:29am 38, , , , :30am - 8:59am 17, , , , :00am - 9:59am 15, , , , :00am - 10:59am 5, , :00am - 11:59am 3, , :00pm - 3:59pm 22, , , , :00pm - 11:59pm 22, , , , Source: Center for Applied Demography and Survey Research, University of Delaware US Bureau of Census Figure 68 Percent of Employees by Time Leaving Home for Work: State of Delaware Percent :00am - 5:29am 12:00am - 4:59am 5:30am - 5:59am 6:00am - 6:29am 6:30am - 6:59am 7:00am - 7:29am 7:30am - 7:59am 8:00am - 8:29am 10:00am - 10:59am 9:00am - 9:59am 8:30am - 8:59am 4:00pm - 11:59pm 12:00pm - 3:59pm 11:00am - 11:59am State Kent New Castle Sussex Source: Center for Applied Demography and Survey Research, University of Delaware US Bureau of Census 10 Downs, Anthony, Stuck in Traffic:Coping with Peak Hour Traffic Congestion, The Brookings Institution, Washington, D.C pg 92 34
46 Figure 69 Employees by Time Leaving Home for Work: State of Delaware Time State Percent Kent Percent New Castle Percent Sussex Percent 12:00am - 4:59am 6, , , , :00am - 5:29am 5, , , , :30am - 5:59am 9, , , , :00am - 6:29am 22, , , , :30am - 6:59am 38, , , , :00am - 7:29am 62, , , , :30am - 7:59am 57, , , , :00am - 8:29am 38, , , , :30am - 8:59am 17, , , , :00am - 9:59am 15, , , , :00am - 10:59am 5, , :00am - 11:59am 3, , :00pm - 3:59pm 22, , , , :00pm - 11:59pm 22, , , , Source: Center for Applied Demography and Survey Research, University of Delaware US Bureau of Census An interesting finding of the 1995 NPTS is that commute trips are in the minority even during rush hour. Approximately 37% of trips for all purposes start during the two rush hour periods, (6-9am, 4-7pm) as shown in Figure 70. This says that much of the traffic we see during rush hour is not due only to people going to work. Figure Work/Non-Work Trips By time of Day Mid-6AM 6-9AM Work Non-Work 9-Noon Noon- 4PM 4-7PM 7-Mid Percent of Day s Trips 11 Our Nations Travel:1995 NPTS Early Results Report, pg

47 Shopping trips Shopping trips are a continually growing segment of personal travel. Shopping trips comprise about a fifth of all person trips and one out of seven person miles traveled. Though considered by some to be more of a weekend activity, the NPTS data show that shopping trips are spread evenly throughout the week. About 62% of shopping trips take place during the week which make up 71 percent of the days of the week. The time of day shopping trips take place is shown in Figure 71. Figure 71. Percent of Shopping Trips on Weekdays and Weekends Our Nations Travel:1995 NPTS Early Results Report Time of Day % of Shopping trips % of Shopping trips Occurring Weekdays Occurring Weekend Midnight to 6AM AM to 9AM 3 2 9AM to Noon 13 9 Noon to 4PM PM to 7PM PM to Midnight 7 6 Total percentage 61.5% 38.5% Daily % of total trips 12% 19% Pickup / Dropoff Trips As would be expected, since the majority of pickup / dropoff trips involve getting children to school or to after school activities, more of these trips occur during the week, and women make about two thirds of these trips. About 11% of all trips made by women and 7% of all trips by men are pickup and dropoff trips. As a great majority of the trips involve getting children to school functions or day care, most of the trips occur during the week. Figure 72. (From Our Nation's Travel pg. 16) 36
48 Low Income Travel Murakami and Young examined 1995 NPTS data and 1990 Census Public Use Microdata Sample (PUMS) and reached the following conclusions: Persons in low incomes are much less likely to have a vehicle. About a quarter of low income households do not have a car, compared to 4% of other households. On average, low income households have 0.7 vehicles per adult compared with over 1 vehicle per adult in other households. Despite having fewer vehicles, people in low income households still make most of their trips by private vehicles. Trips made in private vehicles are much more likely to be in "non-household" vehicles, that is in vehicles of friends, neighbors, or relatives. The biggest difference in travel mode is in the proportion of walking trips. People in low income households are nearly twice as likely to walk as people in other income groups. For work related trips, low income households report 5% by walk and 5% by transit compared to 3% walk and 2% transit for other income groups. About 60% of low income household trips are three miles or less, compared to 50% for other households. Average travel times by private vehicle for the journey to work do not vary by income group and average between 18 and 20 minutes. Per person, people in low income households make about 20% fewer trips than people in other households. Differences in person miles of travel are about twice this with low income households traveling nearly 40% fewer miles. Walking is used for 13% of social and recreational trips and 9% of family and personal business trips, figures which are almost double for other (not low) income households. Social and recreation trips are significantly shorter for low income households, 8.05 miles average as compared to for other groups. Travel with respect to race By NPTS 1995 results, African Americans make 95 annual transit trips per person where Caucasians average one sixth of that rate at 15 annual transit trips per person. Much of this disparity is considered to be due to lower income rates (lower vehicle ownership) and housing location patterns among African Americans. African Americans make 76% of their trips by private vehicle as compared to 88% for Caucasians. On average African Americans make 3.9 trips a day compared to 4.4 daily trips by Caucasians. Hispanics make 82% by private vehicle. Hispanics are twice as likely to use transit as non-hispanics, and make 50% more walking trips. There are certainly differing travel preferences in regard to race, but one should be cautious in generalizing, as travel is related to a number of other correlated factors such as income and housing locations. Travel by children Trips to and from school account for just over one fourth of the trips made by 5 to 15 year-olds. About half of America's school children aged 5-15 go to school in private vehicles. Social and recreational activities comprise 40% of their trips, and another 30% are made for family and personal business. 37

49 Figure 73. Travel by Children From "Our Nation's Travel, pg. 29" 5-9 years years %Trips by Trip purpose Social/Recreational Family/Personal School Other Annual Trips/Person POV passenger School Bus Walk Transit Other %School Trips by mode POV School Bus Walk Other Travel by the Elderly The amount of travel fluctuates with age of course as shown in Figure 74 from the Early Results Report for NPTS There are large differences in gender also. Figure 74. (Our Nation's Travel pg. 23) 38

50 As the nation's population ages, travel patterns of the elderly are of particular interest. The NPTS provides information about this. By 1995 NPTS figures, persons 65 years or older average 3.43 trips a day. Those under 65 average 4.42 a day. The means of transport for seniors is surprisingly similar to the under 65 group. Where the number of work trips are a much lower percentage of total trips for seniors, the distribution for other trip purposes is similar. Figure 75. (Our Nation's Travel pg. 26) A study of travel by the elderly conducted by Rosenbloom 12 using 1990 NPTS data showed that the elderly as a group drove 20% more miles than they had in 1983, while those over 70 drove 40% more. The elderly were even less likely to use transit with no cohort using it for more than 5% of their trips, and the average was substantially less. Although walking was the second mode of choice, its importance fell by one-third in urban areas and one fourth in rural areas since Elderly men took 24% more person trips, traveled 19% more miles, and made 94% more vehicle trips than elderly women. The study showed that Caucasian's are substantially more dependent on the private car than other races. Caucasian seniors of both sexes make more vehicle and person trips and travel more miles than any other ethnic or racial grouping. The study examines a number of cultural, gender, and ethnic travel preferences among the elderly. For instance it was shown that Caucasian men make 21% more person trips than Caucasian women but African American men make almost 100% more trips than African American women. The diversity seen among younger Americans is increasingly being seen among the elderly, and this diversity is certainly expected to increase in the future. The growing diversity includes pockets of older women living alone, and men and women who are below poverty level, and those who cannot or will not drive. Rosenbloom points out that most elderly are drivers and over three fourths live in low density suburban or non-metropolitan places-places where the use of the private car is either encouraged or absolutely necessary. Questions raised by Rosenbloom concern: 12 Rosenbloom, Sandra, Travel by the Elderly, U.S. Department of Transportation, available on the NPTS 1995 web site. 39
51 The need to know to what extent the features of elderly travel are a function of choice and to what extent necessity. Whether upward trends among all aspects of travel will continue and what the intensity of growth will be. If current sex, race, and ethnic differences in travel patterns are likely to continue. The need to have a comprehensive understanding of how elderly people meet their needs and the environmental constraints and barriers under which they operate in order to meet the mobility needs of seniors. Rosenbloom presents a range of very interesting data. Figures 76 thru 79 are some examples. Figure 76. Average Annual Miles Driven by Driver Age All Ages 8,685 10,006 10,588 13, ,112 8,002 8,568 10, ,850 6,277 6,804 8, ,644 4,828 4,348 6,138 Figure 77. Percentage of Urban Shopping Trips Made by Alternative Modes by Cohort 1983 and 1990 Transit Walking Taxi Age cohorts % 0.7% 8.3% 5.7% Figure 78. Annual Miles Driven by People 65+ Residing in Different Locations by Cohort, 1990 Central City Suburbs Rural Age Cohorts Women Men Women Men Women Men Total Figure 79. Distribution of Urban and Rural Non-Work Vehicle Trips, by Cohort over 60, Trip Purpose Urban Rural Urban Rural Urban Rural Urban Rural Urban Rural Shopping Social Family Business School/Church Medical All Others


52 Vehicle Occupancy By 1995 NPTS occupancy rates for all travel was 1.59 person miles per vehicle mile, ranging from a low of 1.14 for work trips to 2.17 for other social and recreational purposes. Figure 80 summarizes information for the 1995 survey. There is a general view that occupancy rates are much lower because typically the focus is on the work trip with occupancy just over 1.0. Actually about a third of all trips are multi-occupant as shown in Figure 81. Figure 80. Vehicle Occupancy (Our Nation's Travel, pg. 24) Figure 81. (Our Nation's Travel pg. 25) 41
53 Vehicle occupancy figures specific to Delaware are available for the journey to work as available in the 1990 CTPP. Figure 82 shows workers per vehicle at the county level for the journey to work during the peak travel period (6:30 to 8:30am), and the numbers are similar to national figures. Workers per vehicle for journey to and from work in the same county are equal. A major difference seems to be a higher occupancy for trips from New Castle to Sussex County. Figure 82. Workers per Vehicle, Journey to Work During Peak Period (6:30am to 8:20am), (1990 CTPP County Level) Place of work New Castle Kent Sussex New Castle Residence Kent Sussex Vehicle occupancy for various trip purposes was tabulated for weekday trips from the DelDOT Household Survey, and are presented in Figure 83. Figure 83. Persons per Car Trip DelDOT Household Survey Purpose All Years Dropoff/Pickup Eat Out Child Care Recreation Social Shop Other School Work Daily Time Spent Driving The average driving time per day for all drivers by NPTS 1995 is 1 hour and 13 minutes. Depending on age women drive 60 to 70 percent as many miles as men the same age. The difference continues to decrease as women's participation in the work force increases. Figure 84. Daily Time Spent Driving NPTS 95, (Our Nation's Travel pg. 22) Ages Male Female All
54 Travel Mode - Walking, Bicycling, and Transit Figure 85 summarizes information from the 1995 Nationwide Personal Transportation Survey for means of travel. Nationwide, travel by private auto accounts for 86% of all person trips. Walking is the next most used mode with 5.4% of all trips. Transit accounts for 1.8% of all trips. School bus trips account for 1.7% of all trips. Figure 85. (Our Nation's Travel pg. 19) Means of Travel Person Trips Single Occupant 41.7% Person Miles Single Occupant 39.8% POV 86.2% POV 90.8% Multi Occupant 44.5% Other 4.9% School Bus 1.7% Walk 5.4% Transit 1.8% Multi Occupant 51% Other 5.5% School Bus 1.3% Transit 2.1% Walk 0.3% Walk accounts for 5% of trips, but less than 1% of miles. Air travel accounts for less than 1% of trips, but 3% of miles. By NPTS, walk trips were mainly for family and personal business (43% of walk trips) and for social and recreational purposes (22% of walk trips). Seven percent of work trips were made by walking. Social and recreational purposes accounted for 60% of trips by bicycle and family, and personal business accounted for 22% of bicycle trips. Transit captured 3.1% of the trips for work, and 44% of all transit trips took place during peak times. The DelDOT Household Survey was examined to provide information on travel mode. Figure 86 below provides mode shares for each year of the survey for all trips. Figure 86. Travel Mode Share(%) Source: DelDOT Household Survey Weekday travel, age sixteen years and older All Driver Passenger Public Bus Walked School Bus Bike Other
55 Figures from the 1990 Census for the journey to work showed travel by carpooling statewide to be 13.2% compared with transit at 2.5%. Transit in Kent and Sussex counties reaches less than one percent due to lower densities and limited service, though carpooling is slightly higher, which is consistent with national figures that show that carpooling is a substitute for dependent populations in rural areas. Figure 87 Employees by Travel Mode State of Delaware Travel Mode State Percent Kent Percent New Castle Percent Sussex Percent Drive Alone 258, , , , Carpool 42, , , , Public Transit 8, , Other 17, , , , Work at Home 7,980 1,553 4,313 2,114 Source: Center for Applied Demography and Survey Research, University of Delaware US Bureau of Census 100 Percent Figure 88 Percent of Employees by Travel Mode State of Delaware Drive Alone Carpool Public Transit Other State Kent New Castle Sussex Source: Center for Applied Demography and Survey Research, University of Delaware US Bureau of Census, 1990 Census Transportation Planning Package 44
56 Figure 89. Travel Mode by County DelDOT Household Survey State Kent New Castle Sussex Driver Passenger Public Bus Walked School Bus Bike Other Certainly, mode choice is highly dependent on age, race, gender, income, and social factors. This is seen in national figures as well as those from the DelDOT Household Survey. Figures 90 thru 94 below present mode choice by some of these factors. Figure 90. Travel Mode by Gender DelDOT Household Survey Males Females Total Driver Passenger Public Bus Walked School Bus Bike Other Figure 91. Travel Mode by Ethicity DelDOT Household Survey Latino Black White Asian Other Refused Hisp/Mex Pacific Island Driver Passenger Public Bus Walked School Bus Bike Other Sample size Figure 92. Travel Mode by Age Group DelDOT Household Survey to to and over Driver Passenger Public Bus Walked School Bus Bike Other
57 Figure 93 Average Earnings by Travel Mode: State of Delaware Travel Mode State Kent New Castle Sussex Drive Alone $26,351 $21,497 $28,771 $20,969 Carpool $21,870 $16,778 $24,040 $18,684 Public Transit $20,802 $12,393 $21,518 $13,553 Other $15,500 $14,075 $15,878 $14,961 Work at Home $18,743 $17,626 $19,576 $17,870 All Modes $24,945 $20,454 $27,085 $20,287 Source: Center for Applied Demography and Survey Research, University of Delaware US Bureau of Census Figure 94. Travel mode by Income Statewide (%) Source: DelDOT Household Survey 0-29,999 30, ,000-74,999 75,000 and over Total Driver of car Passenger in car Public Bus Walked School Bus Bicycle Other Of course, travel mode selected depends on the trip purpose as well. For instance, it is more likely there will be a passenger (carpool) in an "Eat Out" trip or recreational/social trip. Walking and biking are most frequent with school related trips. Transit use is a higher percentage of commute trips. Transit is lowest for childcare, shopping, and drop-off/ pickup trips. Figure 95. Percentage Persons Using Particular Modes by Purpose DelDOT Household Survey DRV PASS Bus Walk Sch Bus Bike Other Childcare Work Drop/Pick Other Shop Social Recreation School Eat Out (DRV = driver, PASS = passenger) Note: Passenger is so low for Childcare because only persons 16 years or older were surveyed in the DelDOT Household Survey. 46
58 Transit in Terms of Service Guidelines Service guidelines used in long-range transit plans by the local MPO, Wilmington Area Planning Council (WILMAPCO), were viewed in relation to existing transit service. Service guidelines used by WILMAPCO focus on Service Type, Service Frequency(headway), and Service Hours and are based on residential densities. Figure 96. Service Type Guidelines 13 Figure 97. Service Frequency Guidelines Residential Density Service Type Residential Density Service Type (Households per acre) (Households per acre) Less than 4 Demand Response Less than 4 2 hour advance Park-n-Ride 4 to 12 30/60 * 4 to 12 Fixed Route Over 12 15/30 Over 12 Express Routes Existing transit service was in line with what these guidelines would warrant as suggested by the map presented in Figure 98 which shows that practically every Census Block with a housing unit density of at least 4 units per acre, is within a quarter mile of the fixed route transit system. These service guidelines of course do not reflect a level of service associated with travel time or transfers necessary for transit service of particular origin and destination pairs. While the current DART First State system provides a transit path between most major origins and destinations, the level of service of suburb-to-suburb travel is generally much less than the level of service to Wilmington in terms of trip travel time. Markets Served Origin/Destination (O/D) data and transit share for the journey to work in New Castle County was available for 610 subareas (CTPP zones) in the Urban Element of the 1990 Census Transportation Planning Package (CTPP). In previous work by CADSR, GIS was used to aggregate O/D data from the CTPP zone level to the Census County Division (Planning District ) level to obtain a general idea of journey to work travel patterns. Examples of the results of this analysis are provided in Figures 99 and 100. Figure 99 shows where the larger markets for transit were in Transit share for those who live and work in Wilmington was approximately 11%, and represented almost a third of the total ridership for journey to work. Figure 100 shows areas that had a relatively larger number of workers but low transit share. A June 1997 on-board passenger survey for DART First State by Ilium Associates Inc. produced some interesting statistics about transit service. A portion of this information is provided in Figures 101 thru 104. There were 3853 surveys returned in New Castle County, 240 in Kent, 18 in Sussex, and 108 for Intercounty service. (Obviously with only 18 surveys in Sussex, there is a potential for large errors in figures for Sussex). New Castle County service had a large number of frequent users with 24% riding six days a week, and an additional 59% riding four or five days a week. Nearly half were using the service for five or more years. Transit is used primarily for work trips in New Castle County (60.8%). In Kent County, 61% are riding four or five days a week, and trip purpose was more balanced with a third using transit for shopping and only a third for work. 13 WILMAPCO Regional Transit Service Needs Study, Working Paper Number 3 * Morning peak and midday headways in minutes 47

59 Figure 98, Housing Densities in New Castle county with 1/4 mile Buffers around transit routes Census at the census block level. 48
60 Figure 99. CCD Origin/Destination Pairs with Total Workers Greater than 500 and 2% Transit Share or Better, Workers Who Do Not Work and Live in the Same CCD. Origin name Destination name Total Workers Transit Share (%) Kent Wilmington Wilmington Pike Creek Wilmington Piedmont Cecil Wilmington Wilmington Upper Christina Wilmington Greater Newark Wilmington New Castle New Jersey Wilmington Upper Christina Wilmington Wilmington Lower Christina Piedmont Wilmington Wilmington Brandywine Greater Newark Wilmington Lower Christina Wilmington Pike Creek Wilmington New Castle Wilmington Brandywine Wilmington TOTALS 54, Figure 100. CCD Origin/Destination Pairs, Total Workers Greater Than 2000 and Transit Share less than 2% Origin Destination Workers Transit share (%) Greater Newark New Castle Pike Creek Upper Christina Central Pencader Greater Newark Brandywine Lower Christina Lower Christina Brandywine Pike Creek Greater Newark Greater Newark Lower Christina Chester County Brandywine Upper Christina Greater Newark Delaware County Wilmington Delaware Brandywine Pike Creek Brandywine Pike Creek Lower Christina Greater Newark Brandywine New Castle Greater Newark Greater Newark Upper Christina Chester County Wilmington New Castle Lower Christina New Castle Upper Christina Figure 101. How Often Do You Use DART First State Service DART 1997 On-Board Survey, Ilium Associates, Inc. New Castle Kent Sussex Intercounty 6 days per week days per week days per week Less than once a week Figure 102. What is Purpose of This Transit Trip? DART 1997 On-Board Survey, Ilium Associates, Inc. New Castle Kent Sussex Intercounty Work
61 Social/Recreational Other Shopping School Medical/Dental Figure 103. How Long Have You Been Using DART First State Bus Service? DART 1997 On-Board Survey, Ilium Associates, Inc. New Castle Kent Sussex Intercounty Less than 1 year years years More than 5 years Figure 104. Time of Day For Boarding Transit DART 1997 On-Board Survey, Ilium Associates, Inc. New Castle County Kent County Before 6:00am 2% 1% 6:00 am to 9:00am 44% 26% 9:00 am to Noon 18% 27% Noon to 3:00pm 11% 13% 3:00pm to 6:00 pm 19% 11% After 6:00 pm 4% 1 The use of origin and destination information such as available in the 1990 CTPP is a valuable tool for locating markets for transit. In New Castle County, origin and destination information indicates a number of possible areas for transit development that include areas in and around western portions of Kirkwood Highway, Chestnut Hill Road south of Newark, Milltown Road, northern portions around the City of New Castle, and lower portions of Route 40. Suburban destinations involving thousands of workers such as Zeneca/Dupont, East Newark, and Newport/Boxwood are shown as areas that transit service may better reach. Service to the suburbs Review of CTPP data clearly showed how much of the journey to work market was based in the suburbs. Over 50% of the journey to work market is in suburb to suburb travel with a transit share on the average of less than 1%. About 90% of the journey to work market involves travel to or from a low density area. Figure 105. Travel Between Wilmington, New Castle County Suburbs and Neighboring Counties For Those Who Work in New Castle County. Origin Destination % who work in NCC Transit Share % Neighboring Counties Wilmington 4 1 NCC not Wilm Wilmington
62 Wilmington Wilmington 7 11 Wilmington NCC not Wilm. 5 8 Neighboring Counties NCC not Wilm NCC not Wilm. NCC not Wilm Population and employment projections as presented in a later chapter of this report clearly show that practically all new development is taking place at moderate to low density suburban densities. Many higher density areas and urban areas are showing a population decline as housing stock and developable land is less available, and there is a continued decrease in persons per household. Figure 106. Population Estimates For The Year 2020 and Population Change Between Year 2020 and 2000 (DIF.) Source: DelDOT population projections 1999 Rural V.Low Low Medium H.Sub Urban DE Pop DE Dif to ,856 35,641 9,339 3, KC Dif to NC Dif 2000 to ,394 16, SC Dif 2000 to Low density development makes it very difficult to increase the use of alternative travel modes. A literature review conducted to determine the current understanding of transit service in the suburbs showed a recurring theme that successful transit service in the suburbs demands an understanding of travel patterns. A distinguishing feature of the more successful suburban transit services has been the service of hubs. Studies conducted as part of the Transit Cooperative Research Program have identified success factors and service strategies for the suburbs through case studies of transit agencies across the country. 14 Elements of success include 15 : Develop services around focal points (hubs/park and rides). Serve transit s more traditional markets Target markets appropriately. Services targeted to choice riders succeed only if appropriately supported and if they have a role to serve. Economize on expenses. Costs per trip must be kept down. Obtain private sector support. Direct marketing via representative personal contact with employers is essential. The private sector can support new service in a number of ways. Plan with the community. Best services are those initiated by transit operators working closely with the local community. Establish realistic goals, objectives, and standards. Measure implemented services against specific service criteria. 14 TCRP B-6:Improving Transit Connections for Enhanced Suburban Mobility, Draft Report-Guidelines for Enhancing Suburban Mobility Using Public Transportation, Transit Research Program, Transportation Research Board, by Urbitran Associates Inc, January 1997 and TCRP Synthesis 14, Innovative Suburb-to-Suburb Transit Practices, A Synthesis of Transit Practice, Transit Cooperative Research Program, Transportation Research Board, TCRP B-6, pgs and TCRP Synthesis 14, pgs
63 Develop supportive policies, plans, and regulations (i.e. land use policies, parking fees, mandatory auto-occupancy, etc.) Adapt vehicle fleets to customer demand. Distribute transit information to offset poor visibility of service in low density areas. Pursue opportunities for Park and Rides. Offer safe, sheltered stops. Guaranteed ride home programs contribute to success. Service Within Local Neighborhoods The analysis of origin/destination data suggested areas where there were a large number of workers and very low transit share. One such area was the Pike Creek area in New Castle County that would be classified here as a medium density suburb with a very low amount of interconnection between housing developments. To get a better understanding of the feasibility of serving such areas with fixed transit, housing units were accurately located at the tax parcel level, and optimum routing algorithms available in GIS were used to determine the length and duration of routes to reach the largest number of housing units within a 6 minute walk of potential transit stops. The results of this exercise are shown in Figures 107 and 108 for one traffic zone in the Pike Creek area. To reach only about 30% of the housing units by fixed transit, it was estimated to take at least 30 minutes of circulation time plus the time to make the stop. This would mean that a transit trip to Wilmington, for instance, would be twice as long by transit as by private auto. There are about 4,000 workers total in this area. About 800 (20%) of these work in Wilmington. If only 30% were reached by transit that would be 240 workers to be reached. If 10% would use transit (the 1990 transit share to Wilmington for the Pike Creek Planning District is just under 5%) then one would be designing the route during peak times to serve about 25 people and a percentage of these would not want to leave at the same time. These are rough (though generous) figures but they illustrate how costly and impractical direct fixed route transit service could be to reach larger numbers of workers in medium and lower suburban densities even for service to a major urban area. Four thousand workers in such an area sounds at first like a large number but by the time the number gets thinned as to how many that service can reach, the number of destinations that people desire to travel to, and the number of people that will use transit the actual market that can be reached gets rather small. Use of park and rides and a hub based routing strategy are necessary as the circulation time to collect passengers is too long. In the Pike Creek area just mentioned, the local park and ride (Faith Baptist Church) accounts for almost 70% of the morning transit ridership. The primary route doesn't just serve Pike Creek and Wilmington, but also places in between. In areas where there is not a large percentage of workers going to the same destination, where parking is free at work, and where average trip times to work are less than 20 minutes as with most of Delaware, the situation is far worse. As development moves to lower density, less developed areas, there are not large populations that can be served within the route. Figure
64 % "Housing Units" Within 6 Minute Walk vs. Number of Local Stops 100 Traffic Zone N146 % Housing Units in Zone Number of Local Stops * Assumes Walking Speed of 2 MPH DRAFT Jan 1997 Figure 108 Demand Reached and Collector Miles Traveled By Number of Local Stops in Traffic Zone N146 Number of Stops Housing Units Within 6 Min. Walk Circuit Miles Circuit Travel Time* 28 minutes + stop time minutes minutes minutes minutes minutes + * Assumes Avg. Speed of 25MPH Circuit Includes Stops at Poly Drummand Shopping Center and Pike Creek Office Campus (PR) 53
65 Where People Live and Travel in Delaware Introduction The DelDOT Travel Demand Forecasting Model (Forecasting Model) produces a number of outputs as to where people travel in Delaware and the expected volumes that result on the roads. The Forecasting Model is primarily based on gravity models but numerous adjustments over the years have been made to calibrate the model to provide outputs that are in line with measured traffic volumes, origin and destination data available from the CTPP, and knowledge of the transportation system. The 1990 Census Transportation Planning Package (CTPP) also provides information about travel in Delaware. The Urban Element of the CTPP provides detailed information about where people in Delaware live and work at the State, County, and Planning District levels. For portions of northern Delaware, detailed travel data is available at the traffic zone level as was derived from the 14% sample (long form) of the 1990 Census. Together the Forecasting Model and the CTPP provide a wealth of information to support an understanding of travel in Delaware. This section examines origins and destinations for various purposes and what we know about the usage of the transportation system. Journey to Work at the County Level Figure 109 provides the 1990 CTTP estimates of county to county origins and destinations. Other figures that are available from the CTPP indicate that 13% (46,669) of the 348,428 people who worked in Delaware came into Delaware from other states. Cecil County supplied the most with 10,892 workers, but Chester County, PA, and Delaware County, PA are close with 10,354 and 7,556 workers respectively. Other large contributors in 1990 are Salem County, NJ (3,098), Philadelphia County, PA (1,158) and Gloucester County, NJ (1,029). There were 30,225 Delawareans estimated to leave the state on the journey to work so there was estimated to be a net in-migration of 16,000 workers. Workers leaving the state are primarily headed to Pennsylvania with 6,188 headed for Delaware County, 3514 for Chester County, and 4,697 for Philadelphia County. There were 2,142 going to Cecil County, MD, 2,630 to Wicomico County, MD, 1,716 for Worchester County, MD, and 1,724 on their way to Salem County, NJ. In 1990 Kent County was a net exporter of workers since 7,769 go to work in New Castle or Sussex counties and only 5,773 come into Kent from elsewhere in Delaware. Sussex County is a net exporter of workers but only by about 500 with most of them going to Kent County. Mode of travel and travel times from the CTPP for the journey to work have been presented in the previous chapter. 54
66 Figure Journey to Work by Origin and Destination Place of Work Place of Residence Kent New Castle Sussex Cecil Other At Home Total Kent 43,512 4,307 3, ,834 1,553 54,697 New Castle 2, , ,104 22,043 4, ,644 Sussex 3, , ,348 2,114 51,785 Cecil 62 10, ,018 6, ,700 Outside 1,812 29,849 4,116 3,233 n/a n/a 39,010 Work at Home 1,553 4,313 2, n/a n/a 8,898 Total 52, ,552 49,164 22,311 37,097 8, ,734 Source: Center for Applied Demography and Survey Research, University of Delaware US Bureau of Census Journey to Work at the Census County Division Level A next level of detail to examine journey to work origins and destinations is the Census County Division (CCD) sometimes referred to as Planning Districts. Summary figures by CCD for New Castle County are available through the CTPP. Figure 111 shows the total number of workers for each CCD in New Castle County and the percentage of those workers who live and work in each CCD. A similar table was produced for Kent and Sussex counties using DelDOT Travel Demand Forecasting data. The jobs per population figures give an idea as to the degree of mixed land use within the CCD. In New Castle County the urban areas of Wilmington and Newark have large numbers of jobs and a larger percentage of people who live and work in the area. The Brandywine CCD which is relatively older development has the largest population, highest density, and largest number of jobs for a suburban area in New Castle County. A little less than a third of the people in the Brandywine CCD live and work there. Other suburban CCD's have less jobs, less population, less density, and about 20% or less people who live and work in the area. The Upper Christina CCD that includes Churchman's Crossing, the Christiana Hospital, and large financial institutions is an example of relatively new residential and employment development. While the number of jobs is roughly equal to the population, only about 16% of the people live and work there. Simply having a large number of jobs relative to population in a local area doesn't mean that large percentages of those living there will work there. The costs and styles of housing units might not be appropriate for those workers, for example. Kent and Sussex counties show a different picture. Development is at a much lower density and activity is centered around the towns. People tend to live and work in the same local area. Figures show that 89% of the workers who live in the Dover CCD work there. In Sussex the 55
67 largest job CCD's are Lewes, Seaford, and Selbyville-Frankford, all of which have 69% or greater of the resident workers employed there. Figure 110. New Castle County Census County Divisions Piedmont Brandywine Pike Creek Newark Central Pencador New Castle Red Lion Wilmington Lower Christina Upper Christina 2000 Persons per sq.mile (modgrid) MOT Smyrna New Castle County Census County Divisions Figure 111. Total Workers by Census County Division in New Castle, Delaware and Total Workers Who Live and Work in the Same CTPP, (1990 data) CCD Destination Population Workers jobs/pop Jobs %workers 1990 Live and work here Red Lion % Central Pencader MOT Piedmont Pike Creek Upper Christina New Castle Lower Christina Greater Newark Brandywine Wilmington
68 Figure 112. Kent County CCD's and densities Smyrna Kenton Dover Central Kent Felton Milford North 2000 Persons per sq.mile (modgrid) Harrington Milford South Bridgeville-Greenwood Milton Georgetown Seaford Millsboro Lewis Laurel-Delmar Selbyville-Frankford Census County Divisions in Kent And Sussex Counties Figure 113. Total Workers by Census County Division in Kent County, Delaware And Total Workers Who Live and Work in the Same CCD, (number of workers as predicted by the DelDOT 1998 Travel Demand Forecasting Model CCD Destination 1990 Population Workers Jobs/Pop90 Jobs %workers live KENT COUNTY and work here Kenton % Felton Central Kent Harrington Smyrna Milford North Dover SUSSEX COUNTY Milton % BridgevilleGreenwood Millsboro Georgetown Laurel-Delmar Milford South Lewes Seaford Selbyville-Frankford
69 Examining the journey to work flows between CCD's provides a more complete picture. Journey to work origin/destination pairs involving 1500 or more workers at the CCD level for New Castle County are presented in Figure 115 on the next page. Scanning the table it is clear that the largest flows are into Wilmington or where the origin and destination are the same. One way to picture this better is as in Figure 114 below that shows CCD flows with 1500 or greater workers. This diagram illustrates the large flows into Wilmington and to a lesser extent Brandywine. Figure 114. New Castle County CCD Work Flows Piedmont Brandywine Pike Creek Wilmington Lower Christina Greater Newark Upper Christina Central Pencador MOT Red Lion New Castle CCD to CCD Flows Internal work trips New Castle County Journey to Work Flows by Census County Division (1990 CTPP) Because of the lower populations, no CCD origin/destination pair greater that 1,500 involving travel from MOT or Red Lion, and only one (to Newark) for Central Pencader, flows from these areas are not shown in Figure 114. As there is increasing development in these areas, it is interesting to see what the numbers are. Figures 116 and 117 show journey to work destinations for MOT and Central Pencader. It is clear from these figures that those workers in these southern areas of New Castle County are spread fairly evenly across northern employment areas with slightly more going to the Newark CCD. Figure 115. JTW Origin and Destinations at the Census Planning 58
70 Division Level for Census County Divisions in New Castle County. Total Workers Greater Than (Source: 1990 CTPP) Origin Destination Number of Workers Wilmington Greater Newark 1510 Pike Creek New Castle 1517 Lower Christina Upper Christina 1601 Chester Greater Newark 1636 Wilmington New Castle 1661 Brandywine New Castle 1781 New Jersey Wilmington 1874 Brandywine Upper Christina 1937 Pike Creek Pike Creek 1954 Greater Newark New Castle 2010 Pike Creek Upper Christina 2075 Central Pencader Greater Newark 2114 Upper Christina Upper Christina 2122 Brandywine Lower Christina 2147 Lower Christina Brandywine 2209 Pike Creek Greater Newark 2231 Greater Newark Lower Christina 2260 Brandywine Philadelphia County 2284 Chester Brandywine 2290 Upper Christina Wilmington 2360 Wilmington Lower Christina 2368 Upper Christina Greater Newark 2385 Delaware County Wilmington 2463 Delaware County Brandywine 2507 Pike Creek Brandywine 2524 Pike Creek Lower Christina 2626 Greater Newark Brandywine 2822 New Castle Greater Newark 2886 Greater Newark Upper Christina 3150 Chester County Wilmington 3168 New Castle Lower Christina 3185 Piedmont Wilmington 3473 Brandywine Delaware County 3545 Lower Christina Lower Christina 3664 Wilmington Brandywine 3944 Cecil Greater Newark 3984 New Castle Upper Christina 4142 Greater Newark Wilmington 4144 New Castle Brandywine 4165 Lower Christina Wilmington 4832 Pike Creek Wilmington 4900 New Castle New Castle 7267 New Castle Wilmington 7359 Brandywine Wilmington Brandywine Brandywine Greater Newark Greater Newark Wilmington Wilmington
71 Figure 116. CCD Work Destinations From the MOT Area (1990 CTPP) Census County Division Workers Central Pencador 103 Red Lion 105 Pike Creek 129 New Jersey 131 Piedmont 146 Cecil County 193 Lower Christina 722 Wilmington 785 Upper Christina 807 Brandywine 855 New Castle 875 Greater Newark 938 Kent County 987 MOT 1235 Figure 117. CCD Work Destinations From the Central Pencador Area (1990 CTPP) Census County Division Workers Delaware County 102 Red Lion 106 Kent 117 New Jersey 142 Philadelphia 153 Cecil County 262 Central Pencador 334 Pike Creek 340 Piedmont 410 Lower Christina 824 New Castle 851 Brandywine 1078 Upper Christina 1160 Wilmington 1389 Greater Newark
72 Figure 118. Kent and Sussex County Journey to Work Flows Smyrna Kenton Dover Central Kent Felton Millford North Harrington Milford South BridgevilleGreenwood Milton Lewis Georgetown Seaford Millsboro Work trips between CCD's Internal work trips Laurel-Delmar Selbyville-Frankford Kent and Sussex County Journey to Work Travel Flows By CCD (DelDOT TDFM) The primary source of origin and destination information in Kent and Sussex counties is the DelDOT Travel Demand Forecasting Model (TDFM). The CTPP does not address these areas and the ongoing DelDOT Household Survey still as yet does not have enough observations to sufficiently present travel flows. Output from this model was used to create Figure 118 above, that shows how employment is centered at Dover with over 8 times the employment of any other CCD in Kent County. Just over 70% of the workers living in Central Kent and Kenton CCD's are employed in Dover. For Smyrna, 60% of the workers work in Dover and for Felton the figure is about 54%. Large percentages of workers in northern Sussex also travel to Dover. In southern Sussex County, journey to work is focused on the CCD's with the greatest employment, Seaford, Lewes, and Selbyville-Frankford. Kenton, Felton, and Central Kent in Kent County and Milton, Bridgeville-Greenwood, Millsboro and Laurel-Delmar with their very low percentage of jobs with respect to their populations all could be considered "bedroom communities". The longer travel distances in Kent and Sussex counties all involve travel to Dover. Figures show that for employment centers in Sussex, workers tend to live closer to where they work. Tabulation of CCD origin and destination figures for the journey to work for pairs with 1000 or more workers is provided in Figure 119. Figure 119. Kent /Sussex Journey to Work by CCD 61
73 Daily Work Trip Estimate, Workers gt 1000 Source DelDOT TDFM 1998 ORIGIN DESTINATION Number of Workers Milford South Dover 1043 Harrington Dover 1058 Milford South Milford South 1072 Felton Dover 1157 Milford South Milford North 1181 Millsboro Selbyville-Frankford 1192 Milton Lewes 1278 Smyrna Smyrna 1360 Millsboro Lewis 1378 Kenton Dover 1397 Laurel-Delmar Laurel-Delmar 1733 Laurel-Delmar Seaford 2025 Smyrna Dover 2394 Lewes Lewes 3300 Central Kent Dover 3643 Seaford Seaford 3780 Selbyville-Frankford Selbyville-Frankford 4115 Dover Dover Shopping Trips at the CCD Level The DelDOT Travel Demand Forecasting Model also predicts the number of daily trips to and from all traffic zones. Figure 120 below tabulates the number of shopping trips attracted and produced from each CCD. Brandywine is the destination of the most shopping trips, followed by Upper Christina. By looking at the ratio of attractions to productions, the general character of the areas can be seen. The Upper Christina CCD, that includes a large regional mall with over three times as many shopping trips attracted as produced is clearly a commercial center. Wilmington, while a job center and the largest, most dense urban area in Delaware, produces more than twice as many shopping trips as it attracts. Central Pencader and MOT, which are the areas that are developing the fastest over the coming years are seen as primarily residential areas with very little shopping occurring within them. This as shown earlier is also true of jobs. Central Pencader and MOT had a jobs to population ratio of only These areas may eventually have the population to encourage commercial development, but not now. At the CCD level, development is not occurring in a mixed use fashion and it would be expected that those living in these areas would need to drive more for work and shopping. Areas of older development in Brandywine, greater Newark, and New Castle, on the other hand, attract and produce closer to the same number of shopping trips and are focuses of a large amount of commercial activity. Figure 120. Estimates of Daily Shopping Trips, Productions and Attractions at the CCD Level in New Castle County. Source: DelDOT TDFM 1996 Census County Division Trips Attracted Trips Produced Attrac/Prod Red Lion Central Pencader MOT Piedmont Wilmington Pike Creek Lower Christina New Castle Greater Newark Upper Christina Brandywine Figure 121. Shopping Trip Flows in New Castle County Source: DelDOT TDF Model,
74 Shopping Trips Internal CCD Shopping Trips New Castle Shopping Flows Daily Estimates from DelDOT 1996 TDFM In Kent and Sussex counties the shopping flows are similar to that for the journey to work, the complete dominance of the Dover area in Kent, and to a lesser extent the Selbyville-Frankford area in Sussex. Again for the most part, those areas that have the least commercial activity and jobs are those that are expected to see the fastest growth in residential development. Figure 122. Estimates of Daily Shopping Trips, Productions and Attractions at the CCD Level in Kent and Sussex Counties Source: DelDOT TDFM 1996 Census County Division Trips Attracted Trips Produced Attrac/Prod (%) BridgevilleGreenwood Milton Kenton Felton Milford South Georgetown Central Kent Seaford Millsboro Milford North Smyrna Laurel-Delmar Harrington Lewes Selbyville-Frankford Dover Figure 123. Kent and Sussex Shopping Flows Source: DelDOT TDF Model
75 Kenton Dover Central Kent Millford North Felton Harrington Milford South BridgevilleGreenwood Milton Georgetown Lewis Seaford Millsboro Shopping Trips Internal Shopping Trips Laurel-Delmar Selbyville-Frankford Kent and Sussex Shopping Flows Daily Estimates from DelDOT 1999 TDFM Home Based Other The DelDOT Travel Demand Forecasting Model also includes estimates of Home Based Other trips, trips that are not work or shopping related. Figures 124 thru 125 below show some of this data. Home Based Other Trips are predicted to be much more balanced across CCD's than for work or shopping. Each CCD attracts a similar share of these trips relative to their populations. This is especially true for Kent and Sussex where productions and attractions are roughly equal for all CCD's. It's also interesting to note that close to 50% of shopping and home based other trips originate and end in the same CCD. For work trips only about 25% of workers live and work in the same CCD. Figure 124. Estimates of Daily Home Based Other Trips, Productions and Attractions at the CCD Level in New Castle County Source: DelDOT TDFM
76 Census County Division Trips Attracted Trips Produced Attrac/Prod% Red Lion MOT Central Pencader Piedmont Upper Christina Lower Christina Pike Creek New Castle Greater Newark Brandywine Wilmington Figure 125. Estimates of Daily Home Based Other Trips, Productions and Attractions at the CCD Level in Kent and Sussex Counties Source: DelDOT TDFM 1996 Census County Division Trips Attracted Trips Produced Attrac/Prod (%) Kenton BridgevilleGreenwood Felton Milton Georgetown Central Kent Milford North Millsboro Harrington Milford South Smyrna Laurel-Delmar Seaford Lewes Selbyville-Frankford Dover Origins and destinations for smaller areas Predicting flows between smaller areas requires much more data. The DelDOT Household Survey does not have sufficient data to estimate flows between areas as small as a traffic zone. Estimates of trips taken between traffic zones resulting from trip generation and gravity models are made using the DelDOT Travel Demand Forecasting Model, and these are useful for general planning particularly when numbers are calibrated to known traffic counts. The 1990 CTPP is based on the long form captured journey to work data for areas smaller than the DelDOT traffic zones, and provides a great resource to study transportation patterns. Using the CTPP data, total workers and transit share for the journey to work was tabulated from aggregations of DELDOT Traffic Zones for the largest 50 origins and 25 destinations using the data from the 1990 CTPP. These orgins and destinations are shown in Figures 126 and 127 on the next two pages. Figure 126. Origin Places in New Castle County 65
77 Figure 127. Destination Places in New Castle County 66
78 As seen when the data was viewed at the Census County Division level, the greatest share of transit riders involves Wilmington as a destination. Figure 128 shows where transit is most successful. Higher density and lower income areas are represented in Figure 128, but there are some lower density, more affluent areas which show a good transit share such as West Pike Creek, Arden, DuPont Country Club/ Rt202, and S. Silverside / Rt.202. Areas where transit share is between 5 and 10% mostly serve Wilmington. Figure 128. Total Workers Greater Than 200 and Share 10% or More 1990 CTPP 67
79 ORIGIN DESTINATION WORKERS RIDERS TRANSIT SHARE % Upper Washington St. Wilmington Washington St. East of Newark West Newark Wilmington Arden Area Wilmington Newport Wilmington West Pike Creek Wilmington Maryland Ave Wilmington DuPont CC / 202 Wilmington West Wilmington Wilmington Delaware Ave Wilmington Washington St. Delaware Ave Elsmere Wilmington Brandywine Twn Cntr Wilmington Browntown Wilmington City of New Castle Wilmington East Naamans Wilmington Bellevue Wilmington S.Silverside/E.202 Wilmington Minquedale Wilmington Washington St. Wilmington North East Blvd. Wilmington An illustrative way of viewing New Castle County journey to work patterns is as an origin/destination table as shown in Figure 132. Numbers are shown for all pairs which involve 70 or more workers. The Wilmington Central Business District is the largest destination for almost all origins. Many of the OD pairs which involve larger numbers of workers are where the origin area and destination area are the same, or nearby. Figure 129. Total workers greater than 200 and 5% <= share < 10% 1990 CTPP ORIGIN DESTINATION WORKERS RIDERS TRANSIT SHARE Elsmere Christiana Mall Concord Pike Wilmington Central Wilmington West Wilmington Washington Street West Wilmington Washington Street Newport/Boxwood Christiana Mall Wilmington LancastePk/ColHghts Wilmington MBNA Wilmington ChristianaRD/S.Arprt Wilmington NW Millcreek Hund. Wilmington Shipley/Grubb Rds. Wilmington Upper Foulk Wilmington East Pike Creek Wilmington Harvey/PhilPK/Claymnt Wilmington Rt.40 near Smalleys Wilmington Chestnut Hill E./Chry Wilmington North of City of NC Wilmington Central Wilmington Wilmington Figure 130. Total Workers ge 300 and Share lt 5% 68
80 1990 CTPP ORIGIN DESTINATION WORKERS BUS SHARE (%) Sth.Central Kirkwood Wilmington W.Kirkwood Barley Mill Plaza North of City of NC Harmony Road Harmony Road Newark Albertson Park Wilmington North of City of NC Newark Chestnut Hill E./Chry Newport/Boxwood West Kirkwood Elsmere Hockessin Wilmington Newark East of Newark Chestnut Hill E./Chry West Kirkwood Hy West Kirkwood Christiana Mall North of City of NC Newport/Boxwood Upper Foulk Zeneca/DuPont Chestnut Hill E. Harmony Road Chestnut Hill E. Zeneca/DuPont Harvey/PhilPk/Clymnt Zeneca/DuPont Chestnut Hill E. MBNA North of City of NC City of New Castle West Kirkwood Newport/Boxwood Delaware Ave Delaware Avenue North of City of NCC Airport Indust Park Newport Newport/Boxwood North of City of NCC NC Commons/Airprt Elsmere Elsmere Chestnut Hill E./Chry East of Newark West Kirkwood Zeneca/DuPont Rt.40 West of Rt 7 Wilmington North of Newark Newark Lower Rt. 40 East of Newark West Wilmington West Wilmington West Kirkwood West Kirkwood Baltimore Pike Wilmington Lower Rt.40 Wilmington Milltown Road Wilmington ChestnutHillE.Chry ChestnutHillE.Chry WestKirkwood Newark West of Newark Newark West Kirkwood Wilmington ChestnutHillE.Chry Newark Newark Newark Figure 131. JTW Flows Between New Castle County Places 69
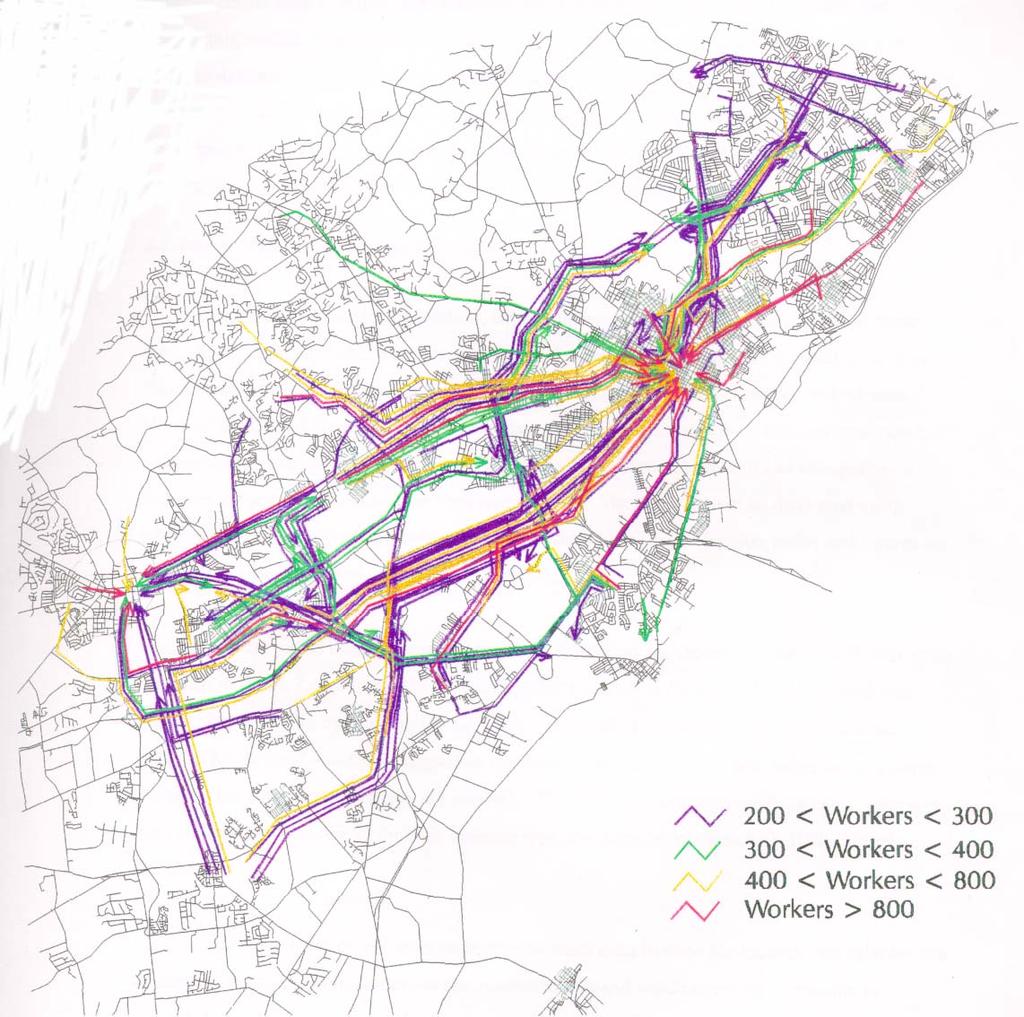
81 70
Figure 8.2a Variation of suburban character, transit access and pedestrian accessibility by TAZ label in the study area
 Figure 8.2a Variation of suburban character, transit access and pedestrian accessibility by TAZ label in the study area Figure 8.2b Variation of suburban character, commercial residential balance and mix
Travel behavior of low-income residents: Studying two contrasting locations in the city of Chennai, India
 Travel behavior of low-income residents: Studying two contrasting locations in the city of Chennai, India Sumeeta Srinivasan Peter Rogers TRB Annual Meet, Washington D.C. January 2003 Environmental Systems,
GIS Analysis of Crenshaw/LAX Line
 PDD 631 Geographic Information Systems for Public Policy, Planning & Development GIS Analysis of Crenshaw/LAX Line Biying Zhao 6679361256 Professor Barry Waite and Bonnie Shrewsbury May 12 th, 2015 Introduction
Mapping Accessibility Over Time
 Journal of Maps, 2006, 76-87 Mapping Accessibility Over Time AHMED EL-GENEIDY and DAVID LEVINSON University of Minnesota, 500 Pillsbury Drive S.E., Minneapolis, MN 55455, USA; geneidy@umn.edu (Received
StanCOG Transportation Model Program. General Summary
 StanCOG Transportation Model Program Adopted By the StanCOG Policy Board March 17, 2010 What are Transportation Models? General Summary Transportation Models are technical planning and decision support
BROOKINGS May
 Appendix 1. Technical Methodology This study combines detailed data on transit systems, demographics, and employment to determine the accessibility of jobs via transit within and across the country s 100
Typical information required from the data collection can be grouped into four categories, enumerated as below.
 Chapter 6 Data Collection 6.1 Overview The four-stage modeling, an important tool for forecasting future demand and performance of a transportation system, was developed for evaluating large-scale infrastructure
Assessing spatial distribution and variability of destinations in inner-city Sydney from travel diary and smartphone location data
 Assessing spatial distribution and variability of destinations in inner-city Sydney from travel diary and smartphone location data Richard B. Ellison 1, Adrian B. Ellison 1 and Stephen P. Greaves 1 1 Institute
Data Collection. Lecture Notes in Transportation Systems Engineering. Prof. Tom V. Mathew. 1 Overview 1
 Data Collection Lecture Notes in Transportation Systems Engineering Prof. Tom V. Mathew Contents 1 Overview 1 2 Survey design 2 2.1 Information needed................................. 2 2.2 Study area.....................................
MULTIPLE CHOICE. Choose the one alternative that best completes the statement or answers the question.
 AP Test 13 Review Name MULTIPLE CHOICE. Choose the one alternative that best completes the statement or answers the question. 1) Compared to the United States, poor families in European cities are more
Regional Performance Measures
 G Performance Measures Regional Performance Measures Introduction This appendix highlights the performance of the MTP/SCS for 2035. The performance of the Revenue Constrained network also is compared to
HORIZON 2030: Land Use & Transportation November 2005
 PROJECTS Land Use An important component of the Horizon transportation planning process involved reviewing the area s comprehensive land use plans to ensure consistency between them and the longrange transportation
The effects of impact fees on urban form and congestion in Florida
 The effects of impact fees on urban form and congestion in Florida Principal Investigators: Andres G. Blanco Ruth Steiner Presenters: Hyungchul Chung Jeongseob Kim Urban and Regional Planning Contents
Frequently Asked Questions
 What is the Regional Transit Engagement Series? As one of the fastest growing regions in the country, there is recognition that long-term transit planning efforts should be accelerated if we are to remain
Regional Performance Measures
 G Performance Measures Regional Performance Measures Introduction This appendix highlights the performance of the MTP/SCS for 2035. The performance of the Revenue Constrained network also is compared to
Employment Decentralization and Commuting in U.S. Metropolitan Areas. Symposium on the Work of Leon Moses
 Employment Decentralization and Commuting in U.S. Metropolitan Areas Alex Anas Professor of Economics University at Buffalo Symposium on the Work of Leon Moses February 7, 2014 9:30-11:15am, and 2:30-4:30pm
Regional Snapshot Series: Transportation and Transit. Commuting and Places of Work in the Fraser Valley Regional District
 Regional Snapshot Series: Transportation and Transit Commuting and Places of Work in the Fraser Valley Regional District TABLE OF CONTENTS Complete Communities Daily Trips Live/Work Ratio Commuting Local
THE FUTURE OF FORECASTING AT METROPOLITAN COUNCIL. CTS Research Conference May 23, 2012
 THE FUTURE OF FORECASTING AT METROPOLITAN COUNCIL CTS Research Conference May 23, 2012 Metropolitan Council forecasts Regional planning agency and MPO for Twin Cities metropolitan area Operates regional
Urban Planning Word Search Level 1
 Urban Planning Word Search Level 1 B C P U E C O S Y S T E M P A R E U O E U R B A N P L A N N E R T N S T D H E C O U N T Y G E R E R D W R E N I C I T Y C O U N C I L A A A S U G G C I L A G P R I R
SPACE-TIME ACCESSIBILITY MEASURES FOR EVALUATING MOBILITY-RELATED SOCIAL EXCLUSION OF THE ELDERLY
 SPACE-TIME ACCESSIBILITY MEASURES FOR EVALUATING MOBILITY-RELATED SOCIAL EXCLUSION OF THE ELDERLY Izumiyama, Hiroshi Institute of Environmental Studies, The University of Tokyo, Tokyo, Japan Email: izumiyama@ut.t.u-tokyo.ac.jp
Analysis and Design of Urban Transportation Network for Pyi Gyi Ta Gon Township PHOO PWINT ZAN 1, DR. NILAR AYE 2
 www.semargroup.org, www.ijsetr.com ISSN 2319-8885 Vol.03,Issue.10 May-2014, Pages:2058-2063 Analysis and Design of Urban Transportation Network for Pyi Gyi Ta Gon Township PHOO PWINT ZAN 1, DR. NILAR AYE
THE LEGACY OF DUBLIN S HOUSING BOOM AND THE IMPACT ON COMMUTING
 Proceedings ITRN2014 4-5th September, Caulfield and Ahern: The Legacy of Dublin s housing boom and the impact on commuting THE LEGACY OF DUBLIN S HOUSING BOOM AND THE IMPACT ON COMMUTING Brian Caulfield
Social Studies Grade 2 - Building a Society
 Social Studies Grade 2 - Building a Society Description The second grade curriculum provides students with a broad view of the political units around them, specifically their town, state, and country.
Understanding Land Use and Walk Behavior in Utah
 Understanding Land Use and Walk Behavior in Utah 15 th TRB National Transportation Planning Applications Conference Callie New GIS Analyst + Planner STUDY AREA STUDY AREA 11 statistical areas (2010 census)
Geospatial Analysis of Job-Housing Mismatch Using ArcGIS and Python
 Geospatial Analysis of Job-Housing Mismatch Using ArcGIS and Python 2016 ESRI User Conference June 29, 2016 San Diego, CA Jung Seo, Frank Wen, Simon Choi and Tom Vo, Research & Analysis Southern California
Regional Transit Development Plan Strategic Corridors Analysis. Employment Access and Commuting Patterns Analysis. (Draft)
") Regional Transit Development Plan Strategic Corridors Analysis Employment Access and Commuting Patterns Analysis (Draft) April 2010 Contents 1.0 INTRODUCTION... 4 1.1 Overview and Data Sources... 4 1.2
Regional Transit Development Plan Strategic Corridors Analysis Employment Access and Commuting Patterns Analysis (Draft) April 2010 Contents 1.0 INTRODUCTION... 4 1.1 Overview and Data Sources... 4 1.2
Susan Clark NRS 509 Nov. 29, 2005
 Susan Clark NRS 509 Nov. 29, 2005 The original intent of this project was to look at the role of GIS in the inventory of bicycle and pedestrian facilities. The research, however, indicates a different
East Bay BRT. Planning for Bus Rapid Transit
 East Bay BRT Planning for Bus Rapid Transit Regional Vision Draper Prison The Bottleneck is a State-Level issue, Salt Lake County 2050 Population: 1.5M Draper Prison hopefully with some State-Level funding!
Trip Generation Model Development for Albany
 Trip Generation Model Development for Albany Hui (Clare) Yu Department for Planning and Infrastructure Email: hui.yu@dpi.wa.gov.au and Peter Lawrence Department for Planning and Infrastructure Email: lawrence.peter@dpi.wa.gov.au
Forecasts for the Reston/Dulles Rail Corridor and Route 28 Corridor 2010 to 2050
 George Mason University Center for Regional Analysis Forecasts for the Reston/Dulles Rail Corridor and Route 28 Corridor 21 to 25 Prepared for the Fairfax County Department of Planning and Zoning Lisa
= 5342 words + 5 tables + 2 figures (250 words each) = 7092 words
 = 7092 words") Influence of Neighborhood Types on Trip Distances A Case Study of Central Ohio Gulsah Akar, PhD (Corresponding Author) Assistant Professor City and Regional Planning Knowlton School of Architecture The
Influence of Neighborhood Types on Trip Distances A Case Study of Central Ohio Gulsah Akar, PhD (Corresponding Author) Assistant Professor City and Regional Planning Knowlton School of Architecture The
Appendixx C Travel Demand Model Development and Forecasting Lubbock Outer Route Study June 2014
 Appendix C Travel Demand Model Development and Forecasting Lubbock Outer Route Study June 2014 CONTENTS List of Figures-... 3 List of Tables... 4 Introduction... 1 Application of the Lubbock Travel Demand
Analysis of travel-to-work patterns and the identification and classification of REDZs
 Analysis of travel-to-work patterns and the identification and classification of REDZs Dr David Meredith, Teagasc, Spatial Analysis Unit, Rural Economy Development Programme, Ashtown, Dublin 15. david.meredith@teagasc.ie
URBAN TRANSPORTATION SYSTEM (ASSIGNMENT)
") BRANCH : CIVIL ENGINEERING SEMESTER : 6th Assignment-1 CHAPTER-1 URBANIZATION 1. What is Urbanization? Explain by drawing Urbanization cycle. 2. What is urban agglomeration? 3. Explain Urban Class Groups.
BRANCH : CIVIL ENGINEERING SEMESTER : 6th Assignment-1 CHAPTER-1 URBANIZATION 1. What is Urbanization? Explain by drawing Urbanization cycle. 2. What is urban agglomeration? 3. Explain Urban Class Groups.
Study Overview. the nassau hub study. The Nassau Hub
 Livable Communities through Sustainable Transportation the nassau hub study AlternativeS analysis / environmental impact statement The Nassau Hub Study Overview Nassau County has initiated the preparation
Environmental Analysis, Chapter 4 Consequences, and Mitigation
 Environmental Analysis, Chapter 4 4.17 Environmental Justice This section summarizes the potential impacts described in Chapter 3, Transportation Impacts and Mitigation, and other sections of Chapter 4,
Speakers: Jeff Price, Federal Transit Administration Linda Young, Center for Neighborhood Technology Sofia Becker, Center for Neighborhood Technology
 Speakers: Jeff Price, Federal Transit Administration Linda Young, Center for Neighborhood Technology Sofia Becker, Center for Neighborhood Technology Peter Haas, Center for Neighborhood Technology Craig
Leveraging Urban Mobility Strategies to Improve Accessibility and Productivity of Cities
 Leveraging Urban Mobility Strategies to Improve Accessibility and Productivity of Cities Aiga Stokenberga World Bank GPSC African Regional Workshop May 15, 2018 Roadmap 1. Africa s urbanization and its
Alternatives Analysis
 Alternatives Analysis Prepared for: Metropolitan Atlanta Rapid Transit Authority Prepared by: AECOM/Jacobs-JJG Joint Venture Atlanta, GA November 2012 Page Left Intentionally Blank ii TABLE OF CONTENTS
Encapsulating Urban Traffic Rhythms into Road Networks
 Encapsulating Urban Traffic Rhythms into Road Networks Junjie Wang +, Dong Wei +, Kun He, Hang Gong, Pu Wang * School of Traffic and Transportation Engineering, Central South University, Changsha, Hunan,
Traffic Demand Forecast
 Chapter 5 Traffic Demand Forecast One of the important objectives of traffic demand forecast in a transportation master plan study is to examine the concepts and policies in proposed plans by numerically
Land Use Advisory Committee. Updating the Transit Market Areas
 Land Use Advisory Committee Updating the Transit Market Areas March 20, 2014 Agenda Transit Market Areas Purpose of Transit Market Areas Transit Market Index Current Market Area boundaries Updating the
The Spatial Structure of Cities: International Examples of the Interaction of Government, Topography and Markets
 Module 2: Spatial Analysis and Urban Land Planning The Spatial Structure of Cities: International Examples of the Interaction of Government, Topography and Markets Alain Bertaud Urbanist Summary What are
Subject: Note on spatial issues in Urban South Africa From: Alain Bertaud Date: Oct 7, A. Spatial issues
 Page 1 of 6 Subject: Note on spatial issues in Urban South Africa From: Alain Bertaud Date: Oct 7, 2009 A. Spatial issues 1. Spatial issues and the South African economy Spatial concentration of economic
Can Public Transport Infrastructure Relieve Spatial Mismatch?
 Can Public Transport Infrastructure Relieve Spatial Mismatch? Evidence from Recent Light Rail Extensions Kilian Heilmann University of California San Diego April 20, 2015 Motivation Paradox: Even though
Spatial Organization of Data and Data Extraction from Maptitude
 Spatial Organization of Data and Data Extraction from Maptitude N. P. Taliceo Geospatial Information Sciences The University of Texas at Dallas UT Dallas GIS Workshop Richardson, TX March 30 31, 2018 1/
CLAREMONT MASTER PLAN 2017: LAND USE COMMUNITY INPUT
 Planning and Development Department 14 North Street Claremont, New Hampshire 03743 Ph: (603) 542-7008 Fax: (603) 542-7033 Email: cityplanner@claremontnh.com www.claremontnh.com CLAREMONT MASTER PLAN 2017:
Lecture 19: Common property resources
 Lecture 19: Common property resources Economics 336 Economics 336 (Toronto) Lecture 19: Common property resources 1 / 19 Introduction Common property resource: A resource for which no agent has full property
Technical Memorandum #2 Future Conditions
 Technical Memorandum #2 Future Conditions To: Dan Farnsworth Transportation Planner Fargo-Moorhead Metro Council of Governments From: Rick Gunderson, PE Josh Hinds PE, PTOE Houston Engineering, Inc. Subject:
Traffic Impact Study
 Traffic Impact Study Statham DRI One University Parkway Prepared for: Barrow County Prepared by: October 2012 Table of Contents Executive Summary i Section 1. Introduction 1 Project Description 1 Methodology
FHWA Planning Data Resources: Census Data Planning Products (CTPP) HEPGIS Interactive Mapping Portal
 HEPGIS Interactive Mapping Portal") FHWA Planning Data Resources: Census Data Planning Products (CTPP) HEPGIS Interactive Mapping Portal Jeremy Raw, P.E. FHWA, Office of Planning, Systems Planning and Analysis August 2017 Outline Census
FHWA Planning Data Resources: Census Data Planning Products (CTPP) HEPGIS Interactive Mapping Portal Jeremy Raw, P.E. FHWA, Office of Planning, Systems Planning and Analysis August 2017 Outline Census
Transit Market Index. Validating Local Potential for Transit Ridership
 Transit Market Index Validating Local Potential for Transit Ridership Transit Market Areas Characteristics 2010 TPP Characterized by different levels of transit service. Core Areas, 1 & 2: A variety of
City of Hermosa Beach Beach Access and Parking Study. Submitted by. 600 Wilshire Blvd., Suite 1050 Los Angeles, CA
 City of Hermosa Beach Beach Access and Parking Study Submitted by 600 Wilshire Blvd., Suite 1050 Los Angeles, CA 90017 213.261.3050 January 2015 TABLE OF CONTENTS Introduction to the Beach Access and Parking
APPENDIX C-3 Equitable Target Areas (ETA) Technical Analysis Methodology
 Technical Analysis Methodology") APPENDIX C-3 Equitable Target Areas (ETA) Technical Analysis Methodology Contents Introduction... 1 ETA Index Methodology... 1 ETA Index Development... 1 Other EJ Measures... 4 The Limited English Proficiency
APPENDIX C-3 Equitable Target Areas (ETA) Technical Analysis Methodology Contents Introduction... 1 ETA Index Methodology... 1 ETA Index Development... 1 Other EJ Measures... 4 The Limited English Proficiency
Expanding the GSATS Model Area into
 Appendix A Expanding the GSATS Model Area into North Carolina Jluy, 2011 Table of Contents LONG-RANGE TRANSPORTATION PLAN UPDATE 1. Introduction... 1 1.1 Background... 1 1.2 Existing Northern Extent of
Transit Time Shed Analyzing Accessibility to Employment and Services
 Transit Time Shed Analyzing Accessibility to Employment and Services presented by Ammar Naji, Liz Thompson and Abdulnaser Arafat Shimberg Center for Housing Studies at the University of Florida www.shimberg.ufl.edu
Economic and Social Urban Indicators: A Spatial Decision Support System for Chicago Area Transportation Planning
 Economic and Social Urban Indicators: A Spatial Decision Support System for Chicago Area Transportation Planning Piyushimita Thakuriah (Vonu), P.S. Sriraj, Paul Metaxatos, Inshu Minocha & Tanushri Swarup
Environmental Justice Analysis
 Environmental Justice Analysis October 2013 Transportation Department Environmental Justice Analysis Background The U.S. Environmental Protection Agency (EPA) defines environmental justice as the fair
CRP 608 Winter 10 Class presentation February 04, Senior Research Associate Kirwan Institute for the Study of Race and Ethnicity
 CRP 608 Winter 10 Class presentation February 04, 2010 SAMIR GAMBHIR SAMIR GAMBHIR Senior Research Associate Kirwan Institute for the Study of Race and Ethnicity Background Kirwan Institute Our work Using
The 3V Approach. Transforming the Urban Space through Transit Oriented Development. Gerald Ollivier Transport Cluster Leader World Bank Hub Singapore
 Transforming the Urban Space through Transit Oriented Development The 3V Approach Gerald Ollivier Transport Cluster Leader World Bank Hub Singapore MDTF on Sustainable Urbanization The China-World Bank
SBCAG Travel Model Upgrade Project 3rd Model TAC Meeting. Jim Lam, Stewart Berry, Srini Sundaram, Caliper Corporation December.
 SBCAG Travel Model Upgrade Project 3rd Model TAC Meeting Jim Lam, Stewart Berry, Srini Sundaram, Caliper Corporation December. 7, 2011 1 Outline Model TAZs Highway and Transit Networks Land Use Database
I. M. Schoeman North West University, South Africa. Abstract
 Urban Transport XX 607 Land use and transportation integration within the greater area of the North West University (Potchefstroom Campus), South Africa: problems, prospects and solutions I. M. Schoeman
Forecasts from the Strategy Planning Model
 Forecasts from the Strategy Planning Model Appendix A A12.1 As reported in Chapter 4, we used the Greater Manchester Strategy Planning Model (SPM) to test our long-term transport strategy. A12.2 The origins
VALIDATING THE RELATIONSHIP BETWEEN URBAN FORM AND TRAVEL BEHAVIOR WITH VEHICLE MILES TRAVELLED. A Thesis RAJANESH KAKUMANI
 VALIDATING THE RELATIONSHIP BETWEEN URBAN FORM AND TRAVEL BEHAVIOR WITH VEHICLE MILES TRAVELLED A Thesis by RAJANESH KAKUMANI Submitted to the Office of Graduate Studies of Texas A&M University in partial
WOODRUFF ROAD CORRIDOR ORIGIN-DESTINATION ANALYSIS
 2018 WOODRUFF ROAD CORRIDOR ORIGIN-DESTINATION ANALYSIS Introduction Woodruff Road is the main road to and through the commercial area in Greenville, South Carolina. Businesses along the corridor have
Analyzing Suitability of Land for Affordable Housing
 Analyzing Suitability of Land for Affordable Housing Vern C. Svatos Jarrod S. Doucette Abstract: This paper explains the use of a geographic information system (GIS) to distinguish areas that might have
Transportation Statistical Data Development Report OKALOOSA-WALTON OUTLOOK 2035 LONG RANGE TRANSPORTATION PLAN
 Transportation Statistical Data Development Report OKALOOSA-WALTON OUTLOOK 2035 LONG RANGE TRANSPORTATION PLAN Prepared for the Okaloosa-Walton Transportation Planning Organization and The Florida Department
Smart Growth: Threat to the Quality of Life. Experience
 Smart Growth: Threat to the Quality of Life Presentation by Wendell Cox Wendell Cox Consultancy Visiting Professor Conservatoire National des Arts et Metiers Paris Frontier Centre for Public Policy Winnipeg
Spatial profile of three South African cities
 Spatial Outcomes Workshop South African Reserve Bank Conference Centre Pretoria September 29-30, 2009 Spatial profile of three South African cities by Alain Bertaud September 29 Email: duatreb@msn.com
A Simplified Travel Demand Modeling Framework: in the Context of a Developing Country City
 A Simplified Travel Demand Modeling Framework: in the Context of a Developing Country City Samiul Hasan Ph.D. student, Department of Civil and Environmental Engineering, Massachusetts Institute of Technology,
Neighborhood Locations and Amenities
 University of Maryland School of Architecture, Planning and Preservation Fall, 2014 Neighborhood Locations and Amenities Authors: Cole Greene Jacob Johnson Maha Tariq Under the Supervision of: Dr. Chao
Impact of Metropolitan-level Built Environment on Travel Behavior
 Impact of Metropolitan-level Built Environment on Travel Behavior Arefeh Nasri 1 and Lei Zhang 2,* 1. Graduate Research Assistant; 2. Assistant Professor (*Corresponding Author) Department of Civil and
California Urban Infill Trip Generation Study. Jim Daisa, P.E.
 California Urban Infill Trip Generation Study Jim Daisa, P.E. What We Did in the Study Develop trip generation rates for land uses in urban areas of California Establish a California urban land use trip
Your web browser (Safari 7) is out of date. For more security, comfort and the best experience on this site: Update your browser Ignore
 is out of date. For more security, comfort and the best experience on this site: Update your browser Ignore") Your web browser (Safari 7) is out of date. For more security, comfort and the best experience on this site: Update your browser Ignore urban area For the complete encyclopedic entry with media resources,
Your web browser (Safari 7) is out of date. For more security, comfort and the best experience on this site: Update your browser Ignore urban area For the complete encyclopedic entry with media resources,
Local Economic Activity Around Rapid Transit Stations
 Local Economic Activity Around Rapid Transit Stations The Case of Chicago s Orange Line Julie Cooper, MPP 2014 Harris School of Public Policy Transport Chicago June 6, 2014 Motivation Impacts of transit
TRAVEL DEMAND MODEL. Chapter 6
 Chapter 6 TRAVEL DEMAND MODEL As a component of the Teller County Transportation Plan development, a computerized travel demand model was developed. The model was utilized for development of the Transportation
Too Close for Comfort
 Too Close for Comfort Overview South Carolina consists of urban, suburban, and rural communities. Students will utilize maps to label and describe the different land use classifications. Connection to
Assessment of Models to Estimate Bus-Stop Level Transit Ridership using Spatial Modeling Methods
 Assessment of Models to Estimate Bus-Stop Level Transit Ridership using Spatial Modeling Methods Assessment of Models to Estimate Bus-Stop Level Transit Ridership using Spatial Modeling Methods Srinivas
Douglas County/Carson City Travel Demand Model
 Douglas County/Carson City Travel Demand Model FINAL REPORT Nevada Department of Transportation Douglas County Prepared by Parsons May 2007 May 2007 CONTENTS 1. INTRODUCTION... 1 2. DEMOGRAPHIC INFORMATION...
Modeling the land-use correlates of vehicle-trip lengths for assessing the transportation impacts of land developments
 THE JOURL OF TRANSPORT AND LAND USE http://jtlu.org VOL. 6 NO. 2 [2013] pp. 59 75 doi: 10.5198/jtlu.v6i2.254 Modeling the land-use correlates of vehicle-trip lengths for assessing the transportation impacts
A Framework for the Study of Urban Health. Abdullah Baqui, DrPH, MPH, MBBS Johns Hopkins University
 This work is licensed under a Creative Commons Attribution-NonCommercial-ShareAlike License. Your use of this material constitutes acceptance of that license and the conditions of use of materials on this
Measuring connectivity in London
 Measuring connectivity in London OECD, Paris 30 th October 2017 Simon Cooper TfL City Planning 1 Overview TfL Connectivity measures in TfL PTALs Travel time mapping Catchment analysis WebCAT Current and
Urban Revival in America
 Urban Revival in America Victor Couture 1 Jessie Handbury 2 1 University of California, Berkeley 2 University of Pennsylvania and NBER May 2016 1 / 23 Objectives 1. Document the recent revival of America
MOR CO Analysis of future residential and mobility costs for private households in Munich Region
 MOR CO Analysis of future residential and mobility costs for private households in Munich Region The amount of the household budget spent on mobility is rising dramatically. While residential costs can
2. Discussion of urban railway demand change The railway traffic demand for urban area is analyzed in the population decline society in the study. In
 The traffic demand analysis for urban railway networks in population declining society Yoshiyuki Yasuda a, Hiroaki Inokuchi b, Takamasa Akiyama c a Division of Science and Engineering, Graduate school
An Integrated Approach to Statewide Travel Modeling Applications in Delaware
 TRB 88 th Annual Meeting Washington, D.C. January 14 th, 29 An Integrated Approach to Statewide Travel Modeling Applications in Delaware The Context: Challenges for Today s Modelers: Personnel: Vacant
ROUNDTABLE ON SOCIAL IMPACTS OF TIME AND SPACE-BASED ROAD PRICING Luis Martinez (with Olga Petrik, Francisco Furtado and Jari Kaupilla)
") ROUNDTABLE ON SOCIAL IMPACTS OF TIME AND SPACE-BASED ROAD PRICING Luis Martinez (with Olga Petrik, Francisco Furtado and Jari Kaupilla) AUCKLAND, NOVEMBER, 2017 Objective and approach (I) Create a detailed
ROUNDTABLE ON SOCIAL IMPACTS OF TIME AND SPACE-BASED ROAD PRICING Luis Martinez (with Olga Petrik, Francisco Furtado and Jari Kaupilla) AUCKLAND, NOVEMBER, 2017 Objective and approach (I) Create a detailed
Managing Growth: Integrating Land Use & Transportation Planning
 Managing Growth: Integrating Land Use & Transportation Planning Metro Vancouver Sustainability Community Breakfast Andrew Curran Manager, Strategy June 12, 2013 2 Integrating Land Use & Transportation
John Laznik 273 Delaplane Ave Newark, DE (302)
") Office Address: John Laznik 273 Delaplane Ave Newark, DE 19711 (302) 831-0479 Center for Applied Demography and Survey Research College of Human Services, Education and Public Policy University of Delaware
Office Address: John Laznik 273 Delaplane Ave Newark, DE 19711 (302) 831-0479 Center for Applied Demography and Survey Research College of Human Services, Education and Public Policy University of Delaware
Committee Meeting November 6, 2018
 Committee Meeting November 6, 2018 Agenda Where we are in the process Land Use Plan Transportation Element Housing & Neighborhoods Elements Next Steps Schedule November 6: Plan Elements December: Plan
Antonio M. Bento University of California, Santa Barbara. Maureen L. Cropper University of Maryland and The World Bank
 (Preliminary: Please do not quote without permission) THE IMPACT OF URBAN SPATIAL STRUCTURE ON TRAVEL DEMAND IN THE UNITED STATES Antonio M. Bento University of California, Santa Barbara Maureen L. Cropper
Discerning sprawl factors of Shiraz city and how to make it livable
 Discerning sprawl factors of Shiraz city and how to make it livable 1. Introduction: Iran territory has now been directly affected by urban land-uses which are shaping landscapes in cities and around them.
Urban Form and Travel Behavior:
 Urban Form and Travel Behavior: Experience from a Nordic Context! Presentation at the World Symposium on Transport and Land Use Research (WSTLUR), July 28, 2011 in Whistler, Canada! Petter Næss! Professor
A Comprehensive Method for Identifying Optimal Areas for Supermarket Development. TRF Policy Solutions April 28, 2011
 A Comprehensive Method for Identifying Optimal Areas for Supermarket Development TRF Policy Solutions April 28, 2011 Profile of TRF The Reinvestment Fund builds wealth and opportunity for lowwealth communities
Changes in Transportation Infrastructure and Commuting Patterns in U.S. Metropolitan Areas,
 Changes in Transportation Infrastructure and Commuting Patterns in U.S. Metropolitan Areas, 1960-2000 Nathaniel Baum-Snow Department of Economics Box B Brown University Providence, RI 02912 Nathaniel_Baum-Snow@brown.edu
The sustainable location of low-income housing development in South African urban areas
 Sustainable Development and Planning II, Vol. 2 1165 The sustainable location of low-income housing development in South African urban areas S. Biermann CSIR Building and Construction Technology Abstract
EXAMINING THE DEMOGRAPHICS OF THE DOG RIVER WATERSHED
 EXAMINING THE DEMOGRAPHICS OF THE DOG RIVER WATERSHED Phillip B. Whatley, Department of Earth Sciences, University of South Alabama, Mobile, AL, 36688. Email: pbw401@jaguar1.usouthal.edu. Examining the
Date: June 19, 2013 Meeting Date: July 5, Consideration of the City of Vancouver s Regional Context Statement
 Section E 1.5 To: From: Regional Planning and Agriculture Committee Lee-Ann Garnett, Senior Regional Planner Planning, Policy and Environment Department Date: June 19, 2013 Meeting Date: July 5, 2013 Subject:
Identifying transit deserts in major Texas cities where the supplies missed the demands
 THE JOURNAL OF TRANSPORT AND LAND USE http://jtlu.org VOL. 10 NO. 1 [2017] pp. 529 540 Identifying transit deserts in major Texas cities where the supplies missed the demands Junfeng Jiao The University
Estimating Transportation Demand, Part 2
 Transportation Decision-making Principles of Project Evaluation and Programming Estimating Transportation Demand, Part 2 K. C. Sinha and S. Labi Purdue University School of Civil Engineering 1 Estimating