WOODRUFF ROAD CORRIDOR ORIGIN-DESTINATION ANALYSIS
|
|
|
- Virgil Waters
- 5 years ago
- Views:
Transcription


1 2018 WOODRUFF ROAD CORRIDOR ORIGIN-DESTINATION ANALYSIS

2 Introduction Woodruff Road is the main road to and through the commercial area in Greenville, South Carolina. Businesses along the corridor have been increasing since the late 1970's with the development of the Greenville Mall. Improved access with the extension of I-385 south of I-85 further spurred development. Big box retail, restaurants, and stores catering to destination shopping have proliferated since the 1970's. However, accessibility to shopping along the corridor is limited to Woodruff Road, acting as the main arterial from which to access the commercial businesses. This report summarizes the origin-destination analysis completed for Woodruff Road. The results of the study are intended to better inform local decision-making groups regarding travel patterns, and the economic impacts while improving access along Woodruff Road. BACKGROUND In 2007, the City of Greenville and the South Carolina Department of Transportation conducted a corridor study on Woodruff Road. The study evaluated the corridor for improved access and intersection modifications. The study concluded with a process for implementation of the corridor study recommendations to address the challenges along the corridor and to provide guidance on the future planning of infrastructure. Since 2007, several improvements have been made at the intersections, including signalization and driveway placement. Despite these improvements, the corridor continues to be heavily congested. For those familiar with the area it should come as no surprise that Woodruff Road is a point of congestion. The purpose of this study is to quantify the number of trips traveling along the corridor and to better understand their origins and destinations to aid in the development of solutions for addressing congestion on Woodruff Road and the surrounding area. ORIGIN-DESTINATION STUDY The intent of the Woodruff Road corridor origin-destination analysis is to understand the travel behavior of trips along the corridor, as well as the origin and destination of trips passing through certain locations along Woodruff Road, and in the zones bounded by Laurens Road, I-385, and SC Highway 14 (Figure 1). An origin-destination analysis can be a valuable tool in understanding the nature of trips generated in the area, travel patterns during selected time periods, and in identifying 1

3 future congestion issues. In developing this O-D study, information from the 2007 Woodruff Road Corridor Study, StreetLight data, and the GPATS travel demand model was utilized. FIGURE 1 WOODRUFF ROAD STUDY AREA DATA COLLECTION AND METHODOLOGY StreetLight data was utilized to collect the origin and destination of trips within the study area. StreetLight is a data analytics company that collects location based information from mobile devices. The web based platform integrates millions of data points from mobile devices to show the movement of the device on the roadway network. To visualize the travel patterns of the mobile devices, the platform allows the user to create study area zones to match a specified geography. Gate filters can be created on roadways that serve as pass through zones to capture all trips that pass through the gate. This analysis provides information on the origin zone and destination zone of the specific trips passing through the gate filter. The information can be selected for any length of time, a month, six months, or a year. The data can be segmented by: Day Type average day, average weekday (Monday to Thursday), average weekend day (Saturday to Sunday) Day Part - same as vehicle classification counts, including Early AM, AM Peak Period, Mid-Day, PM peak period, Late PM, and Daily The final output is a trip frequency based on an index. According to StreetLight, the trip index represents trip activity but does not indicate actual number of trips or vehicles. The values are 2
4 10,860 7,083 9,583 56,046 20,695 26,953 15,571 12,610 provided on an index. The value is normalized by adjusting the number of trips in the data sample to the actual number of trips on a region around Sacramento CA, as derived from the measurements published by the California Department of Transportation. This allows us to capture monthly and seasonal variation more accurately, even as our sample grows. To get an estimate on the number of daily trips passing through the gate filter we utilized a traffic count at the same location to calculate absolute trips. STUDY AREA DEMOGRAPHICS The land uses along Woodruff Road are mainly commercial development. Restaurants, big box retail, and shopping are located along much of the corridor from Laurens Road to the south and South Carolina Highway 14 to the east. In addition to commercial development, there are several office parks and major employers all within the vicinity of the corridor, including the International Center for Automotive Research, Millennium Campus, Verdae Development, and GE. These land uses have a significant effect on travel patterns, including the numbers of trips, trip purpose, and length of the trip. According to the GPATS travel demand model, within the region, home-based work trips have a congested travel time between minutes and a length of 8.9 miles. Home-based other trips, trips that include shopping, appointments, and activities have a travel time between minutes and a trip length of 5.5 miles. The distance of these trip purposes from the Woodruff Road study area encompasses an area that extends to downtown Greenville, Mauldin, and Simpsonville. The Woodruff Road study area has a population of 10,860 or 2.2% of the county total. Employment in the study area is 20,695 which is 7.4% of the county total. To compare, Downtown Greenville s population is 1.4% and employment is 10% of the county total. The study also compared the travel patterns to the area around BMW, a major regional employer, and the communities southeast of Five Forks. The study area contains a significant amount of activity in terms of population and employment when compared to downtown and the regions highest single employer, BMW Manufacturing. Study Area Downtown Study Area Downtown BMW Area Five Forks BMW Area Five Forks P OP UL ATI O N EMP L OY M EN T 3
.")
5 STUDY DESIGN The traffic analysis zones (TAZ) from the GPATS travel demand model were aggregated to the district level in the area outside the study area. Within the study area TAZs were refined based on natural boundaries, roadways, and land use types (Figure 2). FIGURE 2 GPATS BOUNDARY The corridor analysis along Woodruff Road attempts to understand three pattern types, trips going to and from the study area, trips utilizing Woodruff Road to reach destinations along the corridor, and trips using Woodruff Road as a pass-through route. The link level analysis provides the number of trips between each zone in the geographic layer that travels through the selected pass through location (Figure 3). The output of the link level analysis is a trip table that provides three points of travel, the origin zone, selected pass through location, and destination zone. Three gates were placed along Woodruff Road to analyze how the sections of Woodruff are utilized. Additional gates were included near Woodruff Road to analyze trips traveling to the study area zones. The gates for the analysis include: 4

6 WOODRUFF ROAD AT ROCKY SLOPE ROAD WOODRUFF ROAD AT MARKET POINT DRIVE WOODRUFF ROAD AT BUTLER ROAD LAURENS ROAD AT PARKINS MILL ROAD I-85 AT RIDGE ROAD MAIN STREET MILLER ROAD GARLINGTON ROAD I-85 AT ROPER MOUNTAIN ROAD ROPER MOUNTAIN ROAD AT I-385 FIGURE 3 STUDY AREA GATE FILTERS DATA ANALYSIS Data output from Streetlight was reviewed to identify the origin-destination zones with the highest percentage of trips traveling from the Woodruff Road study area, as well as trips traveling to the study area. Information gathered from this analysis was used to develop origin-destination locations to apply the pass-through location filter. ORIGIN-DESTINATION ANALYSIS The internal to external map (Figure 4) provides information on trips traveling from the study area, the trip origin, to zones outside of the study area, the trip destination. The travel patterns from this analysis indicate trips from the Woodruff Road study area are primarily destined to: 5
7 Southeast of Five Forks in the zone with Woodland Village and Simpsonville Zones south, including Mauldin Downtown Greenville, and zones to the east Zones north bounded by I-85 and Wade/Hampton Blvd, including Greer FIGURE 4 DISTRIBUTION OF INTERNAL TO EXTERNAL TRIPS The external to internal map (Figure 5) provides information on trips traveling outside of the study area, the trip origin, to the study area, the trip destination. The travel patterns from this analysis indicate trips destined to the study area primarily originate from: Zones southeast of Five Forks, including Woodland Village and Simpsonville Zones south, including Mauldin Zones north bounded by I-85 and Wade/Hampton Blvd and west of Boiling Springs Road, including Greer 6

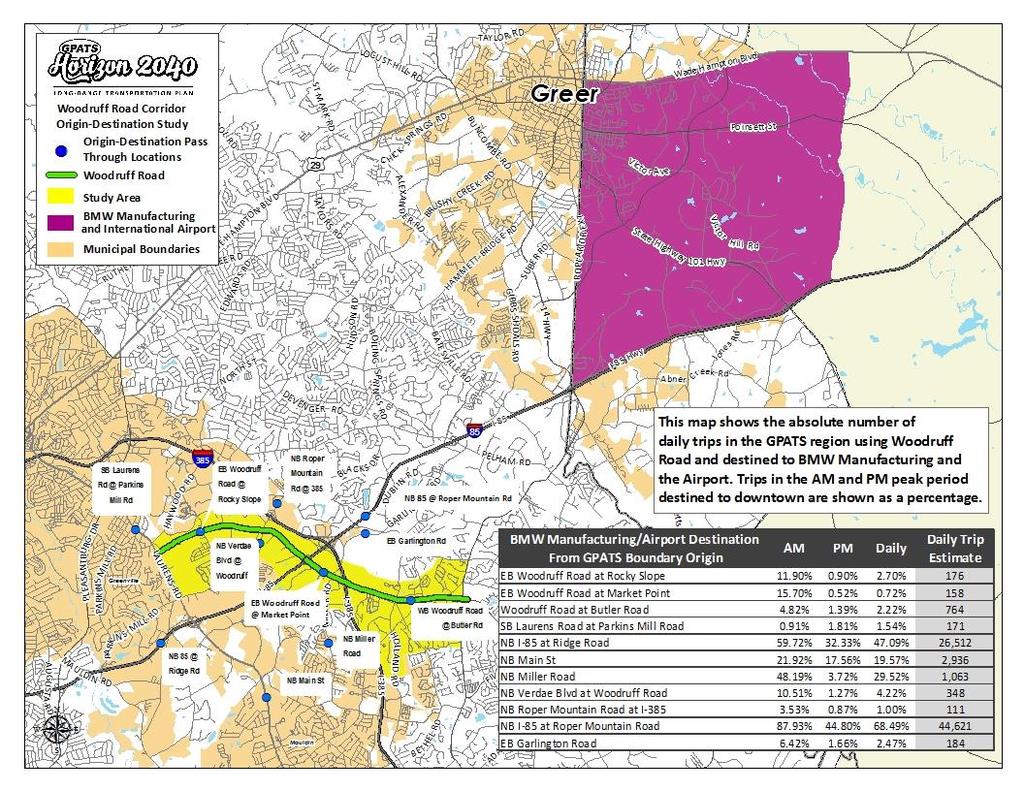
8 The Zone northeast bounded by Pleasantburg Drive, I-385, Laurens Road, and Halton Road. FIGURE 5 DISTRIBUTION OF EXTERNAL TO INTERNAL TRIPS Pass-through Analysis Information from the origin-destination analysis was used to identify destination zones to apply the pass-through location filter. This analysis identifies the origin zone and destination zone of trips passing through the gate filter. Data is summarized for the GPATS boundary area, as well as the Woodruff Road study area. The destination locations summarized include Downtown Greenville, BMW Manufacturing and Greenville International Airport, and the communities southeast of Woodruff Road including Five Forks, Simpsonville, and Woodland Village. The results are summarized by AM peak period (6 am 10 am), PM peak period (3 pm 7 pm), and daily percentages. The daily trip estimate is calculated using the GPATS geographic boundary and 2015 AADT traffic counts from the South Carolina Department of Transportation (Appendix A) at the pass-through gate locations, and represents an estimated number of daily trips. 7
9 D OWNTOWN GREENVIL L E Downtown Greenville is a popular destination for shopping, dining, and entertainment. The US Census Bureau has named it the fourth fastest growing large city in the nation between July 1, 2015 and July 1, The growth of downtown has spurred hotels and apartment developments to attract tourists and residents alike. Several major employers are located downtown including SunTrust, Wells Fargo, and Ernst & Young. The energy of downtown has made it an attractive place, and as such a major generator of trips. Data from the origin-destination analysis indicates a high percentage of trips to downtown originate from the Woodruff Road study area. Trips traveling to downtown along Woodruff Road were analyzed to understand if the corridor is being utilized as a through route to downtown Greenville. Three pass-through gate filters were placed along Woodruff Road, a gate near Rocky Slope, Market Point, and Butler Road. The data was summarized for the AM, PM, and 24-Hours (Table 1). The passthrough location on Woodruff Road with the highest estimate of travel to downtown is the location at Butler Road, with 9.28% or an estimated 1,727 trips. The drop in the daily trip estimate indicates Woodruff Road is not being utilized as a major through route, but rather trips are utilizing it for some portion of their trip. According to Google maps, the shortest path to downtown Greenville from Woodruff Road near Butler Road routes the traveler to I-385. DOWNTOWN DESTINATIONS FROM DAILY TRIP AM PM DAILY GPATS BOUNDARY ORIGIN ESTIMATE WB WOODRUFF ROAD AT ROCKY SLOPE 23.31% 9.66% 12.90% 863 WB WOODRUFF ROAD AT MARKET POINT 2.18% 2.35% 1.80% 475 WB WOODRUFF ROAD AT BUTLER ROAD 17.86% 5.15% 9.28% 1,727 TABLE 1 TRIPS USING WOODRUFF ROAD TO ACCESS DOWNTOWN GREENVILLE WITHIN GPATS BOUNDARY Table 1 is an estimate on the percentage of trips in the GPATS Boundary utilizing Woodruff Road to access downtown Greenville. To estimate the percentage of trips originating within the study area, a smaller subset of the data was used to calculate the percentage of trips originating within the study area, and utilizing Woodruff Road to access downtown Greenville (Table 2). DOWNTOWN DESTINATIONS FROM AM PM DAILY STUDY AREA ORIGIN WB WOODRUFF ROAD AT ROCKY SLOPE 33.12% 13.96% 17.80% WB WOODRUFF ROAD AT MARKET POINT 1.86% 1.84% 1.66% WB WOODRUFF ROAD AT BUTLER ROAD 11.76% 3.17% 5.19% TABLE 2 TRIPS USING WOODRUFF ROAD TO ACCESS DOWNTOWN GREENVILLE WITHIN STUDY AREA 8
10 BMW MANUFAC TURING/AIRPORT The BMW Manufacturing plant is the largest single employer in the Greenville-Pickens region. There are an estimated 10,000 employees that work on site. Located in Greer, the manufacturing plant is accessed from I-85 and SC 101. The manufacturing plant is near the Greenville-Spartanburg International Airport. The airport has 951 employees and 5,983 daily passengers. The analysis zone for this study includes the BMW plant, the Greenville-Spartanburg International Airport, and the southeastern portion of Greer. The origin-destination study provided information supporting the manufacturing plant as being a large destination of home-based work trips and the airport for homebased other trips. All gate locations were analyzed to understand the travel patterns to the BMW Manufacturing/Airport zone. There are a small number of trips utilizing Woodruff Road that are destined to the zone (Table 3). The largest portion of daily trips destined to the zone are utilizing I- 85, with 26,512 trips near Ridge Road and 44,621 trips near Roper Mountain Road. There is a small portion of trips on Miller Road, with 1,063 destined for the BMW Manufacturing/Airport zone. The shortest path traveling to this zone from Miller Road would indicate a small portion of the trip utilizes Woodruff Road to access I-385. In total, an estimated 5,616 trips are utilizing some portion of Woodruff Road and are destined for the BMW Manufacturing/Airport zone. BMW MANUFACTURING/AIRPORT DESTINATION AM PM DAILY DAILY TRIP ESTIMATE FROM GPATS BOUNDARY ORIGIN EB WOODRUFF ROAD AT ROCKY SLOPE 11.90%.90% 2.70% 176 EB WOODRUFF ROAD AT MARKET POINT 15.70%.52%.72% 158 WOODRUFF ROAD AT BUTLER ROAD 4.82% 1.39% 2.22% 764 SB LAURENS ROAD AT PARKINS MILL ROAD.91% 1.81% 1.54 % 171 NB I-85 AT RIDGE ROAD 59.72% 32.33% 47.09% 26,512 NB MAIN ST 21.92% 17.56% 19.57% 2,936 NB MILLER ROAD 48.19% 3.72% 29.52% 1,063 NB VERDAE BLVD AT WOODRUFF ROAD 10.51% 1.27% 4.22% 348 NB ROPER MOUNTAIN ROAD AT I %.87% 1.00% 111 NB I-85 AT ROPER MOUNTAIN ROAD 87.93% 44.80% 68.49% 44,621 EB GARLINGTON ROAD 6.42% 1.66% 2.47% 184 TABLE 3 TRIPS USING WOODRUFF ROAD TO ACCESS THE BMW/AIRPORT AREA WITHIN GPATS BOUNDARY 9
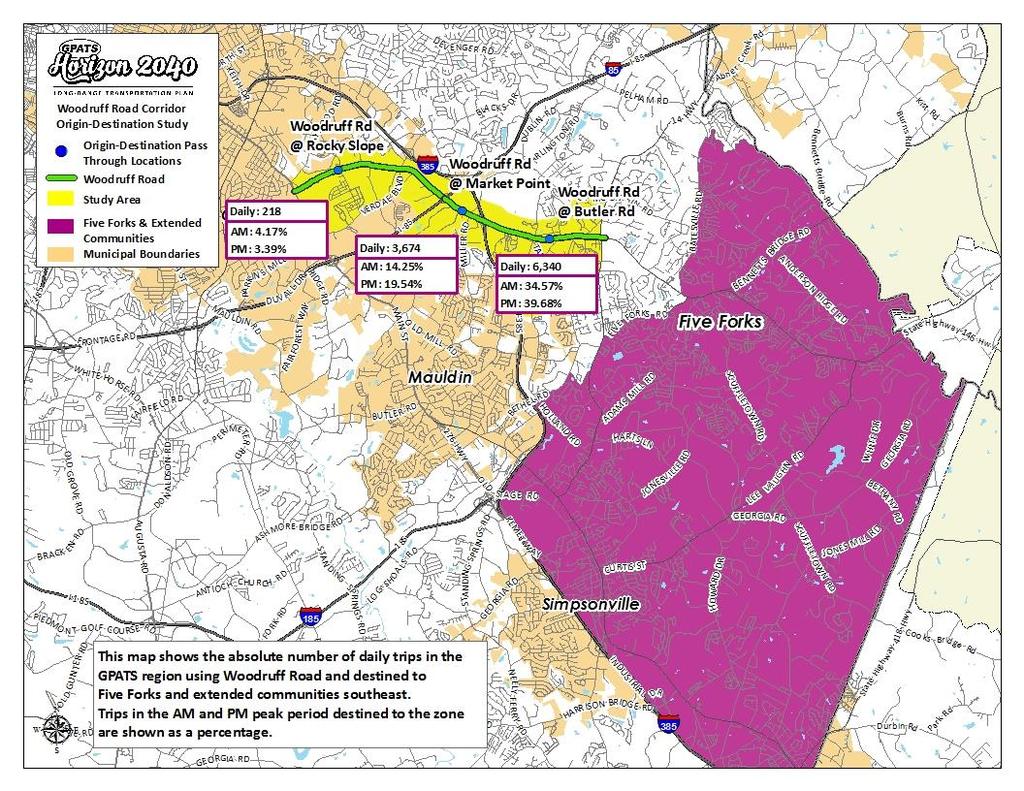
11 FIVE FORK S AND EXTENDED COMMUNITIES The Five Forks suburb is largely a residential area located southeast of downtown Greenville. Woodruff Road is the major roadway to access Five Forks. The town is largely an affluent community with a high median income and a population estimate of 15,000. Near Five Forks are the communities of Woodland Village and Simpsonville further south (Appendix B Map 3). For this study, these communities were combined into a single zone. The origin-destination analysis indicated zones east of the Woodruff Road study area have a significant number of trips where the study area serves as a destination. These communities are mainly residential with limited shopping and dining options. As such, the commercial development along Woodruff Road is a main destination for many of these communities. Trips traveling eastbound along Woodruff Road were analyzed to understand if the corridor is being utilized as a through route to the Five Forks and extended communities zone. The three pass-through locations along Woodruff Road, Rocky Slope, Market Point, and Butler Road were used in the analysis. The pass-through location on Woodruff Road with the highest estimate of travel to the Five Forks Zone is the location at Butler Road, with 38.66% or an estimated 6,340 trips. FIVE FORKS DESTINATIONS FROM GPATS DAILY TRIP AM PM DAILY BOUNDARY ORIGIN ESTIMATE EB WOODRUFF ROAD AT ROCKY SLOPE 4.17% 3.39% 2.81% 218 EB WOODRUFF ROAD AT MARKET POINT 14.25% 19.54% 17.70% 3,674 EB WOODRUFF ROAD AT BUTLER ROAD 34.57% 39.68% 38.66% 6,340 TABLE 4 TRIPS USING WOODRUFF ROAD TO ACCESS THE FIVE FORKS/EXTENDED COMMUNITIES AREA WITHIN GPATS BOUNDARY Table 4 is an estimate on the percentage of trips in the GPATS Boundary utilizing Woodruff Road to access Five Forks and the extended communities. To estimate the percentage of trips originating within the study area, a smaller subset of the data was used to calculate the percentage of trips originating within the study area, and utilizing Woodruff Road to access Five Forks (Table 5). FIVE FORKS DESTINATIONS FROM AM PM DAILY STUDY AREA ORIGIN EB WOODRUFF ROAD AT ROCKY SLOPE 1.20% 4.14% 2.64% EB WOODRUFF ROAD AT MARKET POINT 10.28% 16.51% 14.95% EB WOODRUFF ROAD AT BUTLER ROAD 29.44% 39.85% 37.91% TABLE 5 TRIPS USING WOODRUFF ROAD TO ACCESS THE FIVE FORKS/EXTENDED COMMUNITIES AREA WITHIN STUDY AREA 10
.")
12 EXTERNAL TO I NTERNAL The gate filters located outside of the study area were used to provide an estimate on the percentage of trips destined to the study area. Each filter was used to determine the percentage of daily trips traveling through the select roadway and destined for the study area (Figure 6). The external-internal analysis indicates the highest percentage of trips destined for the Woodruff Road study area travel from the northeast and southeast. Garlington Road has the highest percentage, with 53% of southbound trips destined for the study area. FIGURE 6 TRIPS DESTINED FOR STUDY AREA FROM SURROUNDING ROADWAYS SOUTHBOUND ON ROPER MOUNTAIN ROAD AT 385 SOUTHBOUND ON LAURENS ROAD AT PARKINS 17% MILL ROAD 28% SOUTHBOUND ON I-85 AT RIDGE ROAD 16% NORTHBOUND ON MAIN STREET 15% NORTHBOUND MILLER ROAD 38% SOUTHBOUND ON GARLINGTON ROAD 53% SOUTHBOUND ON I-85 AT ROPER MOUNTAIN ROAD - 17% 11
13 FINDINGS AND IMPLICATIONS The results of the corridor analysis indicate the Woodruff Road study area contributes to a significant amount of activity in the region. Travel patterns show the corridor is primarily being used to access destinations along Woodruff Road, rather than being used as a through route. Three focus areas were selected as part of the origin-destination analysis Downtown Greenville, BMW/Airport, and the area including Five Forks. These areas were selected after the origin-destination analysis indicated a high correlation of travel between the Woodruff Road study area and these areas. The zone containing Mauldin also showed as a high percentage of trips to and from the study area but it was not selected as a focus area, primarily due to its proximity to the study area. The first focus area, downtown Greenville, is a major destination of work and shopping trips. The origin-destination analysis indicated a high number of trips between the Woodruff Road study area and downtown Greenville. Three trip filters were located along Woodruff Road. These locations include Butler Road, Market Point, and Rocky Slope. The filters were analyzed to see if Woodruff Road is being used as a through route from SC 14 to downtown Greenville. While there are presumably some trips using Woodruff Road as a through route, the primary route from Butler Road to downtown Greenville is to access I % of trips on Woodruff Road at Butler Road are traveling to downtown Greenville. This percentage drops to 2% at Market Point. BMW manufacturing is the single largest employer in the region. The plant is located just off I-85 which makes it convenient to access from the surrounding communities. The plant is adjacent to the Greenville-Spartanburg International Airport which has 2 million passengers that travel through the airport a year. As part of the O-D analysis these two land uses were combined into a single zone. Each of the filters were analyzed to see the percentage that travel to the BMW/Airport zone in the AM, PM, and daily. While a parallel route might serve to access downtown, there is a significant portion of trips along Woodruff traveling north to BMW Manufacturing and the Greenville-Spartanburg International Airport. The third focus area, Five Forks and surrounding communities, is primarily a residential zone. Woodruff Road continues west from SC-14 terminating at State Highway 101. Within this focus area, Woodruff Road connects to many residential communities. For many neighborhoods in this zone the commercial developments along Woodruff Road are the nearest shopping and dining options. SCDOT is currently conducting the Woodruff Road Congestion Relief Project to evaluate solutions for improving operational efficiency and providing congestion relief along Woodruff Road. According to SCDOT, "[t]he purpose of the project is to improve operational efficiency and alleviate traffic congestion on Woodruff Road in order to improve mobility in the busy commercial area between I-385 and Roper Mountain Road/Verdae Boulevard. 12
14 This study is anticipated to conclude in the Fall of 2018 with a federal decision on a preferred alternative. Previous studies evaluating traffic conditions along Woodruff Road note that the developments along this corridor account for a large portion of congestion, particularly between Roper Mountain Road and I-385. The data in this analysis confirms that the developments in the study area are a major destination of trips from communities within the study area, as well as downtown Greenville, BMW/Greenville-Spartanburg International Airport, and Five Forks. The type of land uses located along this corridor such as Sam s Club, Walmart, The Shops at Greenridge, and many others are frequent destinations at all times of day. With the type of development present along Woodruff Road, operational efficiency and access management can provide good solutions for providing congestion relief. Implementing access management encourages smooth and safe traffic flow and helps communities mitigate some of the traffic problems caused by development. Access management can include signalization, controlled access, and limiting the amount of curb cuts on a roadway (driveway consolidation). Operational improvements can include parallel routes to Woodruff that serve the developments along the corridor. This type of improvement would allow trips destined to the area for shopping and dining alternative routes to Woodruff Road. The congestion relief efforts being explored in the Woodruff Road Congestion Relief Project include a focus on alternate entry and exit points from commercial areas as well as other solutions to help provide options to travelers. The findings of the analysis in the Woodruff Road Corridor Origin-Destination Analysis support the approach being taken in the Woodruff Road Congestion Relief Project. 13
15 APPENDIX A StreetLight Gate Locations 2015 AADT 1 Woodruff Road at Rocky Slope 13,000 2 Woodruff Road at Market Point* 44,000* 3 Woodruff Road at Butler Road 34,400 4 Laurens Road at Parkins Mill Road 22,200 5 I-85 at Ridge Road 112,600 6 Main St at Knollwood Drive 30,000 7 Miller Road at Pine Gate Drive 7,200 8 Verdae Boulevard at Woodruff Road 16,500 9 Roper Mountain Road at I , I-85 at Roper Mountain Road 130, Garlington Road 14,900 *2015 GPATS Travel Demand Model estimate 14

16 APPENDIX B MAP 1 15
17 MAP 2 16
18 MAP 3 17
Neighborhood Locations and Amenities
 University of Maryland School of Architecture, Planning and Preservation Fall, 2014 Neighborhood Locations and Amenities Authors: Cole Greene Jacob Johnson Maha Tariq Under the Supervision of: Dr. Chao
Market Street PDP. Nassau County, Florida. Transportation Impact Analysis. VHB/Vanasse Hangen Brustlin, Inc. Nassau County Growth Management
 Transportation Impact Analysis Market Street PDP Nassau County, Florida Submitted to Nassau County Growth Management Prepared for TerraPointe Services, Inc. Prepared by VHB/Vanasse Hangen Brustlin, Inc.
Appendixx C Travel Demand Model Development and Forecasting Lubbock Outer Route Study June 2014
 Appendix C Travel Demand Model Development and Forecasting Lubbock Outer Route Study June 2014 CONTENTS List of Figures-... 3 List of Tables... 4 Introduction... 1 Application of the Lubbock Travel Demand
3.0 ANALYSIS OF FUTURE TRANSPORTATION NEEDS
 3.0 ANALYSIS OF FUTURE TRANSPORTATION NEEDS In order to better determine future roadway expansion and connectivity needs, future population growth and land development patterns were analyzed as part of
Traffic Impact Study
 Traffic Impact Study Statham DRI One University Parkway Prepared for: Barrow County Prepared by: October 2012 Table of Contents Executive Summary i Section 1. Introduction 1 Project Description 1 Methodology
APPENDIX IV MODELLING
 APPENDIX IV MODELLING Kingston Transportation Master Plan Final Report, July 2004 Appendix IV: Modelling i TABLE OF CONTENTS Page 1.0 INTRODUCTION... 1 2.0 OBJECTIVE... 1 3.0 URBAN TRANSPORTATION MODELLING
Expanding the GSATS Model Area into
 Appendix A Expanding the GSATS Model Area into North Carolina Jluy, 2011 Table of Contents LONG-RANGE TRANSPORTATION PLAN UPDATE 1. Introduction... 1 1.1 Background... 1 1.2 Existing Northern Extent of
Figure 8.2a Variation of suburban character, transit access and pedestrian accessibility by TAZ label in the study area
 Figure 8.2a Variation of suburban character, transit access and pedestrian accessibility by TAZ label in the study area Figure 8.2b Variation of suburban character, commercial residential balance and mix
CVS Derwood. Local Area Transportation Review
 CVS Derwood Montgomery County, Maryland May 27, 2016 Local Area Transportation Review Prepared for: JC Bar Properties, Inc. Steve Fleming, PE 415 Fallowfield Road, Suite 301 Camp Hill, Pennsylvania 17011
VHD Daily Totals. Population 14.5% change. VMT Daily Totals Suffolk 24-hour VMT. 49.3% change. 14.4% change VMT
 6.9 Suffolk 6-54 VMT Population and Travel Characteristics Population 14.5% change 2014 1,529,202 VHD Daily Totals 2014 251,060 49.3% change 2040 1,788,175 2040 374,850 VMT Daily Totals 2014 39,731,990
City of Hermosa Beach Beach Access and Parking Study. Submitted by. 600 Wilshire Blvd., Suite 1050 Los Angeles, CA
 City of Hermosa Beach Beach Access and Parking Study Submitted by 600 Wilshire Blvd., Suite 1050 Los Angeles, CA 90017 213.261.3050 January 2015 TABLE OF CONTENTS Introduction to the Beach Access and Parking
Appendix B. Traffic Analysis Report
 Appendix B Traffic Analysis Report Report No. 14369/TR/WN02 August 2007 SALLINS BYPASS BYPASS OPTIONEERING ANALYSIS - TRAFFIC REPORT Kildare County Council Áras Chill Dara, Devoy Park, Naas, Co Kildare
Regional Transit Development Plan Strategic Corridors Analysis. Employment Access and Commuting Patterns Analysis. (Draft)
") Regional Transit Development Plan Strategic Corridors Analysis Employment Access and Commuting Patterns Analysis (Draft) April 2010 Contents 1.0 INTRODUCTION... 4 1.1 Overview and Data Sources... 4 1.2
Regional Transit Development Plan Strategic Corridors Analysis Employment Access and Commuting Patterns Analysis (Draft) April 2010 Contents 1.0 INTRODUCTION... 4 1.1 Overview and Data Sources... 4 1.2
FHWA Peer Exchange Meeting on Transportation Systems Management during Inclement Weather
 Travel Demand Modeling & Simulation at GBNRTC Matt Grabau Kimberly Smith Mike Davis Why Model? Travel modeling is a tool for transportation planners and policy makers, to observe impacts of a transportation
JEP John E. Jack Pflum, P.E. Consulting Engineering 7541 Hosbrook Road, Cincinnati, OH Telephone:
 JEP John E. Jack Pflum, P.E. Consulting Engineering 7541 Hosbrook Road, Cincinnati, OH 45243 Email: jackpflum1@gmail.com Telephone: 513.919.7814 MEMORANDUM REPORT Traffic Impact Analysis Proposed Soccer
The Sunland Park flyover ramp is set to close the week of March 19 until early summer
 March 2, 2018 The Sunland Park flyover ramp is set to close the week of March 19 until early summer GO 10 is targeting the week of March 19 to close the Sunland Park Drive flyover entrance ramp to I 10
FINAL Traffic Report for the Proposed Golden Valley Road and Newhall Ranch Road Projects in the City of Santa Clarita, California May 5, 2005
 FINAL Traffic Report for the Proposed Golden Valley Road and Newhall Ranch Road Projects in the City of Santa Clarita, California May 5, 2005 Prepared For: EDAW, Inc. 1420 Kettner Boulevard, Suite 620
Focused Traffic Analysis for the One Lincoln Park Project
 September 15, 2015 Mr. Bill Johnson Coldwell Banker 511 Sir Francis Drake Boulevard Greenbrae, CA 94904 Focused Traffic Analysis for the One Lincoln Park Project Dear Mr. Johnson; As requested, W-Trans
APPENDIX I - AREA PLANS
 ROUTE 37 WEST LAND USE PLAN ROUTE 37 WEST LAND USE PLAN Recent land use decisions and development trends have drawn attention to the land within the Route 37 western by-pass area between Route 50 and
Engineers Architects Planners Scientists
 MEMORNDUM TO: FROM: Lindsay Bruer, CP MnDOT District 8 Planning Director Graham Johnson, PE DTE: March 5, 2018 RE: Origin-Destination Study SEH No. MNT08 144650 14.00 This memorandum summarizes the methodology
GIS Analysis of Crenshaw/LAX Line
 PDD 631 Geographic Information Systems for Public Policy, Planning & Development GIS Analysis of Crenshaw/LAX Line Biying Zhao 6679361256 Professor Barry Waite and Bonnie Shrewsbury May 12 th, 2015 Introduction
California Urban Infill Trip Generation Study. Jim Daisa, P.E.
 California Urban Infill Trip Generation Study Jim Daisa, P.E. What We Did in the Study Develop trip generation rates for land uses in urban areas of California Establish a California urban land use trip
Encapsulating Urban Traffic Rhythms into Road Networks
 Encapsulating Urban Traffic Rhythms into Road Networks Junjie Wang +, Dong Wei +, Kun He, Hang Gong, Pu Wang * School of Traffic and Transportation Engineering, Central South University, Changsha, Hunan,
Understanding Land Use and Walk Behavior in Utah
 Understanding Land Use and Walk Behavior in Utah 15 th TRB National Transportation Planning Applications Conference Callie New GIS Analyst + Planner STUDY AREA STUDY AREA 11 statistical areas (2010 census)
King City URA 6D Concept Plan
 King City URA 6D Concept Plan King City s Evolution Among the fastest growing cities 2000 Census 1,949 2010 Census 3,111 60% increase 2016 Census estimate 3,817 23% increase Average annual rate 4.3% Surpassing
Impressive Growth & Relaxed Elegance.
 Impressive Growth & Relaxed Elegance www.culpeperva.org About Culpeper Nestled between Charlottesville and the District of Columbia, Culpeper is a hub of commerce and culture proud to be home to a broad
2011 South Western Region Travel Time Monitoring Program Congestion Management Process. Executive Summary
 2011 South Western Region Travel Monitoring Program Executive Summary Prepared by: South Western Regional Planning Agency 888 Washington Blvd, 3rd Floor Stamford, CT 06901 Telephone: 203.6.5190 Facsimile:
Forecasts for the Reston/Dulles Rail Corridor and Route 28 Corridor 2010 to 2050
 George Mason University Center for Regional Analysis Forecasts for the Reston/Dulles Rail Corridor and Route 28 Corridor 21 to 25 Prepared for the Fairfax County Department of Planning and Zoning Lisa
PLAZA MEXICO RESIDENCES
 PLAZA MEXICO RESIDENCES TRAFFIC STUDY PREPARED FOR: 3000 E. IMPERIAL, LLC. 6940 Beach Boulevard, D-501 Buena Park, California 90621 PREPARED BY: OCTOBER 5, 2017 translutions the transportatio n solutions
WEBER ROAD RESIDENTIAL DEVELOPMENT Single Family Residential Project
 WEBER ROAD RESIDENTIAL DEVELOPMENT Single Family Residential Project WEBER ROAD RESIDENTIAL DEVELOPMENT TRAFFIC IMPACT STUDY TABLE OF CONTENTS 1.0 Executive Summary Page 2.0 Introduction 2.1 DEVELOPMENT
6 th Line Municipal Class Environmental Assessment
 6 th Line Municipal Class Environmental Assessment County Road 27 to St John s Road Town of Innisfil, ON September 6, 2016 APPENDIX L: TRAVEL DEMAND FORECASTING MEMORANDUM Accessible formats are available
Study Overview. the nassau hub study. The Nassau Hub
 Livable Communities through Sustainable Transportation the nassau hub study AlternativeS analysis / environmental impact statement The Nassau Hub Study Overview Nassau County has initiated the preparation
Non-Motorized Traffic Exploratory Analysis
 Non-Motorized Traffic Exploratory Analysis --------------------------------------------------------------- Chao Wu Advisor: Professor Greg Lindsey Humphrey School of Public Affairs University of Minnesota
East Bay BRT. Planning for Bus Rapid Transit
 East Bay BRT Planning for Bus Rapid Transit Regional Vision Draper Prison The Bottleneck is a State-Level issue, Salt Lake County 2050 Population: 1.5M Draper Prison hopefully with some State-Level funding!
Traffic Impact Analysis. for the STARBUCKS STORE. Located at 9900 BALBOA BOULEVARD. Submitted to CITY OF LOS ANGELES. January 2017.
 Traffic Impact Analysis for the STARBUCKS STORE Located at 9900 BALBOA BOULEVARD Submitted to CITY OF LOS ANGELES January 2017 Submitted By January 5, 2017 Ken A. Aitchison, P.E. Transportation Engineering
FY 2010 Continuing i Planning Program Product Report. Local Transportation and Traffic Data. Wood-Washington-Wirt Interstate Planning Commission
 FY 2010 Continuing i Planning Program Product Report Local Transportation and Traffic Data Travel Time and Delay Data for Belpre and Marietta, Ohio Wood-Washington-Wirt Interstate Planning Commission CONTINUING
MADISON, WI STONE HOUSE DEVELOPMENT 1000 E. WASHINGTON AVENUE REDEVELOPMENT TRANSPORTATION STUDY DECEMBER 14, 2015
 MADISON, WI STONE HOUSE DEVELOPMENT 1000 E. WASHINGTON AVENUE REDEVELOPMENT TRANSPORTATION STUDY DECEMBER 14, 2015 TABLE OF CONTENTS... 3 Proposed Development... 3 Methodology... 3 Phase 1 Development...
Appendix BAL Baltimore, Maryland 2003 Annual Report on Freeway Mobility and Reliability
 (http://mobility.tamu.edu/mmp) Office of Operations, Federal Highway Administration Appendix BAL Baltimore, Maryland 2003 Annual Report on Freeway Mobility and Reliability This report is a supplement to:
Final City of Colusa STREETS & ROADWAYS MASTER PLAN. October J Street Suite 390 Sacramento, CA 95814
 Final City of Colusa STREETS & ROADWAYS MASTER PLAN October 2009 660 J Street Suite 390 Sacramento, CA 95814 TABLE OF CONTENTS I. INTRODUCTION... 1 Report Organization...1 II. ANALYSIS METHODOLOGY... 2
Updating the Urban Boundary and Functional Classification of New Jersey Roadways using 2010 Census data
 Updating the Urban Boundary and Functional Classification of New Jersey Roadways using 2010 Census data By: Glenn Locke, GISP, PMP 1 GIS-T May, 2013 Presentation Overview Purpose of Project Methodology
III. FORECASTED GROWTH
 III. FORECASTED GROWTH In order to properly identify potential improvement projects that will be required for the transportation system in Milliken, it is important to first understand the nature and volume
Trip Generation Study: A 7-Eleven Gas Station with a Convenience Store Land Use Code: 945
 Trip Generation Study: A 7-Eleven Gas Station with a Convenience Store Land Use Code: 945 Introduction The Brigham Young University Institute of Transportation Engineers student chapter (BYU ITE) completed
Local Economic Activity Around Rapid Transit Stations
 Local Economic Activity Around Rapid Transit Stations The Case of Chicago s Orange Line Julie Cooper, MPP 2014 Harris School of Public Policy Transport Chicago June 6, 2014 Motivation Impacts of transit
Technical Memorandum #2 Future Conditions
 Technical Memorandum #2 Future Conditions To: Dan Farnsworth Transportation Planner Fargo-Moorhead Metro Council of Governments From: Rick Gunderson, PE Josh Hinds PE, PTOE Houston Engineering, Inc. Subject:
The effects of impact fees on urban form and congestion in Florida
 The effects of impact fees on urban form and congestion in Florida Principal Investigators: Andres G. Blanco Ruth Steiner Presenters: Hyungchul Chung Jeongseob Kim Urban and Regional Planning Contents
MEMORANDUM. Trip Generation Analysis
 MEMORANDUM To: RMC Architects From: Matthew Palmer, PE Subject: Trip Generation, Parking Analysis & Level of Service Project: Port of Everett, GTC #13-053 Date: August 25, 2014 The trip generation and
QUANTIFICATION OF THE NATURAL VARIATION IN TRAFFIC FLOW ON SELECTED NATIONAL ROADS IN SOUTH AFRICA
 QUANTIFICATION OF THE NATURAL VARIATION IN TRAFFIC FLOW ON SELECTED NATIONAL ROADS IN SOUTH AFRICA F DE JONGH and M BRUWER* AECOM, Waterside Place, Tygerwaterfront, Carl Cronje Drive, Cape Town, South
Trip Generation Model Development for Albany
 Trip Generation Model Development for Albany Hui (Clare) Yu Department for Planning and Infrastructure Email: hui.yu@dpi.wa.gov.au and Peter Lawrence Department for Planning and Infrastructure Email: lawrence.peter@dpi.wa.gov.au
Prepared for: San Diego Association Of Governments 401 B Street, Suite 800 San Diego, California 92101
 Activity-Based Travel Model Validation for 2012 Using Series 13 Data: Coordinated Travel Regional Activity Based Modeling Platform (CT-RAMP) for San Diego County Prepared for: San Diego Association Of
South Western Region Travel Time Monitoring Program Congestion Management Process Spring 2008 Report
 South Western Region Travel Monitoring Program Congestion Management Process Spring 2008 Report Prepared by: South Western Regional Planning Agency 888 Washington Boulevard Stamford, CT 06901 Telephone:
Appendix C Traffic Study
 Final Environmental Impact Statement Appendix C Traffic Study Schofield Generating Station Project, Hawaii October 2015 C-1 Final Environmental Impact Statement This page intentionally left blank. Schofield
NATHAN HALE HIGH SCHOOL PARKING AND TRAFFIC ANALYSIS. Table of Contents
 Parking and Traffic Analysis Seattle, WA Prepared for: URS Corporation 1501 4th Avenue, Suite 1400 Seattle, WA 98101-1616 Prepared by: Mirai Transportation Planning & Engineering 11410 NE 122nd Way, Suite
TRAFFIC IMPACT STUDY. Platte Canyon Villas Arapahoe County, Colorado (Arapahoe County Case Number: Z16-001) For
 For") TRAFFIC IMPACT STUDY For Platte Canyon Villas Arapahoe County, Colorado (Arapahoe County Case Number: Z16-001) February 2015 Revised: August 2015 April 2016 July 2016 September 2016 Prepared for: KB Home
TRAFFIC IMPACT STUDY For Platte Canyon Villas Arapahoe County, Colorado (Arapahoe County Case Number: Z16-001) February 2015 Revised: August 2015 April 2016 July 2016 September 2016 Prepared for: KB Home
Regional Snapshot Series: Transportation and Transit. Commuting and Places of Work in the Fraser Valley Regional District
 Regional Snapshot Series: Transportation and Transit Commuting and Places of Work in the Fraser Valley Regional District TABLE OF CONTENTS Complete Communities Daily Trips Live/Work Ratio Commuting Local
CONTINUING PLANNING PROGRAM LOCAL TRANSPORTATION AND TRAFFIC DATA PRODUCT REPORT [OH Corridors]
![CONTINUING PLANNING PROGRAM LOCAL TRANSPORTATION AND TRAFFIC DATA PRODUCT REPORT [OH Corridors]](/thumbs/94/120123757.jpg "CONTINUING PLANNING PROGRAM LOCAL TRANSPORTATION AND TRAFFIC DATA PRODUCT REPORT [OH Corridors]") CONTINUING PLANNING PROGRAM LOCAL TRANSPORTATION AND TRAFFIC DATA PRODUCT REPORT [OH Corridors] Travel Time and Delay Analysis for Belpre (OH) and Marietta (OH) Fiscal Year 2009 Report WOOD WASHINGTON
CONTINUING PLANNING PROGRAM LOCAL TRANSPORTATION AND TRAFFIC DATA PRODUCT REPORT [OH Corridors] Travel Time and Delay Analysis for Belpre (OH) and Marietta (OH) Fiscal Year 2009 Report WOOD WASHINGTON
I-10 East at Redd closes for 24 hours this Sunday, Feb 11. Then, I-10 West at Resler closes for 27 hours on Feb 25
 NEWS RELEASE a TxDOT Project For immediate release EL PASO DISTRICT Jennifer Wright (915) 790-4340 Jennifer.Wright3@txdot.gov February 9, 2018 I-10 East at Redd closes for 24 hours this Sunday, Feb 11
Guidelines on Using California Land Use/Transportation Planning Tools
 Guidelines on Using California Land Use/Transportation Planning Tools 1. Selecting Ds Analysis Modules Appropriate to a Region In almost all cases, the appropriate Ds Analysis Module to use for analysis
HORIZON 2030: Land Use & Transportation November 2005
 PROJECTS Land Use An important component of the Horizon transportation planning process involved reviewing the area s comprehensive land use plans to ensure consistency between them and the longrange transportation
FARM 1065 PORTION 1, ATLANTIS TRAFFIC IMPACT ASSESSMENT
 FARM 1065 PORTION 1, ATLANTIS TRAFFIC IMPACT ASSESSMENT February 2018 FIRST ISSUE Prepared by: JG AFRIKA (PTY) LTD Branch: Cape Town PO Box 38561 Postal code: 7430 Telephone: 021 530 1800 Email: wink@
Table of Contents Introduction... 4 Study Area... 5
 Table of Contents Introduction... 4 Study Area... 5 Streets and s... 5 Traffic Volumes... 8 Recent and Anticipated Development... 10 Crash Analysis... 10 Projected Traffic Volumes... 11 Trip Generation...
Brandywine Road Speed Study FINAL REPORT
 Brandywine Road Speed Study FINAL REPORT City of Albuquerque Brandywine Road Speed Study Final Report Albuquerque, New Mexico City of Albuquerque May, 2016 Brandywine Road Speed Study Final Report City
APPENDIX I: Traffic Forecasting Model and Assumptions
 APPENDIX I: Traffic Forecasting Model and Assumptions Appendix I reports on the assumptions and traffic model specifications that were developed to support the Reaffirmation of the 2040 Long Range Plan.
Regional Performance Measures
 G Performance Measures Regional Performance Measures Introduction This appendix highlights the performance of the MTP/SCS for 2035. The performance of the Revenue Constrained network also is compared to
TRAVEL DEMAND MODEL. Chapter 6
 Chapter 6 TRAVEL DEMAND MODEL As a component of the Teller County Transportation Plan development, a computerized travel demand model was developed. The model was utilized for development of the Transportation
Alternatives Analysis
 Alternatives Analysis Prepared for: Metropolitan Atlanta Rapid Transit Authority Prepared by: AECOM/Jacobs-JJG Joint Venture Atlanta, GA November 2012 Page Left Intentionally Blank ii TABLE OF CONTENTS
River North Multi-Modal Transit Analysis
 River North Multi-Modal Transit Analysis November 7, 2006 Dan Meyers, AICP URS Corporation 612-373-6446 / dan_meyers@urscorp.com River North Study Area Reasons for initiating the study Downtown areas north
Sensitivity of estimates of travel distance and travel time to street network data quality
 Sensitivity of estimates of travel distance and travel time to street network data quality Paul Zandbergen Department of Geography University of New Mexico Outline Street network quality Approaches to
January 12, Mr. Ryan Granger TMGB Wilson, LLC 2221 Health Drive SW, Suite 2200 Wyoming, Michigan 49519
 January 12, 2018 Mr. Ryan Granger TMGB Wilson, LLC 2221 Health Drive SW, Suite 2200 Wyoming, Michigan 49519 Re: Proposed Reserve at Rivertown Mixed-Use Development Updated Trip Generation and Site Driveway
MULTIPLE CHOICE. Choose the one alternative that best completes the statement or answers the question.
 AP Test 13 Review Name MULTIPLE CHOICE. Choose the one alternative that best completes the statement or answers the question. 1) Compared to the United States, poor families in European cities are more
VALIDATING THE RELATIONSHIP BETWEEN URBAN FORM AND TRAVEL BEHAVIOR WITH VEHICLE MILES TRAVELLED. A Thesis RAJANESH KAKUMANI
 VALIDATING THE RELATIONSHIP BETWEEN URBAN FORM AND TRAVEL BEHAVIOR WITH VEHICLE MILES TRAVELLED A Thesis by RAJANESH KAKUMANI Submitted to the Office of Graduate Studies of Texas A&M University in partial
FHWA Planning Data Resources: Census Data Planning Products (CTPP) HEPGIS Interactive Mapping Portal
 HEPGIS Interactive Mapping Portal") FHWA Planning Data Resources: Census Data Planning Products (CTPP) HEPGIS Interactive Mapping Portal Jeremy Raw, P.E. FHWA, Office of Planning, Systems Planning and Analysis August 2017 Outline Census
FHWA Planning Data Resources: Census Data Planning Products (CTPP) HEPGIS Interactive Mapping Portal Jeremy Raw, P.E. FHWA, Office of Planning, Systems Planning and Analysis August 2017 Outline Census
Appendix B.1 EMME Model Calibration Memo
 Appendix B.1 EMME Model Calibration Memo itrans 144 Front Street West, Suite 655 Toronto, ON M5J 2L7 Tel: (416) 847-0005 Fax: (905) 882-1557 www.hdrinc.com www.itransconsulting.com File: 2.0 Memorandum
Travel Demand Management Plan
 Travel Demand Management Plan Tryg s & Apartment Building 8 West Lake Street Minneapolis, MN AUTHORIZED PROPERTY REPRESENTATIVE: By Dated: Mr. Johnny Carlson Trammell Crow Chicago Development, Inc. 5 South
A Study of Red Light Cameras in Kansas City, MO
 A Study of Red Light s in Kansas City, MO Prepared by the Special Operations Division Executive Summary This paper will analyze the crash data for the 29 red light cameras located in 17 intersections in
Changes in the Spatial Distribution of Mobile Source Emissions due to the Interactions between Land-use and Regional Transportation Systems
 Changes in the Spatial Distribution of Mobile Source Emissions due to the Interactions between Land-use and Regional Transportation Systems A Framework for Analysis Urban Transportation Center University
Project Appraisal Guidelines
 Project Appraisal Guidelines Unit 16.2 Expansion Factors for Short Period Traffic Counts August 2012 Project Appraisal Guidelines Unit 16.2 Expansion Factors for Short Period Traffic Counts Version Date
2014 Data Collection Project ITE Western District
 2014 Data Collection Project ITE Western District Project Completed By: Oregon State University OSU ITE Student Chapter 101 Kearney Hall Corvallis, OR 97331 Student Coordinator: Sarah McCrea (OSU ITE Student
2040 MTP and CTP Socioeconomic Data
 SE Data 6-1 24 MTP and CTP Socioeconomic Data Purpose of Socioeconomic Data The socioeconomic data (SE Data) shows the location of the population and employment, median household income and other demographic
The Journal of Database Marketing, Vol. 6, No. 3, 1999, pp Retail Trade Area Analysis: Concepts and New Approaches
 Retail Trade Area Analysis: Concepts and New Approaches By Donald B. Segal Spatial Insights, Inc. 4938 Hampden Lane, PMB 338 Bethesda, MD 20814 Abstract: The process of estimating or measuring store trade
HALFF 16196? TRAFFIC MANAGEMENT PLAN. Richardson ISD Aikin Elementary School Dallas, Texas North Bowser Road Richardson, Texas 75081
 30280 16196? TRAFFIC MANAGEMENT PLAN Exhibit 572B Aikin Elementary School Planned Development District No. 572 Approved City Plan Commission October20, 2016 July 12, 2016 Prepared for HALFF AVO 31586 PHO1
Regional Performance Measures
 G Performance Measures Regional Performance Measures Introduction This appendix highlights the performance of the MTP/SCS for 2035. The performance of the Revenue Constrained network also is compared to
BROOKINGS May
 Appendix 1. Technical Methodology This study combines detailed data on transit systems, demographics, and employment to determine the accessibility of jobs via transit within and across the country s 100
CITY OF CEDAR FALLS D O W N T O W N PA R K I N G S T U D Y P U B L I C W O R K S H O P D E C E M B E R 5,
 CITY OF CEDAR FALLS D O W N T O W N PA R K I N G S T U D Y P U B L I C W O R K S H O P D E C E M B E R 5, 2 0 1 8 PA R K I N G S T U D Y S C O P E O F W O R K Parking study methodology Parking inventory
Date: August 3, Project #:
 To: Mr. Warren Nighan Total Athletics 128 Devon Lane Marston Mills, Massachusetts 02648 From: Randall C. Hart, Director of Transportation Planning & Engineering Kathleen Keen, EIT Date: August 3, 2016
CITY OF NEW LONDON WINTER ROAD & SIDEWALK MAINTENANCE POLICY
 CITY OF NEW LONDON WINTER ROAD & SIDEWALK MAINTENANCE POLICY GENERAL The purpose of this policy is to set up acceptable procedures and policies for the winter maintenance of public areas in the City of
SBCAG Travel Model Upgrade Project 3rd Model TAC Meeting. Jim Lam, Stewart Berry, Srini Sundaram, Caliper Corporation December.
 SBCAG Travel Model Upgrade Project 3rd Model TAC Meeting Jim Lam, Stewart Berry, Srini Sundaram, Caliper Corporation December. 7, 2011 1 Outline Model TAZs Highway and Transit Networks Land Use Database
Project Level Traffic Forecast Report Business 40 Reconstruction Study Forsyth County
 Project Level Traffic Forecast Report Business 40 Reconstruction Study Forsyth County TIP No. U-2827 B WBS # 34872.1.1 June 2013 Prepared for North Carolina Department of Transportation Prepared by Project
PROPOSED PROJECT. Section PROJECT DESCRIPTION
 1 2 3 4 5 6 7 8 9 10 11 12 13 14 15 16 17 18 19 20 21 22 23 24 25 26 27 28 29 30 31 32 33 34 35 36 37 38 39 40 41 42 43 1.1 PROJECT DESCRIPTION This Environmental Assessment describes the proposed improvements
TRAFFIC ALERT FOR WEEK OF February 4 8, 2008
 TRAFFIC ALERT FOR WEEK OF February 4 8, 2008 Highway work zones in the Staunton District The following is a list of highway work that might affect traffic in the Staunton transportation district during
Assessing spatial distribution and variability of destinations in inner-city Sydney from travel diary and smartphone location data
 Assessing spatial distribution and variability of destinations in inner-city Sydney from travel diary and smartphone location data Richard B. Ellison 1, Adrian B. Ellison 1 and Stephen P. Greaves 1 1 Institute
Appendix J: Transportation and Circulation
 Appendix J: Transportation and Circulation J 1: Transportation Analysis Report J 2: Los Angeles Department of Transportation (LADOT) Approval Letter J 3: Construction Traffic Analysis J 1: Transportation
CHAPTER 3 TRANSPORTATION
 CHAPTER 3 TRANSPORTATION This chapter presents information on transportation impacts of Section 2 of the Project that have changed from those identified in the published Westside Subway Extension Final
US 169/I-70 North Loop Planning & Environmental Linkages Study
 US 169/I-70 North Loop Planning & Environmental Linkages Study VISSIM Calibration Document Draft April 13, 2018 Page i Table of Contents 1. Overview... 1 2. Data Types... 2 3. Model Parameter Adjustments...
Parking Study MAIN ST
 Parking Study This parking study was initiated to help understand parking supply and parking demand within Oneida City Center. The parking study was performed and analyzed by the Madison County Planning
APPENDIX G Halton Region Transportation Model
 APPENDIX G Halton Region Transportation Model Halton Region Transportation Master Plan Working Paper No. 1 - Legislative Context Working Paper No. 2 - Active Transportation Halton Transportation Model
Appendix C Final Methods and Assumptions for Forecasting Traffic Volumes
 Fairview Ave. and Main St. Improvements and Local Streets Plan Appendices Ada County Highway District Appendix C Final Methods and Assumptions for Forecasting Traffic Volumes January 3, 207 Appendices
April 10, Mr. Curt Van De Walle, City Manager City of Castle Hills 209 Lemonwood Drive Castle Hills, Texas 78213
 Mr. Curt Van De Walle, City Manager City of Castle Hills 209 Lemonwood Drive Castle Hills, Texas 78213 Subject: Revised Castle Hills BASIS Charter School Traffic Impact Analysis Review City of Castle Hills,
River Realty Services Commercial
 1 4 6 N O R T H U S 9 W, C O N G E R S, N Y 1 0 9 2 0 TA B L E O F C O N T E N T S E X E C U T I V E S U M M A RY 03 Z O N I N G 09 R EG I S T R AT I O N S 04 S U B J EC T P H OTO S 10 M A P V I E W 05
Appendix B. Durham Region Travel Demand Model Calibration
 Appendix B Durham Region Travel Demand Model Calibration AECOM 300 Water Street 905 668 9363 tel Whitby, ON, Canada L1N 9J2 905 668 0221 fax www.aecom.com To Ron Albright, Municipality of Clarington Page
2015 Grand Forks East Grand Forks TDM
 GRAND FORKS EAST GRAND FORKS 2015 TRAVEL DEMAND MODEL UPDATE DRAFT REPORT To the Grand Forks East Grand Forks MPO October 2017 Diomo Motuba, PhD & Muhammad Asif Khan (PhD Candidate) Advanced Traffic Analysis