Spatial Organization of Data and Data Extraction from Maptitude
|
|
|
- Francine Hunter
- 5 years ago
- Views:
Transcription


1 Spatial Organization of Data and Data Extraction from Maptitude N. P. Taliceo Geospatial Information Sciences The University of Texas at Dallas UT Dallas GIS Workshop Richardson, TX March 30 31, / 49
2 Outline 1 Spatial Organization of Data Description of Geographical Hierarchy Summary of Hierarchical Relationship 2 The U.S. Country Package The U.S. Geographic Data The U.S. Demographic Data 3 2/ 49
3 Description of Geographical Hierarchy Summary of Hierarchical Relationship Outline 1 Spatial Organization of Data Description of Geographical Hierarchy Summary of Hierarchical Relationship 2 The U.S. Country Package The U.S. Geographic Data The U.S. Demographic Data 3 3/ 49
4 Description of Geographical Hierarchy Summary of Hierarchical Relationship Census Summary Levels U.S. Census Bureau American FactFinder TIGER/Line 4/ 49

5 Description of Geographical Hierarchy Summary of Hierarchical Relationship Census Summary Levels Maptitude About Census Summary Levels Maptitude has 2010, 2000, and 1990 Census data 5/ 49
6 Description of Geographical Hierarchy Summary of Hierarchical Relationship Outline 1 Spatial Organization of Data Description of Geographical Hierarchy Summary of Hierarchical Relationship 2 The U.S. Country Package The U.S. Geographic Data The U.S. Demographic Data 3 6/ 49

 Block Groups A combination of")
7 Description of Geographical Hierarchy Summary of Hierarchical Relationship Blocks & Block Groups Blocks The smallest geographic unit from the U.S. Census About 11 million census blocks in the U.S. in 2010 Typically equivalent to the city block in size (except for in rural areas) Block Groups A combination of census blocks; a subdivision of census tracts Contain 600 to 3,000 people Made up of 40 census blocks About 220,000 block groups nationwide in / 49

8 Description of Geographical Hierarchy Summary of Hierarchical Relationship Census Tracts A small subdivision of a county The purpose is to present census data Designed to have relatively homogeneous units: Population characteristics Economic status Living conditions 1,500 to 8,000 people; about 4 block groups Maptitude tract mapping software 8/ 49


9 Description of Geographical Hierarchy Summary of Hierarchical Relationship Counties & County Subdivisions Counties The principal legal division in most states In Louisiana, called parishes There are no counties in Alaska ( census areas) In Puerto Rico, municipios County Subdivisions Subdivisions from the decennial census Includes civil divisions, census county divisions, census subareas, and unorganized territories 9/ 49
10 Description of Geographical Hierarchy Summary of Hierarchical Relationship Larger Area Data 1 States The primary governmental divisions of the United States 2 Census Places Census designated places, consolidated cities, and incorporated places A settled concentration of population identifiable by name but are not legally incorporated Exceptions: towns in New England, New York, and Wisconsin and the boroughs in New York (minor civil divisions), among others 3 Metropolitan Statistical Areas (MSAs) & Micropolitan Statistical Areas Geographically high population density in geographic regions with close economic ties Micropolitan statistical areas have a population of 10,000 to 49,999 10/ 49

11 Description of Geographical Hierarchy Summary of Hierarchical Relationship Other Available Summary Level Data Congressional Districts State Legislative Districts Voting Districts School Districts Urbanized Areas & Urban Clusters Traffic Analysis Zones (TAZs) 11/ 49
12 The U.S. Country Package The U.S. Geographic Data The U.S. Demographic Data Outline 1 Spatial Organization of Data Description of Geographical Hierarchy Summary of Hierarchical Relationship 2 The U.S. Country Package The U.S. Geographic Data The U.S. Demographic Data 3 12/ 49
13 The U.S. Country Package The U.S. Geographic Data The U.S. Demographic Data Features of Maptitude with the U.S. Country Package Nationwide maps with Census & ACS demographic data 5-Digit ZIP Code & ZIP Code Business Pattern Data Demographic data: income, age, gender, households, housing units, ethnicity, ancestry, employment, buying power, population projections, health insurance coverage, etc. Integration with Google Earth Supports most data in a variety of formats (e.g., spreadsheets, databases, etc.) 13/ 49

14 The U.S. Country Package The U.S. Geographic Data The U.S. Demographic Data 14/ 49

15 The U.S. Country Package The U.S. Geographic Data The U.S. Demographic Data 15/ 49
16 The U.S. Country Package The U.S. Geographic Data The U.S. Demographic Data Outline 1 Spatial Organization of Data Description of Geographical Hierarchy Summary of Hierarchical Relationship 2 The U.S. Country Package The U.S. Geographic Data The U.S. Demographic Data 3 16/ 49
17 The U.S. Country Package The U.S. Geographic Data The U.S. Demographic Data Nationwide Boundary Files Census places, census tracts, CBSAs, etc. Nationwide Geographic Data Layers Streets with address data for geocoding and travel time data Highways (interstate, U.S., state, and county; ferry routes) Building footprints (for major urban areas) Area and point landmarks (e.g., commercial buildings, shops, etc.) Railroads Miscellaneous U.S. Data Layers Area codes, combined statistical areas, major cities and state capitals, national parks, populated places, rivers, time zones, water areas, state plane coordinate systems 17/ 49
18 The U.S. Country Package The U.S. Geographic Data The U.S. Demographic Data Outline 1 Spatial Organization of Data Description of Geographical Hierarchy Summary of Hierarchical Relationship 2 The U.S. Country Package The U.S. Geographic Data The U.S. Demographic Data 3 18/ 49
19 The U.S. Country Package The U.S. Geographic Data The U.S. Demographic Data Finding Available Data Fields Demographic data is included in the U.S. Country package By default, includes 3- and 5-digit ZIP Codes and other demographic profiles Blocks and Block Groups are available separately for purchase unitedstates.htm 19/ 49
20 Outline 1 Spatial Organization of Data Description of Geographical Hierarchy Summary of Hierarchical Relationship 2 The U.S. Country Package The U.S. Geographic Data The U.S. Demographic Data 3 20/ 49
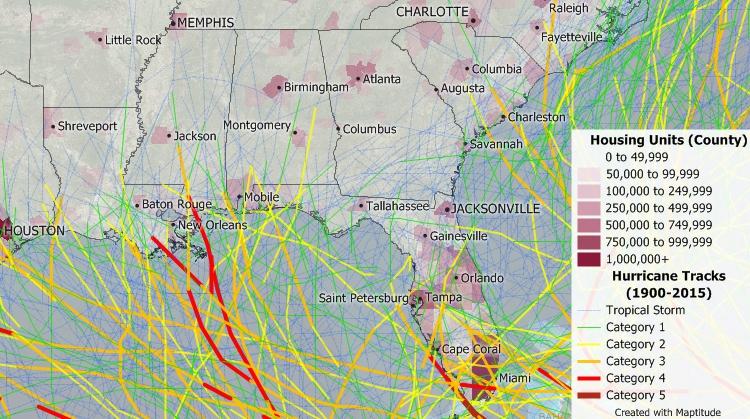
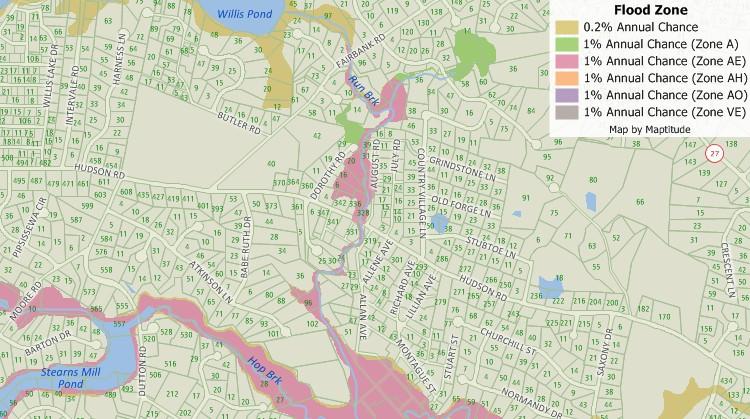
21 Assess risk exposure (overexposed & underexposed areas) Locate customers and resources (map policy holders, risk exposure, etc.) Analyze insurance underwriting (flood plains, proximity to fire stations, rental properties vs. home ownership, etc.) Find marketing opportunities Using your own data & models Provide customers with a web-map app to certain information 21/ 49
22 22/ 49
23 23/ 49
24 Outline 1 Spatial Organization of Data Description of Geographical Hierarchy Summary of Hierarchical Relationship 2 The U.S. Country Package The U.S. Geographic Data The U.S. Demographic Data 3 24/ 49
25 Task Data Extraction Using Maptitude Mise en scène Image that you work for an insurance company and need to collect data to include in your premium pricing model. What data do you need to collect? What level of geographic detail do you need to have? We will use Maptitude to collect necessary data at either the ZIP Code level or census tract level. These data can then be used in separate software (e.g., MS Excel, R, SAS, etc.). 25/ 49
26 A Caveat Reality to this Task Actual insurance companies pay large sums of money for premium data that contained detailed demographic and economic information. In addition, large amounts of private insurance related data are kept at the company-level. Therefore, realistic estimates of premium pricing are nearly impossible. Real models estimating base rate pricing are incredibly complicated, and are of course, proprietary. 26/ 49
27 Potential Variables Age distribution Automobile theft Credit score (not in Maptitude) Median income Medium home value Occupation Traffic volume estimates Travel demand average commute time 27/ 49

28 Spatial Organization of Data The Study Area DFW 28/ 49 N. P. Taliceo Spatial Organization of Data & Data Extraction
29 Outline 1 Spatial Organization of Data Description of Geographical Hierarchy Summary of Hierarchical Relationship 2 The U.S. Country Package The U.S. Geographic Data The U.S. Demographic Data 3 29/ 49

.")
30 Step 1a Location Selection: DFW 1 Open a new document by Display the Initial Map. Zoom to the DFW area, making an attempt to capture of the DFW metropolitan statistical area (MSA). Alternatively, you can use the find tool. 30/ 49


31 Step 1a Location Selection: DFW 2 Enable the MSA layer and right-click the layer Make Working Layer. In the selection window, use the Select by Pointing option or alternatively Selection Select by Condition. Another option is to select within the Dataview of the MSA layer. Select the Dallas-Fort Worth-Arlington MSA. 31/ 49

32 Step 1b Location Selection: ZIP Codes 3 Make the 5-digit ZIP Codes your working layer. 4 Navigate to Selection Select by Location Layer: MSA Selection Set: Selection Select 5-Digit ZIP Code feature that are: touching or contained 5 From these options, make a new selection set called DFW ZIP Codes This creates a selection issue in one case, we are not selecting all ZIP Codes, in another case, we are selecting too many ZIP Codes. 32/ 49

33 ZIP Code Select by Location: Inside 33/ 49

34 ZIP Code Select by Location: Touching or Contained 34/ 49

35 Step 1b Location Selection: ZIP Codes A solution to this problem is to clip the data to the DFW MSA layer. 6 Select the ZIP Codes according to the touching or contained specification. 7 Navigate to Tools Editing Clip Layers... and input the selection parameters in the image to the right. 35/ 49

36 ZIP Code Select by Location: Clipped 36/ 49
37 Step 1c Location Selection: Census Tracts 3 Make the census tracts your working layer. 4 Navigate to Selection Select by Location Layer: MSA Selection Set: DFW Metro (or Selection) Select Census Tract features that are: inside 5 From these options, make a new selection set called DFW CTs 37/ 49

38 Step 2a Selecting Relevant Fields 1 We first select the data that you want to choose to export. To do this, open the dataview of your current selection. 2 Click on the Show/Hide fields button 3 In the Show/Hide Fields window, select all relevant fields that you wish to export. Click OK. 38/ 49


39 Step 2a Selecting Relevant Fields You can manually select fields that are relevant by holding <CTRL> + left-click the field of interest. Alternatively, you can filter available fields with a common keyword in the name. HH, Age, Male, or Female This is useful for repetitive field names 4 Navigate to File Save As. Save your dataview as whatever file type you wish (MS Excel.xlxs extension recommended). 39/ 49


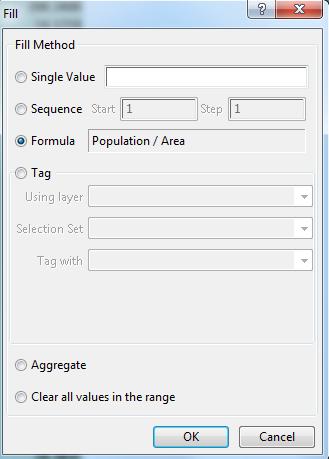
40 Step 2b Calculating Fields You can calculate fields within dataviews. For this example, we will calculate the population density. Ensure that the area and population fields are visible. 1 Click on the formula field icon. 2 Create and name a formula using the drop-down windows. Click OK. 40/ 49

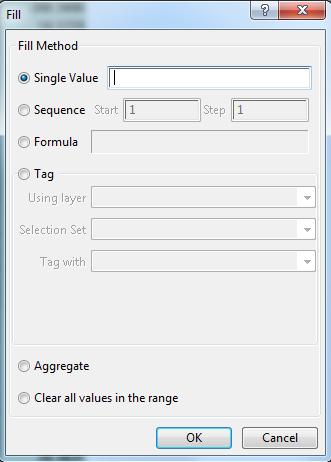
41 Step 2b Calculating Fields Notice that the new field is highlighted in green. This field is only a temporary calculation; if you want to open this data in Maptitude again, you must save it in a permanent field. 3 Click on the modify table icon. 4 Click on the Add Field button and give the field an appropriate name and data type. Click OK. 5 Right-click on the new field Fill... Formula. 6 Use the saved formula from the temporary field. Click OK. 41/ 49
42 Step 2b Calculating Fields 42/ 49

43 Step 2b Calculating Fields 43/ 49

44 Step 2c Calculating Statistics 1 You can use the compute statistics tool when the dataview is open to view summary statistics about your data. 44/ 49

45 Step 3a Exporting Data as a Shapefile 1 Once the data is selected, go to File Export Geography. Export: Selection To: ESRI Shape 2 Several files that comprise the shapefile will be exported to your local disk. 3 The DBF file will contain all relevant selected data per ZIP Code. 45/ 49

46 Step 3b Importing Data into MS Excel Only if you want the data directly from a shapefile database. 1 Right-click on the shapefile s DBF file Copy Paste. 2 Change the extension from a.dbf to.csv. Click OK when the warning prompts. 3 Double-click on the new file to open in MS Excel. 4 Delete irrelevant columns. 46/ 49
47 Summary Additional Resources Questions Summary and Conclusions Much of the geographic hierarchy data is available pre-installed or for purchase in the Maptitude software. Up-to-date country-level geographic and demographic data are available for download, along with a variety of nationwide data layers. It is easy to find geographic and demographic data using Maptitude, and to then export these data for further analysis in third party software. 47/ 49
48 Summary Additional Resources Questions Additional Resources Additional data available for download: download-category/ To access information about data packages, in Maptitude, navigate to Help Data Package Help U.S. Region Help (HERE). For additional information on census summary levels, visit: summarylevels.htm For information on available United States data, visit: unitedstates.htm 48/ 49
49 Summary Additional Resources Questions Questions? 49/ 49
US Census Bureau Geographic Entities and Concepts. Geography Division
 US Census Bureau Geographic Entities and Concepts Geography Division Geographic Concepts Addresses vs. Geographic features and entities Legal/Administrative vs. Statistical Nesting relationships (or the
Using American Factfinder
 Using American Factfinder What is American Factfinder? American Factfinder is a search engine that provides access to the population, housing and economic data collected by the U.S. Census Bureau. It can
Working with Census 2000 Data from MassGIS
 Tufts University GIS Tutorial Working with Census 2000 Data from MassGIS Revised September 26, 2007 Overview In this tutorial, you will use pre-processed census data from Massachusetts to create maps of
Utilizing Data from American FactFinder with TIGER/Line Shapefiles in ArcGIS
 Utilizing Data from American FactFinder with TIGER/Line Shapefiles in ArcGIS Web Adams, GISP Data Dissemination Specialist U.S. Census Bureau New York Regional Office 1 What We Do Decennial Census Every
GIS Lecture 5: Spatial Data
 GIS Lecture 5: Spatial Data GIS 1 Outline Vector Data Formats Raster Data Formats Map Projections Coordinate Systems US Census geographic files US Census data files GIS Data Sources GIS 2 Vector Data Formats
Are You Maximizing The Value Of All Your Data?
 Are You Maximizing The Value Of All Your Data? Using The SAS Bridge for ESRI With ArcGIS Business Analyst In A Retail Market Analysis SAS and ESRI: Bringing GIS Mapping and SAS Data Together Presented
WlLPEN L. GORR KRISTEN S. KURLAND. Universitats- und Landesbibliothek. Bibliothek Architektur und Stadtebau ESRI
 hj WlLPEN L. GORR KRISTEN S. KURLAND Universitats- und Landesbibliothek Darmstadt Bibliothek Architektur und Stadtebau ESRI Contents Acknowledgments Preface xvii XV GIS Tutorial 1 Introduction Launch ArcMap
BROOKINGS May
 Appendix 1. Technical Methodology This study combines detailed data on transit systems, demographics, and employment to determine the accessibility of jobs via transit within and across the country s 100
2010 Census Data Release and Current Geographic Programs. Michaellyn Garcia Geographer Seattle Regional Census Center
 2010 Census Data Release and Current Geographic Programs Michaellyn Garcia Geographer Seattle Regional Census Center 2010 Center of Population Located approximately 2.7 miles northeast of Plato, Missouri
Guide to the Data-Driven Planning Toolkit in CPD Maps
 The econ Planning Suite: Guide to the Data-Driven Planning Toolkit in CPD Maps Version: April 2014 TABLE OF CONTENTS Introduction... 1 The Data-Driven Planning Toolkit... 3 Overview of the Basic Model...
Map your way to deeper insights
 Map your way to deeper insights Target, forecast and plan by geographic region Highlights Apply your data to pre-installed map templates and customize to meet your needs. Select from included map files
Acknowledgments xiii Preface xv. GIS Tutorial 1 Introducing GIS and health applications 1. What is GIS? 2
 Acknowledgments xiii Preface xv GIS Tutorial 1 Introducing GIS and health applications 1 What is GIS? 2 Spatial data 2 Digital map infrastructure 4 Unique capabilities of GIS 5 Installing ArcView and the
The econ Planning Suite: CPD Maps and the Con Plan in IDIS for Consortia Grantees Session 1
 The econ Planning Suite: CPD Maps and the Con Plan in IDIS for Consortia Grantees Session 1 1 Training Objectives Use CPD Maps to analyze, assess, and compare levels of need in your community Use IDIS
Institutional Research with Public Data and Open Source Software
 2017 Institutional Research with Public Data and Open Source Software DUE1304591, 1644409, 1700496 Opinions expressed are those of the authors and not necessarily those of the National Science Foundation.
Demographic Data in ArcGIS. Harry J. Moore IV
 Demographic Data in ArcGIS Harry J. Moore IV Outline What is demographic data? Esri Demographic data - Real world examples with GIS - Redistricting - Emergency Preparedness - Economic Development Next
The Church Demographic Specialists
 The Church Demographic Specialists Easy-to-Use Features Map-driven, Web-based Software An Integrated Suite of Information and Query Tools Providing An Insightful Window into the Communities You Serve Key
Geographic Products and Data. Improvements in Spatial Accuracy and Accessing Data
 Geographic Products and Data Improvements in Spatial Accuracy and Accessing Data How it Began TIGER was internally developed to support the 1990 Decennial Census operations Used data sources such as USGS
Census Transportation Planning Products (CTPP)
") Census Transportation Planning Products (CTPP) Penelope Weinberger CTPP Program Manager - AASHTO September 15, 2010 1 What is the CTPP Program Today? The CTPP is an umbrella program of data products, custom
Census Transportation Planning Products (CTPP) Penelope Weinberger CTPP Program Manager - AASHTO September 15, 2010 1 What is the CTPP Program Today? The CTPP is an umbrella program of data products, custom
GIS Analysis of Crenshaw/LAX Line
 PDD 631 Geographic Information Systems for Public Policy, Planning & Development GIS Analysis of Crenshaw/LAX Line Biying Zhao 6679361256 Professor Barry Waite and Bonnie Shrewsbury May 12 th, 2015 Introduction
Appendix B: Data Sources. In this exercise you will: Find data sources Download needed data
 In this exercise you will: Find data sources Download needed data California data Consult your instructor regarding California data sources. Page 2 National Park Service data Consult your instructor regarding
Geographic Systems and Analysis
 Geographic Systems and Analysis New York University Robert F. Wagner Graduate School of Public Service Instructor Stephanie Rosoff Contact: stephanie.rosoff@nyu.edu Office hours: Mondays by appointment
The History Behind Census Geography
 The History Behind Census Geography Michael Ratcliffe Geography Division US Census Bureau Kentucky State Data Center Affiliate Meeting August 5, 2016 Today s Presentation A brief look at the history behind
A Street Named for a King
 A Street Named for a King Dr. Jerry Mitchell University of South Carolina OVERVIEW This lesson adapts the work of Dr. Derek Alderman, a geographer who has used the Martin Luther King, Jr. street-naming
Exercise on Using Census Data UCSB, July 2006
 Exercise on Using Census Data UCSB, July 2006 Purpose The purpose of this lab is to become familiar with Census Bureau data. Second, we will learn how to join tables which allows you to add data to the
The History Behind Census Geography
 The History Behind Census Geography Michael Ratcliffe Geography Division US Census Bureau Tennessee State Data Center August 8, 2017 Today s Presentation A brief look at the history behind some of the
CRP 608 Winter 10 Class presentation February 04, Senior Research Associate Kirwan Institute for the Study of Race and Ethnicity
 CRP 608 Winter 10 Class presentation February 04, 2010 SAMIR GAMBHIR SAMIR GAMBHIR Senior Research Associate Kirwan Institute for the Study of Race and Ethnicity Background Kirwan Institute Our work Using
FHWA Planning Data Resources: Census Data Planning Products (CTPP) HEPGIS Interactive Mapping Portal
 HEPGIS Interactive Mapping Portal") FHWA Planning Data Resources: Census Data Planning Products (CTPP) HEPGIS Interactive Mapping Portal Jeremy Raw, P.E. FHWA, Office of Planning, Systems Planning and Analysis August 2017 Outline Census
FHWA Planning Data Resources: Census Data Planning Products (CTPP) HEPGIS Interactive Mapping Portal Jeremy Raw, P.E. FHWA, Office of Planning, Systems Planning and Analysis August 2017 Outline Census
Internet GIS Sites. 2 OakMapper webgis Application
 Internet GIS Sites # Name URL Description 1 City of Sugar Land http://www.sugarlandtx.gov/index.htm It is a city in Texas with 65,000 Residents. The City of Sugar Land, Texas, provides ArcIMS-based maps
A Comprehensive Method for Identifying Optimal Areas for Supermarket Development. TRF Policy Solutions April 28, 2011
 A Comprehensive Method for Identifying Optimal Areas for Supermarket Development TRF Policy Solutions April 28, 2011 Profile of TRF The Reinvestment Fund builds wealth and opportunity for lowwealth communities
An Introduction to China and US Map Library. Shuming Bao Spatial Data Center & China Data Center University of Michigan
 An Introduction to China and US Map Library Shuming Bao Spatial Data Center & China Data Center University of Michigan Current Spatial Data Services http://chinadataonline.org China Geo-Explorer http://chinageoexplorer.org
An Assessment of People, Place and Business on Syracuse s Near Northside
 An Assessment of People, Place and Business on Syracuse s Near Northside May 2013 Report produced by Jon Glass, Kelly Montague and Mark Pawliw Edited by Jon Glass and Jonnell Robinson Syracuse Community
Using ArcGIS Server to Bring Geospatial Analysis
 Using ArcGIS Server to Bring Geospatial Analysis and Mapping to non-gis Analysts ESRI Health User Conference September 22, 2009 Jim Laramie, Altarum Institute Sam Wang, Altarum Institute Agenda Agenda
Policy Paper Alabama Primary Care Service Areas
 Aim and Purpose Policy Paper Alabama Primary Care Service Areas Produced by the Office for Family Health Education & Research, UAB School of Medicine To create primary care rational service areas (PCSA)
Neighborhood Locations and Amenities
 University of Maryland School of Architecture, Planning and Preservation Fall, 2014 Neighborhood Locations and Amenities Authors: Cole Greene Jacob Johnson Maha Tariq Under the Supervision of: Dr. Chao
Child Opportunity Index Mapping
 Child Opportunity Index Mapping A partnership project of How to Use and Interpret the Child Opportunity Index Maps How to Use the Child Opportunity Index Maps Getting Started: How to Find and Open a Child
Problems In Large Cities
 Chapter 11 Problems In Large Cities Create a list of at least 10 problems that exist in large cities. Consider problems that you have read about in this and other chapters and/or experienced yourself.
MIS 0855 Data Science (Section 005) Fall 2016 In-Class Exercise (Week 4) Visualizing with Maps
 Fall 2016 In-Class Exercise (Week 4) Visualizing with Maps") MIS 0855 Data Science (Section 005) Fall 2016 In-Class Exercise (Week 4) Visualizing with Maps Objective: Learn how to use Tableau s powerful mapping tools Learning Outcomes: Learn at what levels (e.g.
MIS 0855 Data Science (Section 005) Fall 2016 In-Class Exercise (Week 4) Visualizing with Maps Objective: Learn how to use Tableau s powerful mapping tools Learning Outcomes: Learn at what levels (e.g.
Inclusion of Non-Street Addresses in Cancer Cluster Analysis
 Inclusion of Non-Street Addresses in Cancer Cluster Analysis Sue-Min Lai, Zhimin Shen, Darin Banks Kansas Cancer Registry University of Kansas Medical Center KCR (Kansas Cancer Registry) KCR: population-based
IMPERIAL COUNTY PLANNING AND DEVELOPMENT
 IMPERIAL COUNTY PLANNING AND DEVELOPMENT GEODATABASE USER MANUAL FOR COUNTY BUSINESS DEVELOPMENT GIS June 2010 Prepared for: Prepared by: County of Imperial Planning and Development 801 Main Street El
Preparing Spatial Data
 13 CHAPTER 2 Preparing Spatial Data Assessing Your Spatial Data Needs 13 Assessing Your Attribute Data 13 Determining Your Spatial Data Requirements 14 Locating a Source of Spatial Data 14 Performing Common
Community Opportunity Map
 Community Opportunity Map User Guide and FAQs UPDATED FEBRUARY 2018 Contents User Guide... 2 Overview... 2 Choosing a location... 3 Search for a city or address... 4 Select a county or ZIP code... 4 Explore
INSIDE. Metric Descriptions by Topic Area. Data Sources and Methodology by Topic Area. Technical Appendix
 As part of the Chicago Neighborhoods 2015 (CN2015) project, the Institute for Housing Studies at DePaul University collected data and built metrics to help The Chicago Community Trust and the City of Chicago
Rural Pennsylvania: Where Is It Anyway? A Compendium of the Definitions of Rural and Rationale for Their Use
 Rural Pennsylvania: Where Is It Anyway? A Compendium of the Definitions of Rural and Rationale for Their Use Pennsylvania Office of Rural Health 310 Nursing Sciences Building University Park, PA 16802
Evaluating Community Analyst for Use in School Demography Studies
 Portland State University PDXScholar Publications, Reports and Presentations Population Research Center 7-2013 Evaluating Community Analyst for Use in School Demography Studies Richard Lycan Portland State
SUPPORTS SUSTAINABLE GROWTH
 DDSS BBUUN NDDLLEE G E O S P AT I A L G O V E R N A N C E P A C K A G E SUPPORTS SUSTAINABLE GROWTH www.digitalglobe.com BRISBANE, AUSTRALIA WORLDVIEW-3 30 CM International Civil Government Programs US
GIS ANALYSIS METHODOLOGY
 GIS ANALYSIS METHODOLOGY No longer the exclusive domain of cartographers, computer-assisted drawing technicians, mainframes, and workstations, geographic information system (GIS) mapping has migrated to
ArcGIS 9 ArcGIS StreetMap Tutorial
 ArcGIS 9 ArcGIS StreetMap Tutorial Copyright 2001 2008 ESRI All Rights Reserved. Printed in the United States of America. The information contained in this document is the exclusive property of ESRI. This
GIS-Based Analysis of the Commuting Behavior and the Relationship between Commuting and Urban Form
 GIS-Based Analysis of the Commuting Behavior and the Relationship between Commuting and Urban Form 1. Abstract A prevailing view in the commuting is that commuting would reconstruct the urban form. By
Tutorial using the 2011 Statistics Canada boundary files and the Householder survey
 Tutorial using the 2011 Statistics Canada boundary files and the Householder survey In this tutorial, we ll try to determine the wards that contain the highest income groups. To do this, we will have to
Neighborhood social characteristics and chronic disease outcomes: does the geographic scale of neighborhood matter? Malia Jones
 Neighborhood social characteristics and chronic disease outcomes: does the geographic scale of neighborhood matter? Malia Jones Prepared for consideration for PAA 2013 Short Abstract Empirical research
Speakers: Jeff Price, Federal Transit Administration Linda Young, Center for Neighborhood Technology Sofia Becker, Center for Neighborhood Technology
 Speakers: Jeff Price, Federal Transit Administration Linda Young, Center for Neighborhood Technology Sofia Becker, Center for Neighborhood Technology Peter Haas, Center for Neighborhood Technology Craig
GeoPostcodes. Trinidad & Tobago
 Trinidad & Tobago Trinidad & Tobago About.com Launched in 2007, website offers comprehensive and reliable databases of localities, streets, administrative regions, ZIP/postal codes and lots of other information
User Guide. Affirmatively Furthering Fair Housing Data and Mapping Tool. U.S. Department of Housing and Urban Development
 User Guide Affirmatively Furthering Fair Housing Data and Mapping Tool U.S. Department of Housing and Urban Development December, 2015 1 Table of Contents 1. Getting Started... 5 1.1 Software Version...
Medical GIS: New Uses of Mapping Technology in Public Health. Peter Hayward, PhD Department of Geography SUNY College at Oneonta
 Medical GIS: New Uses of Mapping Technology in Public Health Peter Hayward, PhD Department of Geography SUNY College at Oneonta Invited research seminar presentation at Bassett Healthcare. Cooperstown,
Demographic characteristics of the School of International Studies 9 th Grade class and their success their first semester.
 Project Tutorial 1. Topic Demographic characteristics of the School of International Studies 9 th Grade class and their success their first semester. 2. Research Question/Problem For the 9 th Grade class
 www.goldensoftware.com Why Create a Thematic Map? A thematic map visually represents the geographic distribution of data. MapViewer will help you to: understand demographics define sales or insurance territories
Orien Ori t en a t tion a Webi W nar: ebi CPD Maps 2
 Orientation Webinar: CPD Maps 2 Agenda 1. Background - econ Planning Suite 2. Expanded Planning Data 3. CPD Maps Overview 4. Demonstration Guide Me Wizard Map Selection Identify Tool Printing and Saving
Theory, Concepts and Terminology
 GIS Workshop: Theory, Concepts and Terminology 1 Theory, Concepts and Terminology Suggestion: Have Maptitude with a map open on computer so that we can refer to it for specific menu and interface items.
2020 Census Participant Statistical Areas Program (PSAP) Standard Statistical Geography Webinar
 Standard Statistical Geography Webinar") 2020 Census Participant Statistical Areas Program (PSAP) Standard Statistical Geography Webinar Agenda PSAP Overview. Schedule. Materials. Standard Statistical Geography Overview. Geographic Update Partnership
2020 Census Participant Statistical Areas Program (PSAP) Standard Statistical Geography Webinar Agenda PSAP Overview. Schedule. Materials. Standard Statistical Geography Overview. Geographic Update Partnership
Spotlight on Population Resources for Geography Teachers. Pat Beeson, Education Services, Australian Bureau of Statistics
 Spotlight on Population Resources for Geography Teachers Pat Beeson, Education Services, Australian Bureau of Statistics Population Population size Distribution Age Structure Ethnic composition Gender
GIS Spatial Statistics for Public Opinion Survey Response Rates
 GIS Spatial Statistics for Public Opinion Survey Response Rates July 22, 2015 Timothy Michalowski Senior Statistical GIS Analyst Abt SRBI - New York, NY t.michalowski@srbi.com www.srbi.com Introduction
GIS 520 Data Cardinality. Joining Tabular Data to Spatial Data in ArcGIS
 GIS 520 Data Cardinality Joining Tabular Data to Spatial Data in ArcGIS Joining Tabular Data to Spatial Data in ArcGIS Outline Working with Zip Code Data Data Cardinality Issues Exploring Data Format Requirements
Gis Unit TropMed Mahidol U.
 Gis Unit TropMed Mahidol U. Database Information System Database Concepts 1. Non-Spatial Database table, document.. 2. Spatial Database locational databases (geographic) + attribute databases Gis Unit
Compilation of GIS data for the Lower Brazos River basin
 Compilation of GIS data for the Lower Brazos River basin Francisco Olivera, Ph.D., P.E. Srikanth Koka Lauren Walker Aishwarya Vijaykumar Department of Civil Engineering December 5, 2011 Contents Brief
BENBROOK ECONOMIC DEVELOPMENT CORPORATION COME GROW WITH US.
 BENBROOK ECONOMIC DEVELOPMENT CORPORATION COME GROW WITH US www.benbrook-tx.gov Introduction: Who Are We Video included 04 Benbrook Demographics Click for larger image of aerial 05 Retail Opportunites
Demographic Data. How to get it and how to use it (with caution) By Amber Keller
 By Amber Keller") Demographic Data How to get it and how to use it (with caution) By Amber Keller 101 Where does it come from? o The American Community Survey o Socio-economic characteristics of a population o Administered
Demographic Data How to get it and how to use it (with caution) By Amber Keller 101 Where does it come from? o The American Community Survey o Socio-economic characteristics of a population o Administered
GeoPostcodes. Luxembourg
 Luembourg Luembourg About.com Launched in 2007, website offers comprehensive and reliable databases of localities, streets, administrative regions, ZIP/postal codes and lots of other information for all
Rural Alabama. Jennifer Zanoni. Geography Division U.S. Census Bureau. Alabama State Data Center 2018 Data Conference Tuscaloosa, Alabama
 Rural Alabama Jennifer Zanoni Geography Division U.S. Census Bureau Alabama State Data Center 2018 Data Conference Tuscaloosa, Alabama May 17, 2018 Agenda Census Geography Urban/Rural Definitions County-based
In this exercise we will learn how to use the analysis tools in ArcGIS with vector and raster data to further examine potential building sites.
 GIS Level 2 In the Introduction to GIS workshop we filtered data and visually examined it to determine where to potentially build a new mixed use facility. In order to get a low interest loan, the building
pdcensus2010 User Guide Census Demographics Database
 [Type text] Version 1.0 7 pdcensus2010 User Guide Census Demographics Database An easy-to-use, comprehensive, and up-to-date United States demographics package drawn from U.S. Census Bureau 2010 Census
High Speed / Commuter Rail Suitability Analysis For Central And Southern Arizona
 High Speed / Commuter Rail Suitability Analysis For Central And Southern Arizona Item Type Reports (Electronic) Authors Deveney, Matthew R. Publisher The University of Arizona. Rights Copyright is held
MULTIPLE CHOICE. Choose the one alternative that best completes the statement or answers the question.
 AP Test 13 Review Name MULTIPLE CHOICE. Choose the one alternative that best completes the statement or answers the question. 1) Compared to the United States, poor families in European cities are more
Understanding China Census Data with GIS By Shuming Bao and Susan Haynie China Data Center, University of Michigan
 Understanding China Census Data with GIS By Shuming Bao and Susan Haynie China Data Center, University of Michigan The Census data for China provides comprehensive demographic and business information
Final Group Project Paper. Where Should I Move: The Big Apple or The Lone Star State
 Final Group Project Paper Where Should I Move: The Big Apple or The Lone Star State By: Nathan Binder, Shannon Scolforo, Kristina Conste, Madison Quinones Main Goal: Determine whether New York or Texas
What are we like? Population characteristics from UK censuses. Justin Hayes & Richard Wiseman UK Data Service Census Support
 What are we like? Population characteristics from UK censuses Justin Hayes & Richard Wiseman UK Data Service Census Support Who are we? Richard Wiseman UK Data Service / Jisc Justin Hayes UK Data Service
3/21/2019. Q: What is this? What is in this area of the country? Q: So what is this? GEOG 3100 Next Week
 Tuesday: Thursday: GEOG 3100 Next Week Discussion of The South region (in this room) GIS Computer Lab Time (ENV Building, Room 340 more on this in class on Tuesday next week) Ahead of this lab time, please
2014 Planning Database (PDB)
") 2014 Planning Database (PDB) November 19, 2014 Barbara O Hare, Nancy Bates, Julia Coombs, Travis Pape, Chandra Erdman Office of Survey Analytics 1 Overview Tract and Block Group PDBs Useful for: Identifying
2014 Planning Database (PDB) November 19, 2014 Barbara O Hare, Nancy Bates, Julia Coombs, Travis Pape, Chandra Erdman Office of Survey Analytics 1 Overview Tract and Block Group PDBs Useful for: Identifying
Write a report (6-7 pages, double space) on some examples of Internet Applications. You can choose only ONE of the following application areas:
 on some examples of Internet Applications. You can choose only ONE of the following application areas:") UPR 6905 Internet GIS Homework 1 Yong Hong Guo September 9, 2008 Write a report (6-7 pages, double space) on some examples of Internet Applications. You can choose only ONE of the following application
UPR 6905 Internet GIS Homework 1 Yong Hong Guo September 9, 2008 Write a report (6-7 pages, double space) on some examples of Internet Applications. You can choose only ONE of the following application
Hazus Methodology and Results Report
 Cumberland County 2014 All-Hazard Mitigation Plan Update Appendix G Hazus Methodology and Results Report The Cumberland County HMP used an enhanced Hazus run to model the 1% annual-chanceflood. Enhancements
New Zealand Population Distribution
 New Zealand Population Distribution Requirements: Internet access Web browser (e.g. Internet Explorer, Mozilla Firefox, Google Chrome)** An Esri Global Account **Please insure that pop ups are not blocked
GIS = Geographic Information Systems;
 What is GIS GIS = Geographic Information Systems; What Information are we talking about? Information about anything that has a place (e.g. locations of features, address of people) on Earth s surface,
Introduction to GIS. Dr. M.S. Ganesh Prasad
 Introduction to GIS Dr. M.S. Ganesh Prasad Department of Civil Engineering The National Institute of Engineering, MYSORE ganeshprasad.nie@gmail.com 9449153758 Geographic Information System (GIS) Information
Application of GIS in Public Transportation Case-study: Almada, Portugal
 Case-study: Almada, Portugal Doutor Jorge Ferreira 1 FSCH/UNL Av Berna 26 C 1069-061 Lisboa, Portugal +351 21 7908300 jr.ferreira@fcsh.unl.pt 2 FSCH/UNL Dra. FCSH/UNL +351 914693843, leite.ines@gmail.com
(THIS IS AN OPTIONAL BUT WORTHWHILE EXERCISE)
") PART 2: Analysis in ArcGIS (THIS IS AN OPTIONAL BUT WORTHWHILE EXERCISE) Step 1: Start ArcCatalog and open a geodatabase If you have a shortcut icon for ArcCatalog on your desktop, double-click it to start
PART 2: Analysis in ArcGIS (THIS IS AN OPTIONAL BUT WORTHWHILE EXERCISE) Step 1: Start ArcCatalog and open a geodatabase If you have a shortcut icon for ArcCatalog on your desktop, double-click it to start
GeoPostcodes. Denmark
 Denmark Denmark About.com Launched in 2007, website offers comprehensive and reliable databases of localities, streets, administrative regions, ZIP/postal codes and lots of other information for all countries.
KENTUCKY HAZARD MITIGATION PLAN RISK ASSESSMENT
 KENTUCKY HAZARD MITIGATION PLAN RISK ASSESSMENT Presentation Outline Development of the 2013 State Hazard Mitigation Plan Risk Assessment Determining risk assessment scale Census Data Aggregation Levels
Abstract: Contents. Literature review. 2 Methodology.. 2 Applications, results and discussion.. 2 Conclusions 12. Introduction
 Abstract: Landfill is one of the primary methods for municipal solid waste disposal. In order to reduce the environmental damage and to protect the public health and welfare, choosing the site for landfill
CHANGES IN ETHNIC GEOGRAPHY IN WATERBURY AS A RESULT OF NATURAL DISASTERS AND URBAN RENEWAL
 G-1302: GIS and Environmental Modeling Final Project Report December 4, 2012 Student: David Perrier Instructor: Tatiana Serebriakova, Ph.D. CHANGES IN ETHNIC GEOGRAPHY IN WATERBURY AS A RESULT OF NATURAL
Module 10 Summative Assessment
 Module 10 Summative Assessment Activity In this activity you will use the three dimensions of vulnerability that you learned about in this module exposure, sensitivity, and adaptive capacity to assess