Utilizing Data from American FactFinder with TIGER/Line Shapefiles in ArcGIS
|
|
|
- Mervin McKenzie
- 6 years ago
- Views:
Transcription
1 Utilizing Data from American FactFinder with TIGER/Line Shapefiles in ArcGIS Web Adams, GISP Data Dissemination Specialist U.S. Census Bureau New York Regional Office 1
2 What We Do Decennial Census Every 10 years, Counts Residents American Community Survey (ACS) Annual Social, Economic and Housing data Other Surveys and Censuses Population Estimates Economic Census 2
3 2010 Census vs. ACS 2010 Census American Community Survey 2000 Long Form SF3 & SF4 100 % Data How many people live in the U.S.? Point in time April 1, 2010 Count - People, Housing units Sample Data How do people live in the U.S.? Period in Time 1yr, 3yr, 5yr Characteristics Income, Poverty, Education 3
4 4
 3.")
5 Census Tracts are small, relatively permanent statistical areas of a county and generally have a population of 1,500 to 8,000 (optimum 4,000) 2. Block Groups are statistical areas of a census tract and generally have a population of 600 to 3,000 (optimum 1,500) 3. Blocks are the smallest area within a census tract for which 100% data is tabulated Many blocks correspond to individual city blocks bounded by streets, but blocks especially in rural areas may include many square miles and may have some boundaries that are not streets. 5
6 3 Methods of Acquiring TIGER GIS Files Via American Fact Finder Flexible, user may select the geographies of immediate interest Only a single data field per downloaded shapefile Via TIGER website Contains index field (GEOID) to join with all downloaded Census Bureau data tables Less flexible, may only download by state or county TIGER Geodatabase 6

7 Select Data Tools and Apps then American FactFinder 7

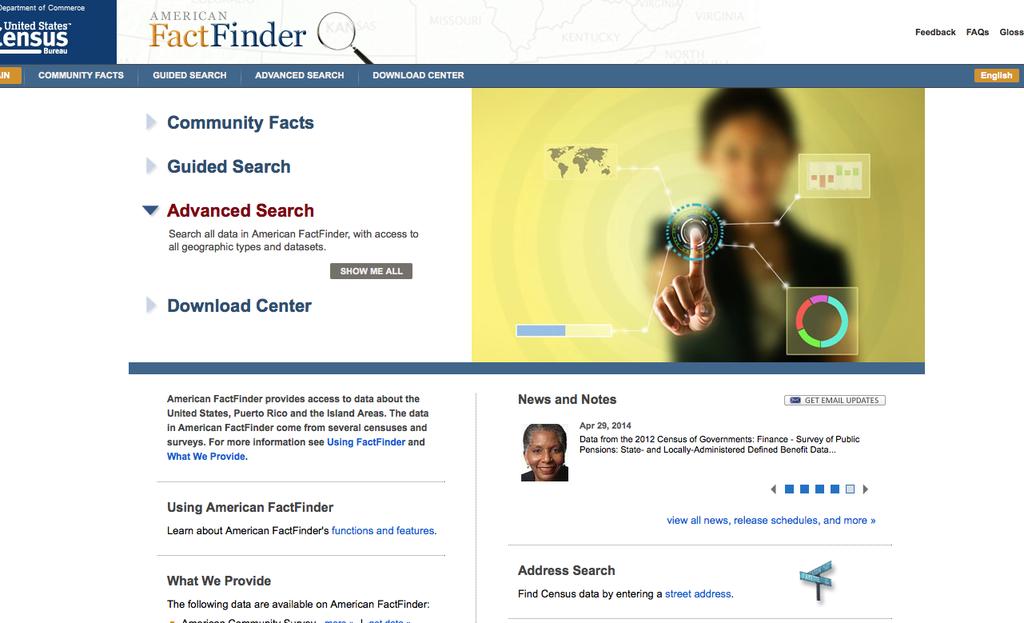
8 AFF Homepage Click on Advanced Search 8
9 9

10 To Select All Municipalities in Essex Co., NJ 10

11 To Select For Individual Income 11

12 To Select For Per Capita Income 12

13 The Data Table 13

14 The Map & Download Interface 14

15 Click OK. Click Download. Open with WinZip Select All & Drag & Drop Into Local Folder 15

16 Open In ArcMap 16

17 Join In ArcMap 17

18 Categorize by DATA_VALUE 18

19 Categorized With Labels 19

20 To Select Tracts Along a Rivershed 20

21 To Select Tracts Along a Rivershed 21

22 To Select Tracts Along a Rivershed 22

23 To Select Tracts Along a Rivershed 23

24 The Selected Census Tracts 24

25 To Select for Children Under 18 25

26 To Select for Children Under 18 26

27 Create A Map of the Selection 27

28 Download A Shapefile 28

29 Census Tracts of the Lower Passaic River Valley In ArcGIS 29
30 Downloading TIGER Shapefiles You will need the following to use these instructions: An Internet browser Internet Explorer or Mozilla Firefox. A utility to unzip files, such as WinZip. Data processing software, such as Microsoft Excel Esri s ArcGIS, version 10.x In these instructions, we will map the 2013 median age by census tract for New Jersey. First, we will download the table from American FactFinder. Then, we will download the TIGER/Line Shapefile. Finally, we will join the two in ArcGIS. 30


31 First, select the 2012 dataset: Children Click Topics, Dataset. Click the 2013 ACS 5-year estimates and AFF adds the dataset to the Your Selections box. Within the same Select Topics window, click on People (at the top), then Age Group. Click on Children and AFF adds the data to the Your Selections box. Close the Select Topics window using the Close X button. 31
, Name")

32 Now select the geography: all census tracts in New Jersey Click Geographies. There are four search method options: List (choose between most requested geographic types or all geographic types), Name (contains all geographic types), Address, and Map. Using the List search method, select Census Tract in the dropdown. Select New Jersey as the state, and then All Census Tracts within New Jersey. Click Add to Your Selections. Close the Geographies Window using the Close X button. 6
 table.")
33 All available data tables are shown in the Search Results section. In this example, we will view the Median Age by Sex (B01002) table. Check the box next to P13 Median Age by Sex and click Download. 33

34 Click OK. Click Download. Open with WinZip Save the zipped file to your computer and unzip it. 34

35 Open ACS_13_5YR_B01002-with_ann Delete Row 1. Change the column B header from Id2 to GEOID Change the format of the GEOID column from General to Text and File - Save As - Save as type as Excel Workbook. 35
 and close the Excel")
36 Save your work (we ll call this NJMedianAgeBySex) and close the Excel Workbook. 36
37 TIGER/Line Shapefiles and TIGER/Line Files TIGER/Line products are free spatial extracts from the Census Bureau s MAF/TIGER database, containing features such as roads, railroads, rivers, as well as legal and statistical boundaries. Since 2007, the files are in shapefile format. They are available for download here:
38 Downloading TIGER/Line Shapefiles There are four methods for downloading TIGER/Line Shapefiles: Website Interface Direct from the FTP site Connect via FTP client Direct from Data.gov This example will utilize the Website Interface method. For additional information about downloading and unzipping TIGER/Line Shapefiles, see the brochure Downloading TIGER/Line Shapefiles, available on our How To webpage:

39 Visit Click on the 2014 Tab. Click Download. Under Download by File Type, Click Web Interface. 14


40 Select Census Tracts in the dropdown menu and click submit. Under Census Tract, Select New Jersey, click Download. Open with WinZip 15


41 From the WinZip Window Drag & Drop To Your Local Folder (Or Wherever You d Like To Keep It) 41
42 Joining the AFF Table to the TIGER/Line Shapefiles Open ArcMap Add the census tract shapefile you previously downloaded using the Add Data icon or File Add Data Add Data. Both the data file and the TIGER/Line Shapefile contain fields that uniquely identify a geographic entity necessary for creating a join. 42


43 Right-click on the TIGER/Line Shapefile name. Select Joins and Relates. Select Join. 43

44 A new screen appears for you to select the field from the shapefile that will be used to join the data. You want the fully qualified geographic code. It is GEOID in the 2010 TIGER/Line Shapefiles. The TIGER/Line Shapefiles technical documentation has more information on the record layouts and definition of each field. Next, select the data file you saved as an Excel Workbook, using the browse (open folder icon). Finally, choose the field from the data table to base the join on. Since we edited the field name in the Excel Workbook to GEOID, ArcGIS automatically selects this field for the join. Click OK. 23


45 To see the results, right-click on the TIGER/Line Shapefile name and select Open Attribute Table. ArcMap builds a relationship between the shapefile and the data table. The table now has the attributes from both the shapefile and the data table. The data can be used to create a thematic map or for other analysis. Multiple files can be joined to the shapefile. 24
 Estimate")
46 New Jersey Median Age By Census Tract 2013 American Community Survey (ACS) Estimate 46
47 Removing the Join Right-click on the TIGER/Line Shapefile name and select Joins and Relates. Select Remove Joins. Select the join to be removed or select Remove All Joins. 47
48 Questions Regarding TIGER/Line Products: Visit: Call: (301) Geographic Products Branch Regarding American FactFinder Data Questions: Visit: nyro.pds@census.gov Call: (212) NYRO PDD Program ArcGIS TM is a Trademark of esri. TIGER/Line is a Registered Trademark of the U.S. Census Bureau. 48
Exercise on Using Census Data UCSB, July 2006
 Exercise on Using Census Data UCSB, July 2006 Purpose The purpose of this lab is to become familiar with Census Bureau data. Second, we will learn how to join tables which allows you to add data to the
Appendix B: Data Sources. In this exercise you will: Find data sources Download needed data
 In this exercise you will: Find data sources Download needed data California data Consult your instructor regarding California data sources. Page 2 National Park Service data Consult your instructor regarding
Using American Factfinder
 Using American Factfinder What is American Factfinder? American Factfinder is a search engine that provides access to the population, housing and economic data collected by the U.S. Census Bureau. It can
Instructions for Mapping 2011 Census Data
 Instructions for Mapping 2011 Census Data To map 2011 census data, you must download the census boundary files and the census data separately, then join the two files in ArcMap. In this guide, we will
Institutional Research with Public Data and Open Source Software
 2017 Institutional Research with Public Data and Open Source Software DUE1304591, 1644409, 1700496 Opinions expressed are those of the authors and not necessarily those of the National Science Foundation.
Working with Census 2000 Data from MassGIS
 Tufts University GIS Tutorial Working with Census 2000 Data from MassGIS Revised September 26, 2007 Overview In this tutorial, you will use pre-processed census data from Massachusetts to create maps of
2010 Census Data Release and Current Geographic Programs. Michaellyn Garcia Geographer Seattle Regional Census Center
 2010 Census Data Release and Current Geographic Programs Michaellyn Garcia Geographer Seattle Regional Census Center 2010 Center of Population Located approximately 2.7 miles northeast of Plato, Missouri
Task 1: Start ArcMap and add the county boundary data from your downloaded dataset to the data frame.
 Exercise 6 Coordinate Systems and Map Projections The following steps describe the general process that you will follow to complete the exercise. Specific steps will be provided later in the step-by-step
Exercise 3: GIS data on the World Wide Web
 Exercise 3: GIS data on the World Wide Web These web sites are a few examples of sites that are serving free GIS data. Many other sites exist. Search in Google or other search engine to find GIS data for
Spatial Organization of Data and Data Extraction from Maptitude
 Spatial Organization of Data and Data Extraction from Maptitude N. P. Taliceo Geospatial Information Sciences The University of Texas at Dallas UT Dallas GIS Workshop Richardson, TX March 30 31, 2018 1/
The 2020 Census Geographic Partnership Opportunities
 The 2020 Census Geographic Partnership Opportunities Web Adams Geographer, U.S. Census Bureau New York Regional Office 1 Geographic Partnership Opportunities The 2020 Census Local Update of Census Addresses
In this exercise we will learn how to use the analysis tools in ArcGIS with vector and raster data to further examine potential building sites.
 GIS Level 2 In the Introduction to GIS workshop we filtered data and visually examined it to determine where to potentially build a new mixed use facility. In order to get a low interest loan, the building
Data Structures & Database Queries in GIS
 Data Structures & Database Queries in GIS Objective In this lab we will show you how to use ArcGIS for analysis of digital elevation models (DEM s), in relationship to Rocky Mountain bighorn sheep (Ovis
Module 10 Summative Assessment
 Module 10 Summative Assessment Activity In this activity you will use the three dimensions of vulnerability that you learned about in this module exposure, sensitivity, and adaptive capacity to assess
Exercise 2: Working with Vector Data in ArcGIS 9.3
 Exercise 2: Working with Vector Data in ArcGIS 9.3 There are several tools in ArcGIS 9.3 used for GIS operations on vector data. In this exercise we will use: Analysis Tools in ArcToolbox Overlay Analysis
Geodatabases and ArcCatalog
 Geodatabases and ArcCatalog Francisco Olivera, Ph.D., P.E. Srikanth Koka Lauren Walker Aishwarya Vijaykumar Keri Clary Department of Civil Engineering April 21, 2014 Contents Geodatabases and ArcCatalog...
Urban Canopy Tool User Guide `bo`
 Urban Canopy Tool User Guide `bo` ADMS Urban Canopy Tool User Guide Version 2.0 June 2014 Cambridge Environmental Research Consultants Ltd. 3, King s Parade Cambridge CB2 1SJ UK Telephone: +44 (0)1223
GIS Lecture 5: Spatial Data
 GIS Lecture 5: Spatial Data GIS 1 Outline Vector Data Formats Raster Data Formats Map Projections Coordinate Systems US Census geographic files US Census data files GIS Data Sources GIS 2 Vector Data Formats
Learning ArcGIS: Introduction to ArcCatalog 10.1
 Learning ArcGIS: Introduction to ArcCatalog 10.1 Estimated Time: 1 Hour Information systems help us to manage what we know by making it easier to organize, access, manipulate, and apply knowledge to the
Acknowledgments xiii Preface xv. GIS Tutorial 1 Introducing GIS and health applications 1. What is GIS? 2
 Acknowledgments xiii Preface xv GIS Tutorial 1 Introducing GIS and health applications 1 What is GIS? 2 Spatial data 2 Digital map infrastructure 4 Unique capabilities of GIS 5 Installing ArcView and the
(THIS IS AN OPTIONAL BUT WORTHWHILE EXERCISE)
") PART 2: Analysis in ArcGIS (THIS IS AN OPTIONAL BUT WORTHWHILE EXERCISE) Step 1: Start ArcCatalog and open a geodatabase If you have a shortcut icon for ArcCatalog on your desktop, double-click it to start
PART 2: Analysis in ArcGIS (THIS IS AN OPTIONAL BUT WORTHWHILE EXERCISE) Step 1: Start ArcCatalog and open a geodatabase If you have a shortcut icon for ArcCatalog on your desktop, double-click it to start
Introduction to ArcGIS 10.2
 Introduction to ArcGIS 10.2 Francisco Olivera, Ph.D., P.E. Srikanth Koka Lauren Walker Aishwarya Vijaykumar Keri Clary Department of Civil Engineering April 21, 2014 Contents Brief Overview of ArcGIS 10.2...
Geodatabases and ArcCatalog
 Geodatabases and ArcCatalog Prepared by Francisco Olivera, Ph.D. and Srikanth Koka Department of Civil Engineering Texas A&M University February 2004 Contents Brief Overview of Geodatabases Goals of the
A Street Named for a King
 A Street Named for a King Dr. Jerry Mitchell University of South Carolina OVERVIEW This lesson adapts the work of Dr. Derek Alderman, a geographer who has used the Martin Luther King, Jr. street-naming
New Zealand Population Distribution
 New Zealand Population Distribution Requirements: Internet access Web browser (e.g. Internet Explorer, Mozilla Firefox, Google Chrome)** An Esri Global Account **Please insure that pop ups are not blocked
Data Visualization with GIS, Dr. Chris Badurek Visualization and Computing Teacher s Workshop. Part 1: Getting Started with Tectonic Hot Spot Mapping
 Data Visualization with GIS, Dr. Chris Badurek Visualization and Computing Teacher s Workshop Part 1: Getting Started with Tectonic Hot Spot Mapping Lesson Overview This lesson is designed to help students
GIS Software. Evolution of GIS Software
 GIS Software The geoprocessing engines of GIS Major functions Collect, store, mange, query, analyze and present Key terms Program collections of instructions to manipulate data Package integrated collection
Tutorial using the 2011 Statistics Canada boundary files and the Householder survey
 Tutorial using the 2011 Statistics Canada boundary files and the Householder survey In this tutorial, we ll try to determine the wards that contain the highest income groups. To do this, we will have to
Visualizing Census Data in GIS. Andrew Rowan, Ph.D. Director, NJ Office of GIS
 Visualizing Census Data in GIS Andrew Rowan, Ph.D. Director, NJ Office of GIS Outline VERY accelerated cartography primer Software choices Demos/how-to ArcGIS Desktop (formerly ArcView) ArcGIS Online Notes
Boundary and Annexation Survey (BAS)
") Boundary and Annexation Survey (BAS) New Mexico SDC Meeting Chris Wingate Geography Division U.S. Census Bureau 1 Agenda Boundary and Annexation Survey (BAS) BAS Overview American Community Survey (ACS)
Boundary and Annexation Survey (BAS) New Mexico SDC Meeting Chris Wingate Geography Division U.S. Census Bureau 1 Agenda Boundary and Annexation Survey (BAS) BAS Overview American Community Survey (ACS)
GIS 520 Data Cardinality. Joining Tabular Data to Spatial Data in ArcGIS
 GIS 520 Data Cardinality Joining Tabular Data to Spatial Data in ArcGIS Joining Tabular Data to Spatial Data in ArcGIS Outline Working with Zip Code Data Data Cardinality Issues Exploring Data Format Requirements
Child Opportunity Index Mapping
 Child Opportunity Index Mapping A partnership project of How to Use and Interpret the Child Opportunity Index Maps How to Use the Child Opportunity Index Maps Getting Started: How to Find and Open a Child
Evaluating Community Analyst for Use in School Demography Studies
 Portland State University PDXScholar Publications, Reports and Presentations Population Research Center 7-2013 Evaluating Community Analyst for Use in School Demography Studies Richard Lycan Portland State
Part 1: GIS Data from the Web: Downloading and Projecting Digital Elevation Models (DEM) and BTS Road data
 and BTS Road data") Field Geology I Hometown GIS, Part 1 October 03, 2005 Lab Exercise 2.1 Part 1: GIS Data from the Web: Downloading and Projecting Digital Elevation Models (DEM) and BTS Road data 1. Introduction a. GIS
Field Geology I Hometown GIS, Part 1 October 03, 2005 Lab Exercise 2.1 Part 1: GIS Data from the Web: Downloading and Projecting Digital Elevation Models (DEM) and BTS Road data 1. Introduction a. GIS
Downloading GPS Waypoints
 Downloading Data with DNR- GPS & Importing to ArcMap and Google Earth Written by Patrick Florance & Carolyn Talmadge, updated on 4/10/17 DOWNLOADING GPS WAYPOINTS... 1 VIEWING YOUR POINTS IN GOOGLE EARTH...
Compilation of GIS data for the Lower Brazos River basin
 Compilation of GIS data for the Lower Brazos River basin Francisco Olivera, Ph.D., P.E. Srikanth Koka Lauren Walker Aishwarya Vijaykumar Department of Civil Engineering December 5, 2011 Contents Brief
User Guide. Affirmatively Furthering Fair Housing Data and Mapping Tool. U.S. Department of Housing and Urban Development
 User Guide Affirmatively Furthering Fair Housing Data and Mapping Tool U.S. Department of Housing and Urban Development December, 2015 1 Table of Contents 1. Getting Started... 5 1.1 Software Version...
Lecture 2. Introduction to ESRI s ArcGIS Desktop and ArcMap
 Lecture 2 Introduction to ESRI s ArcGIS Desktop and ArcMap Outline ESRI What is ArcGIS? ArcGIS Desktop ArcMap Overview Views Layers Attribute Tables Help! Scale Tips and Tricks ESRI Environmental Systems
Task 1: Open ArcMap and activate the Spatial Analyst extension.
 Exercise 10 Spatial Analyst The following steps describe the general process that you will follow to complete the exercise. Specific steps will be provided later in the step-by-step instructions component
Instructions for using N-CAST ArcGIS Explorer
 Instructions for using N-CAST ArcGIS Explorer The N-CAST shapefiles can be used to map and analyze the data contained within the N-CAST database. N-CAST provides shapefiles for download in a file geodatabase
PALS: Neighborhood Identification, City of Frederick, Maryland. David Boston Razia Choudhry Chris Davis Under the supervision of Chao Liu
 PALS: Neighborhood Identification, City of Frederick, Maryland David Boston Razia Choudhry Chris Davis Under the supervision of Chao Liu University of Maryland School of Architecture, Planning & Preservation
The econ Planning Suite: CPD Maps and the Con Plan in IDIS for Consortia Grantees Session 1
 The econ Planning Suite: CPD Maps and the Con Plan in IDIS for Consortia Grantees Session 1 1 Training Objectives Use CPD Maps to analyze, assess, and compare levels of need in your community Use IDIS
ST-Links. SpatialKit. Version 3.0.x. For ArcMap. ArcMap Extension for Directly Connecting to Spatial Databases. ST-Links Corporation.
 ST-Links SpatialKit For ArcMap Version 3.0.x ArcMap Extension for Directly Connecting to Spatial Databases ST-Links Corporation www.st-links.com 2012 Contents Introduction... 3 Installation... 3 Database
The Church Demographic Specialists
 The Church Demographic Specialists Easy-to-Use Features Map-driven, Web-based Software An Integrated Suite of Information and Query Tools Providing An Insightful Window into the Communities You Serve Key
Modeling the Rural Urban Interface in the South Carolina Piedmont: T. Stephen Eddins Lawrence Gering Jeff Hazelton Molly Espey
 Modeling the Rural Urban Interface in the South Carolina Piedmont: T. Stephen Eddins (teddins@clemson.edu) Lawrence Gering Jeff Hazelton Molly Espey ABSTRACT Continuing growth of America s cities has created
Geographic Products and Data. Improvements in Spatial Accuracy and Accessing Data
 Geographic Products and Data Improvements in Spatial Accuracy and Accessing Data How it Began TIGER was internally developed to support the 1990 Decennial Census operations Used data sources such as USGS
2014 Planning Database (PDB)
") 2014 Planning Database (PDB) November 19, 2014 Barbara O Hare, Nancy Bates, Julia Coombs, Travis Pape, Chandra Erdman Office of Survey Analytics 1 Overview Tract and Block Group PDBs Useful for: Identifying
2014 Planning Database (PDB) November 19, 2014 Barbara O Hare, Nancy Bates, Julia Coombs, Travis Pape, Chandra Erdman Office of Survey Analytics 1 Overview Tract and Block Group PDBs Useful for: Identifying
ArcGIS 9 ArcGIS StreetMap Tutorial
 ArcGIS 9 ArcGIS StreetMap Tutorial Copyright 2001 2008 ESRI All Rights Reserved. Printed in the United States of America. The information contained in this document is the exclusive property of ESRI. This
Working with ArcGIS: Classification
 Working with ArcGIS: Classification 2 Abbreviations D-click R-click TOC Double Click Right Click Table of Content Introduction The benefit from the use of geographic information system (GIS) software is
How is Your Health? Using SAS Macros, ODS Graphics, and GIS Mapping to Monitor Neighborhood and Small-Area Health Outcomes
 Paper 3214-2015 How is Your Health? Using SAS Macros, ODS Graphics, and GIS Mapping to Monitor Neighborhood and Small-Area Health Outcomes Roshni Shah, Santa Clara County Public Health Department ABSTRACT
Displaying Latitude & Longitude Data (XY Data) in ArcGIS
 in ArcGIS") Displaying Latitude & Longitude Data (XY Data) in ArcGIS Created by Barbara Parmenter and updated on 2/15/2018 If you have a table of data that has longitude and latitude, or XY coordinates, you can view
Displaying Latitude & Longitude Data (XY Data) in ArcGIS Created by Barbara Parmenter and updated on 2/15/2018 If you have a table of data that has longitude and latitude, or XY coordinates, you can view
Name Date Class. Figure 1. The Google Earth Pro drop-down menu.
 GIS Student Walk-Through Worksheet Procedure 1. Import historical tornado and hurricane data into Google Earth Pro by following these steps: A. In the Google Earth Pro drop-down menu > click File > Import
Inclusion of Non-Street Addresses in Cancer Cluster Analysis
 Inclusion of Non-Street Addresses in Cancer Cluster Analysis Sue-Min Lai, Zhimin Shen, Darin Banks Kansas Cancer Registry University of Kansas Medical Center KCR (Kansas Cancer Registry) KCR: population-based
Using the Stock Hydrology Tools in ArcGIS
 Using the Stock Hydrology Tools in ArcGIS This lab exercise contains a homework assignment, detailed at the bottom, which is due Wednesday, October 6th. Several hydrology tools are part of the basic ArcGIS
INTRODUCTION TO ARCGIS Version 10.*
 Week 3 INTRODUCTION TO ARCGIS Version 10.* topics of the week Overview of ArcGIS Using ArcCatalog Overview of ArcGIS Desktop ArcGIS Overview Scalable desktop applications ArcView ArcEditor ArcInfo ArcGIS
Using a GIS to Calculate Area of Occupancy. Part 1: Creating a Shapefile Grid
 Using a GIS to Calculate Area of Occupancy Part 1: Creating a Shapefile Grid By Ryan Elliott California Natural Diversity Database, A NatureServe network program December 2008 This document describes the
ISU GIS CENTER S ARCSDE USER'S GUIDE AND DATA CATALOG
 ISU GIS CENTER S ARCSDE USER'S GUIDE AND DATA CATALOG 2 TABLE OF CONTENTS 1) INTRODUCTION TO ARCSDE............. 3 2) CONNECTING TO ARCSDE.............. 5 3) ARCSDE LAYERS...................... 9 4) LAYER
Studying Topography, Orographic Rainfall, and Ecosystems (STORE)
") Studying Topography, Orographic Rainfall, and Ecosystems (STORE) Introduction Basic Lesson 3: Using Microsoft Excel to Analyze Weather Data: Topography and Temperature This lesson uses NCDC data to compare
Studying Topography, Orographic Rainfall, and Ecosystems (STORE) Introduction Basic Lesson 3: Using Microsoft Excel to Analyze Weather Data: Topography and Temperature This lesson uses NCDC data to compare
Instructions for using N-CAST
 Instructions for using N-CAST The N-CAST shapefiles can be used to map and analyze the data contained within the N-CAST database. N-CAST provides shapefiles for download in a file geodatabase format (.gdb)
Preparing Spatial Data
 13 CHAPTER 2 Preparing Spatial Data Assessing Your Spatial Data Needs 13 Assessing Your Attribute Data 13 Determining Your Spatial Data Requirements 14 Locating a Source of Spatial Data 14 Performing Common
EMS Hot Spot Analysis:
 EMS Hot Spot Analysis: 2014-2016 James Moy, Nika Ofori-Atta, Holly Simmons, Samantha Sperber Under the supervision of Professor Chao Liu URSP 688L: Planning Technologies The University of Maryland College
Demographic Data. How to get it and how to use it (with caution) By Amber Keller
 By Amber Keller") Demographic Data How to get it and how to use it (with caution) By Amber Keller 101 Where does it come from? o The American Community Survey o Socio-economic characteristics of a population o Administered
Demographic Data How to get it and how to use it (with caution) By Amber Keller 101 Where does it come from? o The American Community Survey o Socio-economic characteristics of a population o Administered
GEOG 3830 Geographic Information Systems
 1 GEOG 3830 Geographic Information Systems Lab 08: Spatial Relationships The objective of this lab exercise is to introduce students to a technique commonly used to evaluate the most basic types of spatial
IMPERIAL COUNTY PLANNING AND DEVELOPMENT
 IMPERIAL COUNTY PLANNING AND DEVELOPMENT GEODATABASE USER MANUAL FOR COUNTY BUSINESS DEVELOPMENT GIS June 2010 Prepared for: Prepared by: County of Imperial Planning and Development 801 Main Street El
Land Cover Data Processing Land cover data source Description and documentation Download Use Use
 Land Cover Data Processing This document provides a step by step procedure on how to build the land cover data required by EnSim. The steps provided here my be long and there may be short cuts (like using
Presenting Tree Inventory. Tomislav Sapic GIS Technologist Faculty of Natural Resources Management Lakehead University
 Presenting Tree Inventory Tomislav Sapic GIS Technologist Faculty of Natural Resources Management Lakehead University Suggested Options 1. Print out a Google Maps satellite image of the inventoried block
Space Informatics Lab - University of Cincinnati
 Space Informatics Lab - University of Cincinnati USER GUIDE SocScape V 1.0 September 2014 1. Introduction SocScape (Social Landscape) is a GeoWeb-based tool for exploration of patterns in high resolution
D.T.M: TRANSFER TEXTBOOKS FROM ONE SCHOOL TO ANOTHER
 Destiny Textbook Manager allows users with full access to transfer Textbooks from one school site to another and receive transfers from the warehouse In this tutorial you will learn how to: Requirements:
i-tree Eco Random Plots Workbook: Pre - Stratification Tips red green
 i-tree Eco Random Plots Workbook: Pre - Stratification These instructions help users of all skill levels create random, pre-stratified UFORE sample points and their associated UFORE-required data within
Are You Maximizing The Value Of All Your Data?
 Are You Maximizing The Value Of All Your Data? Using The SAS Bridge for ESRI With ArcGIS Business Analyst In A Retail Market Analysis SAS and ESRI: Bringing GIS Mapping and SAS Data Together Presented
Guide to the Data-Driven Planning Toolkit in CPD Maps
 The econ Planning Suite: Guide to the Data-Driven Planning Toolkit in CPD Maps Version: April 2014 TABLE OF CONTENTS Introduction... 1 The Data-Driven Planning Toolkit... 3 Overview of the Basic Model...
WlLPEN L. GORR KRISTEN S. KURLAND. Universitats- und Landesbibliothek. Bibliothek Architektur und Stadtebau ESRI
 hj WlLPEN L. GORR KRISTEN S. KURLAND Universitats- und Landesbibliothek Darmstadt Bibliothek Architektur und Stadtebau ESRI Contents Acknowledgments Preface xvii XV GIS Tutorial 1 Introduction Launch ArcMap
Exercise 6: Using Burn Severity Data to Model Erosion Risk
 Exercise 6: Using Burn Severity Data to Model Erosion Risk Document Updated: November 2009 Software Versions: ERDAS Imagine 9.3 and ArcGIS 9.3, Microsoft Office 2007 Introduction A common use of burn severity
GIS Lecture 4: Data. GIS Tutorial, Third Edition GIS 1
 GIS Lecture 4: Data GIS 1 Outline Data Types, Tables, and Formats Geodatabase Tabular Joins Spatial Joins Field Calculator ArcCatalog Functions GIS 2 Data Types, Tables, Formats GIS 3 Directly Loadable
Geographic Systems and Analysis
 Geographic Systems and Analysis New York University Robert F. Wagner Graduate School of Public Service Instructor Stephanie Rosoff Contact: stephanie.rosoff@nyu.edu Office hours: Mondays by appointment
The 2010 Census Successful Because of GIS
 The 2010 Census Successful Because of GIS Timothy F. Trainor Chief, Geography Division, U.S. Census Bureau Vice President, International Cartographic Association Establishing the Framework of the Operation
GEOG 487 Lesson 7: Step-by-Step Activity
 GEOG 487 Lesson 7: Step-by-Step Activity Part I: Review the Relevant Data Layers and Organize the Map Document In Part I, we will review the data and organize the map document for analysis. 1. Unzip the
ADDING RCGEO BASEMAPS TO ARCMAP. Versions 10.0, 10.1 and 10.1 sp1
 ADDING RCGEO BASEMAPS TO ARCMAP Versions 10.0, 10.1 and 10.1 sp1 May, 2014 Contents Adding the Ortho and Carto Base Maps to ArcMap... 2 Richland County Base Maps... 2 Adding the Base Map Connections ArcMap
Watershed Modeling Orange County Hydrology Using GIS Data
 v. 10.0 WMS 10.0 Tutorial Watershed Modeling Orange County Hydrology Using GIS Data Learn how to delineate sub-basins and compute soil losses for Orange County (California) hydrologic modeling Objectives
MIS 0855 Data Science (Section 005) Fall 2016 In-Class Exercise (Week 4) Visualizing with Maps
 Fall 2016 In-Class Exercise (Week 4) Visualizing with Maps") MIS 0855 Data Science (Section 005) Fall 2016 In-Class Exercise (Week 4) Visualizing with Maps Objective: Learn how to use Tableau s powerful mapping tools Learning Outcomes: Learn at what levels (e.g.
MIS 0855 Data Science (Section 005) Fall 2016 In-Class Exercise (Week 4) Visualizing with Maps Objective: Learn how to use Tableau s powerful mapping tools Learning Outcomes: Learn at what levels (e.g.
GIS CONCEPTS ARCGIS METHODS AND. 3 rd Edition, July David M. Theobald, Ph.D. Warner College of Natural Resources Colorado State University
 GIS CONCEPTS AND ARCGIS METHODS 3 rd Edition, July 2007 David M. Theobald, Ph.D. Warner College of Natural Resources Colorado State University Copyright Copyright 2007 by David M. Theobald. All rights
GIS Workshop UCLS_Fall Forum 2014 Sowmya Selvarajan, PhD TABLE OF CONTENTS
 TABLE OF CONTENTS TITLE PAGE NO. 1. ArcGIS Basics I 2 a. Open and Save a Map Document 2 b. Work with Map Layers 2 c. Navigate in a Map Document 4 d. Measure Distances 4 2. ArcGIS Basics II 5 a. Work with
Map My Property User Guide
 Map My Property User Guide Map My Property Table of Contents About Map My Property... 2 Accessing Map My Property... 2 Links... 3 Navigating the Map... 3 Navigating to a Specific Location... 3 Zooming
Exercise 2: Working with Vector Data in ArcGIS 9.3
 Exercise 2: Working with Vector Data in ArcGIS 9.3 There are several tools in ArcGIS 9.3 used for GIS operations on vector data. In this exercise we will use: Analysis Tools in ArcToolbox Overlay Analysis
2G1/3G4 GIS TUTORIAL >>>>>>>>>>>>>>>>>>>>>>>>>>>>>>>>>>>>>>>>>>>>>>>>>>>>>>>>>>>>>>>>>>>>>>>>>>>>>>>>
 > University of Michigan >Taubman College of Architecture > ARCH 552, Perimeter @ Work Out [T]here, Fall 2009 >September 24, 2009 2G1/3G4 GIS TUTORIAL >>>>>>>>>>>>>>>>>>>>>>>>>>>>>>>>>>>>>>>>>>>>>>>>>>>>>>>>>>>>>>>>>>>>>>>>>>>>>>>>
Classification Exercise UCSB July 2006
 Classification Exercise UCSB July 2006 Purpose This exercise will examine how spatial data is catergorized and the advantages and disadvantages of different classification methods. Terms to know Population,
Visualization of Origin- Destination Commuter Flow Using CTPP Data and ArcGIS
 Visualization of Origin- Destination Commuter Flow Using CTPP Data and ArcGIS Research & Analysis Department Southern California Association of Governments 2015 ESRI User Conference l July 23, 2015 l San
Delineation of Watersheds
 Delineation of Watersheds Adirondack Park, New York by Introduction Problem Watershed boundaries are increasingly being used in land and water management, separating the direction of water flow such that
GED 554 IT & GIS. Lecture 6 Exercise 5. May 10, 2013
 GED 554 IT & GIS Lecture 6 Exercise 5 May 10, 2013 Free GIS data sources ******************* Mapping numerical data & Symbolization ******************* Exercise: Making maps for presentation GIS DATA SOFTWARE
GPS and Mean Sea Level in ESRI ArcPad
 Summary In order to record elevation values as accurately as possible with, it is necessary to understand how ArcPad records elevation. Rather than storing elevation values relative to Mean Sea Level (MSL),
How to Create Stream Networks using DEM and TauDEM
 How to Create Stream Networks using DEM and TauDEM Take note: These procedures do not describe all steps. Knowledge of ArcGIS, DEMs, and TauDEM is required. TauDEM software ( http://hydrology.neng.usu.edu/taudem/
Census Mapping with ArcGIS
 Census Mapping with ArcGIS Jin Lee, GIS manager at the Lewis Mumford Center and Center for Social and Demographic Analysis Email: jwlee@albany.edu Phone: 442-5402 Quick summary of Day1 http://csda.albany.edu/events-news/gisworkshop_outline_fall_3-1.pdf
Automatic Watershed Delineation using ArcSWAT/Arc GIS
 Automatic Watershed Delineation using ArcSWAT/Arc GIS By: - Endager G. and Yalelet.F 1. Watershed Delineation This tool allows the user to delineate sub watersheds based on an automatic procedure using
Final Project: An Income and Education Study of Washington D.C.
 Final Project: An Income and Education Study of Washington D.C. Barbara J. McKay Archibald Geography 586 Dr. Justine Blanford 12 December, 2009 As the seat of the United States Federal Government, Washington
Lecture 9: Geocoding & Network Analysis
 Massachusetts Institute of Technology - Department of Urban Studies and Planning 11.520: A Workshop on Geographic Information Systems 11.188: Urban Planning and Social Science Laboratory Lecture 9: Geocoding
v WMS Tutorials GIS Module Importing, displaying, and converting shapefiles Required Components Time minutes
 v. 11.0 WMS 11.0 Tutorial Importing, displaying, and converting shapefiles Objectives This tutorial demonstrates how to import GIS data, visualize it, and convert it into WMS coverage data that could be
Calculating Conflict Density and Change over Time in Uganda using Vector Techniques
 Calculating Conflict Density and Change over Time in Uganda using Vector Techniques Created by Patrick Florance and Kyle Monahan; revised by Patrick Florance April 2, 2018. OVERVIEW... 1 SET UP... 1 SET
Geographical Information Systems
 Geographical Information Systems Geographical Information Systems (GIS) is a relatively new technology that is now prominent in the ecological sciences. This tool allows users to map geographic features
In order to save time, the following data files have already been preloaded to the computer (most likely under c:\odmc2012\data\)
") ODMC2012 QGIS Ex1 Schools and Public Transport In this exercise, users will learn how to a) map the location of secondary schools in and around the Southampton area; b) overlay the school location map
ODMC2012 QGIS Ex1 Schools and Public Transport In this exercise, users will learn how to a) map the location of secondary schools in and around the Southampton area; b) overlay the school location map
Outline. Chapter 1. A history of products. What is ArcGIS? What is GIS? Some GIS applications Introducing the ArcGIS products How does GIS work?
 Outline Chapter 1 Introducing ArcGIS What is GIS? Some GIS applications Introducing the ArcGIS products How does GIS work? Basic data formats The ArcCatalog interface 1-1 1-2 A history of products Arc/Info