SUBJECT: SUMMARY OF FINDINGS. October 29, Mr. Carter Redish Carter Group Architects, Inc S. El Camino Real, Suite F San Clemente, CA 92672
|
|
|
- Belinda Cain
- 5 years ago
- Views:
Transcription
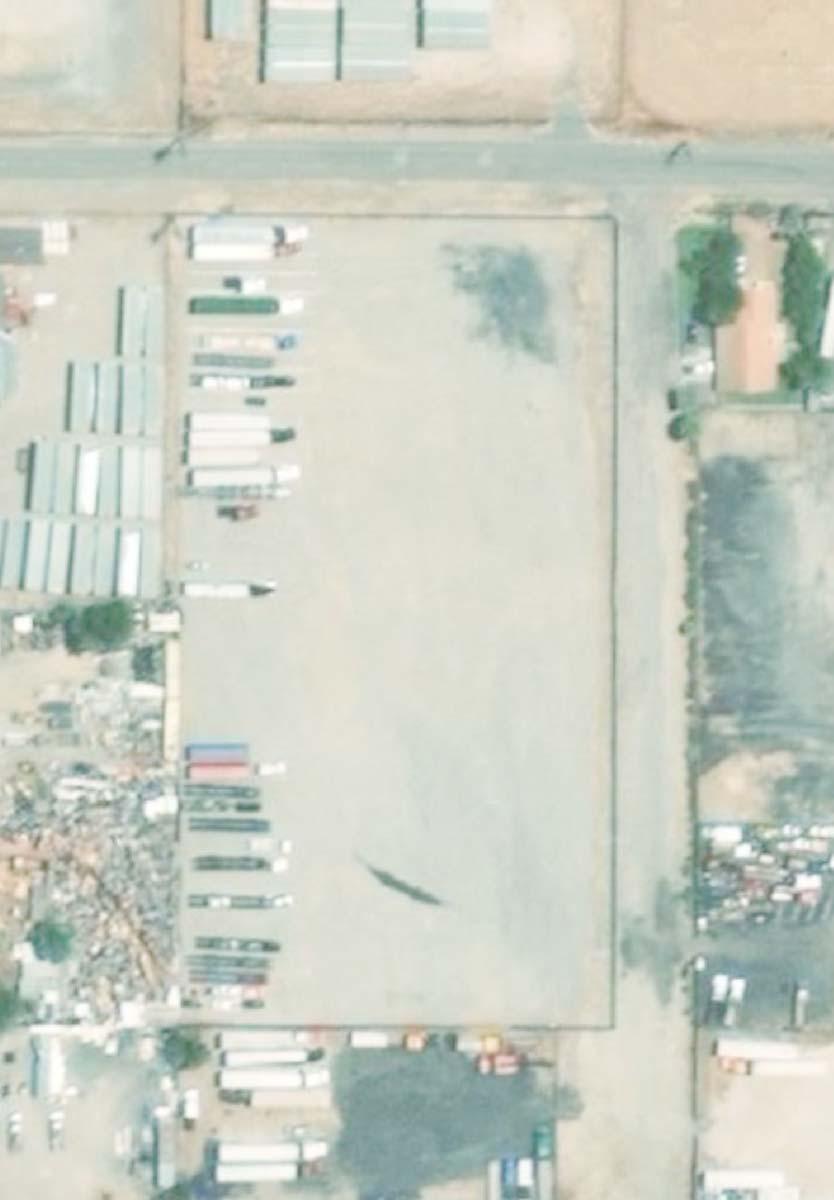
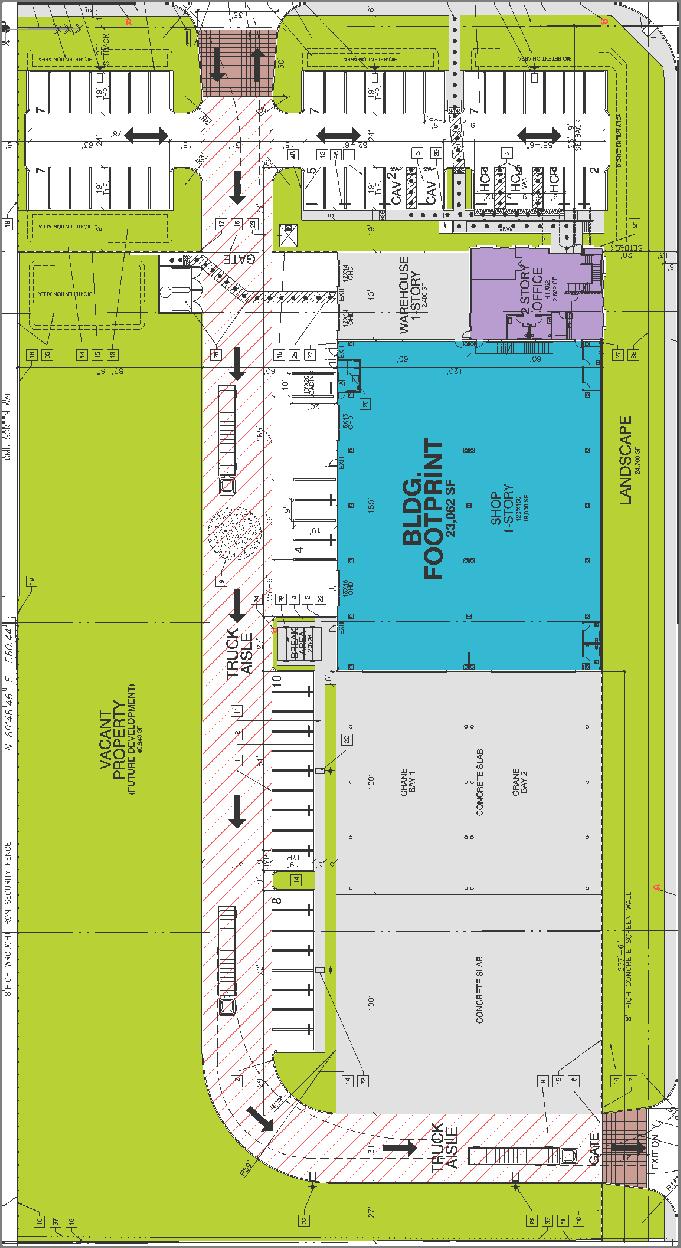
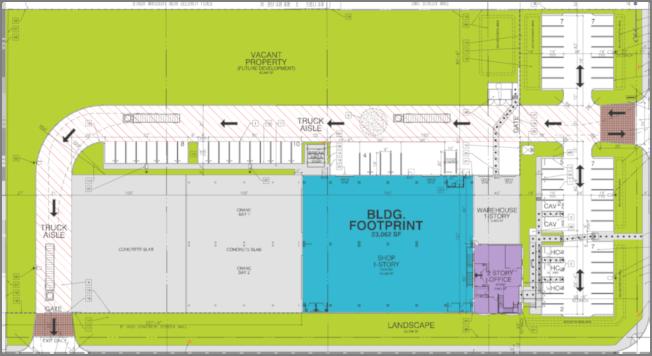
1 October 29, 2018 Mr. Carter Redish Carter Group Architects, Inc S. El Camino Real, Suite F San Clemente, CA SUBJECT: CANYON STEEL FOCUSED TRAFFIC IMPACT ANALYSIS Dear Mr. Carter Redish: Urban Crossroads, Inc. is pleased to submit this letter report to document the Focused Traffic Impact Analysis performed for the proposed Canyon Steel development (referred to as Project ). The proposed Project is located at the northwest corner of and California Avenue, in the City of Perris as shown on Exhibit 1. It is our understanding that the Project is to consist a 28,124 square feet (sf) manufacturing building. The study area intersections evaluated in this Focused Traffic Impact Analysis are shown on Exhibit 2. SUMMARY OF FINDINGS To evaluate the potential impacts associated with the Project, analysis was conducted for the following scenarios: Existing (2018) Existing plus Project (E+P) Existing plus Ambient Growth (EA) (2019) Existing plus Ambient Growth plus Project (EAP) (2019) Opening Year Cumulative (2019) Without Project Opening Year Cumulative (2019) With Project No study area intersections are shown to operate at unacceptable levels of service (LOS) under Existing (2018), EA (2019), and Opening Year Cumulative (2019) traffic conditions. With the addition of Project traffic, there are no intersections anticipated to operate at unacceptable levels of service (LOS) under E+P, EAP (2019) and Opening Year Cumulative (2019) traffic conditions. A summary of LOS results for Existing, E+P, EA, EAP, and Opening Year Cumulative traffic conditions are presented in Exhibit 3. Exhibit 4 illustrates the on-site and site adjacent recommended roadway lane improvements. Construction of on-site and site adjacent improvements are recommended to occur in conjunction with adjacent Project development activity or as needed for Project access purposes Focused TIA
2 Mr. Carter Redish Carter Group Architects, Inc. October 29, 2018 Page 2 of 5 METHODOLOGY INTERSECTION CAPACITY ANALYSIS Intersection operations analysis based on the methodology described in the HCM 6 th Edition. Intersection LOS operations are based on an intersection s average control delay. All study area intersections have been analyzed using the Synchro (version 10) software. TRAFFIC SIGNAL WARRANT ANALYSIS The term "signal warrants" refers to the list of established criteria used by Caltrans and other public agencies to quantitatively justify or ascertain the potential need for installation of a traffic signal at an otherwise unsignalized intersection. This TIA uses the signal warrant criteria presented in the latest edition of the Caltrans California Manual on Uniform Traffic Control Devices (CA MUTCD) for all unsignalized study area intersections. EXISTING (2018) CONDITIONS Exhibit 2 illustrates the study area intersections located near the proposed Project and Exhibit 5 identifies the number of through traffic lanes for existing roadways and intersection traffic controls. Traffic counts were conducted on May and October For & Harley Knox Boulevard, counts from May 2018 were utilized due to recent lane closures along. The traffic counts were conducted from 7 AM to 9 AM in the morning and from 4 PM to 6 PM in the afternoon. Existing (2018) peak hour intersection volumes (in PCE) are shown on Exhibit 6. Existing traffic counts are provided in Attachment A. As shown on Table 1, no study area intersection are operating at an unacceptable LOS (LOS E or worse) for Existing (2018) traffic conditions. Intersection operations worksheets for Existing (2018) traffic conditions are provided in Attachment B. Traffic signal warrants for Existing traffic conditions are based on existing peak hour intersection turning volumes. For Existing traffic conditions, no traffic signals are currently warranted at any unsignalized study area intersections (see Attachment C ). TRIP GENERATION The Project trip generation was calculated based on Institute of Transportation Engineers (ITE) Trip generation Manual, 10 th Edition (2017). The vehicle mix was determined based on Fontana Truck Trip generation Study (August 2003). The Project trip generation rates are shown on Table 2 and the Project trip generation summary is shown on Table 3. As shown on Table 3, the Project is anticipated to generate Focused TIA
3 Mr. Carter Redish Carter Group Architects, Inc. October 29, 2018 Page 3 of 5 a net total of 111 trip-ends per day with 18 AM peak hour trips and 20 PM peak hour trips in actual vehicles. A passenger car equivalent (PCE) factor was applied to all the trucks, which results in a net total of approximately 172 PCE trip-ends per day with 25 PCE AM peak hour trips and 29 PCE PM peak hour trips. TRIP DISTRIBUTION Trip distribution is the process of identifying the probable destinations, directions or traffic routes that will be utilized by Project traffic. The potential interaction between the planned land uses and surrounding regional access routes are considered, to identify the route where the Project traffic would distribute. The Project trip distribution and assignment process represents the directional orientation of traffic to and from the Project site. The trip distribution pattern of passenger cars is heavily influenced by the geographical location of the site, the location of surrounding land uses, and the proximity to the regional freeway system. The trip distribution pattern for truck traffic is also influenced by the local truck routes approved by the City of Perris. Given these differences, separate trip distributions were generated for both passenger cars and truck trips. The Project passenger car trip distribution patterns is graphically depicted on Exhibit 7 and the Project truck trip distribution patterns is graphically depicted on Exhibit 8. Project only (in PCE) peak hour intersection volumes are shown on Exhibit 9. CUMULATIVE DEVELOPMENT PROJECTS A cumulative project list was developed for the purposes of this analysis based on other traffic studies recently performed in the study area. Exhibit 10 illustrates the cumulative development location map. A summary of cumulative development projects and their proposed land uses are shown on Table 4. Where applicable, the traffic generated by individual cumulative projects has been manually added to the Opening Year Cumulative (2019) traffic conditions, forecasts to ensure that traffic generated by the listed cumulative development projects in Table 4 are reflected as part of the background traffic. E+P CONDITIONS As shown on Table 5, there are no intersections that are anticipated to operate at an unacceptable LOS (LOS E or worse) for E+P traffic conditions. E+P peak hour intersection volumes are shown on Exhibit 11. Intersection operations worksheets for E+P traffic conditions are provided in Attachment D Focused TIA
4 Mr. Carter Redish Carter Group Architects, Inc. October 29, 2018 Page 4 of 5 Traffic signal warrants have been performed on unsignalized intersections for E+P traffic conditions. For E+P traffic conditions, no traffic signals appear to be warranted at any unsignalized study area intersections (see Attachment E ). EA AND EAP (2019) CONDITIONS As shown on Table 6, there are no intersections that are anticipated to operate at an unacceptable LOS (LOS E or worse) for EA and EAP (2019) traffic conditions. EA and EAP (2019) peak hour intersection volumes are shown on Exhibit 12 and 13, respectively. Intersection operations worksheets for EA and EAP (2019) traffic conditions are provided in Attachment F and G, respectively. Traffic signal warrants have been performed on unsignalized intersections for EA and EAP (2019) traffic conditions. For EA and EAP (2019) traffic conditions, no traffic signals appear to be warranted at any unsignalized study area intersections (see Attachments H and I, respectively). OPENING YEAR CUMULATIVE (2019) CONDITIONS As shown on Table 7, there are no intersections that are anticipated to operate at an unacceptable LOS (LOS E or worse) for Opening Year Cumulative (2019) Without and With Project traffic conditions. Opening Year Cumulative (2019) Without and With Project peak hour intersection volumes are shown on Exhibit 14 and 15, respectively. Intersection operations worksheets for Opening Year Cumulative (2019) Without and With Project traffic conditions are provided in Attachment J and K, respectively. Traffic signal warrants have been performed on unsignalized intersections for Opening Year Cumulative (2019) Without and With Project traffic conditions. For Opening Year Cumulative (2019) Without and With Project conditions, no traffic signals appear to be warranted at any unsignalized study area intersections (see Attachments L and M, respectively) Focused TIA
5 Mr. Carter Redish Carter Group Architects, Inc. October 29, 2018 Page 5 of 5 If you have any questions, please contact me directly at (949) Respectfully submitted, URBAN CROSSROADS, INC. Pranesh Tarikere, PE Senior Engineer Focused TIA
6 Table 1 Intersection Analysis for Existing (2018) Conditions Intersection Approach Lanes 1 Level of Traffic Northbound Southbound Eastbound Westbound Delay (secs.) 2 Service Acceptable # Intersection Control 3 L T R L T R L T R L T R AM PM AM PM LOS 1 Dwy. 1 / California St. Future Intersection D 2 Patterson Av. / Harley Knox Bl. TS B B D 3 Patterson Av. / Dwy. 2 Future Intersection D 4 Patterson Av. / California St. CSS A A D When a right turn is designated, the lane can either be striped or unstriped. To function as a right turn lane there must be sufficient width for right turning vehicles to travel outside the through lanes. CSS = Cross street Stop; TS = Traffic Signal L = Left; T = Through; R = Right Per the Highway Capacity Manual (6th Edition), overall average intersection delay and level of service are shown for intersections with a traffic signal or all way stop control. For intersections with cross street stop control, the delay and level of service for the worst individual movement (or movements sharing a single lane) are shown.
7 Table 2 Project Trip Generation Rates 1 ITE LU AM Peak Hour PM Peak Hour Land Use Units 2 Code In Out Total In Out Total Daily Project Trip Generation Rates (PCE) Manufacturing 3 TSF Passenger Cars Axle Trucks (PCE = 1.5) Axle Trucks (PCE = 2.0) Axle+ Trucks (PCE = 3.0) Project Trip Generation Rates (Actual Vehicles) Manufacturing 3 TSF Trip Generation Source: Institute of Transportation Engineers (ITE), Trip Generation Manual, Tenth Edition (2017). 2 TSF = thousand square feet Passenger Cars (61.2%) 2 Axle Trucks (6.1%) 3 Axle Trucks (12.7%) 4 Axle+ Trucks (19.9%) 3 Manufacturing Vehicle and Truck Mix Source: Fontana Truck trip Generation Study (August 2003)
8 Table 3 Project Trip Generation Summary AM Peak Hour PM Peak Hour Land Use Quantity Units 1 In Out Total In Out Total Daily Project Trip Generation Summary (PCE) Manufacturing TSF Passenger Cars: Truck Trips: 2 axle: axle: axle: Net Truck Trips (PCE) TOTAL NET TRIPS (PCE) Project Trip Generation Summary (Actual) Manufacturing TSF Passenger Cars: Truck Trips: 2 axle: axle: axle: Net Truck Trips (Actual) TOTAL NET TRIPS (ACTUAL) TSF = thousand square feet
9 Table 4 Page 1 of 2 Cumulative Development Land Use Summary No. Project Name / Case Number Jurisdiction Land Use 1 Quantity Units 2 Location P1 Bargemann / DPR Perris Warehousing TSF NEC OF WEBSTER & NANCE P2 Duke 2 / DPR Perris High Cube Warehouse TSF NEC OF INDIAN & MARKHAM P3 First Perry / DPR Perris High Cube Warehouse TSF SWC OF REDLANDS AVE. & PERRY ST. P4 Gateway / DPR Perris High Cube Warehouse TSF SOUTH OF HARLEY KNOX BLVD. EAST OF HWY. 215 P5 Rider 2 and 4 Perris High Cube Warehouse 1, TSF NWC OF REDLANDS AVE. & RIDER ST. P6 OLC 1 / DPR Perris High Cube Warehouse 1, TSF WEST OF WEBSTER AVE. NORTH OF RAMONA EXWY. P7 OLC2 / DPR Perris High Cube Warehouse 1, TSF WEST OF WEBSTER AVE. NORTH OF MARKHAM ST. P8 Markham East / DPR Perris High Cube Warehouse TSF SWC OF REDLANDS AVE. & MARKHAM ST. P9 Markham Industrial / DPR Perris Warehousing TSF NEC OF INDIAN AVE. & MARKHAM ST. P10 Rados / DPR Perris High Cube Warehouse 1, TSF NWC OF INDIAN AVE. & RIDER ST. P11 Rider 1 / DPR Perris High Cube Warehouse TSF SWC OF REDLANDS AVE. & RIDER ST. P12 Indian/Ramona Warehouse Perris High Cube Warehouse TSF NORTH OF RAMONA EXWY. WEST OF INDIAN AVE. P13 Rider 3 / DPR Perris High Cube Warehouse TSF NORTH OF RIDER ST. WEST OF REDLANDS P14 Westcoast Textile / DPR Perris Warehousing TSF SWC OF INDIAN ST. & NANCE ST. P15 Duke at Patterson / DPR Perris High Cube Warehouse TSF SEC OF PATTERSON AVE. & MARKHAM ST. P16 Harley Knox Commerce Park / DPR Perris High Cube Warehouse TSF NWC OF HARLEY KNOX BLVD. & REDLANDS AVE. P17 Perris Marketplace / DPR Perris Commercial Retail TSF WEST OF PERRIS BLVD. AT AVOCADO AVE. P18 Stratford Ranch Residential / TTM Perris SFDR DU WEST OF EVANS RD. AT MARKHAM ST. P19 Pulte Residential / TTM Perris SFDR DU WEST OF EVANS RD. AT CITRUS AVE. P20 Perris Circle 3 Perris Warehousing TSF NWC OF REDLANDS AVE. AND NANCE AVE. P21 IPT Perris DC II Perris High Cube Warehouse TSF EAST OF WEBSTER AVE. SOUTH OF NANCE ST. MV1 Kearney Moreno Valley High Cube Warehouse 1, TSF EAST OF PERRIS BLVD. AT SAN MICHEL RD. MV2 IDS Moreno Valley High Cube Warehouse TSF SEC OF HEACOCK ST. & SAN MICHELE RD. MV3 First Industrial Moreno Valley High Cube Warehouse 1, TSF SWC OF INDIAN AVE. & NANDINA AVE. MV4 Prologis 1 Moreno Valley High Cube Warehouse 1, TSF NEC OF INDIAN AVE. & MARIPOSA AVE. MV5 Moreno Valley Industrial Park Moreno Valley High Cube Warehouse TSF NEC OF HEACOCK ST. & IRIS AVE. MV6 Moreno Valley Walmart Moreno Valley Retail TSF SWC OF PERRIS BLVD. & GENTIAN AVE. MV7 Moreno Valley Utility Substation Moreno Valley High Cube Warehouse PUBLIC TSF NWC OF EDWIN RD. & KITCHING ST. MV8 Phelan Development Moreno Valley High Cube Warehouse TSF SEC OF INDIAN ST. & NANDINA AVE. MV9 Nandina Industrial Center Moreno Valley High Cube Warehouse TSF SOUTH OF NANDINA AVE. WEST OF PERRIS BLVD.
10 1 2 Table 4 Page 2 of 2 Cumulative Development Land Use Summary No. Project Name / Case Number Jurisdiction Land Use 1 Quantity Units 2 Location MV10 Indian Street Commerce Center Moreno Valley High Cube Warehouse TSF SWC OF INDIAN ST. & GROVEVIEW RD. MV11 Tract Moreno Valley SFDR DU NORTH OF GENTIAN AVE. EAST OF INDIAN ST. MV12 Tract Moreno Valley SFDR DU SEC OF INDIAN ST. & GENTIAN AVE. MV13 PEN Moreno Valley SFDR 2.00 DU SEC OF INDIAN ST. & KRAMERIA AVE. MV14 Tract Moreno Valley SFDR 8.00 DU SEC OF INDIAN ST. & KRAMERIA AVE. MV15 Tract Moreno Valley SFDR DU NEC OF INDIAN ST. & MARIPOSA AVE. MV16 Tract Moreno Valley SFDR DU NWC OF PERRIS BLVD. & MARIPOSA AVE. MJPA VIP 215 March JPA High Cube Warehouse 2, TSF NORTH OF NANDINA AVE. EAST OF HWY. 215 RC1 Majestic Freeway Business Center SP Riverside County General Light Industrial 6, TSF NORTH OF RAMONA EXPY. SOUTH OF NANDINA AVE. WEST OF HWY. 215 RC2 Oleander Business Park Riverside County High Cube Warehouse TSF NWC OF DECKER RD. & OLEANDER AVE. SFDR = Single Family Detached Residential DU = Dwelling Units; TSF = Thousand Square Feet
11 Table 5 Intersection Analysis for E+P Conditions Existing (2018) E+P Delay 1 Level of Delay 1 Level of Traffic (secs.) Service (secs.) Service Significant # Intersection Control 2 AM PM AM PM AM PM AM PM Impact? 3 1 Dwy. 1 / California St. Future Intersection A A No 2 Patterson Av. / Harley Knox Bl. TS B B B B No 3 Patterson Av. / Dwy. 2 Future Intersection A A No 4 Patterson Av. / California St. CSS A A A A No Per the Highway Capacity Manual (6th Edition), overall average intersection delay and level of service are shown for intersections with a traffic signal or all way stop control. For intersections with cross street stop control, the delay and level of service for the worst individual movement (or movements sharing a single lane) are shown. CSS = Cross street Stop; TS = Traffic Signal A project related impact is considered direct and significant when a study intersection operates at an acceptable LOS for existing conditions (without the Project) and the addition of 50 or more AM or PM peak hour project trips causes the intersection to operate at an unacceptable LOS for Existing Plus Project (E+P) traffic conditions.
12 Table 6 Intersection Analysis for EA and EAP Conditions EA 2019 EAP 2019 Delay 1 Level of Delay 1 Level of Traffic (secs.) Service (secs.) Service Significant # Intersection Control 2 AM PM AM PM AM PM AM PM Impact? 3 1 Dwy. 1 / California St. Future Intersection A A No 2 Patterson Av. / Harley Knox Bl. TS B B B B No 3 Patterson Av. / Dwy. 2 Future Intersection A A No 4 Patterson Av. / California St. CSS A A A A No 1 Per the Highway Capacity Manual (6th Edition), overall average intersection delay and level of service are shown for intersections with a traffic signal or all way stop control. For intersections with cross street stop control, the delay and level of service for the worst individual movement (or movements sharing a single lane) are shown. 2 3 CSS = Cross street Stop; TS = Traffic Signal A project related impact is considered direct and significant when a study intersection operates at an acceptable LOS for the Without Project traffic conditions and the addition of 50 or more AM or PM peak hour project trips causes the intersection to operate at an unacceptable LOS for the With Project traffic conditions.
13 Table 7 Intersection Analysis for Opening Year Cumulative (2019) Conditions 2019 Without Project 2019 With Project Delay 1 Level of Delay 1 Level of Traffic (secs.) Service (secs.) Service Significant # Intersection Control 2 AM PM AM PM AM PM AM PM Impact? 3 1 Dwy. 1 / California St. CSS Future Intersection A A No 2 Patterson Av. / Harley Knox Bl. TS C C C C No 3 Patterson Av. / Dwy. 2 CSS Future Intersection B A No 4 Patterson Av. / California St. CSS B A B A No 1 Per the Highway Capacity Manual (6th Edition), overall average intersection delay and level of service are shown for intersections with a traffic signal or all way stop control. For intersections with cross street stop control, the delay and level of service for the worst individual movement (or movements sharing a single lane) are shown. 2 3 CSS = Cross street Stop; TS = Traffic Signal A project related impact is considered cumulative and significant when a study intersection operates at an acceptable LOS for the Without Project traffic conditions and the addition of 50 or more AM or PM peak hour project trips plus cumulative development project trips causes the intersection to operate at an unacceptable LOS for the With Project traffic conditions.
14

15
16
17
18
19
20
21
22

23
24
25
26
27
28
29 Focused TIA ATTACHMENT A: COUNT DATA (MAY AND OCTOBER 2018)
30 08:00 AM :15 AM :30 AM :45 AM Total Grand Total Apprch % Total % Passenger Vehicles % Passenger Vehicles Large 2 Axle Vehicles % Large 2 Axle Vehicles Axle Vehicles % 3 Axle Vehicles Axle Trucks % 4+ Axle Trucks Counts Unlimited PO Box 1178 Corona, CA (951) City of Perris N/S: E/W: Weather: Clear File Name : 04_PER_Patterson_Harley Knox AM Site Code : Start Date : 5/24/2018 Page No : 1 Groups Printed- Passenger Vehicles - Large 2 Axle Vehicles - 3 Axle Vehicles - 4+ Axle Trucks Southbound Westbound Northbound Eastbound Start Time Left Thru Right RTOR App. Total Left Thru Right RTOR App. Total Left Thru Right RTOR App. Total Left Thru Right RTOR App. Total Exclu. Total Inclu. Total Int. Total 07:00 AM :15 AM :30 AM :45 AM Total Southbound Westbound Northbound Eastbound Start Time Left Thru Right App. Total Left Thru Right App. Total Left Thru Right App. Total Left Thru Right App. Total Int. Total Peak Hour Analysis From 07:00 AM to 08:45 AM - Peak 1 of 1 Peak Hour for Entire Intersection Begins at 07:00 AM 07:00 AM :15 AM :30 AM :45 AM Total Volume % App. Total PHF
31 Counts Unlimited PO Box 1178 Corona, CA (951) City of Perris N/S: E/W: Weather: Clear File Name : 04_PER_Patterson_Harley Knox AM Site Code : Start Date : 5/24/2018 Page No : Right 3 Thru 11 Left Peak Hour Data Right 484 Thru 19 Left North Peak Hour Begins at 07:00 AM Passenger Vehicles Large 2 Axle Vehicles 3 Axle Vehicles 4+ Axle Trucks Right Thru Left Left 43 Thru 6 Right
32 Counts Unlimited PO Box 1178 Corona, CA (951) City of Perris N/S: E/W: Weather: Clear File Name : 04_PER_Patterson_Harley Knox AM Site Code : Start Date : 5/24/2018 Page No : 3 Southbound Westbound Northbound Eastbound Start Time Left Thru Right App. Total Left Thru Right App. Total Left Thru Right App. Total Left Thru Right App. Total Int. Total Peak Hour Analysis From 07:00 AM to 08:45 AM - Peak 1 of 1 Peak Hour for Each Approach Begins at: 07:45 AM 07:00 AM 07:00 AM 07:00 AM +0 mins mins mins mins Total Volume % App. Total PHF
33 08:00 AM :15 AM :30 AM :45 AM Total Grand Total Apprch % Total % Counts Unlimited PO Box 1178 Corona, CA (951) City of Perris N/S: E/W: Weather: Clear File Name : 04_PER_Patterson_Harley Knox AM Site Code : Start Date : 5/24/2018 Page No : 1 Groups Printed- Passenger Vehicles Southbound Westbound Northbound Eastbound Start Time Left Thru Right RTOR App. Total Left Thru Right RTOR App. Total Left Thru Right RTOR App. Total Left Thru Right RTOR App. Total Exclu. Total Inclu. Total Int. Total 07:00 AM :15 AM :30 AM :45 AM Total Southbound Westbound Northbound Eastbound Start Time Left Thru Right App. Total Left Thru Right App. Total Left Thru Right App. Total Left Thru Right App. Total Int. Total Peak Hour Analysis From 07:00 AM to 07:45 AM - Peak 1 of 1 Peak Hour for Entire Intersection Begins at 07:00 AM 07:00 AM :15 AM :30 AM :45 AM Total Volume % App. Total PHF
34 Counts Unlimited PO Box 1178 Corona, CA (951) City of Perris N/S: E/W: Weather: Clear File Name : 04_PER_Patterson_Harley Knox AM Site Code : Start Date : 5/24/2018 Page No : Right 1 Thru 3 Left Peak Hour Data Right 412 Thru 13 Left North Peak Hour Begins at 07:00 AM Passenger Vehicles Right Thru Left Left 32 Thru 4 Right
35 Counts Unlimited PO Box 1178 Corona, CA (951) City of Perris N/S: E/W: Weather: Clear File Name : 04_PER_Patterson_Harley Knox AM Site Code : Start Date : 5/24/2018 Page No : 3 Southbound Westbound Northbound Eastbound Start Time Left Thru Right App. Total Left Thru Right App. Total Left Thru Right App. Total Left Thru Right App. Total Int. Total Peak Hour Analysis From 07:00 AM to 07:45 AM - Peak 1 of 1 Peak Hour for Each Approach Begins at: 07:00 AM 07:00 AM 07:00 AM 07:00 AM +0 mins mins mins mins Total Volume % App. Total PHF
36 08:00 AM :15 AM :30 AM :45 AM Total Grand Total Apprch % Total % Counts Unlimited PO Box 1178 Corona, CA (951) City of Perris N/S: E/W: Weather: Clear File Name : 04_PER_Patterson_Harley Knox AM Site Code : Start Date : 5/24/2018 Page No : 1 Groups Printed- Large 2 Axle Vehicles Southbound Westbound Northbound Eastbound Start Time Left Thru Right RTOR App. Total Left Thru Right RTOR App. Total Left Thru Right RTOR App. Total Left Thru Right RTOR App. Total Exclu. Total Inclu. Total Int. Total 07:00 AM :15 AM :30 AM :45 AM Total Southbound Westbound Northbound Eastbound Start Time Left Thru Right App. Total Left Thru Right App. Total Left Thru Right App. Total Left Thru Right App. Total Int. Total Peak Hour Analysis From 07:00 AM to 07:45 AM - Peak 1 of 1 Peak Hour for Entire Intersection Begins at 07:00 AM 07:00 AM :15 AM :30 AM :45 AM Total Volume % App. Total PHF
37 Counts Unlimited PO Box 1178 Corona, CA (951) City of Perris N/S: E/W: Weather: Clear File Name : 04_PER_Patterson_Harley Knox AM Site Code : Start Date : 5/24/2018 Page No : Right 2 Thru 1 Left Peak Hour Data Right 22 Thru Left 4 North Peak Hour Begins at 07:00 AM Large 2 Axle Vehicles Right Thru Left Left 1 Thru 1 Right
38 Counts Unlimited PO Box 1178 Corona, CA (951) City of Perris N/S: E/W: Weather: Clear File Name : 04_PER_Patterson_Harley Knox AM Site Code : Start Date : 5/24/2018 Page No : 3 Southbound Westbound Northbound Eastbound Start Time Left Thru Right App. Total Left Thru Right App. Total Left Thru Right App. Total Left Thru Right App. Total Int. Total Peak Hour Analysis From 07:00 AM to 07:45 AM - Peak 1 of 1 Peak Hour for Each Approach Begins at: 07:00 AM 07:00 AM 07:00 AM 07:00 AM +0 mins mins mins mins Total Volume % App. Total PHF
39 08:00 AM :15 AM :30 AM :45 AM Total Grand Total Apprch % Total % Counts Unlimited PO Box 1178 Corona, CA (951) City of Perris N/S: E/W: Weather: Clear File Name : 04_PER_Patterson_Harley Knox AM Site Code : Start Date : 5/24/2018 Page No : 1 Groups Printed- 3 Axle Vehicles Southbound Westbound Northbound Eastbound Start Time Left Thru Right RTOR App. Total Left Thru Right RTOR App. Total Left Thru Right RTOR App. Total Left Thru Right RTOR App. Total Exclu. Total Inclu. Total Int. Total 07:00 AM :15 AM :30 AM :45 AM Total Southbound Westbound Northbound Eastbound Start Time Left Thru Right App. Total Left Thru Right App. Total Left Thru Right App. Total Left Thru Right App. Total Int. Total Peak Hour Analysis From 07:00 AM to 07:45 AM - Peak 1 of 1 Peak Hour for Entire Intersection Begins at 07:00 AM 07:00 AM :15 AM :30 AM :45 AM Total Volume % App. Total PHF
40 Counts Unlimited PO Box 1178 Corona, CA (951) City of Perris N/S: E/W: Weather: Clear File Name : 04_PER_Patterson_Harley Knox AM Site Code : Start Date : 5/24/2018 Page No : Right 0 Thru 0 Left Peak Hour Data Right 16 Thru Left 0 North Peak Hour Begins at 07:00 AM 3 Axle Vehicles Right Thru Left Left 6 Thru 0 Right
41 Counts Unlimited PO Box 1178 Corona, CA (951) City of Perris N/S: E/W: Weather: Clear File Name : 04_PER_Patterson_Harley Knox AM Site Code : Start Date : 5/24/2018 Page No : 3 Southbound Westbound Northbound Eastbound Start Time Left Thru Right App. Total Left Thru Right App. Total Left Thru Right App. Total Left Thru Right App. Total Int. Total Peak Hour Analysis From 07:00 AM to 07:45 AM - Peak 1 of 1 Peak Hour for Each Approach Begins at: 07:00 AM 07:00 AM 07:00 AM 07:00 AM +0 mins mins mins mins Total Volume % App. Total PHF
42 08:00 AM :15 AM :30 AM :45 AM Total Grand Total Apprch % Total % Counts Unlimited PO Box 1178 Corona, CA (951) City of Perris N/S: E/W: Weather: Clear File Name : 04_PER_Patterson_Harley Knox AM Site Code : Start Date : 5/24/2018 Page No : 1 Groups Printed- 4+ Axle Trucks Southbound Westbound Northbound Eastbound Start Time Left Thru Right RTOR App. Total Left Thru Right RTOR App. Total Left Thru Right RTOR App. Total Left Thru Right RTOR App. Total Exclu. Total Inclu. Total Int. Total 07:00 AM :15 AM :30 AM :45 AM Total Southbound Westbound Northbound Eastbound Start Time Left Thru Right App. Total Left Thru Right App. Total Left Thru Right App. Total Left Thru Right App. Total Int. Total Peak Hour Analysis From 07:00 AM to 07:45 AM - Peak 1 of 1 Peak Hour for Entire Intersection Begins at 07:00 AM 07:00 AM :15 AM :30 AM :45 AM Total Volume % App. Total PHF
43 Counts Unlimited PO Box 1178 Corona, CA (951) City of Perris N/S: E/W: Weather: Clear File Name : 04_PER_Patterson_Harley Knox AM Site Code : Start Date : 5/24/2018 Page No : Right 0 Thru 7 Left Peak Hour Data Right 34 Thru Left 2 Peak Hour Begins at 07:00 AM 4+ Axle Trucks North Right Thru Left Left 4 Thru 1 Right
44 Counts Unlimited PO Box 1178 Corona, CA (951) City of Perris N/S: E/W: Weather: Clear File Name : 04_PER_Patterson_Harley Knox AM Site Code : Start Date : 5/24/2018 Page No : 3 Southbound Westbound Northbound Eastbound Start Time Left Thru Right App. Total Left Thru Right App. Total Left Thru Right App. Total Left Thru Right App. Total Int. Total Peak Hour Analysis From 07:00 AM to 07:45 AM - Peak 1 of 1 Peak Hour for Each Approach Begins at: 07:00 AM 07:00 AM 07:00 AM 07:00 AM +0 mins mins mins mins Total Volume % App. Total PHF
45 05:00 PM :15 PM :30 PM :45 PM Total Grand Total Apprch % Total % Passenger Vehicles % Passenger Vehicles Large 2 Axle Vehicles % Large 2 Axle Vehicles Axle Vehicles % 3 Axle Vehicles Axle Trucks % 4+ Axle Trucks Counts Unlimited PO Box 1178 Corona, CA (951) City of Perris N/S: E/W: Weather: Clear File Name : 04_PER_Patterson_Harley Knox PM Site Code : Start Date : 5/24/2018 Page No : 1 Groups Printed- Passenger Vehicles - Large 2 Axle Vehicles - 3 Axle Vehicles - 4+ Axle Trucks Southbound Westbound Northbound Eastbound Start Time Left Thru Right RTOR App. Total Left Thru Right RTOR App. Total Left Thru Right RTOR App. Total Left Thru Right RTOR App. Total Exclu. Total Inclu. Total Int. Total 04:00 PM :15 PM :30 PM :45 PM Total Southbound Westbound Northbound Eastbound Start Time Left Thru Right App. Total Left Thru Right App. Total Left Thru Right App. Total Left Thru Right App. Total Int. Total Peak Hour Analysis From 04:00 PM to 05:45 PM - Peak 1 of 1 Peak Hour for Entire Intersection Begins at 04:00 PM 04:00 PM :15 PM :30 PM :45 PM Total Volume % App. Total PHF
46 Counts Unlimited PO Box 1178 Corona, CA (951) City of Perris N/S: E/W: Weather: Clear File Name : 04_PER_Patterson_Harley Knox PM Site Code : Start Date : 5/24/2018 Page No : Right 3 Thru 18 Left Peak Hour Data Right 527 Thru 19 Left North Peak Hour Begins at 04:00 PM Passenger Vehicles Large 2 Axle Vehicles 3 Axle Vehicles 4+ Axle Trucks Right Thru Left Left 32 Thru 2 Right
47 Counts Unlimited PO Box 1178 Corona, CA (951) City of Perris N/S: E/W: Weather: Clear File Name : 04_PER_Patterson_Harley Knox PM Site Code : Start Date : 5/24/2018 Page No : 3 Southbound Westbound Northbound Eastbound Start Time Left Thru Right App. Total Left Thru Right App. Total Left Thru Right App. Total Left Thru Right App. Total Int. Total Peak Hour Analysis From 04:00 PM to 05:45 PM - Peak 1 of 1 Peak Hour for Each Approach Begins at: 04:30 PM 04:00 PM 04:00 PM 04:00 PM +0 mins mins mins mins Total Volume % App. Total PHF
48 05:00 PM :15 PM :30 PM :45 PM Total Grand Total Apprch % Total % Counts Unlimited PO Box 1178 Corona, CA (951) City of Perris N/S: E/W: Weather: Clear File Name : 04_PER_Patterson_Harley Knox PM Site Code : Start Date : 5/24/2018 Page No : 1 Groups Printed- Passenger Vehicles Southbound Westbound Northbound Eastbound Start Time Left Thru Right RTOR App. Total Left Thru Right RTOR App. Total Left Thru Right RTOR App. Total Left Thru Right RTOR App. Total Exclu. Total Inclu. Total Int. Total 04:00 PM :15 PM :30 PM :45 PM Total Southbound Westbound Northbound Eastbound Start Time Left Thru Right App. Total Left Thru Right App. Total Left Thru Right App. Total Left Thru Right App. Total Int. Total Peak Hour Analysis From 04:00 PM to 04:45 PM - Peak 1 of 1 Peak Hour for Entire Intersection Begins at 04:00 PM 04:00 PM :15 PM :30 PM :45 PM Total Volume % App. Total PHF
49 Counts Unlimited PO Box 1178 Corona, CA (951) City of Perris N/S: E/W: Weather: Clear File Name : 04_PER_Patterson_Harley Knox PM Site Code : Start Date : 5/24/2018 Page No : Right 2 Thru 15 Left Peak Hour Data Right 455 Thru Left 8 North Peak Hour Begins at 04:00 PM Passenger Vehicles Right Thru Left Left 28 Thru 2 Right
50 Counts Unlimited PO Box 1178 Corona, CA (951) City of Perris N/S: E/W: Weather: Clear File Name : 04_PER_Patterson_Harley Knox PM Site Code : Start Date : 5/24/2018 Page No : 3 Southbound Westbound Northbound Eastbound Start Time Left Thru Right App. Total Left Thru Right App. Total Left Thru Right App. Total Left Thru Right App. Total Int. Total Peak Hour Analysis From 04:00 PM to 04:45 PM - Peak 1 of 1 Peak Hour for Each Approach Begins at: 04:00 PM 04:00 PM 04:00 PM 04:00 PM +0 mins mins mins mins Total Volume % App. Total PHF
51 05:00 PM :15 PM :30 PM :45 PM Total Grand Total Apprch % Total % Counts Unlimited PO Box 1178 Corona, CA (951) City of Perris N/S: E/W: Weather: Clear File Name : 04_PER_Patterson_Harley Knox PM Site Code : Start Date : 5/24/2018 Page No : 1 Groups Printed- Large 2 Axle Vehicles Southbound Westbound Northbound Eastbound Start Time Left Thru Right RTOR App. Total Left Thru Right RTOR App. Total Left Thru Right RTOR App. Total Left Thru Right RTOR App. Total Exclu. Total Inclu. Total Int. Total 04:00 PM :15 PM :30 PM :45 PM Total Southbound Westbound Northbound Eastbound Start Time Left Thru Right App. Total Left Thru Right App. Total Left Thru Right App. Total Left Thru Right App. Total Int. Total Peak Hour Analysis From 04:00 PM to 04:45 PM - Peak 1 of 1 Peak Hour for Entire Intersection Begins at 04:00 PM 04:00 PM :15 PM :30 PM :45 PM Total Volume % App. Total PHF
52 Counts Unlimited PO Box 1178 Corona, CA (951) City of Perris N/S: E/W: Weather: Clear File Name : 04_PER_Patterson_Harley Knox PM Site Code : Start Date : 5/24/2018 Page No : Right 1 Thru 3 Left Peak Hour Data Right 6 2 Thru Left North Peak Hour Begins at 04:00 PM Large 2 Axle Vehicles Right Thru Left Left 2 Thru 0 Right
53 Counts Unlimited PO Box 1178 Corona, CA (951) City of Perris N/S: E/W: Weather: Clear File Name : 04_PER_Patterson_Harley Knox PM Site Code : Start Date : 5/24/2018 Page No : 3 Southbound Westbound Northbound Eastbound Start Time Left Thru Right App. Total Left Thru Right App. Total Left Thru Right App. Total Left Thru Right App. Total Int. Total Peak Hour Analysis From 04:00 PM to 04:45 PM - Peak 1 of 1 Peak Hour for Each Approach Begins at: 04:00 PM 04:00 PM 04:00 PM 04:00 PM +0 mins mins mins mins Total Volume % App. Total PHF
54 05:00 PM :15 PM :30 PM :45 PM Total Grand Total Apprch % Total % Counts Unlimited PO Box 1178 Corona, CA (951) City of Perris N/S: E/W: Weather: Clear File Name : 04_PER_Patterson_Harley Knox PM Site Code : Start Date : 5/24/2018 Page No : 1 Groups Printed- 3 Axle Vehicles Southbound Westbound Northbound Eastbound Start Time Left Thru Right RTOR App. Total Left Thru Right RTOR App. Total Left Thru Right RTOR App. Total Left Thru Right RTOR App. Total Exclu. Total Inclu. Total Int. Total 04:00 PM :15 PM :30 PM :45 PM Total Southbound Westbound Northbound Eastbound Start Time Left Thru Right App. Total Left Thru Right App. Total Left Thru Right App. Total Left Thru Right App. Total Int. Total Peak Hour Analysis From 04:00 PM to 04:45 PM - Peak 1 of 1 Peak Hour for Entire Intersection Begins at 04:00 PM 04:00 PM :15 PM :30 PM :45 PM Total Volume % App. Total PHF
55 Counts Unlimited PO Box 1178 Corona, CA (951) City of Perris N/S: E/W: Weather: Clear File Name : 04_PER_Patterson_Harley Knox PM Site Code : Start Date : 5/24/2018 Page No : Right 0 Thru 0 Left Peak Hour Data Right 33 Thru Left 2 North Peak Hour Begins at 04:00 PM 3 Axle Vehicles Right Thru Left Left 0 Thru 0 Right
56 Counts Unlimited PO Box 1178 Corona, CA (951) City of Perris N/S: E/W: Weather: Clear File Name : 04_PER_Patterson_Harley Knox PM Site Code : Start Date : 5/24/2018 Page No : 3 Southbound Westbound Northbound Eastbound Start Time Left Thru Right App. Total Left Thru Right App. Total Left Thru Right App. Total Left Thru Right App. Total Int. Total Peak Hour Analysis From 04:00 PM to 04:45 PM - Peak 1 of 1 Peak Hour for Each Approach Begins at: 04:00 PM 04:00 PM 04:00 PM 04:00 PM +0 mins mins mins mins Total Volume % App. Total PHF
57 05:00 PM :15 PM :30 PM :45 PM Total Grand Total Apprch % Total % Counts Unlimited PO Box 1178 Corona, CA (951) City of Perris N/S: E/W: Weather: Clear File Name : 04_PER_Patterson_Harley Knox PM Site Code : Start Date : 5/24/2018 Page No : 1 Groups Printed- 4+ Axle Trucks Southbound Westbound Northbound Eastbound Start Time Left Thru Right RTOR App. Total Left Thru Right RTOR App. Total Left Thru Right RTOR App. Total Left Thru Right RTOR App. Total Exclu. Total Inclu. Total Int. Total 04:00 PM :15 PM :30 PM :45 PM Total Southbound Westbound Northbound Eastbound Start Time Left Thru Right App. Total Left Thru Right App. Total Left Thru Right App. Total Left Thru Right App. Total Int. Total Peak Hour Analysis From 04:00 PM to 04:45 PM - Peak 1 of 1 Peak Hour for Entire Intersection Begins at 04:00 PM 04:00 PM :15 PM :30 PM :45 PM Total Volume % App. Total PHF
58 Counts Unlimited PO Box 1178 Corona, CA (951) City of Perris N/S: E/W: Weather: Clear File Name : 04_PER_Patterson_Harley Knox PM Site Code : Start Date : 5/24/2018 Page No : Right 0 Thru 0 Left Peak Hour Data Right 33 Thru Left 7 Peak Hour Begins at 04:00 PM 4+ Axle Trucks North Right Thru Left Left 2 Thru 0 Right
59 Counts Unlimited PO Box 1178 Corona, CA (951) City of Perris N/S: E/W: Weather: Clear File Name : 04_PER_Patterson_Harley Knox PM Site Code : Start Date : 5/24/2018 Page No : 3 Southbound Westbound Northbound Eastbound Start Time Left Thru Right App. Total Left Thru Right App. Total Left Thru Right App. Total Left Thru Right App. Total Int. Total Peak Hour Analysis From 04:00 PM to 04:45 PM - Peak 1 of 1 Peak Hour for Each Approach Begins at: 04:00 PM 04:00 PM 04:00 PM 04:00 PM +0 mins mins mins mins Total Volume % App. Total PHF
60 Location: Perris Date: 5/24/2018 N/S: Day: Thursday E/W: PEDESTRIANS 7:00 AM 7:15 AM 7:30 AM 7:45 AM 8:00 AM 8:15 AM 8:30 AM 8:45 AM TOTAL VOLUMES: North Leg East Leg South Leg West Leg Pedestrians Pedestrians Pedestrians Pedestrians :00 PM 4:15 PM 4:30 PM 4:45 PM 5:00 PM 5:15 PM 5:30 PM 5:45 PM TOTAL VOLUMES: North Leg East Leg South Leg West Leg Pedestrians Pedestrians Pedestrians Pedestrians Counts Unlimited, Inc. PO Box 1178 Corona, CA
61 Location: Perris Date: 5/24/2018 N/S: Day: Thursday E/W: BICYCLES 7:00 AM 7:15 AM 7:30 AM 7:45 AM 8:00 AM 8:15 AM 8:30 AM 8:45 AM TOTAL VOLUMES: Southbound Westbound Northbound Eastbound Left Thru Right Left Thru Right Left Thru Right Left Thru Right :00 PM 4:15 PM 4:30 PM 4:45 PM 5:00 PM 5:15 PM 5:30 PM 5:45 PM TOTAL VOLUMES: Southbound Westbound Northbound Eastbound Left Thru Right Left Thru Right Left Thru Right Left Thru Right Counts Unlimited, Inc. PO Box 1178 Corona, CA
62 Counts Unlimited PO Box 1178 Corona, CA (951) City of Perris N/S: E/W: Weather: Clear File Name : 01_PER_Patterson_Harley Knox AM Site Code : Start Date : 10/9/2018 Page No : 1 Groups Printed- Passenger Vehicles - Large 2 Axle Vehicles - 3 Axle Vehicles - 4+ Axle Trucks Southbound Westbound Northbound Eastbound Start Time Left Thru Right App. Total Left Thru Right App. Total Left Thru Right App. Total Left Thru Right App. Total Int. Total 07:00 AM :15 AM :30 AM :45 AM Total :00 AM :15 AM :30 AM :45 AM Total Grand Total Apprch % Total % Passenger Vehicles % Passenger Vehicles Large 2 Axle Vehicles % Large 2 Axle Vehicles Axle Vehicles % 3 Axle Vehicles Axle Trucks % 4+ Axle Trucks Southbound Westbound Northbound Eastbound Start Time Left Thru Right App. Total Left Thru Right App. Total Left Thru Right App. Total Left Thru Right App. Total Int. Total Peak Hour Analysis From 07:00 AM to 08:45 AM - Peak 1 of 1 Peak Hour for Entire Intersection Begins at 07:00 AM 07:00 AM :15 AM :30 AM :45 AM Total Volume % App. Total PHF
63 Counts Unlimited PO Box 1178 Corona, CA (951) City of Perris N/S: E/W: Weather: Clear File Name : 01_PER_Patterson_Harley Knox AM Site Code : Start Date : 10/9/2018 Page No : Right 2 Thru 8 Left Peak Hour Data Left 370 Thru 32 Right North Peak Hour Begins at 07:00 AM Passenger Vehicles Large 2 Axle Vehicles 3 Axle Vehicles 4+ Axle Trucks Right Thru Left Left 212 Thru 5 Right 15 Peak Hour Analysis From 07:00 AM to 08:45 AM - Peak 1 of 1 Peak Hour for Each Approach Begins at: :00 AM 07:00 AM 07:00 AM 07:15 AM +0 mins mins mins mins Total Volume % App. Total PHF
64 Counts Unlimited PO Box 1178 Corona, CA (951) City of Perris N/S: E/W: Weather: Clear File Name : 01_PER_Patterson_Harley Knox AM Site Code : Start Date : 10/9/2018 Page No : 1 Groups Printed- Passenger Vehicles Southbound Westbound Northbound Eastbound Start Time Left Thru Right App. Total Left Thru Right App. Total Left Thru Right App. Total Left Thru Right App. Total Int. Total 07:00 AM :15 AM :30 AM :45 AM Total :00 AM :15 AM :30 AM :45 AM Total Grand Total Apprch % Total % Southbound Westbound Northbound Eastbound Start Time Left Thru Right App. Total Left Thru Right App. Total Left Thru Right App. Total Left Thru Right App. Total Int. Total Peak Hour Analysis From 07:00 AM to 07:45 AM - Peak 1 of 1 Peak Hour for Entire Intersection Begins at 07:00 AM 07:00 AM :15 AM :30 AM :45 AM Total Volume % App. Total PHF
65 Counts Unlimited PO Box 1178 Corona, CA (951) City of Perris N/S: E/W: Weather: Clear File Name : 01_PER_Patterson_Harley Knox AM Site Code : Start Date : 10/9/2018 Page No : Right 2 Thru 6 Left Peak Hour Data Left 300 Thru 27 Right North Peak Hour Begins at 07:00 AM Passenger Vehicles Right Thru Left Left 192 Thru 5 Right 11 Peak Hour Analysis From 07:00 AM to 07:45 AM - Peak 1 of 1 Peak Hour for Each Approach Begins at: :00 AM 07:00 AM 07:00 AM 07:00 AM +0 mins mins mins mins Total Volume % App. Total PHF
66 Counts Unlimited PO Box 1178 Corona, CA (951) City of Perris N/S: E/W: Weather: Clear File Name : 01_PER_Patterson_Harley Knox AM Site Code : Start Date : 10/9/2018 Page No : 1 Groups Printed- Large 2 Axle Vehicles Southbound Westbound Northbound Eastbound Start Time Left Thru Right App. Total Left Thru Right App. Total Left Thru Right App. Total Left Thru Right App. Total Int. Total 07:00 AM :15 AM :30 AM :45 AM Total :00 AM :15 AM :30 AM :45 AM Total Grand Total Apprch % Total % Southbound Westbound Northbound Eastbound Start Time Left Thru Right App. Total Left Thru Right App. Total Left Thru Right App. Total Left Thru Right App. Total Int. Total Peak Hour Analysis From 07:00 AM to 07:45 AM - Peak 1 of 1 Peak Hour for Entire Intersection Begins at 07:00 AM 07:00 AM :15 AM :30 AM :45 AM Total Volume % App. Total PHF
67 Counts Unlimited PO Box 1178 Corona, CA (951) City of Perris N/S: E/W: Weather: Clear File Name : 01_PER_Patterson_Harley Knox AM Site Code : Start Date : 10/9/2018 Page No : Right 0 Thru 0 Left Peak Hour Data Left 14 Thru 1 Right North Peak Hour Begins at 07:00 AM Large 2 Axle Vehicles Right Thru Left Left 8 Thru 0 Right 2 Peak Hour Analysis From 07:00 AM to 07:45 AM - Peak 1 of 1 Peak Hour for Each Approach Begins at: :00 AM 07:00 AM 07:00 AM 07:00 AM +0 mins mins mins mins Total Volume % App. Total PHF
68 Counts Unlimited PO Box 1178 Corona, CA (951) City of Perris N/S: E/W: Weather: Clear File Name : 01_PER_Patterson_Harley Knox AM Site Code : Start Date : 10/9/2018 Page No : 1 Groups Printed- 3 Axle Vehicles Southbound Westbound Northbound Eastbound Start Time Left Thru Right App. Total Left Thru Right App. Total Left Thru Right App. Total Left Thru Right App. Total Int. Total 07:00 AM :15 AM :30 AM :45 AM Total :00 AM :15 AM :30 AM :45 AM Total Grand Total Apprch % Total % Southbound Westbound Northbound Eastbound Start Time Left Thru Right App. Total Left Thru Right App. Total Left Thru Right App. Total Left Thru Right App. Total Int. Total Peak Hour Analysis From 07:00 AM to 07:45 AM - Peak 1 of 1 Peak Hour for Entire Intersection Begins at 07:00 AM 07:00 AM :15 AM :30 AM :45 AM Total Volume % App. Total PHF
69 Counts Unlimited PO Box 1178 Corona, CA (951) City of Perris N/S: E/W: Weather: Clear File Name : 01_PER_Patterson_Harley Knox AM Site Code : Start Date : 10/9/2018 Page No : Right 0 Thru 0 Left Peak Hour Data Left 12 Thru 3 Right North Peak Hour Begins at 07:00 AM 3 Axle Vehicles Right Thru Left Left 8 Thru 0 Right 0 Peak Hour Analysis From 07:00 AM to 07:45 AM - Peak 1 of 1 Peak Hour for Each Approach Begins at: :00 AM 07:00 AM 07:00 AM 07:00 AM +0 mins mins mins mins Total Volume % App. Total PHF
70 Counts Unlimited PO Box 1178 Corona, CA (951) City of Perris N/S: E/W: Weather: Clear File Name : 01_PER_Patterson_Harley Knox AM Site Code : Start Date : 10/9/2018 Page No : 1 Groups Printed- 4+ Axle Trucks Southbound Westbound Northbound Eastbound Start Time Left Thru Right App. Total Left Thru Right App. Total Left Thru Right App. Total Left Thru Right App. Total Int. Total 07:00 AM :15 AM :30 AM :45 AM Total :00 AM :15 AM :30 AM :45 AM Total Grand Total Apprch % Total % Southbound Westbound Northbound Eastbound Start Time Left Thru Right App. Total Left Thru Right App. Total Left Thru Right App. Total Left Thru Right App. Total Int. Total Peak Hour Analysis From 07:00 AM to 07:45 AM - Peak 1 of 1 Peak Hour for Entire Intersection Begins at 07:00 AM 07:00 AM :15 AM :30 AM :45 AM Total Volume % App. Total PHF
71 Counts Unlimited PO Box 1178 Corona, CA (951) City of Perris N/S: E/W: Weather: Clear File Name : 01_PER_Patterson_Harley Knox AM Site Code : Start Date : 10/9/2018 Page No : Right 0 Thru 2 Left Peak Hour Data Left 44 Thru 1 Right North Peak Hour Begins at 07:00 AM 4+ Axle Trucks Right Thru Left Left 4 Thru 0 Right 2 Peak Hour Analysis From 07:00 AM to 07:45 AM - Peak 1 of 1 Peak Hour for Each Approach Begins at: :00 AM 07:00 AM 07:00 AM 07:00 AM +0 mins mins mins mins Total Volume % App. Total PHF
72 Counts Unlimited PO Box 1178 Corona, CA (951) City of Perris N/S: E/W: Weather: Clear File Name : 01_PER_Patterson_Harley Knox PM Site Code : Start Date : 10/9/2018 Page No : 1 Groups Printed- Passenger Vehicles - Large 2 Axle Vehicles - 3 Axle Vehicles - 4+ Axle Trucks Southbound Westbound Northbound Eastbound Start Time Left Thru Right App. Total Left Thru Right App. Total Left Thru Right App. Total Left Thru Right App. Total Int. Total 04:00 PM :15 PM :30 PM :45 PM Total :00 PM :15 PM :30 PM :45 PM Total Grand Total Apprch % Total % Passenger Vehicles % Passenger Vehicles Large 2 Axle Vehicles % Large 2 Axle Vehicles Axle Vehicles % 3 Axle Vehicles Axle Trucks % 4+ Axle Trucks Southbound Westbound Northbound Eastbound Start Time Left Thru Right App. Total Left Thru Right App. Total Left Thru Right App. Total Left Thru Right App. Total Int. Total Peak Hour Analysis From 04:00 PM to 05:45 PM - Peak 1 of 1 Peak Hour for Entire Intersection Begins at 04:00 PM 04:00 PM :15 PM :30 PM :45 PM Total Volume % App. Total PHF
73 Counts Unlimited PO Box 1178 Corona, CA (951) City of Perris N/S: E/W: Weather: Clear File Name : 01_PER_Patterson_Harley Knox PM Site Code : Start Date : 10/9/2018 Page No : Right 4 Thru 20 Left Peak Hour Data Left 479 Thru 47 Right North Peak Hour Begins at 04:00 PM Passenger Vehicles Large 2 Axle Vehicles 3 Axle Vehicles 4+ Axle Trucks Right Thru Left Left 100 Thru 1 Right 10 Peak Hour Analysis From 04:00 PM to 05:45 PM - Peak 1 of 1 Peak Hour for Each Approach Begins at: :30 PM 04:30 PM 04:15 PM 04:00 PM +0 mins mins mins mins Total Volume % App. Total PHF
74 Counts Unlimited PO Box 1178 Corona, CA (951) City of Perris N/S: E/W: Weather: Clear File Name : 01_PER_Patterson_Harley Knox PM Site Code : Start Date : 10/9/2018 Page No : 1 Groups Printed- Passenger Vehicles Southbound Westbound Northbound Eastbound Start Time Left Thru Right App. Total Left Thru Right App. Total Left Thru Right App. Total Left Thru Right App. Total Int. Total 04:00 PM :15 PM :30 PM :45 PM Total :00 PM :15 PM :30 PM :45 PM Total Grand Total Apprch % Total % Southbound Westbound Northbound Eastbound Start Time Left Thru Right App. Total Left Thru Right App. Total Left Thru Right App. Total Left Thru Right App. Total Int. Total Peak Hour Analysis From 04:00 PM to 04:45 PM - Peak 1 of 1 Peak Hour for Entire Intersection Begins at 04:00 PM 04:00 PM :15 PM :30 PM :45 PM Total Volume % App. Total PHF
75 Counts Unlimited PO Box 1178 Corona, CA (951) City of Perris N/S: E/W: Weather: Clear File Name : 01_PER_Patterson_Harley Knox PM Site Code : Start Date : 10/9/2018 Page No : Right 3 Thru 16 Left Peak Hour Data Left 413 Thru 39 Right North Peak Hour Begins at 04:00 PM Passenger Vehicles Right Thru Left Left 94 Thru 0 Right 7 Peak Hour Analysis From 04:00 PM to 04:45 PM - Peak 1 of 1 Peak Hour for Each Approach Begins at: :00 PM 04:00 PM 04:00 PM 04:00 PM +0 mins mins mins mins Total Volume % App. Total PHF
76 Counts Unlimited PO Box 1178 Corona, CA (951) City of Perris N/S: E/W: Weather: Clear File Name : 01_PER_Patterson_Harley Knox PM Site Code : Start Date : 10/9/2018 Page No : 1 Groups Printed- Large 2 Axle Vehicles Southbound Westbound Northbound Eastbound Start Time Left Thru Right App. Total Left Thru Right App. Total Left Thru Right App. Total Left Thru Right App. Total Int. Total 04:00 PM :15 PM :30 PM :45 PM Total :00 PM :15 PM :30 PM :45 PM Total Grand Total Apprch % Total % Southbound Westbound Northbound Eastbound Start Time Left Thru Right App. Total Left Thru Right App. Total Left Thru Right App. Total Left Thru Right App. Total Int. Total Peak Hour Analysis From 04:00 PM to 04:45 PM - Peak 1 of 1 Peak Hour for Entire Intersection Begins at 04:00 PM 04:00 PM :15 PM :30 PM :45 PM Total Volume % App. Total PHF
77 Counts Unlimited PO Box 1178 Corona, CA (951) City of Perris N/S: E/W: Weather: Clear File Name : 01_PER_Patterson_Harley Knox PM Site Code : Start Date : 10/9/2018 Page No : Right 1 Thru 1 Left Peak Hour Data Left 12 Thru 4 Right North Peak Hour Begins at 04:00 PM Large 2 Axle Vehicles Right Thru Left Left 3 Thru 0 Right 2 Peak Hour Analysis From 04:00 PM to 04:45 PM - Peak 1 of 1 Peak Hour for Each Approach Begins at: :00 PM 04:00 PM 04:00 PM 04:00 PM +0 mins mins mins mins Total Volume % App. Total PHF
78 Counts Unlimited PO Box 1178 Corona, CA (951) City of Perris N/S: E/W: Weather: Clear File Name : 01_PER_Patterson_Harley Knox PM Site Code : Start Date : 10/9/2018 Page No : 1 Groups Printed- 3 Axle Vehicles Southbound Westbound Northbound Eastbound Start Time Left Thru Right App. Total Left Thru Right App. Total Left Thru Right App. Total Left Thru Right App. Total Int. Total 04:00 PM :15 PM :30 PM :45 PM Total :00 PM :15 PM :30 PM :45 PM Total Grand Total Apprch % Total % Southbound Westbound Northbound Eastbound Start Time Left Thru Right App. Total Left Thru Right App. Total Left Thru Right App. Total Left Thru Right App. Total Int. Total Peak Hour Analysis From 04:00 PM to 04:45 PM - Peak 1 of 1 Peak Hour for Entire Intersection Begins at 04:00 PM 04:00 PM :15 PM :30 PM :45 PM Total Volume % App. Total PHF
79 Counts Unlimited PO Box 1178 Corona, CA (951) City of Perris N/S: E/W: Weather: Clear File Name : 01_PER_Patterson_Harley Knox PM Site Code : Start Date : 10/9/2018 Page No : Right 0 Thru 1 Left Peak Hour Data Left 20 Thru 2 Right North Peak Hour Begins at 04:00 PM 3 Axle Vehicles Right Thru Left Left 2 Thru 0 Right 1 Peak Hour Analysis From 04:00 PM to 04:45 PM - Peak 1 of 1 Peak Hour for Each Approach Begins at: :00 PM 04:00 PM 04:00 PM 04:00 PM +0 mins mins mins mins Total Volume % App. Total PHF
80 Counts Unlimited PO Box 1178 Corona, CA (951) City of Perris N/S: E/W: Weather: Clear File Name : 01_PER_Patterson_Harley Knox PM Site Code : Start Date : 10/9/2018 Page No : 1 Groups Printed- 4+ Axle Trucks Southbound Westbound Northbound Eastbound Start Time Left Thru Right App. Total Left Thru Right App. Total Left Thru Right App. Total Left Thru Right App. Total Int. Total 04:00 PM :15 PM :30 PM :45 PM Total :00 PM :15 PM :30 PM :45 PM Total Grand Total Apprch % Total % Southbound Westbound Northbound Eastbound Start Time Left Thru Right App. Total Left Thru Right App. Total Left Thru Right App. Total Left Thru Right App. Total Int. Total Peak Hour Analysis From 04:00 PM to 04:45 PM - Peak 1 of 1 Peak Hour for Entire Intersection Begins at 04:00 PM 04:00 PM :15 PM :30 PM :45 PM Total Volume % App. Total PHF
81 Counts Unlimited PO Box 1178 Corona, CA (951) City of Perris N/S: E/W: Weather: Clear File Name : 01_PER_Patterson_Harley Knox PM Site Code : Start Date : 10/9/2018 Page No : Right 0 Thru 2 Left Peak Hour Data Left 34 Thru 2 Right North Peak Hour Begins at 04:00 PM 4+ Axle Trucks Right Thru Left Left 1 Thru 1 Right 0 Peak Hour Analysis From 04:00 PM to 04:45 PM - Peak 1 of 1 Peak Hour for Each Approach Begins at: :00 PM 04:00 PM 04:00 PM 04:00 PM +0 mins mins mins mins Total Volume % App. Total PHF
82 Location: Perris Date: 10/9/2018 N/S: Day: Tuesday E/W: PEDESTRIANS 7:00 AM 7:15 AM 7:30 AM 7:45 AM 8:00 AM 8:15 AM 8:30 AM 8:45 AM TOTAL VOLUMES: North Leg East Leg South Leg West Leg Pedestrians Pedestrians Pedestrians Pedestrians :00 PM 4:15 PM 4:30 PM 4:45 PM 5:00 PM 5:15 PM 5:30 PM 5:45 PM TOTAL VOLUMES: North Leg East Leg South Leg West Leg Pedestrians Pedestrians Pedestrians Pedestrians Counts Unlimited, Inc. PO Box 1178 Corona, CA
83 Location: Perris Date: 10/9/2018 N/S: Day: Tuesday E/W: BICYCLES 7:00 AM 7:15 AM 7:30 AM 7:45 AM 8:00 AM 8:15 AM 8:30 AM 8:45 AM TOTAL VOLUMES: Southbound Westbound Northbound Eastbound Left Thru Right Left Thru Right Left Thru Right Left Thru Right :00 PM 4:15 PM 4:30 PM 4:45 PM 5:00 PM 5:15 PM 5:30 PM 5:45 PM TOTAL VOLUMES: Southbound Westbound Northbound Eastbound Left Thru Right Left Thru Right Left Thru Right Left Thru Right Counts Unlimited, Inc. PO Box 1178 Corona, CA
84 Counts Unlimited PO Box 1178 Corona, CA (951) City of Perris N/S: E/W: California Avenue Weather: Clear File Name : 02_PER_Patterson_California AM Site Code : Start Date : 10/9/2018 Page No : 1 Groups Printed- Passenger Vehicles - Large 2 Axle Vehicles - 3 Axle Vehicles - 4+ Axle Trucks Southbound Dirt Lot Westbound Northbound California Avenue Eastbound Start Time Left Thru Right App. Total Left Thru Right App. Total Left Thru Right App. Total Left Thru Right App. Total Int. Total 07:00 AM :15 AM :30 AM :45 AM Total :00 AM :15 AM :30 AM :45 AM Total Grand Total Apprch % Total % Passenger Vehicles % Passenger Vehicles Large 2 Axle Vehicles % Large 2 Axle Vehicles Axle Vehicles % 3 Axle Vehicles Axle Trucks % 4+ Axle Trucks Southbound Dirt Lot Westbound Northbound California Avenue Eastbound Start Time Left Thru Right App. Total Left Thru Right App. Total Left Thru Right App. Total Left Thru Right App. Total Int. Total Peak Hour Analysis From 07:00 AM to 08:45 AM - Peak 1 of 1 Peak Hour for Entire Intersection Begins at 07:00 AM 07:00 AM :15 AM :30 AM :45 AM Total Volume % App. Total PHF
85 Counts Unlimited PO Box 1178 Corona, CA (951) City of Perris N/S: E/W: California Avenue Weather: Clear File Name : 02_PER_Patterson_California AM Site Code : Start Date : 10/9/2018 Page No : Right 30 Thru 0 Left Peak Hour Data California Avenue Thru Left 2 Right North Peak Hour Begins at 07:00 AM Passenger Vehicles Large 2 Axle Vehicles 3 Axle Vehicles 4+ Axle Trucks Right Thru Left Dirt Lot Left 1 Thru 211 Right 0 Peak Hour Analysis From 07:00 AM to 08:45 AM - Peak 1 of 1 Peak Hour for Each Approach Begins at: :00 AM 07:00 AM 07:00 AM 07:00 AM +0 mins mins mins mins Total Volume % App. Total PHF
86 Counts Unlimited PO Box 1178 Corona, CA (951) City of Perris N/S: E/W: California Avenue Weather: Clear File Name : 02_PER_Patterson_California AM Site Code : Start Date : 10/9/2018 Page No : 1 Groups Printed- Passenger Vehicles Southbound Dirt Lot Westbound Northbound California Avenue Eastbound Start Time Left Thru Right App. Total Left Thru Right App. Total Left Thru Right App. Total Left Thru Right App. Total Int. Total 07:00 AM :15 AM :30 AM :45 AM Total :00 AM :15 AM :30 AM :45 AM Total Grand Total Apprch % Total % Southbound Dirt Lot Westbound Northbound California Avenue Eastbound Start Time Left Thru Right App. Total Left Thru Right App. Total Left Thru Right App. Total Left Thru Right App. Total Int. Total Peak Hour Analysis From 07:00 AM to 07:45 AM - Peak 1 of 1 Peak Hour for Entire Intersection Begins at 07:00 AM 07:00 AM :15 AM :30 AM :45 AM Total Volume % App. Total PHF
87 Counts Unlimited PO Box 1178 Corona, CA (951) City of Perris N/S: E/W: California Avenue Weather: Clear File Name : 02_PER_Patterson_California AM Site Code : Start Date : 10/9/2018 Page No : Right 24 Thru 0 Left Peak Hour Data California Avenue Thru Left 1 Right North Peak Hour Begins at 07:00 AM Passenger Vehicles Right Thru Left Dirt Lot Left 1 Thru 196 Right 0 Peak Hour Analysis From 07:00 AM to 07:45 AM - Peak 1 of 1 Peak Hour for Each Approach Begins at: :00 AM 07:00 AM 07:00 AM 07:00 AM +0 mins mins mins mins Total Volume % App. Total PHF
88 Counts Unlimited PO Box 1178 Corona, CA (951) City of Perris N/S: E/W: California Avenue Weather: Clear File Name : 02_PER_Patterson_California AM Site Code : Start Date : 10/9/2018 Page No : 1 Groups Printed- Large 2 Axle Vehicles Southbound Dirt Lot Westbound Northbound California Avenue Eastbound Start Time Left Thru Right App. Total Left Thru Right App. Total Left Thru Right App. Total Left Thru Right App. Total Int. Total 07:00 AM :15 AM :30 AM :45 AM Total :00 AM :15 AM :30 AM :45 AM Total Grand Total Apprch % Total % Southbound Dirt Lot Westbound Northbound California Avenue Eastbound Start Time Left Thru Right App. Total Left Thru Right App. Total Left Thru Right App. Total Left Thru Right App. Total Int. Total Peak Hour Analysis From 07:00 AM to 07:45 AM - Peak 1 of 1 Peak Hour for Entire Intersection Begins at 07:00 AM 07:00 AM :15 AM :30 AM :45 AM Total Volume % App. Total PHF
89 Counts Unlimited PO Box 1178 Corona, CA (951) City of Perris N/S: E/W: California Avenue Weather: Clear File Name : 02_PER_Patterson_California AM Site Code : Start Date : 10/9/2018 Page No : Right 2 Thru 0 Left Peak Hour Data California Avenue Thru Left 0 Right North Peak Hour Begins at 07:00 AM Large 2 Axle Vehicles Right Thru Left Dirt Lot Left 0 Thru 7 Right 0 Peak Hour Analysis From 07:00 AM to 07:45 AM - Peak 1 of 1 Peak Hour for Each Approach Begins at: :00 AM 07:00 AM 07:00 AM 07:00 AM +0 mins mins mins mins Total Volume % App. Total PHF
90 Counts Unlimited PO Box 1178 Corona, CA (951) City of Perris N/S: E/W: California Avenue Weather: Clear File Name : 02_PER_Patterson_California AM Site Code : Start Date : 10/9/2018 Page No : 1 Groups Printed- 3 Axle Vehicles Southbound Dirt Lot Westbound Northbound California Avenue Eastbound Start Time Left Thru Right App. Total Left Thru Right App. Total Left Thru Right App. Total Left Thru Right App. Total Int. Total 07:00 AM :15 AM :30 AM :45 AM Total :00 AM :15 AM :30 AM :45 AM Total Grand Total Apprch % Total % Southbound Dirt Lot Westbound Northbound California Avenue Eastbound Start Time Left Thru Right App. Total Left Thru Right App. Total Left Thru Right App. Total Left Thru Right App. Total Int. Total Peak Hour Analysis From 07:00 AM to 07:45 AM - Peak 1 of 1 Peak Hour for Entire Intersection Begins at 07:00 AM 07:00 AM :15 AM :30 AM :45 AM Total Volume % App. Total PHF
91 Counts Unlimited PO Box 1178 Corona, CA (951) City of Perris N/S: E/W: California Avenue Weather: Clear File Name : 02_PER_Patterson_California AM Site Code : Start Date : 10/9/2018 Page No : Right 3 Thru 0 Left Peak Hour Data California Avenue Thru Left 1 Right North Peak Hour Begins at 07:00 AM 3 Axle Vehicles Right Thru Left Dirt Lot Left 0 Thru 8 Right 0 Peak Hour Analysis From 07:00 AM to 07:45 AM - Peak 1 of 1 Peak Hour for Each Approach Begins at: :00 AM 07:00 AM 07:00 AM 07:00 AM +0 mins mins mins mins Total Volume % App. Total PHF
92 Counts Unlimited PO Box 1178 Corona, CA (951) City of Perris N/S: E/W: California Avenue Weather: Clear File Name : 02_PER_Patterson_California AM Site Code : Start Date : 10/9/2018 Page No : 1 Groups Printed- 4+ Axle Trucks Southbound Dirt Lot Westbound Northbound California Avenue Eastbound Start Time Left Thru Right App. Total Left Thru Right App. Total Left Thru Right App. Total Left Thru Right App. Total Int. Total 07:00 AM :15 AM :30 AM :45 AM Total :00 AM :15 AM :30 AM :45 AM Total Grand Total Apprch % Total % Southbound Dirt Lot Westbound Northbound California Avenue Eastbound Start Time Left Thru Right App. Total Left Thru Right App. Total Left Thru Right App. Total Left Thru Right App. Total Int. Total Peak Hour Analysis From 07:00 AM to 07:45 AM - Peak 1 of 1 Peak Hour for Entire Intersection Begins at 07:00 AM 07:00 AM :15 AM :30 AM :45 AM Total Volume % App. Total PHF
93 Counts Unlimited PO Box 1178 Corona, CA (951) City of Perris N/S: E/W: California Avenue Weather: Clear File Name : 02_PER_Patterson_California AM Site Code : Start Date : 10/9/2018 Page No : Right 1 Thru 0 Left Peak Hour Data California Avenue Thru Left 0 Right North Peak Hour Begins at 07:00 AM 4+ Axle Trucks Right Thru Left Dirt Lot Left 0 Thru 0 Right 0 Peak Hour Analysis From 07:00 AM to 07:45 AM - Peak 1 of 1 Peak Hour for Each Approach Begins at: :00 AM 07:00 AM 07:00 AM 07:00 AM +0 mins mins mins mins Total Volume % App. Total PHF
94 Counts Unlimited PO Box 1178 Corona, CA (951) City of Perris N/S: E/W: California Avenue Weather: Clear File Name : 02_PER_Patterson_California PM Site Code : Start Date : 10/9/2018 Page No : 1 Groups Printed- Passenger Vehicles - Large 2 Axle Vehicles - 3 Axle Vehicles - 4+ Axle Trucks Southbound Dirt Lot Westbound Northbound California Avenue Eastbound Start Time Left Thru Right App. Total Left Thru Right App. Total Left Thru Right App. Total Left Thru Right App. Total Int. Total 04:00 PM :15 PM :30 PM :45 PM Total :00 PM :15 PM :30 PM :45 PM Total Grand Total Apprch % Total % Passenger Vehicles % Passenger Vehicles Large 2 Axle Vehicles % Large 2 Axle Vehicles Axle Vehicles % 3 Axle Vehicles Axle Trucks % 4+ Axle Trucks Southbound Dirt Lot Westbound Northbound California Avenue Eastbound Start Time Left Thru Right App. Total Left Thru Right App. Total Left Thru Right App. Total Left Thru Right App. Total Int. Total Peak Hour Analysis From 04:00 PM to 05:45 PM - Peak 1 of 1 Peak Hour for Entire Intersection Begins at 04:00 PM 04:00 PM :15 PM :30 PM :45 PM Total Volume % App. Total PHF
95 Counts Unlimited PO Box 1178 Corona, CA (951) City of Perris N/S: E/W: California Avenue Weather: Clear File Name : 02_PER_Patterson_California PM Site Code : Start Date : 10/9/2018 Page No : Right 48 Thru 0 Left Peak Hour Data California Avenue Thru Left 1 Right North Peak Hour Begins at 04:00 PM Passenger Vehicles Large 2 Axle Vehicles 3 Axle Vehicles 4+ Axle Trucks Right Thru Left Dirt Lot Left 0 Thru 100 Right 0 Peak Hour Analysis From 04:00 PM to 05:45 PM - Peak 1 of 1 Peak Hour for Each Approach Begins at: :00 PM 04:00 PM 04:00 PM 04:30 PM +0 mins mins mins mins Total Volume % App. Total PHF
96 Counts Unlimited PO Box 1178 Corona, CA (951) City of Perris N/S: E/W: California Avenue Weather: Clear File Name : 02_PER_Patterson_California PM Site Code : Start Date : 10/9/2018 Page No : 1 Groups Printed- Passenger Vehicles Southbound Dirt Lot Westbound Northbound California Avenue Eastbound Start Time Left Thru Right App. Total Left Thru Right App. Total Left Thru Right App. Total Left Thru Right App. Total Int. Total 04:00 PM :15 PM :30 PM :45 PM Total :00 PM :15 PM :30 PM :45 PM Total Grand Total Apprch % Total % Southbound Dirt Lot Westbound Northbound California Avenue Eastbound Start Time Left Thru Right App. Total Left Thru Right App. Total Left Thru Right App. Total Left Thru Right App. Total Int. Total Peak Hour Analysis From 04:00 PM to 04:45 PM - Peak 1 of 1 Peak Hour for Entire Intersection Begins at 04:00 PM 04:00 PM :15 PM :30 PM :45 PM Total Volume % App. Total PHF
97 Counts Unlimited PO Box 1178 Corona, CA (951) City of Perris N/S: E/W: California Avenue Weather: Clear File Name : 02_PER_Patterson_California PM Site Code : Start Date : 10/9/2018 Page No : Right 42 Thru 0 Left Peak Hour Data California Avenue Thru Left 1 Right North Peak Hour Begins at 04:00 PM Passenger Vehicles Right Thru Left Dirt Lot Left 0 Thru 97 Right 0 Peak Hour Analysis From 04:00 PM to 04:45 PM - Peak 1 of 1 Peak Hour for Each Approach Begins at: :00 PM 04:00 PM 04:00 PM 04:00 PM +0 mins mins mins mins Total Volume % App. Total PHF
98 Counts Unlimited PO Box 1178 Corona, CA (951) City of Perris N/S: E/W: California Avenue Weather: Clear File Name : 02_PER_Patterson_California PM Site Code : Start Date : 10/9/2018 Page No : 1 Groups Printed- Large 2 Axle Vehicles Southbound Dirt Lot Westbound Northbound California Avenue Eastbound Start Time Left Thru Right App. Total Left Thru Right App. Total Left Thru Right App. Total Left Thru Right App. Total Int. Total 04:00 PM :15 PM :30 PM :45 PM Total :00 PM :15 PM :30 PM :45 PM Total Grand Total Apprch % Total % Southbound Dirt Lot Westbound Northbound California Avenue Eastbound Start Time Left Thru Right App. Total Left Thru Right App. Total Left Thru Right App. Total Left Thru Right App. Total Int. Total Peak Hour Analysis From 04:00 PM to 04:45 PM - Peak 1 of 1 Peak Hour for Entire Intersection Begins at 04:00 PM 04:00 PM :15 PM :30 PM :45 PM Total Volume % App. Total PHF
99 Counts Unlimited PO Box 1178 Corona, CA (951) City of Perris N/S: E/W: California Avenue Weather: Clear File Name : 02_PER_Patterson_California PM Site Code : Start Date : 10/9/2018 Page No : Right 3 Thru 0 Left Peak Hour Data California Avenue Thru Left 0 Right North Peak Hour Begins at 04:00 PM Large 2 Axle Vehicles Right Thru Left Dirt Lot Left 0 Thru 2 Right 0 Peak Hour Analysis From 04:00 PM to 04:45 PM - Peak 1 of 1 Peak Hour for Each Approach Begins at: :00 PM 04:00 PM 04:00 PM 04:00 PM +0 mins mins mins mins Total Volume % App. Total PHF
100 Counts Unlimited PO Box 1178 Corona, CA (951) City of Perris N/S: E/W: California Avenue Weather: Clear File Name : 02_PER_Patterson_California PM Site Code : Start Date : 10/9/2018 Page No : 1 Groups Printed- 3 Axle Vehicles Southbound Dirt Lot Westbound Northbound California Avenue Eastbound Start Time Left Thru Right App. Total Left Thru Right App. Total Left Thru Right App. Total Left Thru Right App. Total Int. Total 04:00 PM :15 PM :30 PM :45 PM Total :00 PM :15 PM :30 PM :45 PM Total Grand Total Apprch % Total % Southbound Dirt Lot Westbound Northbound California Avenue Eastbound Start Time Left Thru Right App. Total Left Thru Right App. Total Left Thru Right App. Total Left Thru Right App. Total Int. Total Peak Hour Analysis From 04:00 PM to 04:45 PM - Peak 1 of 1 Peak Hour for Entire Intersection Begins at 04:00 PM 04:00 PM :15 PM :30 PM :45 PM Total Volume % App. Total PHF
101 Counts Unlimited PO Box 1178 Corona, CA (951) City of Perris N/S: E/W: California Avenue Weather: Clear File Name : 02_PER_Patterson_California PM Site Code : Start Date : 10/9/2018 Page No : Right 1 Thru 0 Left Peak Hour Data California Avenue Thru Left 0 Right North Peak Hour Begins at 04:00 PM 3 Axle Vehicles Right Thru Left Dirt Lot Left 0 Thru 1 Right 0 Peak Hour Analysis From 04:00 PM to 04:45 PM - Peak 1 of 1 Peak Hour for Each Approach Begins at: :00 PM 04:00 PM 04:00 PM 04:00 PM +0 mins mins mins mins Total Volume % App. Total PHF
102 Counts Unlimited PO Box 1178 Corona, CA (951) City of Perris N/S: E/W: California Avenue Weather: Clear File Name : 02_PER_Patterson_California PM Site Code : Start Date : 10/9/2018 Page No : 1 Groups Printed- 4+ Axle Trucks Southbound Dirt Lot Westbound Northbound California Avenue Eastbound Start Time Left Thru Right App. Total Left Thru Right App. Total Left Thru Right App. Total Left Thru Right App. Total Int. Total 04:00 PM :15 PM :30 PM :45 PM Total :00 PM :15 PM :30 PM :45 PM Total Grand Total Apprch % Total % Southbound Dirt Lot Westbound Northbound California Avenue Eastbound Start Time Left Thru Right App. Total Left Thru Right App. Total Left Thru Right App. Total Left Thru Right App. Total Int. Total Peak Hour Analysis From 04:00 PM to 04:45 PM - Peak 1 of 1 Peak Hour for Entire Intersection Begins at 04:00 PM 04:00 PM :15 PM :30 PM :45 PM Total Volume % App. Total PHF
103 Counts Unlimited PO Box 1178 Corona, CA (951) City of Perris N/S: E/W: California Avenue Weather: Clear File Name : 02_PER_Patterson_California PM Site Code : Start Date : 10/9/2018 Page No : Right 2 Thru 0 Left Peak Hour Data California Avenue Thru Left 0 Right North Peak Hour Begins at 04:00 PM 4+ Axle Trucks Right Thru Left Dirt Lot Left 0 Thru 0 Right 0 Peak Hour Analysis From 04:00 PM to 04:45 PM - Peak 1 of 1 Peak Hour for Each Approach Begins at: :00 PM 04:00 PM 04:00 PM 04:00 PM +0 mins mins mins mins Total Volume % App. Total PHF

104 Location: Perris Date: 10/9/2018 N/S: Day: Tuesday E/W: California Avenue PEDESTRIANS 7:00 AM 7:15 AM 7:30 AM 7:45 AM 8:00 AM 8:15 AM 8:30 AM 8:45 AM TOTAL VOLUMES: North Leg East Leg South Leg West Leg Dirt Lot California Avenue Pedestrians Pedestrians Pedestrians Pedestrians :00 PM 4:15 PM 4:30 PM 4:45 PM 5:00 PM 5:15 PM 5:30 PM 5:45 PM TOTAL VOLUMES: North Leg East Leg South Leg West Leg Dirt Lot California Avenue Pedestrians Pedestrians Pedestrians Pedestrians Counts Unlimited, Inc. PO Box 1178 Corona, CA
TRAFFIC IMPACT STUDY. Platte Canyon Villas Arapahoe County, Colorado (Arapahoe County Case Number: Z16-001) For
 For") TRAFFIC IMPACT STUDY For Platte Canyon Villas Arapahoe County, Colorado (Arapahoe County Case Number: Z16-001) February 2015 Revised: August 2015 April 2016 July 2016 September 2016 Prepared for: KB Home
TRAFFIC IMPACT STUDY For Platte Canyon Villas Arapahoe County, Colorado (Arapahoe County Case Number: Z16-001) February 2015 Revised: August 2015 April 2016 July 2016 September 2016 Prepared for: KB Home
Appendix I: Traffic Study
 City of Fontana Sierra Lakes Commerce Center Draft EIR Appendix I: Traffic Study FirstCarbon Solutions H:\Client (PN JN)\0144\01440050\EIR\1 ADEIR\01440050 Sec99 99 Appendix Dividers.doc THIS PAGE INTENTIONALLY
PLAZA MEXICO RESIDENCES
 PLAZA MEXICO RESIDENCES TRAFFIC STUDY PREPARED FOR: 3000 E. IMPERIAL, LLC. 6940 Beach Boulevard, D-501 Buena Park, California 90621 PREPARED BY: OCTOBER 5, 2017 translutions the transportatio n solutions
MEMORANDUM. The study area of the analysis was discussed with City staff and includes the following intersections:
 MEMORANDUM DATE: JULY 6, 2012 TO: FROM: RE: CC: MELANIE KNIGHT BRAD BYVELDS/ JENNIFER LUONG 1050 SOMERSET STREET PRELIMINARY TRAFFIC ANALYSIS OUR FILE NO. 111152 NEIL MALHOTRA The purpose of this memo
DOLLAR GENERAL PROJECT FOCUSED TRAFFIC ANALYSIS (REVISED) May 20, 2015
 May 20, 2015") DOLLAR GENERAL PROJECT FOCUSED TRAFFIC ANALYSIS (REVISED) May 20, 2015 May 20, 2015 Mr. Dan Biswas, VP of Development CJS DEVELOPMENT II, LLC 5111 North Scottsdale Road, Suite 200 Scottsdale, CA 85250
DOLLAR GENERAL PROJECT FOCUSED TRAFFIC ANALYSIS (REVISED) May 20, 2015 May 20, 2015 Mr. Dan Biswas, VP of Development CJS DEVELOPMENT II, LLC 5111 North Scottsdale Road, Suite 200 Scottsdale, CA 85250
Market Street PDP. Nassau County, Florida. Transportation Impact Analysis. VHB/Vanasse Hangen Brustlin, Inc. Nassau County Growth Management
 Transportation Impact Analysis Market Street PDP Nassau County, Florida Submitted to Nassau County Growth Management Prepared for TerraPointe Services, Inc. Prepared by VHB/Vanasse Hangen Brustlin, Inc.
WEBER ROAD RESIDENTIAL DEVELOPMENT Single Family Residential Project
 WEBER ROAD RESIDENTIAL DEVELOPMENT Single Family Residential Project WEBER ROAD RESIDENTIAL DEVELOPMENT TRAFFIC IMPACT STUDY TABLE OF CONTENTS 1.0 Executive Summary Page 2.0 Introduction 2.1 DEVELOPMENT
Traffic Impact Analysis. for the STARBUCKS STORE. Located at 9900 BALBOA BOULEVARD. Submitted to CITY OF LOS ANGELES. January 2017.
 Traffic Impact Analysis for the STARBUCKS STORE Located at 9900 BALBOA BOULEVARD Submitted to CITY OF LOS ANGELES January 2017 Submitted By January 5, 2017 Ken A. Aitchison, P.E. Transportation Engineering
Traffic Impact Study
 Traffic Impact Study Statham DRI One University Parkway Prepared for: Barrow County Prepared by: October 2012 Table of Contents Executive Summary i Section 1. Introduction 1 Project Description 1 Methodology
April 10, Mr. Curt Van De Walle, City Manager City of Castle Hills 209 Lemonwood Drive Castle Hills, Texas 78213
 Mr. Curt Van De Walle, City Manager City of Castle Hills 209 Lemonwood Drive Castle Hills, Texas 78213 Subject: Revised Castle Hills BASIS Charter School Traffic Impact Analysis Review City of Castle Hills,
ALTA VISTA COMMERCIAL/ RESIDENTIAL PROJECT
 ALTA VISTA COMMERCIAL/ RESIDENTIAL PROJECT TRAFFIC IMPACT ANALYSIS Prepared For: Paul Conzelman SC Development 2151 Michelson Drive, Suite 140 Irvine, CA 92612 Prepared By: 2030 Main Street, Suite 1200
JEP John E. Jack Pflum, P.E. Consulting Engineering 7541 Hosbrook Road, Cincinnati, OH Telephone:
 JEP John E. Jack Pflum, P.E. Consulting Engineering 7541 Hosbrook Road, Cincinnati, OH 45243 Email: jackpflum1@gmail.com Telephone: 513.919.7814 MEMORANDUM REPORT Traffic Impact Analysis Proposed Soccer
The Highline Development Traffic Impact Study
 The Highline Development Traffic Impact Study Columbia Falls, Montana Prepared For: TD&H Engineering 450 Corporate Drive, Suite 101 Kalispell, MT 59901 June, 2018 130 South Howie Street Helena, Montana
MADISON, WI STONE HOUSE DEVELOPMENT 1000 E. WASHINGTON AVENUE REDEVELOPMENT TRANSPORTATION STUDY DECEMBER 14, 2015
 MADISON, WI STONE HOUSE DEVELOPMENT 1000 E. WASHINGTON AVENUE REDEVELOPMENT TRANSPORTATION STUDY DECEMBER 14, 2015 TABLE OF CONTENTS... 3 Proposed Development... 3 Methodology... 3 Phase 1 Development...
Focused Traffic Analysis for the One Lincoln Park Project
 September 15, 2015 Mr. Bill Johnson Coldwell Banker 511 Sir Francis Drake Boulevard Greenbrae, CA 94904 Focused Traffic Analysis for the One Lincoln Park Project Dear Mr. Johnson; As requested, W-Trans
CVS Derwood. Local Area Transportation Review
 CVS Derwood Montgomery County, Maryland May 27, 2016 Local Area Transportation Review Prepared for: JC Bar Properties, Inc. Steve Fleming, PE 415 Fallowfield Road, Suite 301 Camp Hill, Pennsylvania 17011
FINAL Traffic Report for the Proposed Golden Valley Road and Newhall Ranch Road Projects in the City of Santa Clarita, California May 5, 2005
 FINAL Traffic Report for the Proposed Golden Valley Road and Newhall Ranch Road Projects in the City of Santa Clarita, California May 5, 2005 Prepared For: EDAW, Inc. 1420 Kettner Boulevard, Suite 620
NATHAN HALE HIGH SCHOOL PARKING AND TRAFFIC ANALYSIS. Table of Contents
 Parking and Traffic Analysis Seattle, WA Prepared for: URS Corporation 1501 4th Avenue, Suite 1400 Seattle, WA 98101-1616 Prepared by: Mirai Transportation Planning & Engineering 11410 NE 122nd Way, Suite
TRAFFIC IMPACT STUDY
 TRAFFIC IMPACT STUDY TERRE HAUTE CONVENTION CENTER WABASH AVENUE & 9 TH STREET TERRE HAUTE, INDIANA PREPARED FOR 8365 Keystone Crossing, Suite 201 Indianapolis, IN 46240 Phone: (317) 202-0864 Fax: (317)
Travel Demand Management Plan
 Travel Demand Management Plan Tryg s & Apartment Building 8 West Lake Street Minneapolis, MN AUTHORIZED PROPERTY REPRESENTATIVE: By Dated: Mr. Johnny Carlson Trammell Crow Chicago Development, Inc. 5 South
TRAFFIC IMPACT STUDY MANUFACTURING COMPANY
 TRAFFIC IMPACT STUDY For MANUFACTURING COMPANY Prepared For: Airway Heights, WA Prepared By: SUNBURST ENGINEERING, P. S. 4310 S. Ball Dr. Veradale, WA 99037 April, 2013 TRAFFIC IMP ACT STUDY Manufacturing
MEMORANDUM. Trip Generation Analysis
 MEMORANDUM To: RMC Architects From: Matthew Palmer, PE Subject: Trip Generation, Parking Analysis & Level of Service Project: Port of Everett, GTC #13-053 Date: August 25, 2014 The trip generation and
6711 LEE HIGHWAY TRAFFIC IMPACT STUDY ARLINGTON, VIRGINIA
 6711 TRAFFIC IMPACT STUDY ARLINGTON, VIRGINIA Prepared for: NVR, Inc. Prepared by: Wells + Associates, Inc. Michael J. Workosky, PTP, TOPS, TSOS John J. Andrus William L. Zeid, PE 703.917.6620 May 4, 2017
TRANSPORTATION IMPACT STUDY WHEELER STREET CLOSURE
 TRANSPORTATION IMPACT STUDY WHEELER STREET CLOSURE Village of Greene, Chenango County, New York Prepared for: VILLAGE OF GREENE 49 Genesee Street Greene, NY 13778 Prepared by: LARSON DESIGN GROUP 1000
APPENDIX IV MODELLING
 APPENDIX IV MODELLING Kingston Transportation Master Plan Final Report, July 2004 Appendix IV: Modelling i TABLE OF CONTENTS Page 1.0 INTRODUCTION... 1 2.0 OBJECTIVE... 1 3.0 URBAN TRANSPORTATION MODELLING
Table of Contents Introduction... 4 Study Area... 5
 Table of Contents Introduction... 4 Study Area... 5 Streets and s... 5 Traffic Volumes... 8 Recent and Anticipated Development... 10 Crash Analysis... 10 Projected Traffic Volumes... 11 Trip Generation...
Appendixx C Travel Demand Model Development and Forecasting Lubbock Outer Route Study June 2014
 Appendix C Travel Demand Model Development and Forecasting Lubbock Outer Route Study June 2014 CONTENTS List of Figures-... 3 List of Tables... 4 Introduction... 1 Application of the Lubbock Travel Demand
Appendix C Traffic Study
 Final Environmental Impact Statement Appendix C Traffic Study Schofield Generating Station Project, Hawaii October 2015 C-1 Final Environmental Impact Statement This page intentionally left blank. Schofield
January 12, Mr. Ryan Granger TMGB Wilson, LLC 2221 Health Drive SW, Suite 2200 Wyoming, Michigan 49519
 January 12, 2018 Mr. Ryan Granger TMGB Wilson, LLC 2221 Health Drive SW, Suite 2200 Wyoming, Michigan 49519 Re: Proposed Reserve at Rivertown Mixed-Use Development Updated Trip Generation and Site Driveway
Per your request and authorization, we have prepared this traffic evaluation for the above referenced project.
 Memorandum To: From: Re: Marc Stout, P.E. City Engineer, City of Roseville Chris Gregerson, P.E., T.E. Matt Weir, P.E., T.E., PTOE Douglas Boulevard Coffee Kiosk Traffic Evaluation Roseville, California
TRAFFIC STUDY FOR THE GAFFEY POOL PROJECT LOS ANGELES, CALIFORNIA CITY OF LOS ANGELES, BUREAU OF ENGINEERING OCTOBER 2013 PREPARED FOR PREPARED BY
 TRAFFIC STUDY FOR THE GAFFEY POOL PROJECT LOS ANGELES, CALIFORNIA OCTOBER 2013 PREPARED FOR CITY OF LOS ANGELES, BUREAU OF ENGINEERING PREPARED BY DRAFT TRAFFIC STUDY FOR THE GAFFEY POOL PROJECT October
Greater Toronto Area Cordon Count Summary Analysis of Traffic Trends 1985 to 2011
 Greater Toronto Area Cordon Count Summary Analysis of Traffic Trends 1985 to 2011 Prepared by: Data Management Group Department of Civil Engineering University of Toronto Telephone: (416) 978-3916 Table
Metro Emergency Security Operations Center (ESOC) 410 Center Street City of Los Angeles
 410 Center Street City of Los Angeles") Metro Emergency Security Operations Center (ESOC) 410 Center Street City of Los Angeles Traffic Study August 31, 2015 AECOM 515 South Flower Street, 4 th Floor Los Angeles, CA 90071 Job Number: 60323255
Metro Emergency Security Operations Center (ESOC) 410 Center Street City of Los Angeles Traffic Study August 31, 2015 AECOM 515 South Flower Street, 4 th Floor Los Angeles, CA 90071 Job Number: 60323255
TRAFFIC IMPACT STUDY FOR SOUTH BAY SALT POND RESTORATION PROJECT PHASE 2
 APPENDIX G TRAFFIC IMPACT STUDY FOR SOUTH BAY SALT POND RESTORATION PROJECT PHASE 2 South Bay Salt Pond Restoration Project Phase II May 2015 Draft Environmental Impact Statement/Report Traffic Impact
6 th Line Municipal Class Environmental Assessment
 6 th Line Municipal Class Environmental Assessment County Road 27 to St John s Road Town of Innisfil, ON September 6, 2016 APPENDIX L: TRAVEL DEMAND FORECASTING MEMORANDUM Accessible formats are available
The Sunland Park flyover ramp is set to close the week of March 19 until early summer
 March 2, 2018 The Sunland Park flyover ramp is set to close the week of March 19 until early summer GO 10 is targeting the week of March 19 to close the Sunland Park Drive flyover entrance ramp to I 10
California Urban Infill Trip Generation Study. Jim Daisa, P.E.
 California Urban Infill Trip Generation Study Jim Daisa, P.E. What We Did in the Study Develop trip generation rates for land uses in urban areas of California Establish a California urban land use trip
2129 NORTH MAIN STREET HOTE PROJECT ULI SHARED PARKING STUDY City of Santa Ana, California
 2129 NORTH MAIN STREET HOTE PROJECT ULI SHARED PARKING STUDY City of Santa Ana, California Prepared for: NET DEVELOPMENT COMPANY 3130 Airway Avenue Costa Mesa, CA 92626 Prepared by: RK ENGINEERING GROUP,
Final City of Colusa STREETS & ROADWAYS MASTER PLAN. October J Street Suite 390 Sacramento, CA 95814
 Final City of Colusa STREETS & ROADWAYS MASTER PLAN October 2009 660 J Street Suite 390 Sacramento, CA 95814 TABLE OF CONTENTS I. INTRODUCTION... 1 Report Organization...1 II. ANALYSIS METHODOLOGY... 2
Parking Regulations Dundas Street West, from Bathurst Street to Dovercourt Road
 STAFF REPORT ACTION REQUIRED Parking Regulations Dundas Street West, from Bathurst Street to Dovercourt Road Date: October 28, 2008 To: From: Toronto and East York Community Council Director, Transportation
MnDOT Method for Calculating Measures of Effectiveness (MOE) From CORSIM Model Output
 From CORSIM Model Output") MnDOT Method for Calculating Measures of Effectiveness (MOE) From CORSIM Model Output Rev. April 29, 2005 MnDOT Method for Calculating Measures of Effectiveness (MOE) From CORSIM Model Output Table of
MnDOT Method for Calculating Measures of Effectiveness (MOE) From CORSIM Model Output Rev. April 29, 2005 MnDOT Method for Calculating Measures of Effectiveness (MOE) From CORSIM Model Output Table of
KAISER SOUTH NORTHERN VIRGINIA HUB TRAFFIC IMPACT STUDY PRINCE WILLIAM COUNTY, VIRGINIA TABLE OF CONTENTS. Section 2 BACKGROUND INFORMATION 12
 KAISER SOUTH NORTHERN VIRGINIA HUB TRAFFIC IMPACT STUDY PRINCE WILLIAM COUNTY, VIRGINIA TABLE OF CONTENTS Page EXECUTIVE SUMMARY 1 Purpose of Report and Study Objectives... 1 Site Location and Study Area...
US 169/I-70 North Loop Planning & Environmental Linkages Study
 US 169/I-70 North Loop Planning & Environmental Linkages Study VISSIM Calibration Document Draft April 13, 2018 Page i Table of Contents 1. Overview... 1 2. Data Types... 2 3. Model Parameter Adjustments...
FINAL REPORT. City of Toronto. Contract Project No: B
 City of Toronto SAFETY IMPACTS AND REGULATIONS OF ELECTRONIC STATIC ROADSIDE ADVERTISING SIGNS TECHNICAL MEMORANDUM #2B BEFORE/AFTER COLLISION ANALYSIS AT MID-BLOCK LOCATIONS FINAL REPORT 3027 Harvester
Prepared for: San Diego Association Of Governments 401 B Street, Suite 800 San Diego, California 92101
 Activity-Based Travel Model Validation for 2012 Using Series 13 Data: Coordinated Travel Regional Activity Based Modeling Platform (CT-RAMP) for San Diego County Prepared for: San Diego Association Of
VHD Daily Totals. Population 14.5% change. VMT Daily Totals Suffolk 24-hour VMT. 49.3% change. 14.4% change VMT
 6.9 Suffolk 6-54 VMT Population and Travel Characteristics Population 14.5% change 2014 1,529,202 VHD Daily Totals 2014 251,060 49.3% change 2040 1,788,175 2040 374,850 VMT Daily Totals 2014 39,731,990
FY 2010 Continuing i Planning Program Product Report. Local Transportation and Traffic Data. Wood-Washington-Wirt Interstate Planning Commission
 FY 2010 Continuing i Planning Program Product Report Local Transportation and Traffic Data Travel Time and Delay Data for Belpre and Marietta, Ohio Wood-Washington-Wirt Interstate Planning Commission CONTINUING
Appendix C Final Methods and Assumptions for Forecasting Traffic Volumes
 Fairview Ave. and Main St. Improvements and Local Streets Plan Appendices Ada County Highway District Appendix C Final Methods and Assumptions for Forecasting Traffic Volumes January 3, 207 Appendices
FARM 1065 PORTION 1, ATLANTIS TRAFFIC IMPACT ASSESSMENT
 FARM 1065 PORTION 1, ATLANTIS TRAFFIC IMPACT ASSESSMENT February 2018 FIRST ISSUE Prepared by: JG AFRIKA (PTY) LTD Branch: Cape Town PO Box 38561 Postal code: 7430 Telephone: 021 530 1800 Email: wink@
PRADO BASIN SEDIMENT REMOVAL PROJECT FOCUSED TRAFFIC ANALYSIS. May 31, 2016
 PRADO BASIN SEDIMENT REMOVAL PROJECT FOCUSED TRAFFIC ANALYSIS May 31, 2016 Kunzman Associates, Inc. PRADO BASIN SEDIMENT REMOVAL PROJECT FOCUSED TRAFFIC ANALYSIS May 31, 2016 Prepared by: Perrie Ilercil,
S.170 th Street Micro-Simulation Seattle-Tacoma International Airport Port of Seattle/Aviation Planning
 Seattle-acoma International Airport Port of Seattle/Aviation Planning Port of Seattle PO OF SEAE Aviation Planning Airport Operations January 24, 2013 Summary he Port is planning to relocate the cell phone
WOODRUFF ROAD CORRIDOR ORIGIN-DESTINATION ANALYSIS
 2018 WOODRUFF ROAD CORRIDOR ORIGIN-DESTINATION ANALYSIS Introduction Woodruff Road is the main road to and through the commercial area in Greenville, South Carolina. Businesses along the corridor have
TRANSPORTATION AND TRAFFIC ANALYSIS REPORT
 Square One Drive Extension Municipal Class Environmental Assessment Environmental Study Report Appendix B Transportation and Traffic Analysis Report TRANSPORTATION AND TRAFFIC ANALYSIS REPORT FINAL DRAFT
Airline Road: is a two lane residential roadway adjacent to the west side of the proposed school site with a speed limit of 30 mph.
 HIGHLAND PARK ISD TRAFFIC IMPACT STUDY REPORT FOR PROPOSED HPISD ELEMENTARY SCHOOL SITE ON NORTHWEST HIGHWAY BETWEEN AIRLINE ROAD AND DURHAM IN THE CITY OF DALLAS, TEXAS PURPOSE OF STUDY The purpose of
Subject: Desert Palisades Specific Plan - Tram Way Access Sight Distance
 Endo Engineering Traffic Engineering Air Quality Studies Noise Assessments July 13, 2015 Mr. Ed Freeman Pinnacle View, LLC P.O. Box 1754 Lake Oswego, OR 97035-0579 Subject: Desert Palisades Specific Plan
City of Grand Island Tuesday, August 14, 2018 Council Session
 City of Grand Island Tuesday, August 14, 2018 Council Session Item I-1 #2018-240 - Consideration of Approving Update to Resolution No. 2015-120; Designated Truck Routes within the City of Grand Island
III. FORECASTED GROWTH
 III. FORECASTED GROWTH In order to properly identify potential improvement projects that will be required for the transportation system in Milliken, it is important to first understand the nature and volume
City of Camrose Winter Road Maintenance Policy
 City of Camrose Winter Road Maintenance Policy The purpose of this policy is to outline the level of service that the City of Camrose delivers regarding the maintenance of roads in winter conditions. 1.
CHAPTER 3 TRANSPORTATION
 CHAPTER 3 TRANSPORTATION This chapter presents information on transportation impacts of Section 2 of the Project that have changed from those identified in the published Westside Subway Extension Final
March Grade Crossing Analysis
 March 2014 Grade Crossing Analysis T E C H N I C A L M E M O R A N D U M South Florida Freight and Passenger Rail Enhancement Study Phase 1A - Rehabilitate Existing Northwood Connection; FPID: 434948-1
Signalized Intersections
 Signalized Intersections Kelly Pitera October 23, 2009 Topics to be Covered Introduction/Definitions D/D/1 Queueing Phasing and Timing Plan Level of Service (LOS) Signal Optimization Conflicting Operational
CHAPTER 3. CAPACITY OF SIGNALIZED INTERSECTIONS
 CHAPTER 3. CAPACITY OF SIGNALIZED INTERSECTIONS 1. Overview In this chapter we explore the models on which the HCM capacity analysis method for signalized intersections are based. While the method has
APPENDIX G Halton Region Transportation Model
 APPENDIX G Halton Region Transportation Model Halton Region Transportation Master Plan Working Paper No. 1 - Legislative Context Working Paper No. 2 - Active Transportation Halton Transportation Model
CONTINUING PLANNING PROGRAM LOCAL TRANSPORTATION AND TRAFFIC DATA PRODUCT REPORT [OH Corridors]
![CONTINUING PLANNING PROGRAM LOCAL TRANSPORTATION AND TRAFFIC DATA PRODUCT REPORT [OH Corridors]](/thumbs/94/120123757.jpg "CONTINUING PLANNING PROGRAM LOCAL TRANSPORTATION AND TRAFFIC DATA PRODUCT REPORT [OH Corridors]") CONTINUING PLANNING PROGRAM LOCAL TRANSPORTATION AND TRAFFIC DATA PRODUCT REPORT [OH Corridors] Travel Time and Delay Analysis for Belpre (OH) and Marietta (OH) Fiscal Year 2009 Report WOOD WASHINGTON
CONTINUING PLANNING PROGRAM LOCAL TRANSPORTATION AND TRAFFIC DATA PRODUCT REPORT [OH Corridors] Travel Time and Delay Analysis for Belpre (OH) and Marietta (OH) Fiscal Year 2009 Report WOOD WASHINGTON
z, B1-\T11v10J.\J{TrrE1{ & 1-\~Boc1i~TE33111c. Efl.VIRONMENTAL ENGINEERS AND CONSULTANTS
 vv, z, B1-\T11v10J.\J{TrrE1{ & 1-\~Boc1i~TE33111c. Efl.VIRONMENTAL ENGINEERS AND CONSULTANTS P.O. BOX 680369 FRANKLIN, TN 37068-0369 1113 MURFREESBORO RD., SUITE 310 FRANKLIN, TN 37064 615-595-0025 FAX
Appendix J: Transportation and Circulation
 Appendix J: Transportation and Circulation J 1: Transportation Analysis Report J 2: Los Angeles Department of Transportation (LADOT) Approval Letter J 3: Construction Traffic Analysis J 1: Transportation
I-10 East at Redd closes for 24 hours this Sunday, Feb 11. Then, I-10 West at Resler closes for 27 hours on Feb 25
 NEWS RELEASE a TxDOT Project For immediate release EL PASO DISTRICT Jennifer Wright (915) 790-4340 Jennifer.Wright3@txdot.gov February 9, 2018 I-10 East at Redd closes for 24 hours this Sunday, Feb 11
Trip Generation Study: A 7-Eleven Gas Station with a Convenience Store Land Use Code: 945
 Trip Generation Study: A 7-Eleven Gas Station with a Convenience Store Land Use Code: 945 Introduction The Brigham Young University Institute of Transportation Engineers student chapter (BYU ITE) completed
Project Level Traffic Forecast Report Business 40 Reconstruction Study Forsyth County
 Project Level Traffic Forecast Report Business 40 Reconstruction Study Forsyth County TIP No. U-2827 B WBS # 34872.1.1 June 2013 Prepared for North Carolina Department of Transportation Prepared by Project
Septem ber 28, 2016 EL PASO, Texas
 September 28, 2016 EL PASO, Texas Crews from Paso del Norte Trackworks will finalize underground utility work and begin laying rail on a portion of Kansas Street thru Downtown El Paso in the coming weeks,
APPENDIX I: Traffic Forecasting Model and Assumptions
 APPENDIX I: Traffic Forecasting Model and Assumptions Appendix I reports on the assumptions and traffic model specifications that were developed to support the Reaffirmation of the 2040 Long Range Plan.
A Study of Red Light Cameras in Kansas City, MO
 A Study of Red Light s in Kansas City, MO Prepared by the Special Operations Division Executive Summary This paper will analyze the crash data for the 29 red light cameras located in 17 intersections in
Wesley Chapel Area Roadway Needs Study Build-Out Analysis (Beardsley Dr/Oldwoods Ave Need Study) Project Progress Meeting 1
 Project Progress Meeting 1") Build-Out Analysis (Beardsley Dr/Oldwoods Ave Need Study) Project Progress Meeting 1 9:30 AM Pasco County Development Services Conference Room 1. Welcome/Introductions 2. Project Overview Purpose Major
Build-Out Analysis (Beardsley Dr/Oldwoods Ave Need Study) Project Progress Meeting 1 9:30 AM Pasco County Development Services Conference Room 1. Welcome/Introductions 2. Project Overview Purpose Major
Honorable Mayor and Members of the City Council
 TO: ATTENTION: FROM: SUBJECT: Honorable Mayor and Members of the City Council Jeffrey L. Stewart, City Manager Len Gorecki, Director of Public Works Jerry Stock, City Engineer Public Hearing to Consider
SHADE/SHADOW REPORT. For the Proposed 8777 Washington Project. Culver City, CA. Prepared for:
 SHADE/SHADOW REPORT For the Proposed 8777 Washington Project Culver City, CA Prepared for: VITRUVIAN CULVER CITY LLC (THE APPLICANT) 5822 WEST WASHINGTON BOULEVARD CULVER CITY, CALIFORNIA 90232 Prepared
Accessing and Using Indiana Traffic Data
 Accessing and Using Indiana Traffic Data Purdue Road School March 6, 2013 Presented by: Gregory Katter, PE Asset Planning Indiana Traffic Data 1. Overview of Traffic Data Collection Program 2. Accessing
City of Hermosa Beach Beach Access and Parking Study. Submitted by. 600 Wilshire Blvd., Suite 1050 Los Angeles, CA
 City of Hermosa Beach Beach Access and Parking Study Submitted by 600 Wilshire Blvd., Suite 1050 Los Angeles, CA 90017 213.261.3050 January 2015 TABLE OF CONTENTS Introduction to the Beach Access and Parking
OREGON DEPARTMENT OF TRANSPORTATION STATEWIDE ROAD, WEATHER AND INCIDENT CONDITIONS 4/22/2019 4:20:05 AM
 OREGON DEPARTMENT OF TRANSPORTATION STATEWIDE ROAD, WEATHER AND INCIDENT CONDITIONS Incidents/: 4/22/2019 4:20:05 AM HWY372 22 22 Mount Bachelor Ski Area I-5 10 13 5 Mi S of Ashland Informational only
1.0 INTRODUCTION AND SUMMARY...
 TABLE OF CONTENTS 1.0 INTRODUCTION AND SUMMARY... 1 1.1 Purpose and Study Objective... 1 1.2 Executive Summary... 1 2.0 ROADWAY CONDITIONS... 5 2.1 Granville Parkway (South Intersection)... 8 2.2 Tuscany
Appendix B. Durham Region Travel Demand Model Calibration
 Appendix B Durham Region Travel Demand Model Calibration AECOM 300 Water Street 905 668 9363 tel Whitby, ON, Canada L1N 9J2 905 668 0221 fax www.aecom.com To Ron Albright, Municipality of Clarington Page
North Carolina s First Quadrant Left: History and Lessons Learned
 North Carolina s First Quadrant Left: History and Lessons Learned Michael P. Reese, P.E. (Corresponding Author) Congestion Management Section Project Engineer North Carolina Department of Transportation
3.0 ANALYSIS OF FUTURE TRANSPORTATION NEEDS
 3.0 ANALYSIS OF FUTURE TRANSPORTATION NEEDS In order to better determine future roadway expansion and connectivity needs, future population growth and land development patterns were analyzed as part of
SHORT NIGHTTIME WATER SHUTDOWN TO OCCUR IN EARLY HOURS OF MAY 29
 Thank you for your interest in the Center City Connector Streetcar. In this weekly update, you ll find information about ongoing construction for the 1st phase of utility work in Pioneer Square. UPDATES
ADAPTIVE SIGNAL CONTROL IV
 ADAPTIVE SIGNAL CONTROL IV Evaluation of the Adaptive Traffic Control System in Park City, Utah Dr. Peter T. Martin Associate Professor Aleksandar Stevanovic Research Associate Ivana Vladisavljevic Research
TREASURE COAST REGIONAL PLANNING COUNCIL M E M O R A N D U M. To: Council Members AGENDA ITEM 4B10
 TREASURE COAST REGIONAL PLANNING COUNCIL M E M O R A N D U M To: Council Members AGENDA ITEM 4B10 From: Date: Subject: Staff December 14, 2018 Council Meeting Local Government Comprehensive Plan Review
CITY OF MINOT SNOW REMOVAL PLAN October 2018
 CITY OF MINOT SNOW REMOVAL PLAN October 2018 1.0 GENERAL This plan has been written to provide information regarding snow removal procedures and policies. The plan provides guidance, while maintaining
HALFF 16196? TRAFFIC MANAGEMENT PLAN. Richardson ISD Aikin Elementary School Dallas, Texas North Bowser Road Richardson, Texas 75081
 30280 16196? TRAFFIC MANAGEMENT PLAN Exhibit 572B Aikin Elementary School Planned Development District No. 572 Approved City Plan Commission October20, 2016 July 12, 2016 Prepared for HALFF AVO 31586 PHO1
North Carolina s First Quadrant Left: History and Lessons Learned
 0 0 0 North Carolina s First Quadrant Left: History and Lessons Learned Michael P. Reese, P.E. (Corresponding Author) Congestion Management Section Project Engineer North Carolina Department of Transportation
Brandywine Road Speed Study FINAL REPORT
 Brandywine Road Speed Study FINAL REPORT City of Albuquerque Brandywine Road Speed Study Final Report Albuquerque, New Mexico City of Albuquerque May, 2016 Brandywine Road Speed Study Final Report City
1.0 BACKGROUND. January 6, 2006 Proj #
 January 6, 2006 Proj # 4565-01 Mr. Eugene Wat Director of Engineering City of Port Moody 100 Newport Drive Box 36 Port Moody, BC V3H 3E1 Dear Mr. Wat: RE: ALDERSIDE ROAD & IOCO ROAD PEDESTRIAN CROSSING
Critchfield Rd / SR-129
 NOVEMBER 27, 2017 Critchfield Rd / SR-129 Intersection Safety Study Alternatives Report CRITCHFIELD INTERSECTION SAFETY STUDY Contents Introduction...1 Purpose...2 Existing Conditions...2 Proposed Alternatives...2
Engineer's Report. Main Street Business Area. Festoon Lighting and Sidewalk Cleaning Assessment District (Fiscal Year )
") Engineer's Report for the Main Street Business Area Festoon Lighting and Sidewalk Cleaning Assessment District (Fiscal Year 2008-09) Prepared under the provisions of the Benefit Assessment Act of 1982
Engineer's Report for the Main Street Business Area Festoon Lighting and Sidewalk Cleaning Assessment District (Fiscal Year 2008-09) Prepared under the provisions of the Benefit Assessment Act of 1982
Palmerston North Area Traffic Model
 Palmerston North Area Traffic Model Presentation to IPWEA 7 November 2014 PNATM Presentation Overview Model Scope and type Data collected The model Forecasting inputs Applications PNCC Aims and Objectives
IV. ENVIRONMENTAL IMPACT ANALYSIS B. AESTHETICS SHADE/SHADOW
 IV. ENVIRONMENTAL IMPACT ANALYSIS B. AESTHETICS SHADE/SHADOW 1. INTRODUCTION Potential effects of the Proposed Project related to visual character, views and light/glare are addressed in Section IV.A,
OREGON DEPARTMENT OF TRANSPORTATION STATEWIDE ROAD, WEATHER AND INCIDENT CONDITIONS 4/13/2019 2:54:03 PM
 OREGON DEPARTMENT OF TRANSPORTATION STATEWIDE ROAD, WEATHER AND INCIDENT CONDITIONS Incidents/: 4/13/2019 2:54:03 PM 57 56 @ Corvallis - Newport Hwy OR34 HWY372 22 22 Mount Bachelor Ski Area I-5 10 13
Appendix B. Traffic Analysis Report
 Appendix B Traffic Analysis Report Report No. 14369/TR/WN02 August 2007 SALLINS BYPASS BYPASS OPTIONEERING ANALYSIS - TRAFFIC REPORT Kildare County Council Áras Chill Dara, Devoy Park, Naas, Co Kildare
CHAPTER 5 DELAY ESTIMATION FOR OVERSATURATED SIGNALIZED APPROACHES
 CHAPTER 5 DELAY ESTIMATION FOR OVERSATURATED SIGNALIZED APPROACHES Delay is an important measure of effectiveness in traffic studies, as it presents the direct cost of fuel consumption and indirect cost
Jordan Harrison, Planner III, San Francisco Recreation and Park Department
 Date November 18, 2015 To: Through: From: Subject: Recreation and Park Commission Philip A. Ginsburg, General Manager Dawn Kamalanathan, Director, Capital & Planning Division Jordan Harrison, Planner III,
APPENDIX. Sutter Street Bicycle Lanes Stockton, CA January 2010
 APPENDIX reet Bicycle Lanes Stockton, CA January 2010 1. Traffic count locations 2. Turning movement counts o AM PEAK - El Dorado Street at Ingram Street o PM PEAK - El Dorado Street at Ingram Street o
Organized Chain-Up and VSL
 Organized Chain-Up and VSL Jim Mahugh, PE WSDOT SC Region Traffic Engineer North/West Passage VSL Peer Exchange January 28, 2015 Snoqualmie Pass 2 Limits of VSL EB: MP 48.12 to 66.56 WB: MP 46.69 to 66.90