Airline Road: is a two lane residential roadway adjacent to the west side of the proposed school site with a speed limit of 30 mph.
|
|
|
- Darrell Hudson
- 5 years ago
- Views:
Transcription
1
2 HIGHLAND PARK ISD TRAFFIC IMPACT STUDY REPORT FOR PROPOSED HPISD ELEMENTARY SCHOOL SITE ON NORTHWEST HIGHWAY BETWEEN AIRLINE ROAD AND DURHAM IN THE CITY OF DALLAS, TEXAS PURPOSE OF STUDY The purpose of conducting this traffic impact study is to certify to the city of Dallas that no queuing of vehicles dropping or picking up students will extend onto City of Dallas right-of-way as a result of internal queuing constraints and that the proposed school trips can be accommodated with the existing intersections with an acceptable Level of Service (LOS) STUDY AREA TRAFFIC CONDTIONS Roadways: Northwest Highway: is a six-lane divided roadway (Principal Arterial) adjacent to the north side of the proposed school site with a speed limit of 35 mph. Airline Road: is a two lane residential roadway adjacent to the west side of the proposed school site with a speed limit of 30 mph. Wentwood: is a two lane residential roadway south of the proposed site with a speed limit of 30 mph. Northwest Parkway: is a two-lane, two-way roadway with a roadway width of 20 feet that runs parallel to Northwest Highway. This roadway functions as a frontage road for businesses and residences along Northwest Highway. Durham Street: is a two lane residential roadway adjacent to the east side of the proposed school site with a speed limit of 30 mph that will serve as the primary access to the school site and parking garage. Intersections: Northwest Highway at Hillcrest Road (Full actuated traffic signal). Northwest Parkway at Airline Northwest Parkway at Durham Wentwood at Airline (All Way Stop) Wentwood at Durham Page 1 Binkley & Barfield-C&P, Inc. TBPE F Gateway Boulevard, Suite Richardson, Texas Tel: Fax:
3 Enrollment capacity and hours of operation. The enrollment capacity for this new elementary is 770 (Kindergarten through thru 4 th grade students). Traffic volumes and time estimates Turning movement counts were conducted at Wentwood at Airline and Durham on June 17, Additional turning movement counts were conducted at Northwest Parkway at Airline, Northwest Parkway at Durham and Northwest Highway at Hillcrest on May 12, A 24-hour bi-directional machine count was taken on Northwest Parkway between Airline and Durham on May 12, TRIP GENERATION Estimated vehicle trip ends to and from the study area were also calculated utilizing trip generation rates and characteristics collected and compiled by the Institute of Transportation Engineers (ITE) in the ninth edition of their trip generation handbook. Table 1 and Table 2 have been prepared to summarize the associated trip generation data and the calculated trips that are anticipated to be generated by the proposed elementary school. We have used the higher value of the average ITE rates or the fitted curve equations. Copies of the ITE data sheets used to develop Tables 1 and 2 have been attached to this report. TABLE 1 Trip Generation Data LAND USE ITE CODE UNITS QUANTITY Elementary School 520 Students 770 The trips indicated in Table 2 are the total unadjusted traffic volumes for the residential land use proposed for the study site. TABLE 2 Calculated Trip Ends LAND USE A.M. PEAK HOUR P.M. PEAK HOUR IN (vph) OUT (VPH) IN (vph) OUT (VPH) Elementary School TOTAL (ADT = average daily trips; vpd = vehicles per day; vph = vehicles per hour; in = vehicles entering the site; and out = vehicles exiting the site) Page 2
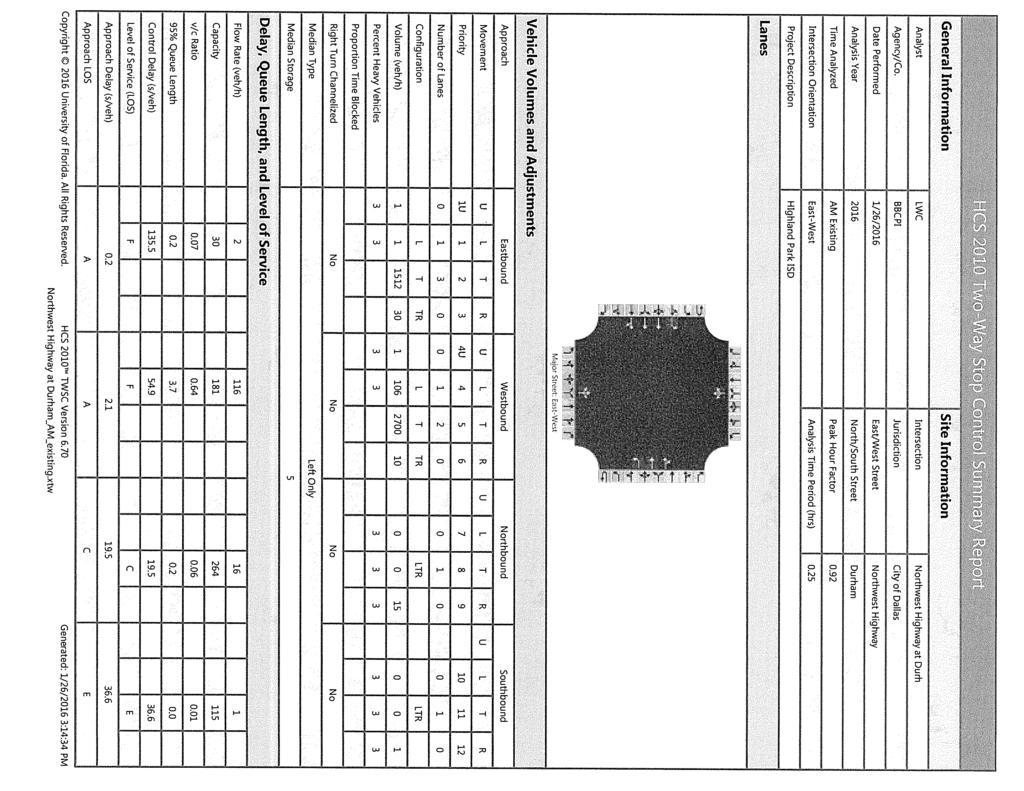
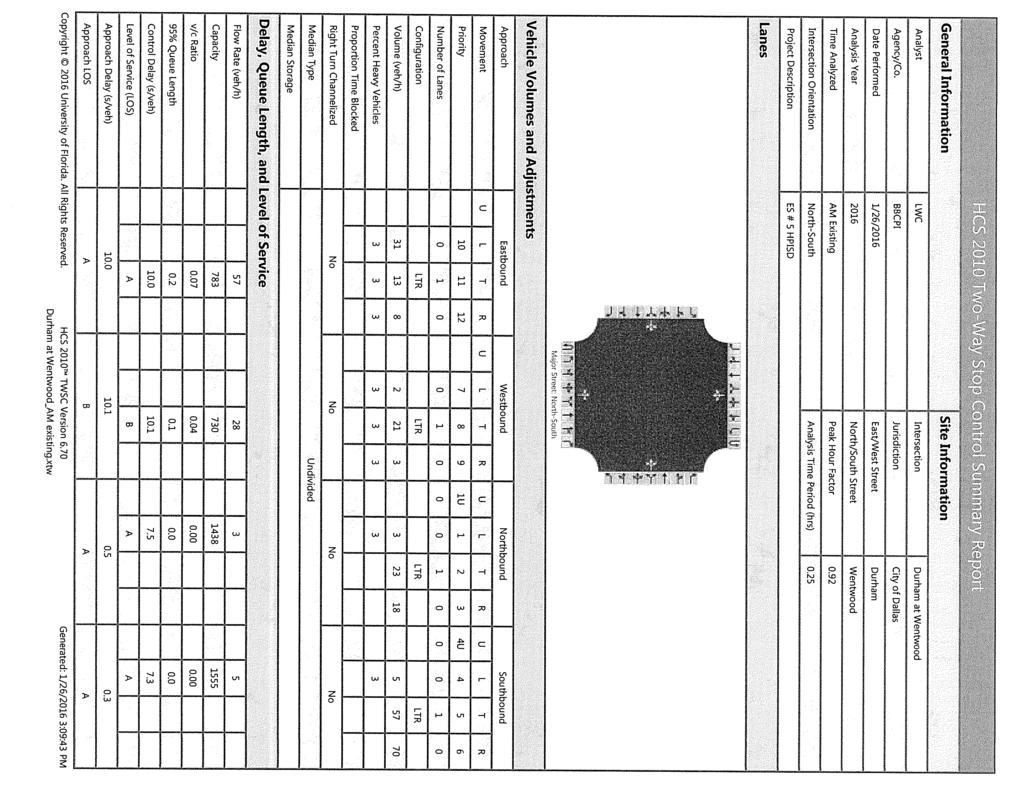
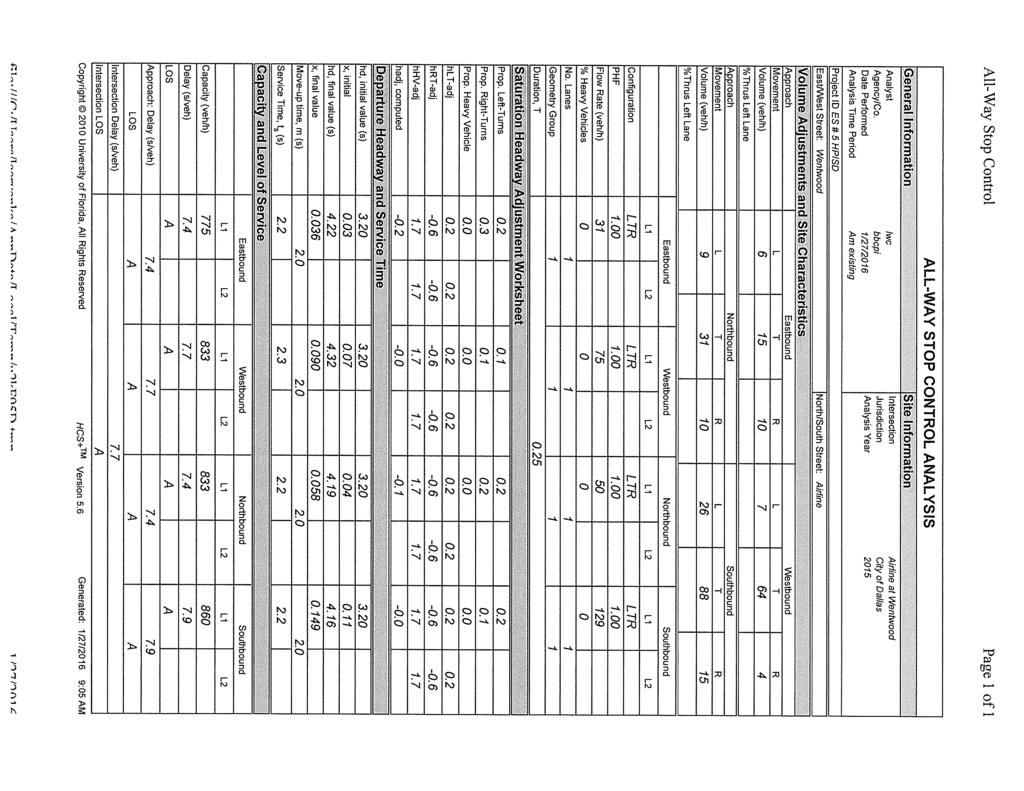
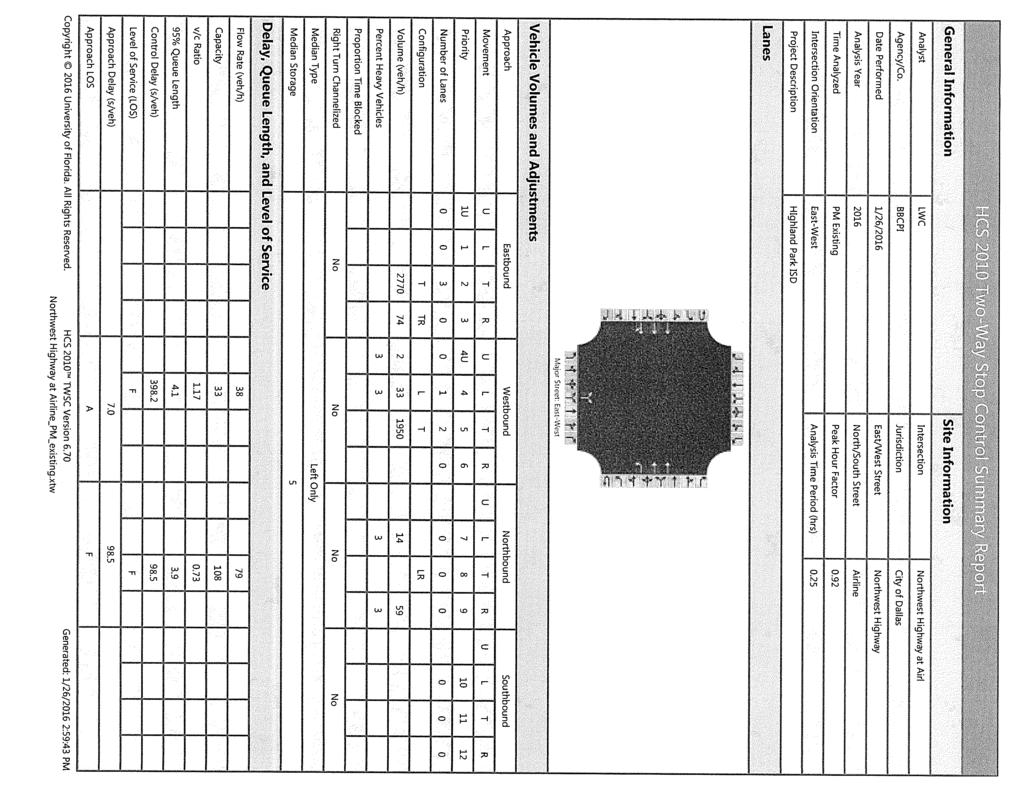
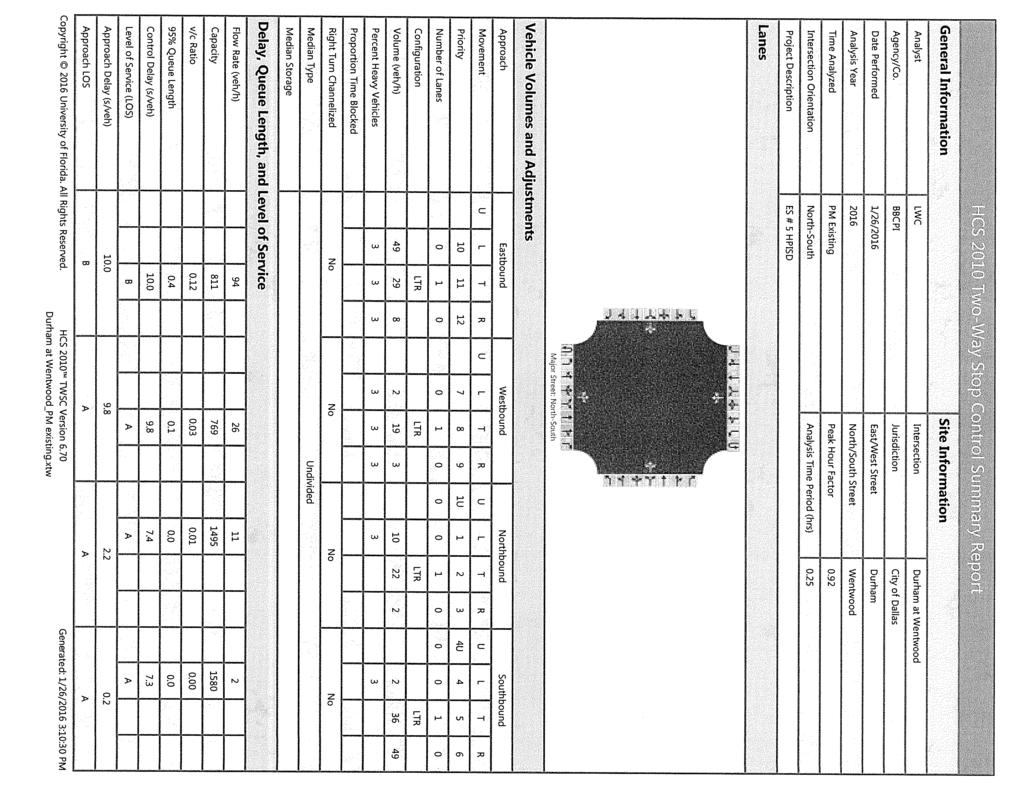
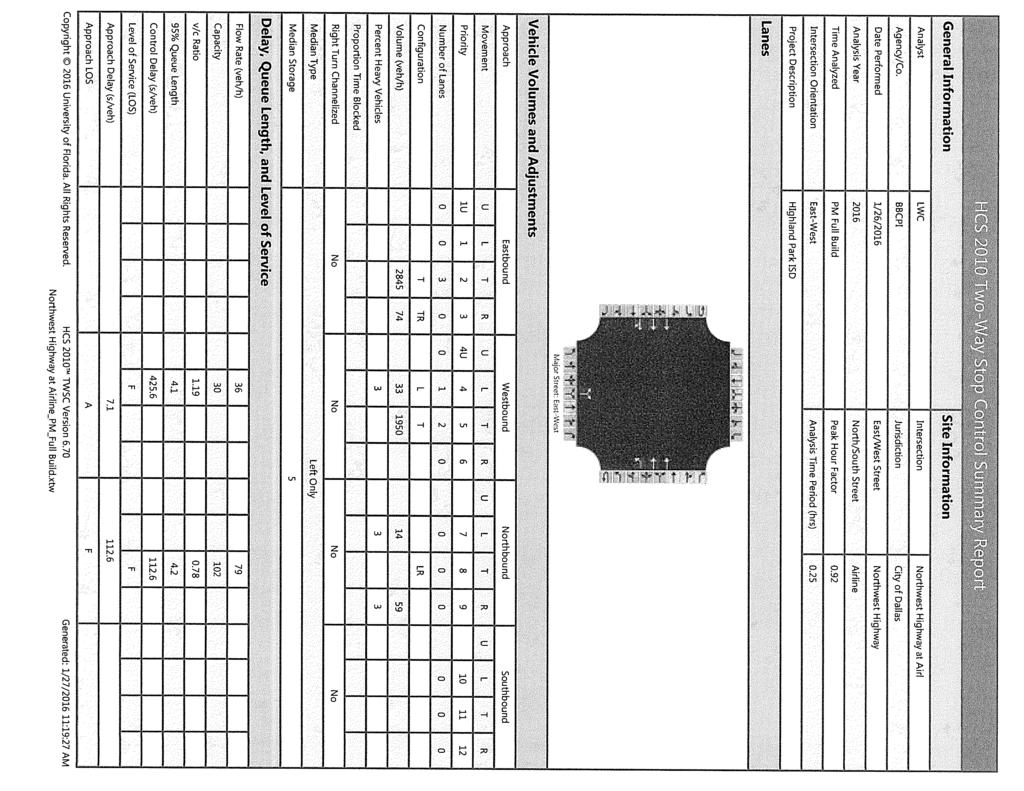
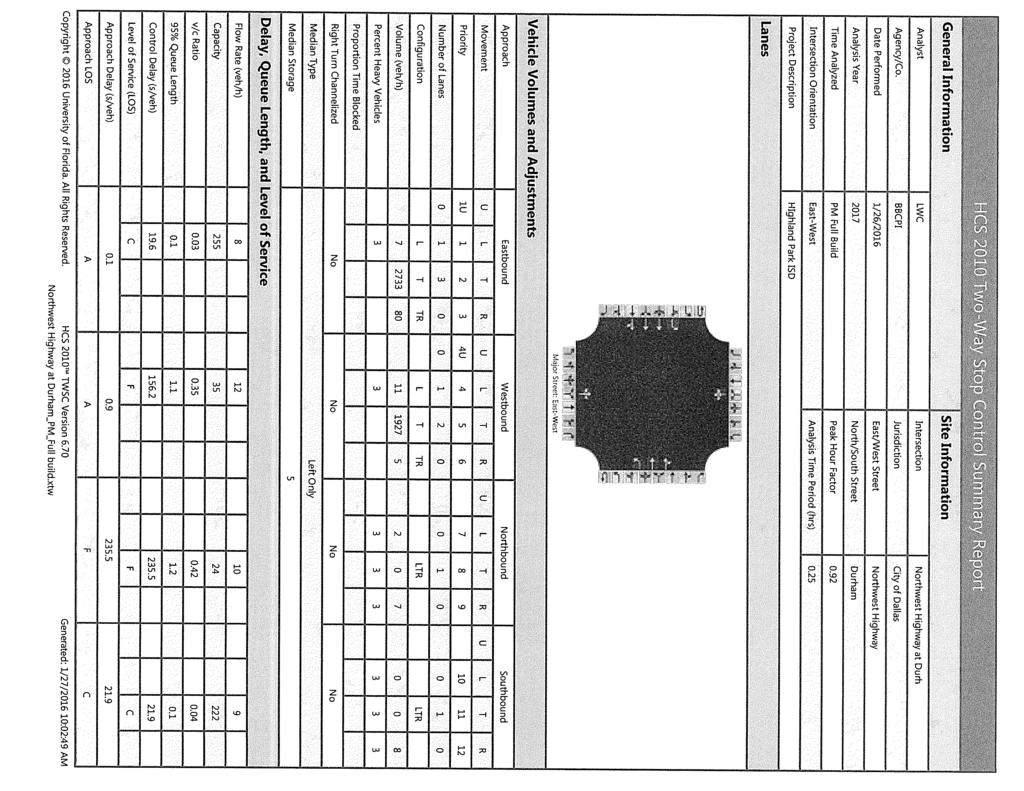
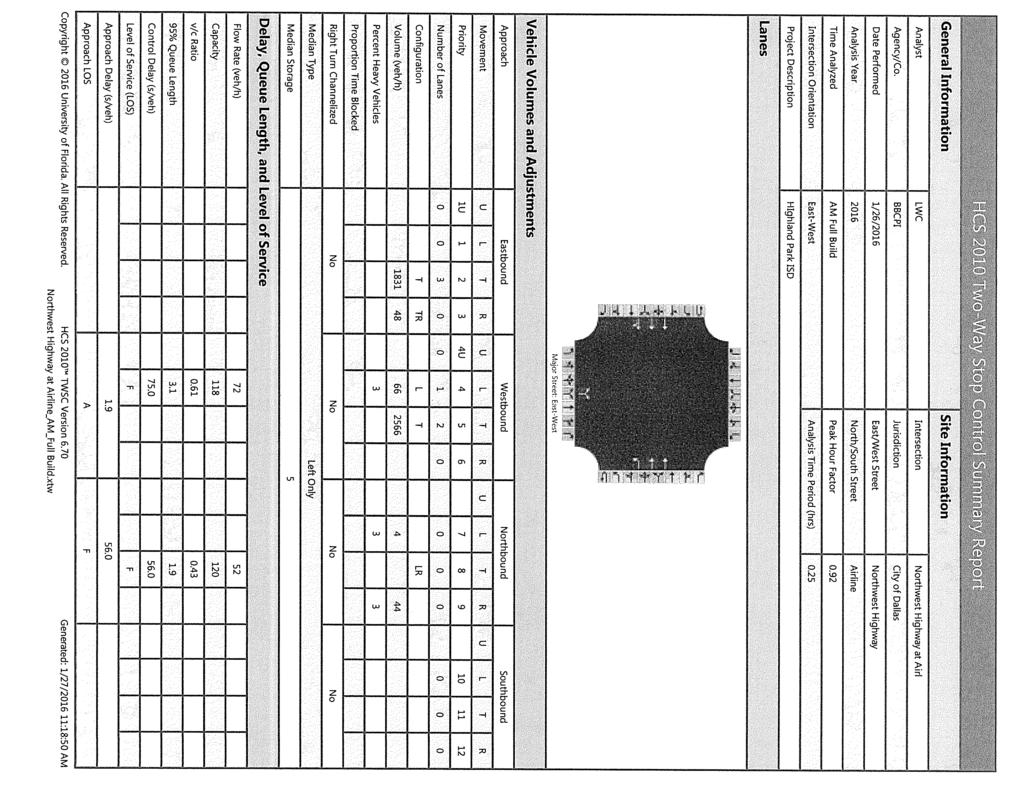
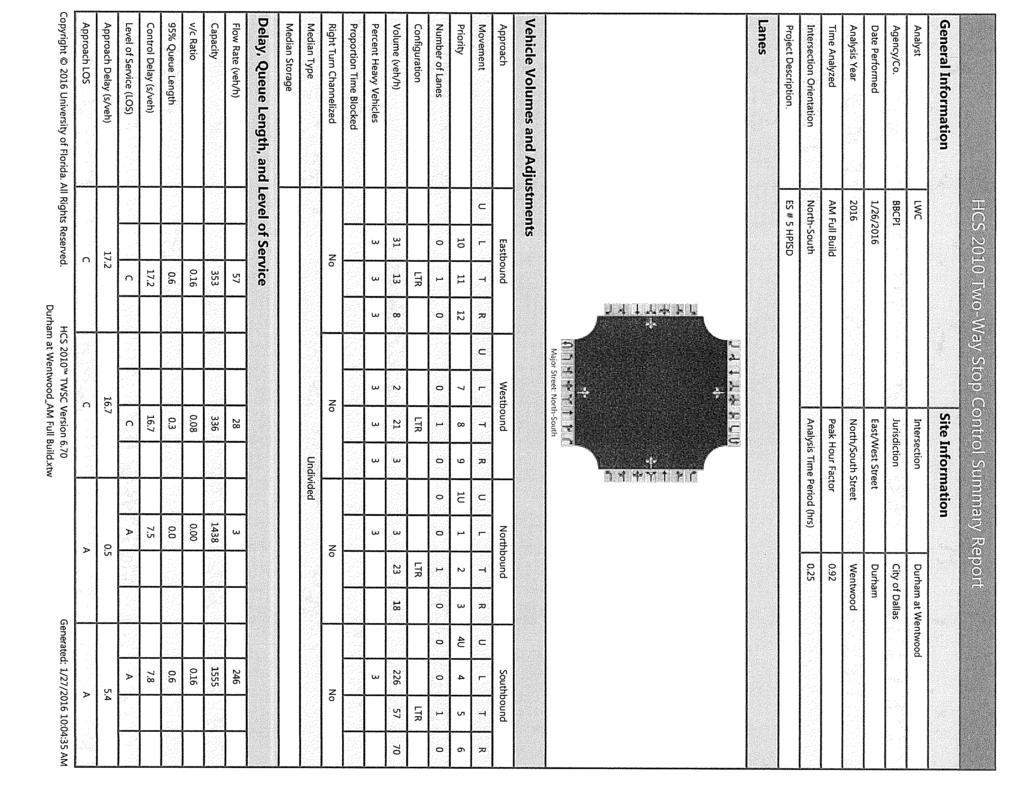
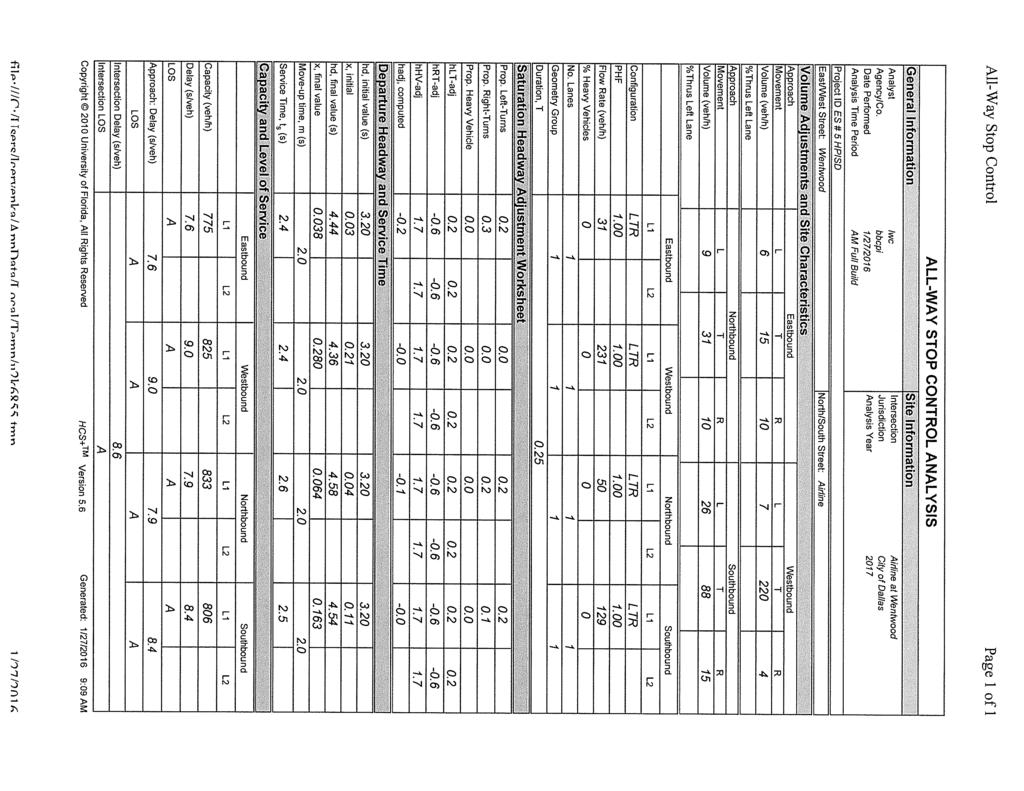
4 INTERSECTION CAPACITY ANALYSIS Level of Service (LOS) analyses of the traffic operations were performed at the existing signalized and signalized (stop controlled) intersections and the proposed access points. Analyses of the signalized and stop controlled intersections were conducted utilizing the SYNCHRO software which was developed by the Trafficware Corporation. Analyses of the roundabouts were conducted with the 2010 HCS Software. The results of the capacity analyses for the intersections with the resulting delay and levels of service values are summarized by approach in following tables as follows: Table 4. AM Peak Hour Level of Service Table 5. PM Peak Hour Level of Service Copies of the computer printouts as well as a description of the various levels of service have been included in the Appendix. Typically the desirable levels of service are "A" through "D" with "E" and "F" being undesirable. For each analysis, the signal timings for any existing or proposed signalized intersections were optimized. Table 1. AM Peak Hour Level of Service Scenario Existing 2015 Build Out 2017 Existing 2015 Build Out 2017 Existing 2015 Build Out 2017 Existing 2015 Phase Existing 2015 Phase Eastbound Westbound Northbound Southbound LT TH RT LT TH RT LT TH RT LT TH RT Northwest Highway at Hillcrest B D E E D C F E E E Northwest Highway at Airline - A D A E Northwest Highway at Durham A A C E A A C E Durham at Wentwood A B A A B B A A Airline at Wentwood A A A A A A A A A A The LOS for the northbound approaches of Airline and Durham at Northwest Highway is very poor for existing and full build out conditions. The intersection of Northwest Highway at Airline is negatively affected by school traffic going through to turn right onto Durham. The traffic flows Page 3 INT
5 on Airline are very small, but there are some left turning vehicles that impact the overall Airline LOS. School traffic is not expected to use Airline. It would be suggested that northbound left turns be prohibited during peak hours. Traffic desiring to travel westbound would be better served by traveling west on Wentwood Drive and then turn right onto Hillcrest Avenue where they can enter the left turn lane onto Northwest Highway. The LOS for the intersection of Northwest Highway and Hillcrest Avenue is very poor for all periods. The traffic added by school traffic is a low percentage compared to the current traffic on all approaches so no mitigations are recommended. The LOS for the intersection of Northwest Highway at Durham for the northbound movements do not change. The impact of school traffic is minimized because all of the school traffic is turning right (eastbound) onto Durham. Northbound left turns should be prohibited during peak hours. This traffic can also use Wentwood to travel westbound Table 2. PM Peak Hour Level of Service Scenario Existing 2015 Build Out 2017 Existing 2015 Build Out 2017 Existing 2015 Build Out 2017 Existing 2015 Phase Existing 2015 Phase Eastbound Westbound Northbound Southbound LT TH RT LT TH RT LT TH RT LT TH RT Northwest Highway at Hillcrest F E E E F F E F E F Northwest Highway at Airline - A F A F Northwest Highway at Durham A A F C A A F C Durham at Wentwood B A A A B B A A Airline at Wentwood A A A A A A A A A A The LOS is better than the AM LOS, but the same issues are present. The school traffic impact is the same, but school traffic will not impact the northbound movements. The northbound left turns should be prohibited during peak hours. INT Page 4
6 The LOS for the intersection of Northwest Highway and Hillcrest Avenue is very poor for all periods. The traffic added by school traffic is a low percentage compared to the current traffic on all approaches so no mitigations are recommended. QUEUING ANALYSIS A key issue is the prevention of internal queuing (on school site) onto adjacent city streets of buses and passenger cars QUEUING ANALYSIS A key issue is the prevention of internal queuing (on school site) onto adjacent city streets of buses and passenger cars. Following is a discussion of the potential queuing. QUEUE CALCULATIONS The afternoon pick-up operations create the largest queues around the campus. Utilizing a queue estimator developed by the North Carolina Department of Transportation estimates were made about the future queues associated with the enrollment and pick-up times for the proposed Elementary School. See Table 3 for a summary of those estimates. It is estimated that approximately 770 children (Kindergarten through 4 th grade) will attend the proposed school. The arrival and dismissal times are normally staggered to allow one arrival/dismissal for Kindergarten and 1 st graders, and then another arrival/dismissal for second, third and fourth graders. Assuming that the number of children is equal per each grade (5 grades), the number of students for each grade is 154 students. The two arrival/dismissal number of students is indicated in Table 3. Table 3. Minimum Queue Length Calculations Grades & Release Times Kindergarten and 1 st 2 nd, 3 rd, and 4 3:15 Number of Students Total Vehicles Calculated Minimum Queue Length (ft.) * *School Traffic Calculator form North Carolina State University Queuing The probability of queuing for any site is dependent on the arrival service rate (number of units arriving during a time period) and the departure service rates (the number of units that can be served during the same time period). Observations at other Highland Park ISD schools and at schools in other school districts indicates that the average service rate for discharging/loading a vehicle in a school speed zone is 5 seconds per vehicle with active participation by teachers, student safety patrol, or volunteers in opening and closing car doors for students. This allows 12 vehicles per minute to Page 5
7 be served by each assistant (station). The discharge/loading time extends to up to 20 seconds per vehicle without a school crossing guard or other volunteers. The storage length in the loading/unloading lane in front of the entrance to the parking garage accessible from Durham Street is 250 feet. The queue lane (discharge/loading lane) will provide enough pavement width for cars to load/discharge and then allow vehicles that have completed their operation to enter a lane available for moving traffic. The storage length of 250 feet could easily allow 10 loading/discharge stations with a minimum of 22 feet per station. This many stations would allow for discharge of up to 120 vehicles per minute. The estimate minimum queue length is 35 vehicles. With a discharge rate of 12 vehicles per second, even one assistant (station) would allow this queue to be completely discharged in 3 minutes. TRANSPORTATION MANAGEMENT PLAN Passenger Car/Day Care Bus Management Plan Traffic will enter the site through access to a school drive (queue lane) that parallels Durham Street. This traffic will then exit the drive and turn left or right onto Durham Street. The exit will be wide enough to provide a two lane exit. Teachers/administers/volunteers with possible assistance by school safety patrol (4 th graders), should be used to open car doors and allow student (s) to exit/enter the vehicles quickly and safely. Once the student (s) are discharged/loaded, the driver would be notified and then the driver would exit the drop off/pick up zone and travel to Durham Road to turn left or right. ADA Bus Management Plan ADA capable buses will load/unload along a specifically designed parking area along Durham Street adjacent to the school. It is suggested that since this area allows children to load/unload off street, it is suggested that the ADA buses not flash their lights during the loading/unloading process because this would require passing vehicles to stop. This could create unnecessary southbound vehicle queues. Pedestrian (Walking) Management Plan The need for school crossing guards will be determined after a review of student enrollment records. Key locations to be analyzed would include Wentwood at Airline and Wentwood at Durham. A follow up analysis after school has been open for approximately six (6) weeks should be made to determine if any school crossing guards are needed. School Administrators, with assistance from the City of Dallas Transportation Department shall develop a Safe Routes to School Map/Plan and distribute this to teacher, students and parents. Miscellaneous instructions: Students should have all their belongings in hand so that they may exit or enter their vehicle safely and quickly. Vehicles must face the direction of traffic. Page 6
8 It is unlawful to open a car door on the traffic side. Administrators/teachers/safety patrol personnel should wear orange reflective safety vests when assisting loading/unloading. Children should wait in an orderly fashion in the designated waiting area when loading passenger vehicles, school buses, or day care buses. Cars/day care buses should enter the loading/unloading queue lane on Durham Street and enter behind the last car in the queue lane. Cars/day care buses should continually pull forward until their children are either loaded/ or discharged. If cars/day care buses cannot enter the queue lane, driver around the school to re-enter the queue lane. These cars could stage along Northwest Parkway and await an opportunity to enter the queue lane. Once children or loaded or discharged, cars/day care buses must exit at Durham Street by either turning left or right. Institutional goals/tasks The need for school crossing guards should be determined based on actual pedestrian counts. And an analysis should be conducted after school has been open for about six (6) weeks to determine if a school crossing guard is needed. Parking must be prohibited along Durham Street in the vicinity of the school driveways during school hours. RECOMMENDATIONS: Prohibit left turns onto Northwest Highway at Airline and Durham during the AM and PM peak hours. Prohibit westbound left turns on Northwest Highway onto Airline and Durham during school hours. Traffic exiting the school driveway onto Durham must turn right only. Suggest traffic exiting the site to travel along Wentwood to then turn left or right onto Hillcrest Avenue to use the traffic signal at Northwest Highway and Hillcrest Avenue. Alternatively, suggest that school traffic should travel south on Durham and then turn onto Hillcrest Avenue at Centenary to turn right onto Hillcrest Avenue. Traffic desiring to travel south of Hillcrest should travel along Durham to Caruth and then turn left onto Hillcrest to take advantage of a traffic signal. Page 7
9 APPENDIX Concept/Site Plan... 1 Page Aerial of Site... 1 Page Traffic Figures... 4 Pages ITE Trip Generation Sheets... 3 Pages SYNCHRO Output Sheets... 8 Pages HCS Output Sheets Pages TRAFFIC COUNTS Pages Page 8
10 APPENDIX Concept/Site Plan... 1 Page Aerial of Site... 1 Page Traffic Figures... 4 Pages ITE Trip Generation Sheets... 3 Pages SYNCHRO Output Sheets... 8 Pages HCS Output Sheets Pages TRAFFIC COUNTS Pages Page 8
11

12 Copyright NCTCOG Proposed ES # 5 DFWMaps.com DISCLAIMER This data has been compiled for NCTCOG. Various official and unofficial sources were used to gather this information. Every effort was made to ensure the accuracy of this data, however, no guarantee is given or implied as to the accuracy of said data.
13 ELEMENTARY SCHOOL #5 EXISTING TRAFFIC Scale: Job No.: N/A Date: FEBRUARY 2016 BC Dwg. File: FIGURE Gateway Blvd. Suite 101 Richardson, Texas Fax
14 ELEMENTARY SCHOOL #5 TRIP DISTRIBUTION Scale: Job No.: N/A Date: FEBRUARY 2016 BC Dwg. File: FIGURE Gateway Blvd. Suite 101 Richardson, Texas Fax
15 ELEMENTARY SCHOOL #5 TRIPS Scale: Job No.: N/A Date: FEBRUARY 2016 BC Dwg. File: FIGURE Gateway Blvd. Suite 101 Richardson, Texas Fax

16 ELEMENTARY SCHOOL #5 TOTAL TRAFFIC Scale: Job No.: N/A Date: FEBRUARY 2016 BC Dwg. File: FIGURE Gateway Blvd. Suite 101 Richardson, Texas Fax
17
18
19
20 Highland Park ISD AM Peak 1: Hillcrest & Northwest Highway Existing Lane Group EBL EBT EBR WBL WBT WBR NBL NBT NBR SBL SBT SBR Lane Configurations Traffic Volume (vph) Future Volume (vph) Satd. Flow (prot) Flt Permitted Satd. Flow (perm) Satd. Flow (RTOR) Lane Group Flow (vph) Turn Type D.P+P NA D.P+P NA D.P+P NA D.P+P NA Protected Phases Permitted Phases Total Split (s) Total Lost Time (s) Act Effct Green (s) Actuated g/c Ratio v/c Ratio Control Delay Queue Delay Total Delay LOS E B B D D E F D Approach Delay Approach LOS B D E E Queue Length 50th (ft) ~ Queue Length 95th (ft) # # # Internal Link Dist (ft) Turn Bay Length (ft) Base Capacity (vph) Starvation Cap Reductn Spillback Cap Reductn Storage Cap Reductn Reduced v/c Ratio Intersection Summary Cycle Length: 150 Actuated Cycle Length: 150 Control Type: Actuated-Uncoordinated Maximum v/c Ratio: 1.02 Intersection Signal Delay: 45.7 Intersection Capacity Utilization 96.7% Analysis Period (min) 15 ~ Volume exceeds capacity, queue is theoretically infinite. Queue shown is maximum after two cycles. # 95th percentile volume exceeds capacity, queue may be longer. Queue shown is maximum after two cycles. Intersection LOS: D ICU Level of Service F Splits and Phases: 1: Hillcrest & Northwest Highway LWC 2/24/2016 Synchro 9 Report
21 Highland Park ISD AM Peak 1: Hillcrest & Northwest Highway Existing Movement EBL EBT EBR WBL WBT WBR NBL NBT NBR SBL SBT SBR Lane Configurations Traffic Volume (veh/h) Future Volume (veh/h) Number Initial Q (Qb), veh Ped-Bike Adj(A_pbT) Parking Bus, Adj Adj Sat Flow, veh/h/ln Adj Flow Rate, veh/h Adj No. of Lanes Peak Hour Factor Percent Heavy Veh, % Cap, veh/h Arrive On Green Sat Flow, veh/h Grp Volume(v), veh/h Grp Sat Flow(s),veh/h/ln Q Serve(g_s), s Cycle Q Clear(g_c), s Prop In Lane Lane Grp Cap(c), veh/h V/C Ratio(X) Avail Cap(c_a), veh/h HCM Platoon Ratio Upstream Filter(I) Uniform Delay (d), s/veh Incr Delay (d2), s/veh Initial Q Delay(d3),s/veh %ile BackOfQ(50%),veh/ln LnGrp Delay(d),s/veh LnGrp LOS E B B B D F D E E E E E Approach Vol, veh/h Approach Delay, s/veh Approach LOS B D E E Timer Assigned Phs Phs Duration (G+Y+Rc), s Change Period (Y+Rc), s Max Green Setting (Gmax), s Max Q Clear Time (g_c+i1), s Green Ext Time (p_c), s Intersection Summary HCM 2010 Ctrl Delay 44.9 HCM 2010 LOS D LWC 2/24/2016 Synchro 9 Report
22 Highland Park ISD AM Peak 1: Hillcrest & Northwest Highway Full Build Lane Group EBL EBT EBR WBL WBT WBR NBL NBT NBR SBL SBT SBR Lane Configurations Traffic Volume (vph) Future Volume (vph) Satd. Flow (prot) Flt Permitted Satd. Flow (perm) Satd. Flow (RTOR) Lane Group Flow (vph) Turn Type D.P+P NA D.P+P NA D.P+P NA D.P+P NA Protected Phases Permitted Phases Total Split (s) Total Lost Time (s) Act Effct Green (s) Actuated g/c Ratio v/c Ratio Control Delay Queue Delay Total Delay LOS E B B F D F F D Approach Delay Approach LOS C F E E Queue Length 50th (ft) ~ ~ Queue Length 95th (ft) # # #337 # Internal Link Dist (ft) Turn Bay Length (ft) Base Capacity (vph) Starvation Cap Reductn Spillback Cap Reductn Storage Cap Reductn Reduced v/c Ratio Intersection Summary Cycle Length: 140 Actuated Cycle Length: 140 Control Type: Actuated-Uncoordinated Maximum v/c Ratio: 1.11 Intersection Signal Delay: 66.7 Intersection Capacity Utilization 104.5% Analysis Period (min) 15 ~ Volume exceeds capacity, queue is theoretically infinite. Queue shown is maximum after two cycles. # 95th percentile volume exceeds capacity, queue may be longer. Queue shown is maximum after two cycles. Intersection LOS: E ICU Level of Service G Splits and Phases: 1: Hillcrest & Northwest Highway LWC 2/24/2016 Synchro 9 Report
23 Highland Park ISD AM Peak 1: Hillcrest & Northwest Highway Full Build Movement EBL EBT EBR WBL WBT WBR NBL NBT NBR SBL SBT SBR Lane Configurations Traffic Volume (veh/h) Future Volume (veh/h) Number Initial Q (Qb), veh Ped-Bike Adj(A_pbT) Parking Bus, Adj Adj Sat Flow, veh/h/ln Adj Flow Rate, veh/h Adj No. of Lanes Peak Hour Factor Percent Heavy Veh, % Cap, veh/h Arrive On Green Sat Flow, veh/h Grp Volume(v), veh/h Grp Sat Flow(s),veh/h/ln Q Serve(g_s), s Cycle Q Clear(g_c), s Prop In Lane Lane Grp Cap(c), veh/h V/C Ratio(X) Avail Cap(c_a), veh/h HCM Platoon Ratio Upstream Filter(I) Uniform Delay (d), s/veh Incr Delay (d2), s/veh Initial Q Delay(d3),s/veh %ile BackOfQ(50%),veh/ln LnGrp Delay(d),s/veh LnGrp LOS E B B B F F D F F F D E Approach Vol, veh/h Approach Delay, s/veh Approach LOS C E F E Timer Assigned Phs Phs Duration (G+Y+Rc), s Change Period (Y+Rc), s Max Green Setting (Gmax), s Max Q Clear Time (g_c+i1), s Green Ext Time (p_c), s Intersection Summary HCM 2010 Ctrl Delay 66.6 HCM 2010 LOS E LWC 2/24/2016 Synchro 9 Report
24 Highland Park ISD PM Peak 1: Hillcrest & Northwest Highway Existing Lane Group EBL EBT EBR WBL WBT WBR NBL NBT NBR SBL SBT SBR Lane Configurations Traffic Volume (vph) Future Volume (vph) Satd. Flow (prot) Flt Permitted Satd. Flow (perm) Satd. Flow (RTOR) Lane Group Flow (vph) Turn Type D.P+P NA D.P+P NA D.P+P NA D.P+P NA Protected Phases Permitted Phases Total Split (s) Total Lost Time (s) Act Effct Green (s) Actuated g/c Ratio v/c Ratio Control Delay Queue Delay Total Delay LOS F F D E C F F D Approach Delay Approach LOS F E E E Queue Length 50th (ft) 183 ~ ~ ~ Queue Length 95th (ft) #363 #1197 #84 # #456 # Internal Link Dist (ft) Turn Bay Length (ft) Base Capacity (vph) Starvation Cap Reductn Spillback Cap Reductn Storage Cap Reductn Reduced v/c Ratio Intersection Summary Cycle Length: 150 Actuated Cycle Length: 150 Control Type: Actuated-Uncoordinated Maximum v/c Ratio: 1.12 Intersection Signal Delay: 85.3 Intersection Capacity Utilization 105.3% Analysis Period (min) 15 ~ Volume exceeds capacity, queue is theoretically infinite. Queue shown is maximum after two cycles. # 95th percentile volume exceeds capacity, queue may be longer. Queue shown is maximum after two cycles. Intersection LOS: F ICU Level of Service G Splits and Phases: 1: Hillcrest & Northwest Highway LWC 2/24/2016 Synchro 9 Report
25 Highland Park ISD PM Peak 1: Hillcrest & Northwest Highway Existing Movement EBL EBT EBR WBL WBT WBR NBL NBT NBR SBL SBT SBR Lane Configurations Traffic Volume (veh/h) Future Volume (veh/h) Number Initial Q (Qb), veh Ped-Bike Adj(A_pbT) Parking Bus, Adj Adj Sat Flow, veh/h/ln Adj Flow Rate, veh/h Adj No. of Lanes Peak Hour Factor Percent Heavy Veh, % Cap, veh/h Arrive On Green Sat Flow, veh/h Grp Volume(v), veh/h Grp Sat Flow(s),veh/h/ln Q Serve(g_s), s Cycle Q Clear(g_c), s Prop In Lane Lane Grp Cap(c), veh/h V/C Ratio(X) Avail Cap(c_a), veh/h HCM Platoon Ratio Upstream Filter(I) Uniform Delay (d), s/veh Incr Delay (d2), s/veh Initial Q Delay(d3),s/veh %ile BackOfQ(50%),veh/ln LnGrp Delay(d),s/veh LnGrp LOS F F F D F F C F F F D D Approach Vol, veh/h Approach Delay, s/veh Approach LOS F E F E Timer Assigned Phs Phs Duration (G+Y+Rc), s Change Period (Y+Rc), s Max Green Setting (Gmax), s Max Q Clear Time (g_c+i1), s Green Ext Time (p_c), s Intersection Summary HCM 2010 Ctrl Delay 84.9 HCM 2010 LOS F LWC 2/24/2016 Synchro 9 Report
26 Highland Park ISD PM Peak 1: Hillcrest & Northwest Highway Full Build Lane Group EBL EBT EBR WBL WBT WBR NBL NBT NBR SBL SBT SBR Lane Configurations Traffic Volume (vph) Future Volume (vph) Satd. Flow (prot) Flt Permitted Satd. Flow (perm) Satd. Flow (RTOR) Lane Group Flow (vph) Turn Type D.P+P NA D.P+P NA D.P+P NA D.P+P NA Protected Phases Permitted Phases Total Split (s) Total Lost Time (s) Act Effct Green (s) Actuated g/c Ratio v/c Ratio Control Delay Queue Delay Total Delay LOS F F D F C F F D Approach Delay Approach LOS F F F E Queue Length 50th (ft) 169 ~ ~ ~346 ~ Queue Length 95th (ft) #350 #1171 #74 # #476 # Internal Link Dist (ft) Turn Bay Length (ft) Base Capacity (vph) Starvation Cap Reductn Spillback Cap Reductn Storage Cap Reductn Reduced v/c Ratio Intersection Summary Cycle Length: 140 Actuated Cycle Length: 140 Control Type: Actuated-Uncoordinated Maximum v/c Ratio: 1.15 Intersection Signal Delay: 89.9 Intersection Capacity Utilization 108.3% Analysis Period (min) 15 ~ Volume exceeds capacity, queue is theoretically infinite. Queue shown is maximum after two cycles. # 95th percentile volume exceeds capacity, queue may be longer. Queue shown is maximum after two cycles. Intersection LOS: F ICU Level of Service G Splits and Phases: 1: Hillcrest & Northwest Highway LWC 2/24/2016 Synchro 9 Report
27 Highland Park ISD PM Peak 1: Hillcrest & Northwest Highway Full Build Movement EBL EBT EBR WBL WBT WBR NBL NBT NBR SBL SBT SBR Lane Configurations Traffic Volume (veh/h) Future Volume (veh/h) Number Initial Q (Qb), veh Ped-Bike Adj(A_pbT) Parking Bus, Adj Adj Sat Flow, veh/h/ln Adj Flow Rate, veh/h Adj No. of Lanes Peak Hour Factor Percent Heavy Veh, % Cap, veh/h Arrive On Green Sat Flow, veh/h Grp Volume(v), veh/h Grp Sat Flow(s),veh/h/ln Q Serve(g_s), s Cycle Q Clear(g_c), s Prop In Lane Lane Grp Cap(c), veh/h V/C Ratio(X) Avail Cap(c_a), veh/h HCM Platoon Ratio Upstream Filter(I) Uniform Delay (d), s/veh Incr Delay (d2), s/veh Initial Q Delay(d3),s/veh %ile BackOfQ(50%),veh/ln LnGrp Delay(d),s/veh LnGrp LOS F F F D F F C F F F D D Approach Vol, veh/h Approach Delay, s/veh Approach LOS F F F F Timer Assigned Phs Phs Duration (G+Y+Rc), s Change Period (Y+Rc), s Max Green Setting (Gmax), s Max Q Clear Time (g_c+i1), s Green Ext Time (p_c), s Intersection Summary HCM 2010 Ctrl Delay 94.8 HCM 2010 LOS F LWC 2/24/2016 Synchro 9 Report
28
29
30
31
32
33
34
35
36
37
38

39
40

41
42
43
44 All-Way Stop Control Page 1 of 1 General Information Analyst lwc Agency/Co. bbcpi Date Performed 1/27/2016 Analysis Time Period AM Full Build Project ID ES # 5 HPISD East/West Street: Wentwood ALL-WAY STOP CONTROL ANALYSIS Site Information Intersection Airline at Wentwood Jurisdiction City of Dallas Analysis Year 2017 North/South Street: Airline Volume Adjustments and Site Characteristics Approach Eastbound Westbound Movement L T R L T R Volume (veh/h) %Thrus Left Lane Approach Northbound Southbound Movement L T R L T R Volume (veh/h) %Thrus Left Lane Eastbound Westbound Northbound Southbound L1 L2 L1 L2 L1 L2 L1 L2 Configuration LTR LTR LTR LTR PHF Flow Rate (veh/h) % Heavy Vehicles No. Lanes Geometry Group Duration, T 0.25 Saturation Headway Adjustment Worksheet Prop. Left-Turns Prop. Right-Turns Prop. Heavy Vehicle hlt-adj hrt-adj hhv-adj hadj, computed Departure Headway and Service Time hd, initial value (s) x, initial hd, final value (s) x, final value Move-up time, m (s) Service Time, t s (s) Capacity and Level of Service Eastbound Westbound Northbound Southbound L1 L2 L1 L2 L1 L2 L1 L2 Capacity (veh/h) Delay (s/veh) LOS A A A A Approach: Delay (s/veh) LOS A A A A Intersection Delay (s/veh) 8.3 Intersection LOS A Copyright 2010 University of Florida, All Rights Reserved HCS+ TM Version 5.6 Generated: 2/24/2016 8:26 AM file:///c:/users/lcervenka/appdata/local/temp/u2k475d.tmp You created this PDF from an application that is not licensed to print to novapdf printer ( 2/24/2016
45 HCS 2010 Two-Way Stop Control Summary Report General Information Site Information Analyst LWC Intersection Durham at Wentwood Agency/Co. BBCPI Jurisdiction City of Dallas Date Performed 1/26/2016 East/West Street Durham Analysis Year 2016 North/South Street Wentwood Time Analyzed AM Full Build Peak Hour Factor 0.92 Intersection Orientation North-South Analysis Time Period (hrs) 0.25 Project Description ES # 5 HPISD Lanes Major Street: North-South Vehicle Volumes and Adjustments Approach Eastbound Westbound Northbound Southbound Movement U L T R U L T R U L T R U L T R Priority U U Number of Lanes Configuration LTR LTR LTR LTR Volume (veh/h) Percent Heavy Vehicles Proportion Time Blocked Right Turn Channelized No No No No Median Type Undivided Median Storage Delay, Queue Length, and Level of Service Flow Rate (veh/h) Capacity v/c Ratio % Queue Length Control Delay (s/veh) Level of Service (LOS) B B A A Approach Delay (s/veh) Approach LOS B B A A Copyright 2016 University of Florida. All Rights Reserved. HCS 2010 TWSC Version 6.70 Generated: 2/24/2016 7:49:51 AM Durham at Wentwood_AM Full Build.xtw You created this PDF from an application that is not licensed to print to novapdf printer (
46 HCS 2010 Two-Way Stop Control Summary Report General Information Site Information Analyst LWC Intersection Northwest Highway at Airl Agency/Co. BBCPI Jurisdiction City of Dallas Date Performed 1/26/2016 East/West Street Northwest Highway Analysis Year 2016 North/South Street Airline Time Analyzed AM Full Build Peak Hour Factor 0.92 Intersection Orientation East-West Analysis Time Period (hrs) 0.25 Project Description HIghland Park ISD Lanes Major Street: East-West Vehicle Volumes and Adjustments Approach Eastbound Westbound Northbound Southbound Movement U L T R U L T R U L T R U L T R Priority 1U U Number of Lanes Configuration T TR L T LR Volume (veh/h) Percent Heavy Vehicles Proportion Time Blocked Right Turn Channelized No No No No Median Type Left Only Median Storage 5 Delay, Queue Length, and Level of Service Flow Rate (veh/h) Capacity v/c Ratio % Queue Length Control Delay (s/veh) Level of Service (LOS) F E Approach Delay (s/veh) Approach LOS A E Copyright 2016 University of Florida. All Rights Reserved. HCS 2010 TWSC Version 6.70 Generated: 2/24/2016 7:46:37 AM Northwest Highway at Airline_AM_Full Build.xtw You created this PDF from an application that is not licensed to print to novapdf printer (
47 HCS 2010 Two-Way Stop Control Summary Report General Information Site Information Analyst LWC Intersection Northwest Hw at Durham Agency/Co. BBCPI Jurisdiction City of Dallas Date Performed 1/26/2016 East/West Street Northwest Highway Analysis Year 2001 North/South Street Durham Time Analyzed AM Full Build Peak Hour Factor 0.92 Intersection Orientation East-West Analysis Time Period (hrs) 0.25 Project Description HIghland Park ISD Lanes Major Street: East-West Vehicle Volumes and Adjustments Approach Eastbound Westbound Northbound Southbound Movement U L T R U L T R U L T R U L T R Priority 1U U Number of Lanes Configuration L T TR L T TR LTR LTR Volume (veh/h) Percent Heavy Vehicles Proportion Time Blocked Right Turn Channelized No No No No Median Type Left Only Median Storage 5 Delay, Queue Length, and Level of Service Flow Rate (veh/h) Capacity v/c Ratio % Queue Length Control Delay (s/veh) Level of Service (LOS) F F C E Approach Delay (s/veh) Approach LOS A A C E Copyright 2016 University of Florida. All Rights Reserved. HCS 2010 TWSC Version 6.70 Generated: 2/24/2016 7:48:29 AM Northwest Highway at Durham_AM_Full Build.xtw You created this PDF from an application that is not licensed to print to novapdf printer (
48 All-Way Stop Control Page 1 of 1 General Information Analyst lwc Agency/Co. bbcpi Date Performed 1/27/2016 Analysis Time Period PM Full Build Project ID ES # 5 HPISD East/West Street: Wentwood ALL-WAY STOP CONTROL ANALYSIS Site Information Intersection Airline at Wentwood Jurisdiction City of Dallas Analysis Year 2017 North/South Street: Airline Volume Adjustments and Site Characteristics Approach Eastbound Westbound Movement L T R L T R Volume (veh/h) %Thrus Left Lane Approach Northbound Southbound Movement L T R L T R Volume (veh/h) %Thrus Left Lane Eastbound Westbound Northbound Southbound L1 L2 L1 L2 L1 L2 L1 L2 Configuration LTR LTR LTR LTR PHF Flow Rate (veh/h) % Heavy Vehicles No. Lanes Geometry Group Duration, T 0.25 Saturation Headway Adjustment Worksheet Prop. Left-Turns Prop. Right-Turns Prop. Heavy Vehicle hlt-adj hrt-adj hhv-adj hadj, computed Departure Headway and Service Time hd, initial value (s) x, initial hd, final value (s) x, final value Move-up time, m (s) Service Time, t s (s) Capacity and Level of Service Eastbound Westbound Northbound Southbound L1 L2 L1 L2 L1 L2 L1 L2 Capacity (veh/h) Delay (s/veh) LOS A A A A Approach: Delay (s/veh) LOS A A A A Intersection Delay (s/veh) 7.7 Intersection LOS A Copyright 2010 University of Florida, All Rights Reserved HCS+ TM Version 5.6 Generated: 2/24/2016 7:54 AM file:///c:/users/lcervenka/appdata/local/temp/u2k6472.tmp You created this PDF from an application that is not licensed to print to novapdf printer ( 2/24/2016
49 HCS 2010 Two-Way Stop Control Summary Report General Information Site Information Analyst LWC Intersection Durham at Wentwood Agency/Co. BBCPI Jurisdiction City of Dallas Date Performed 1/26/2016 East/West Street Durham Analysis Year 2017 North/South Street Wentwood Time Analyzed PM Full Build Peak Hour Factor 0.92 Intersection Orientation North-South Analysis Time Period (hrs) 0.25 Project Description ES # 5 HPISD Lanes Major Street: North-South Vehicle Volumes and Adjustments Approach Eastbound Westbound Northbound Southbound Movement U L T R U L T R U L T R U L T R Priority U U Number of Lanes Configuration LTR LTR LTR LTR Volume (veh/h) Percent Heavy Vehicles Proportion Time Blocked Right Turn Channelized No No No No Median Type Undivided Median Storage Delay, Queue Length, and Level of Service Flow Rate (veh/h) Capacity v/c Ratio % Queue Length Control Delay (s/veh) Level of Service (LOS) B B A A Approach Delay (s/veh) Approach LOS B B A A Copyright 2016 University of Florida. All Rights Reserved. HCS 2010 TWSC Version 6.70 Generated: 2/24/2016 7:58:01 AM Durham at Wentwood_PM Full Build.xtw You created this PDF from an application that is not licensed to print to novapdf printer (
50 HCS 2010 Two-Way Stop Control Summary Report General Information Site Information Analyst LWC Intersection Northwest Highway at Airl Agency/Co. BBCPI Jurisdiction City of Dallas Date Performed 1/26/2016 East/West Street Northwest Highway Analysis Year 2016 North/South Street Airline Time Analyzed PM Full Build Peak Hour Factor 0.92 Intersection Orientation East-West Analysis Time Period (hrs) 0.25 Project Description HIghland Park ISD Lanes Major Street: East-West Vehicle Volumes and Adjustments Approach Eastbound Westbound Northbound Southbound Movement U L T R U L T R U L T R U L T R Priority 1U U Number of Lanes Configuration T TR L T LR Volume (veh/h) Percent Heavy Vehicles Proportion Time Blocked Right Turn Channelized No No No No Median Type Left Only Median Storage 5 Delay, Queue Length, and Level of Service Flow Rate (veh/h) Capacity v/c Ratio % Queue Length Control Delay (s/veh) Level of Service (LOS) F F Approach Delay (s/veh) Approach LOS A F Copyright 2016 University of Florida. All Rights Reserved. HCS 2010 TWSC Version 6.70 Generated: 2/24/2016 7:55:49 AM Northwest Highway at Airline_PM_Full Build.xtw You created this PDF from an application that is not licensed to print to novapdf printer (

51 HCS 2010 Two-Way Stop Control Summary Report General Information Site Information Analyst LWC Intersection Northwest Highway at Durh Agency/Co. BBCPI Jurisdiction City of Dallas Date Performed 1/26/2016 East/West Street Northwest Highway Analysis Year 2017 North/South Street Durham Time Analyzed PM Full Build Peak Hour Factor 0.92 Intersection Orientation East-West Analysis Time Period (hrs) 0.25 Project Description HIghland Park ISD Lanes Major Street: East-West Vehicle Volumes and Adjustments Approach Eastbound Westbound Northbound Southbound Movement U L T R U L T R U L T R U L T R Priority 1U U Number of Lanes Configuration L T TR L T TR LTR LTR Volume (veh/h) Percent Heavy Vehicles Proportion Time Blocked Right Turn Channelized No No No No Median Type Left Only Median Storage 5 Delay, Queue Length, and Level of Service Flow Rate (veh/h) Capacity v/c Ratio % Queue Length Control Delay (s/veh) Level of Service (LOS) C F F C Approach Delay (s/veh) Approach LOS A A F C Copyright 2016 University of Florida. All Rights Reserved. HCS 2010 TWSC Version 6.70 Generated: 2/24/2016 7:56:45 AM Northwest Highway at Durham_PM_Full build.xtw You created this PDF from an application that is not licensed to print to novapdf printer (
52
53
54
55
56
57
58 GRAM Traffic North Texas, Inc W. Lovers Lane Arlington, TX File Name : NORTHWEST AIRLINE RD Site Code : 62 Start Date : 5/12/2015 Page No : 1 Groups Printed- Unshifted AIRLINE RD Southbound NORTHWEST HWY Westbound AIRLINE RD Northbound NORTHWEST HWY Eastbound Start Time Left Thru Right U-Turns App. Total Left Thru Right U-Turns App. Total Left Thru Right U-Turns App. Total Left Thru Right U-Turns App. Total Int. Total 07: : : : Total : : : : Total : : : : Total : : : : Total Grand Total Apprch % Total % AIRLINE RD Southbound NORTHWEST HWY Westbound AIRLINE RD Northbound NORTHWEST HWY Eastbound Start Time Left Thru Right U-Turns App. Total Left Thru Right U-Turns App. Total Left Thru Right U-Turns App. Total Left Thru Right U-Turns App. Total Int. Total Peak Hour Analysis From 07:00 to 11:45 - Peak 1 of 1 Peak Hour for Entire Intersection Begins at 07:45 07: : : : Total Volume % App. Total PHF
TRAFFIC IMPACT STUDY
 TRAFFIC IMPACT STUDY TERRE HAUTE CONVENTION CENTER WABASH AVENUE & 9 TH STREET TERRE HAUTE, INDIANA PREPARED FOR 8365 Keystone Crossing, Suite 201 Indianapolis, IN 46240 Phone: (317) 202-0864 Fax: (317)
WEBER ROAD RESIDENTIAL DEVELOPMENT Single Family Residential Project
 WEBER ROAD RESIDENTIAL DEVELOPMENT Single Family Residential Project WEBER ROAD RESIDENTIAL DEVELOPMENT TRAFFIC IMPACT STUDY TABLE OF CONTENTS 1.0 Executive Summary Page 2.0 Introduction 2.1 DEVELOPMENT
Per your request and authorization, we have prepared this traffic evaluation for the above referenced project.
 Memorandum To: From: Re: Marc Stout, P.E. City Engineer, City of Roseville Chris Gregerson, P.E., T.E. Matt Weir, P.E., T.E., PTOE Douglas Boulevard Coffee Kiosk Traffic Evaluation Roseville, California
The Highline Development Traffic Impact Study
 The Highline Development Traffic Impact Study Columbia Falls, Montana Prepared For: TD&H Engineering 450 Corporate Drive, Suite 101 Kalispell, MT 59901 June, 2018 130 South Howie Street Helena, Montana
TRAFFIC IMPACT STUDY MANUFACTURING COMPANY
 TRAFFIC IMPACT STUDY For MANUFACTURING COMPANY Prepared For: Airway Heights, WA Prepared By: SUNBURST ENGINEERING, P. S. 4310 S. Ball Dr. Veradale, WA 99037 April, 2013 TRAFFIC IMP ACT STUDY Manufacturing
JEP John E. Jack Pflum, P.E. Consulting Engineering 7541 Hosbrook Road, Cincinnati, OH Telephone:
 JEP John E. Jack Pflum, P.E. Consulting Engineering 7541 Hosbrook Road, Cincinnati, OH 45243 Email: jackpflum1@gmail.com Telephone: 513.919.7814 MEMORANDUM REPORT Traffic Impact Analysis Proposed Soccer
Market Street PDP. Nassau County, Florida. Transportation Impact Analysis. VHB/Vanasse Hangen Brustlin, Inc. Nassau County Growth Management
 Transportation Impact Analysis Market Street PDP Nassau County, Florida Submitted to Nassau County Growth Management Prepared for TerraPointe Services, Inc. Prepared by VHB/Vanasse Hangen Brustlin, Inc.
April 10, Mr. Curt Van De Walle, City Manager City of Castle Hills 209 Lemonwood Drive Castle Hills, Texas 78213
 Mr. Curt Van De Walle, City Manager City of Castle Hills 209 Lemonwood Drive Castle Hills, Texas 78213 Subject: Revised Castle Hills BASIS Charter School Traffic Impact Analysis Review City of Castle Hills,
MEMORANDUM. The study area of the analysis was discussed with City staff and includes the following intersections:
 MEMORANDUM DATE: JULY 6, 2012 TO: FROM: RE: CC: MELANIE KNIGHT BRAD BYVELDS/ JENNIFER LUONG 1050 SOMERSET STREET PRELIMINARY TRAFFIC ANALYSIS OUR FILE NO. 111152 NEIL MALHOTRA The purpose of this memo
TRANSPORTATION IMPACT STUDY WHEELER STREET CLOSURE
 TRANSPORTATION IMPACT STUDY WHEELER STREET CLOSURE Village of Greene, Chenango County, New York Prepared for: VILLAGE OF GREENE 49 Genesee Street Greene, NY 13778 Prepared by: LARSON DESIGN GROUP 1000
TRAFFIC IMPACT STUDY. Platte Canyon Villas Arapahoe County, Colorado (Arapahoe County Case Number: Z16-001) For
 For") TRAFFIC IMPACT STUDY For Platte Canyon Villas Arapahoe County, Colorado (Arapahoe County Case Number: Z16-001) February 2015 Revised: August 2015 April 2016 July 2016 September 2016 Prepared for: KB Home
TRAFFIC IMPACT STUDY For Platte Canyon Villas Arapahoe County, Colorado (Arapahoe County Case Number: Z16-001) February 2015 Revised: August 2015 April 2016 July 2016 September 2016 Prepared for: KB Home
LIC SR INTERCHANGE OPERATIONS STUDY
 LIC SR 16 18.20 - INTERCHANGE OPERATIONS STUDY Project Summary Location SR 16 & W. Church St. Interchange Newark, Ohio Licking County PID 99478 Study Sponsor ODOT District 5 Proposed Work Add Left Turn
HALFF 16196? TRAFFIC MANAGEMENT PLAN. Richardson ISD Aikin Elementary School Dallas, Texas North Bowser Road Richardson, Texas 75081
 30280 16196? TRAFFIC MANAGEMENT PLAN Exhibit 572B Aikin Elementary School Planned Development District No. 572 Approved City Plan Commission October20, 2016 July 12, 2016 Prepared for HALFF AVO 31586 PHO1
APPENDIX. Sutter Street Bicycle Lanes Stockton, CA January 2010
 APPENDIX reet Bicycle Lanes Stockton, CA January 2010 1. Traffic count locations 2. Turning movement counts o AM PEAK - El Dorado Street at Ingram Street o PM PEAK - El Dorado Street at Ingram Street o
NATHAN HALE HIGH SCHOOL PARKING AND TRAFFIC ANALYSIS. Table of Contents
 Parking and Traffic Analysis Seattle, WA Prepared for: URS Corporation 1501 4th Avenue, Suite 1400 Seattle, WA 98101-1616 Prepared by: Mirai Transportation Planning & Engineering 11410 NE 122nd Way, Suite
Table of Contents Introduction... 4 Study Area... 5
 Table of Contents Introduction... 4 Study Area... 5 Streets and s... 5 Traffic Volumes... 8 Recent and Anticipated Development... 10 Crash Analysis... 10 Projected Traffic Volumes... 11 Trip Generation...
KAISER SOUTH NORTHERN VIRGINIA HUB TRAFFIC IMPACT STUDY PRINCE WILLIAM COUNTY, VIRGINIA TABLE OF CONTENTS. Section 2 BACKGROUND INFORMATION 12
 KAISER SOUTH NORTHERN VIRGINIA HUB TRAFFIC IMPACT STUDY PRINCE WILLIAM COUNTY, VIRGINIA TABLE OF CONTENTS Page EXECUTIVE SUMMARY 1 Purpose of Report and Study Objectives... 1 Site Location and Study Area...
CVS Derwood. Local Area Transportation Review
 CVS Derwood Montgomery County, Maryland May 27, 2016 Local Area Transportation Review Prepared for: JC Bar Properties, Inc. Steve Fleming, PE 415 Fallowfield Road, Suite 301 Camp Hill, Pennsylvania 17011
Traffic Impact Study
 Traffic Impact Study Statham DRI One University Parkway Prepared for: Barrow County Prepared by: October 2012 Table of Contents Executive Summary i Section 1. Introduction 1 Project Description 1 Methodology
CHAPTER 3. CAPACITY OF SIGNALIZED INTERSECTIONS
 CHAPTER 3. CAPACITY OF SIGNALIZED INTERSECTIONS 1. Overview In this chapter we explore the models on which the HCM capacity analysis method for signalized intersections are based. While the method has
Critchfield Rd / SR-129
 NOVEMBER 27, 2017 Critchfield Rd / SR-129 Intersection Safety Study Alternatives Report CRITCHFIELD INTERSECTION SAFETY STUDY Contents Introduction...1 Purpose...2 Existing Conditions...2 Proposed Alternatives...2
SUBJECT: SUMMARY OF FINDINGS. October 29, Mr. Carter Redish Carter Group Architects, Inc S. El Camino Real, Suite F San Clemente, CA 92672
 October 29, 2018 Mr. Carter Redish Carter Group Architects, Inc. 1810 S. El Camino Real, Suite F San Clemente, CA 92672 SUBJECT: CANYON STEEL FOCUSED TRAFFIC IMPACT ANALYSIS Dear Mr. Carter Redish: Urban
FINAL Traffic Report for the Proposed Golden Valley Road and Newhall Ranch Road Projects in the City of Santa Clarita, California May 5, 2005
 FINAL Traffic Report for the Proposed Golden Valley Road and Newhall Ranch Road Projects in the City of Santa Clarita, California May 5, 2005 Prepared For: EDAW, Inc. 1420 Kettner Boulevard, Suite 620
CE351 Transportation Systems: Planning and Design
 CE351 Transportation Systems: Planning and Design TOPIC: Level of Service (LOS) at Traffic Signals 1 Course Outline Introduction to Transportation Highway Users and their Performance Geometric Design Pavement
Prepared for. 3D/International, Inc West Loop South, Suite 400 Houston, Texas November 2006
 DRAFT TRAFFIC IMPACT STUDY FOR PHASED DEVELOPMENT OF TAMU CC Prepared for 3D/International, Inc. 1900 West Loop South, Suite 400 Houston, Texas 77027 November 2006 Interim Review Only Document Incomplete:
6711 LEE HIGHWAY TRAFFIC IMPACT STUDY ARLINGTON, VIRGINIA
 6711 TRAFFIC IMPACT STUDY ARLINGTON, VIRGINIA Prepared for: NVR, Inc. Prepared by: Wells + Associates, Inc. Michael J. Workosky, PTP, TOPS, TSOS John J. Andrus William L. Zeid, PE 703.917.6620 May 4, 2017
TRAFFIC IMPACT STUDY FOR SOUTH BAY SALT POND RESTORATION PROJECT PHASE 2
 APPENDIX G TRAFFIC IMPACT STUDY FOR SOUTH BAY SALT POND RESTORATION PROJECT PHASE 2 South Bay Salt Pond Restoration Project Phase II May 2015 Draft Environmental Impact Statement/Report Traffic Impact
Focused Traffic Analysis for the One Lincoln Park Project
 September 15, 2015 Mr. Bill Johnson Coldwell Banker 511 Sir Francis Drake Boulevard Greenbrae, CA 94904 Focused Traffic Analysis for the One Lincoln Park Project Dear Mr. Johnson; As requested, W-Trans
Signalized Intersections
 Signalized Intersections Kelly Pitera October 23, 2009 Topics to be Covered Introduction/Definitions D/D/1 Queueing Phasing and Timing Plan Level of Service (LOS) Signal Optimization Conflicting Operational
Travel Demand Management Plan
 Travel Demand Management Plan Tryg s & Apartment Building 8 West Lake Street Minneapolis, MN AUTHORIZED PROPERTY REPRESENTATIVE: By Dated: Mr. Johnny Carlson Trammell Crow Chicago Development, Inc. 5 South
Appendix C Traffic Study
 Final Environmental Impact Statement Appendix C Traffic Study Schofield Generating Station Project, Hawaii October 2015 C-1 Final Environmental Impact Statement This page intentionally left blank. Schofield
PLAZA MEXICO RESIDENCES
 PLAZA MEXICO RESIDENCES TRAFFIC STUDY PREPARED FOR: 3000 E. IMPERIAL, LLC. 6940 Beach Boulevard, D-501 Buena Park, California 90621 PREPARED BY: OCTOBER 5, 2017 translutions the transportatio n solutions
US 169/I-70 North Loop Planning & Environmental Linkages Study
 US 169/I-70 North Loop Planning & Environmental Linkages Study VISSIM Calibration Document Draft April 13, 2018 Page i Table of Contents 1. Overview... 1 2. Data Types... 2 3. Model Parameter Adjustments...
DOLLAR GENERAL PROJECT FOCUSED TRAFFIC ANALYSIS (REVISED) May 20, 2015
 May 20, 2015") DOLLAR GENERAL PROJECT FOCUSED TRAFFIC ANALYSIS (REVISED) May 20, 2015 May 20, 2015 Mr. Dan Biswas, VP of Development CJS DEVELOPMENT II, LLC 5111 North Scottsdale Road, Suite 200 Scottsdale, CA 85250
DOLLAR GENERAL PROJECT FOCUSED TRAFFIC ANALYSIS (REVISED) May 20, 2015 May 20, 2015 Mr. Dan Biswas, VP of Development CJS DEVELOPMENT II, LLC 5111 North Scottsdale Road, Suite 200 Scottsdale, CA 85250
Design Priciples of Traffic Signal
 Design Priciples of Traffic Signal Lecture Notes in Transportation Systems Engineering Prof. Tom V. Mathew Contents 1 Overview 1 2 Definitions and notations 2 3 Phase design 3 3.1 Two phase signals.................................
Parking Regulations Dundas Street West, from Bathurst Street to Dovercourt Road
 STAFF REPORT ACTION REQUIRED Parking Regulations Dundas Street West, from Bathurst Street to Dovercourt Road Date: October 28, 2008 To: From: Toronto and East York Community Council Director, Transportation
ALTA VISTA COMMERCIAL/ RESIDENTIAL PROJECT
 ALTA VISTA COMMERCIAL/ RESIDENTIAL PROJECT TRAFFIC IMPACT ANALYSIS Prepared For: Paul Conzelman SC Development 2151 Michelson Drive, Suite 140 Irvine, CA 92612 Prepared By: 2030 Main Street, Suite 1200
1 h. Page 1 of 12 FINAL EXAM FORMULAS. Stopping Sight Distance. (2 ) N st U Where N=sample size s=standard deviation t=z value for confidence level
 N st U Where N=sample size s=standard deviation t=z value for confidence level") Page 1 of 12 FINAL EXAM FORMULAS Stopping Sight Distance 2 2 V V d 1.47Vt 1.075 i f a 2 2 Vi Vf d 1.47Vt 30( f 0.01 G) Where d = distance (ft) V = speed (mph) t = time (sec) a=deceleration rate (ft/sec
Page 1 of 12 FINAL EXAM FORMULAS Stopping Sight Distance 2 2 V V d 1.47Vt 1.075 i f a 2 2 Vi Vf d 1.47Vt 30( f 0.01 G) Where d = distance (ft) V = speed (mph) t = time (sec) a=deceleration rate (ft/sec
TRANSPORTATION AND TRAFFIC ANALYSIS REPORT
 Square One Drive Extension Municipal Class Environmental Assessment Environmental Study Report Appendix B Transportation and Traffic Analysis Report TRANSPORTATION AND TRAFFIC ANALYSIS REPORT FINAL DRAFT
Appendix I: Traffic Study
 City of Fontana Sierra Lakes Commerce Center Draft EIR Appendix I: Traffic Study FirstCarbon Solutions H:\Client (PN JN)\0144\01440050\EIR\1 ADEIR\01440050 Sec99 99 Appendix Dividers.doc THIS PAGE INTENTIONALLY
Subject: Desert Palisades Specific Plan - Tram Way Access Sight Distance
 Endo Engineering Traffic Engineering Air Quality Studies Noise Assessments July 13, 2015 Mr. Ed Freeman Pinnacle View, LLC P.O. Box 1754 Lake Oswego, OR 97035-0579 Subject: Desert Palisades Specific Plan
Signalized Intersection Delay Models
 Chapter 35 Signalized Intersection Delay Models 35.1 Introduction Signalized intersections are the important points or nodes within a system of highways and streets. To describe some measure of effectiveness
MADISON, WI STONE HOUSE DEVELOPMENT 1000 E. WASHINGTON AVENUE REDEVELOPMENT TRANSPORTATION STUDY DECEMBER 14, 2015
 MADISON, WI STONE HOUSE DEVELOPMENT 1000 E. WASHINGTON AVENUE REDEVELOPMENT TRANSPORTATION STUDY DECEMBER 14, 2015 TABLE OF CONTENTS... 3 Proposed Development... 3 Methodology... 3 Phase 1 Development...
Approved Corrections and Changes for the Highway Capacity Manual 2000
 Approved Corrections and Changes for the Highway Capacity Manual 2000 Updated 7/8/2005 Previous update 2/27/2004 TRB Committee AHB40, Highway Capacity and Quality of Service Unless stated otherwise, corrections
Traffic Impact Analysis. for the STARBUCKS STORE. Located at 9900 BALBOA BOULEVARD. Submitted to CITY OF LOS ANGELES. January 2017.
 Traffic Impact Analysis for the STARBUCKS STORE Located at 9900 BALBOA BOULEVARD Submitted to CITY OF LOS ANGELES January 2017 Submitted By January 5, 2017 Ken A. Aitchison, P.E. Transportation Engineering
Appendixx C Travel Demand Model Development and Forecasting Lubbock Outer Route Study June 2014
 Appendix C Travel Demand Model Development and Forecasting Lubbock Outer Route Study June 2014 CONTENTS List of Figures-... 3 List of Tables... 4 Introduction... 1 Application of the Lubbock Travel Demand
Appendix C Final Methods and Assumptions for Forecasting Traffic Volumes
 Fairview Ave. and Main St. Improvements and Local Streets Plan Appendices Ada County Highway District Appendix C Final Methods and Assumptions for Forecasting Traffic Volumes January 3, 207 Appendices
Traffic signal design-ii
 CHAPTER 4. TRAFFIC SIGNAL DESIGN-II NPTEL May 3, 007 Chapter 4 Traffic signal design-ii 4.1 Overview In the previous chapter, a simple design of cycle time was discussed. Here we will discuss how the cycle
MnDOT Method for Calculating Measures of Effectiveness (MOE) From CORSIM Model Output
 From CORSIM Model Output") MnDOT Method for Calculating Measures of Effectiveness (MOE) From CORSIM Model Output Rev. April 29, 2005 MnDOT Method for Calculating Measures of Effectiveness (MOE) From CORSIM Model Output Table of
MnDOT Method for Calculating Measures of Effectiveness (MOE) From CORSIM Model Output Rev. April 29, 2005 MnDOT Method for Calculating Measures of Effectiveness (MOE) From CORSIM Model Output Table of
TRAFFIC STUDY FOR THE GAFFEY POOL PROJECT LOS ANGELES, CALIFORNIA CITY OF LOS ANGELES, BUREAU OF ENGINEERING OCTOBER 2013 PREPARED FOR PREPARED BY
 TRAFFIC STUDY FOR THE GAFFEY POOL PROJECT LOS ANGELES, CALIFORNIA OCTOBER 2013 PREPARED FOR CITY OF LOS ANGELES, BUREAU OF ENGINEERING PREPARED BY DRAFT TRAFFIC STUDY FOR THE GAFFEY POOL PROJECT October
March Grade Crossing Analysis
 March 2014 Grade Crossing Analysis T E C H N I C A L M E M O R A N D U M South Florida Freight and Passenger Rail Enhancement Study Phase 1A - Rehabilitate Existing Northwood Connection; FPID: 434948-1
CHAPTER 2. CAPACITY OF TWO-WAY STOP-CONTROLLED INTERSECTIONS
 CHAPTER 2. CAPACITY OF TWO-WAY STOP-CONTROLLED INTERSECTIONS 1. Overview In this chapter we will explore the models on which the HCM capacity analysis method for two-way stop-controlled (TWSC) intersections
FARM 1065 PORTION 1, ATLANTIS TRAFFIC IMPACT ASSESSMENT
 FARM 1065 PORTION 1, ATLANTIS TRAFFIC IMPACT ASSESSMENT February 2018 FIRST ISSUE Prepared by: JG AFRIKA (PTY) LTD Branch: Cape Town PO Box 38561 Postal code: 7430 Telephone: 021 530 1800 Email: wink@
MEMORANDUM. Trip Generation Analysis
 MEMORANDUM To: RMC Architects From: Matthew Palmer, PE Subject: Trip Generation, Parking Analysis & Level of Service Project: Port of Everett, GTC #13-053 Date: August 25, 2014 The trip generation and
S.170 th Street Micro-Simulation Seattle-Tacoma International Airport Port of Seattle/Aviation Planning
 Seattle-acoma International Airport Port of Seattle/Aviation Planning Port of Seattle PO OF SEAE Aviation Planning Airport Operations January 24, 2013 Summary he Port is planning to relocate the cell phone
Control Delay at Signalized Diamond Interchanges Considering Internal Queue Spillback Paper No
 Publish Information: Xu, H., H. Liu, and Z. Tian (00). Control Delay at Signalized Interchanges Considering Internal Queue Spillback. Journal of Transportation Research Record, No.73, 3 3. Control Delay
Signalized Intersection Delay Models
 Signalized Intersection Delay Models Lecture Notes in Transportation Systems Engineering Prof. Tom V. Mathew Contents 1 Introduction 1 2 Types of delay 2 2.1 Stopped Time Delay................................
PW 001 SNOW REMOVAL AND SANDING FOR ROADWAYS AND SIDEWALKS October 6, 2014 (#223-14) Original October 19, 2015; October 15, 2018 Public Works
 Original October 19, 2015; October 15, 2018 Public Works") Policy Statement: The Village of Kitscoty will provide snow and ice control on municipal streets and sidewalks according to determined priorities. Purpose: To provide direction and information to employees
Policy Statement: The Village of Kitscoty will provide snow and ice control on municipal streets and sidewalks according to determined priorities. Purpose: To provide direction and information to employees
APPENDIX IV MODELLING
 APPENDIX IV MODELLING Kingston Transportation Master Plan Final Report, July 2004 Appendix IV: Modelling i TABLE OF CONTENTS Page 1.0 INTRODUCTION... 1 2.0 OBJECTIVE... 1 3.0 URBAN TRANSPORTATION MODELLING
CHAPTER 5 DELAY ESTIMATION FOR OVERSATURATED SIGNALIZED APPROACHES
 CHAPTER 5 DELAY ESTIMATION FOR OVERSATURATED SIGNALIZED APPROACHES Delay is an important measure of effectiveness in traffic studies, as it presents the direct cost of fuel consumption and indirect cost
A Study of Red Light Cameras in Kansas City, MO
 A Study of Red Light s in Kansas City, MO Prepared by the Special Operations Division Executive Summary This paper will analyze the crash data for the 29 red light cameras located in 17 intersections in
Impact of Day-to-Day Variability of Peak Hour Volumes on Signalized Intersection Performance
 Impact of Day-to-Day Variability of Peak Hour Volumes on Signalized Intersection Performance Bruce Hellinga, PhD, PEng Associate Professor (Corresponding Author) Department of Civil and Environmental Engineering,
1.0 INTRODUCTION AND SUMMARY...
 TABLE OF CONTENTS 1.0 INTRODUCTION AND SUMMARY... 1 1.1 Purpose and Study Objective... 1 1.2 Executive Summary... 1 2.0 ROADWAY CONDITIONS... 5 2.1 Granville Parkway (South Intersection)... 8 2.2 Tuscany
FINAL REPORT. City of Toronto. Contract Project No: B
 City of Toronto SAFETY IMPACTS AND REGULATIONS OF ELECTRONIC STATIC ROADSIDE ADVERTISING SIGNS TECHNICAL MEMORANDUM #2B BEFORE/AFTER COLLISION ANALYSIS AT MID-BLOCK LOCATIONS FINAL REPORT 3027 Harvester
CONTINUING PLANNING PROGRAM LOCAL TRANSPORTATION AND TRAFFIC DATA PRODUCT REPORT [OH Corridors]
![CONTINUING PLANNING PROGRAM LOCAL TRANSPORTATION AND TRAFFIC DATA PRODUCT REPORT [OH Corridors]](/thumbs/94/120123757.jpg "CONTINUING PLANNING PROGRAM LOCAL TRANSPORTATION AND TRAFFIC DATA PRODUCT REPORT [OH Corridors]") CONTINUING PLANNING PROGRAM LOCAL TRANSPORTATION AND TRAFFIC DATA PRODUCT REPORT [OH Corridors] Travel Time and Delay Analysis for Belpre (OH) and Marietta (OH) Fiscal Year 2009 Report WOOD WASHINGTON
CONTINUING PLANNING PROGRAM LOCAL TRANSPORTATION AND TRAFFIC DATA PRODUCT REPORT [OH Corridors] Travel Time and Delay Analysis for Belpre (OH) and Marietta (OH) Fiscal Year 2009 Report WOOD WASHINGTON
Signalized Intersection Delay Models
 Transportation System Engineering 56. Signalized Intersection Delay Models Chapter 56 Signalized Intersection Delay Models 56.1 Introduction Signalized intersections are the important points or nodes within
Automated Delay Estimation at Signalized Intersections: Phase I Concept and Algorithm Development
 Brigham Young University BYU ScholarsArchive All Theses and Dissertations 2011-03-16 Automated Delay Estimation at Signalized Intersections: Phase I Concept and Algorithm Development Taylor R. Forbush
Tahlequah Public Schools Inclement Weather Transportation Plan
 Tahlequah Public Schools Inclement Weather Transportation Plan Inclement Weather with Ice and Snow From time to time throughout the school year, weather may force a change in the District s normal operating
Incorporating the Effects of Traffic Signal Progression Into the Proposed Incremental Queue Accumulation (IQA) Method
 Method") #06-0107 Incorporating the Effects of Traffic Signal Progression Into the Proposed Incremental Queue Accumulation (IQA) Method Dennis W. Strong, President Strong Concepts 1249 Shermer Road, Suite 100 Northbrook,
#06-0107 Incorporating the Effects of Traffic Signal Progression Into the Proposed Incremental Queue Accumulation (IQA) Method Dennis W. Strong, President Strong Concepts 1249 Shermer Road, Suite 100 Northbrook,
OXFORD HEIGHTS SUBDIVISION EMERGENCY EVACUATION PLAN
 OXFORD HEIGHTS SUBDIVISION EMERGENCY EVACUATION PLAN March 27, 2007 Oxford Heights Overview and Historical Conditions Oxford Heights is a medium sized community located on the southern side of Elizabeth
CITY OF NEW LONDON WINTER ROAD & SIDEWALK MAINTENANCE POLICY
 CITY OF NEW LONDON WINTER ROAD & SIDEWALK MAINTENANCE POLICY GENERAL The purpose of this policy is to set up acceptable procedures and policies for the winter maintenance of public areas in the City of
930 Old Northern Rd & 4 Post Office Rd, Glenorie
 Proposed Mixed Use Development 930 Old Northern & 4, Glenorie TRAFFIC AND PARKING ASSESSMENT REPORT 13 December 2016 Ref 16264 Suite 6, 20 Young Street, Neutral Bay NSW 2089 - PO Box 1868, Neutral Bay
Metro Emergency Security Operations Center (ESOC) 410 Center Street City of Los Angeles
 410 Center Street City of Los Angeles") Metro Emergency Security Operations Center (ESOC) 410 Center Street City of Los Angeles Traffic Study August 31, 2015 AECOM 515 South Flower Street, 4 th Floor Los Angeles, CA 90071 Job Number: 60323255
Metro Emergency Security Operations Center (ESOC) 410 Center Street City of Los Angeles Traffic Study August 31, 2015 AECOM 515 South Flower Street, 4 th Floor Los Angeles, CA 90071 Job Number: 60323255
January 12, Mr. Ryan Granger TMGB Wilson, LLC 2221 Health Drive SW, Suite 2200 Wyoming, Michigan 49519
 January 12, 2018 Mr. Ryan Granger TMGB Wilson, LLC 2221 Health Drive SW, Suite 2200 Wyoming, Michigan 49519 Re: Proposed Reserve at Rivertown Mixed-Use Development Updated Trip Generation and Site Driveway
106 PURDUE ENGINEERING EXTENSION DEPARTMENT
 106 PURDUE ENGINEERING EXTENSION DEPARTMENT distribution by stations can best be studied by examining Figs. 3 and 4. Figure 4 shows the frequency distribution between stations, and Fig. 3 shows the actual
COUNCIL POLICY MANUAL
 COUNCIL POLICY MANUAL SECTION: PUBLIC WORKS SUBJECT: SNOW & ICE CONTROL POLICY 2012/2013 GOAL: Pages: 1 of 10 Approval Date: Dec. 3, 2012 Res. # 1001/2012 To annually identify the winter maintenance costs
Brandywine Road Speed Study FINAL REPORT
 Brandywine Road Speed Study FINAL REPORT City of Albuquerque Brandywine Road Speed Study Final Report Albuquerque, New Mexico City of Albuquerque May, 2016 Brandywine Road Speed Study Final Report City
The Sunland Park flyover ramp is set to close the week of March 19 until early summer
 March 2, 2018 The Sunland Park flyover ramp is set to close the week of March 19 until early summer GO 10 is targeting the week of March 19 to close the Sunland Park Drive flyover entrance ramp to I 10
APPENDIX E Notices to Public Summary of Public Information Centres #1 and #2
 APPENDIX E Notices to Public Summary of Public Information Centres #1 and #2 TOWN OF WHITBY NOTICE OF PUBLIC OPEN HOUSE #1 Downtown Brooklin Transportation Study THE STUDY: The Town of Whitby has retained
CHAPTER 3 TRANSPORTATION
 CHAPTER 3 TRANSPORTATION This chapter presents information on transportation impacts of Section 2 of the Project that have changed from those identified in the published Westside Subway Extension Final
US 20 Highway Safety Study
 US 20 Highway Safety Study Corvallis City Limits to Springhill Road, Albany Prepared for Prepared by December 2016 US 20 HIGHWAY SAFETY STUDY FINAL REPORT Benton County, Oregon Prepared for: Oregon Department
Freeway Work Zone Lane Capacity
 Report Title Report Date: 2009 Freeway Work Zone Lane Capacity Principle Investigator Vendor Name and Address Name Drakopoulos, Alex «Vendor» Affiliation Marquette University Address 263 Haggerty Hall
CITY OF ORILLIA POLICY MANUAL. Winter Operations. Table of Contents. WINTER CONTROL Objectives 2. WINTER CONTROL Season 3
 Page 1 of 12 Winter Operations Table of Contents WINTER CONTROL Objectives 2 WINTER CONTROL Season 3 SNOW ACCUMULATION Road Plowing 4,5 ICY ROADWAYS Application of Deicers/Abrasives 6 SNOW ACCUMULATION
Flood Scenario Worksheet
 Flood Scenario Worksheet Scenario adapted from: http://www.epa.gov/watersecurity/tools/trainingcd/simple/source/scenario-8/ssc8-0.pdf Simple Tabletop Exercise, Interdependency Natural Disaster Scenario,
Appendix J: Transportation and Circulation
 Appendix J: Transportation and Circulation J 1: Transportation Analysis Report J 2: Los Angeles Department of Transportation (LADOT) Approval Letter J 3: Construction Traffic Analysis J 1: Transportation
Freeway Work Zone Lane Capacity
 Freeway Work Zone Lane Capacity Thomas Notbohm, P.E. Wisconsin Department of Transportation Thomas.Notbohm@dot.state.wi.us Alex Drakopoulos Department of Civil & Environmental Engineering Marquette University,
VHD Daily Totals. Population 14.5% change. VMT Daily Totals Suffolk 24-hour VMT. 49.3% change. 14.4% change VMT
 6.9 Suffolk 6-54 VMT Population and Travel Characteristics Population 14.5% change 2014 1,529,202 VHD Daily Totals 2014 251,060 49.3% change 2040 1,788,175 2040 374,850 VMT Daily Totals 2014 39,731,990
CITY OF MINOT SNOW REMOVAL PLAN November 2017
 CITY OF MINOT SNOW REMOVAL PLAN November 2017 1.0 GENERAL This plan has been written to provide information regarding snow removal procedures and policies. The plan provides guidance, while maintaining
Parking Analysis. Introduction. School Information. Parking Analysis. September 26, To:
 Parking Analysis To: Mr. Michael Longanecker Richardson Independent School District From: Christy Lambeth, P.E., PTOE Lambeth Engineering Associates, PLLC, F-19508 September 26, 2018 Date: September 26,
Trip Generation Study: A 7-Eleven Gas Station with a Convenience Store Land Use Code: 945
 Trip Generation Study: A 7-Eleven Gas Station with a Convenience Store Land Use Code: 945 Introduction The Brigham Young University Institute of Transportation Engineers student chapter (BYU ITE) completed
City of Brainerd, Minnesota Snowplowing Policy
 City of Brainerd, Minnesota Snowplowing Policy 1. Introduction The city of Brainerd, Minnesota, finds that it is in the best interest of the residents of the city to assume basic responsibility for control
MEMORANDUM (DRAFT) DRAFT
 DRAFT") 117 Commercial St. NE, Suite 310 Salem, OR 97301 503.391.8773 www.dksassociates.com MEMORANDUM (DRAFT) DATE: February 15, 2017 TO: FROM: SUBJECT: Alex Dupey, MIG Scott Mansur, PE, PTOE; Garth Appanaitis,
117 Commercial St. NE, Suite 310 Salem, OR 97301 503.391.8773 www.dksassociates.com MEMORANDUM (DRAFT) DATE: February 15, 2017 TO: FROM: SUBJECT: Alex Dupey, MIG Scott Mansur, PE, PTOE; Garth Appanaitis,
I-10 East at Redd closes for 24 hours this Sunday, Feb 11. Then, I-10 West at Resler closes for 27 hours on Feb 25
 NEWS RELEASE a TxDOT Project For immediate release EL PASO DISTRICT Jennifer Wright (915) 790-4340 Jennifer.Wright3@txdot.gov February 9, 2018 I-10 East at Redd closes for 24 hours this Sunday, Feb 11
Course Outline Introduction to Transportation Highway Users and their Performance Geometric Design Pavement Design
 Course Outline Introduction to Transportation Highway Users and their Performance Geometric Design Pavement Design Speed Studies - Project Traffic Queuing Intersections Level of Service in Highways and
UTILITY REPORT FOR THORNTON SELF STORAGE THORNTON, COLORADO
 UTILITY REPORT FOR THORNTON SELF STORAGE THORNTON, COLORADO Prepared by: Bowman Consulting 63 Park Point Dr. Suite 1 Golden, CO 841 (33)-81-29 June 29, 215 Revised August 14, 215 Revised September 3, 215
Bruce Freeman Rail Trail
 Functional Design Report Bruce Freeman Rail Trail Station Road to Concord Town Line Sudbury, Massachusetts PREPARED FOR Town of Sudbury Planning and Community Development 287 Old Sudbury Road Sudbury,
Traffic flow theory involves the development of mathematical relationships among
 CHAPTER 6 Fundamental Principles of Traffic Flow Traffic flow theory involves the development of mathematical relationships among the primary elements of a traffic stream: flow, density, and speed. These
WOODRUFF ROAD CORRIDOR ORIGIN-DESTINATION ANALYSIS
 2018 WOODRUFF ROAD CORRIDOR ORIGIN-DESTINATION ANALYSIS Introduction Woodruff Road is the main road to and through the commercial area in Greenville, South Carolina. Businesses along the corridor have
Appendix B. Durham Region Travel Demand Model Calibration
 Appendix B Durham Region Travel Demand Model Calibration AECOM 300 Water Street 905 668 9363 tel Whitby, ON, Canada L1N 9J2 905 668 0221 fax www.aecom.com To Ron Albright, Municipality of Clarington Page
Roundabout Level of Service
 Roundabout Level of Service Rahmi Akçelik Director Akcelik & Associates Pty Ltd email: rahmi.akcelik@sidrasolutions.com web: www.sidrasolutions.com 8 January 2009 Contents 1. Introduction... 1 2. Fundamental