Metro Emergency Security Operations Center (ESOC) 410 Center Street City of Los Angeles
|
|
|
- Georgia Lawson
- 6 years ago
- Views:
Transcription
1 Metro Emergency Security Operations Center (ESOC) 410 Center Street City of Los Angeles Traffic Study August 31, 2015 AECOM 515 South Flower Street, 4 th Floor Los Angeles, CA Job Number:
2 Metro Emergency Security Operations Center Traffic Study Table of Contents Executive Summary Introduction Project Description Study Area Baseline and Analysis Scenarios Methodology Data Collection Development Level of Service Methodology Impact Determination Project Trip Characteristics Existing Conditions Intersections Roadway Segments Transit Service Existing Plus Project Conditions Conditions Without Project With Project Conditions Without Project With Project Congestion Management Program Analysis Parking and Access Pedestrian and Bicycle Paths Transit Impact Analysis Conclusion List of References APPENDICES Appendix A-1 Memorandum of Understanding (MOU) Appendix A-2 Existing Traffic Count Data Appendix A-3 Related Projects Appendix A-4 Directive from LADOT Regarding ATSAC / ATCS Appendix A-5 CMA Worksheets August 31, 2015 i
3 Metro Emergency Security Operations Center Traffic Study List of Figures Figure 1: Study Area Intersections... 4 Figure 2: Geometry... 5 Figure 3: Locations of Related Projects... 9 Figure 4: Trips from Related Projects Figure 5: Project Trip Distribution Figure 6: Project Trips Figure 7: Existing Peak Hour s Figure 8: Existing Plus Project Peak Hour s Figure 9: 2017 Without Project Peak Hour s Figure 10: 2017 With Project Peak Hour s Figure 11: 2019 Without Project Peak Hour s Figure 12: 2019 With Project Peak Hour s List of Tables Table 1: Level of Service Definitions for Signalized Intersections Table 2: Significant Transportation Impact - Intersections Table 3: Trip Generation Table 4: Intersection LOS Existing Conditions Table 5: Intersection Impacts Existing plus Project Table 6: Intersection LOS 2017 Without Project Table 7: Intersection Impacts 2017 With Project Table 8: Intersection LOS 2019 Without Project Table 9: Intersection Impacts 2019 With Project August 31, 2015 ii
4 Metro Emergency Security Operations Center Traffic Study Since the commencement of the proposed Project, the project description was updated and some project elements changed. Specifically the building footprint was reduced within the Project site (See Figure 3 in the IS/MND). The updated project description includes building a multi-story 100,000 square foot building within the existing Metro site, with one level of underground parking. Additionally, the name of the Project was changed from Operations Control Center (OCC) to the current Emergency Security Operations Center (ESOC). No other project elements were changed other than the reduction in building footprint and total square footage. EXECUTIVE SUMMARY Metro is proposing to build a new Emergency Security Operations Center (ESOC) of up to 100,000 square feet on an approximately 1.8-acre site, just south of Highway 101 across from the Metro Headquarters Building (Gateway Building). The project is anticipated to start construction in 2017 and open in Operation of the project site would result in an increase of approximately 1,165 daily vehicle trips, 87 AM peak hour trips, and 79 PM peak hour trips. Intersection operations were analyzed using Circular 212 Critical Movement Analysis (CMA) Planning Method per LADOT Traffic Study Policies and Procedures. The results show that all intersections are currently operating at level of service (LOS) D or better and are projected to continue to do so in all study scenarios (Existing plus Project, 2017, and 2019). Based on LADOT impact guidelines, none of the intersections would be considered significantly impacted under any study scenario. Therefore, no mitigation measures are required. August 31,
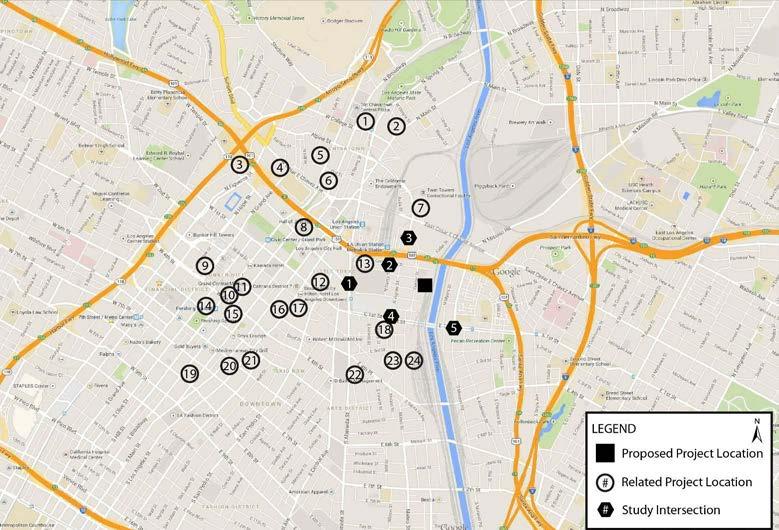
5 Metro Emergency Security Operations Center Traffic Study 1.0 INTRODUCTION This traffic study describes the potential traffic impacts associated with the proposed development of the new Metro Emergency Security Operations Center (ESOC) at 410 Center Street in Los Angeles, CA. A brief description of the project, location, and analysis scenarios are provided in the subsequent sections. 1.1 Project Description The Los Angeles County Metropolitan Transportation Authority (Metro) is proposing to build a new Emergency Security Operations Center (ESOC) in downtown Los Angeles at 410 Center Street just south of US Highway 101 (US 101) between Metro Headquarters (Gateway) Building and Division 20 Red Line Yard & Shops. The project site is bounded by Ducommun Street to the north, Jackson Street to the south, and the Red Line Yard Leads to the east. The new ESOC will serve as a crucial element to Metro s emergency response capabilities and to providing efficient and effective transportation services all within a central location for personnel to command, control, and communicate the latest and developing intelligence. This capability will allow Metro to make real-time decisions that can save lives and mitigate disruptions to transportation services. The ESOC will integrate the Emergency Operations Control (EOC), Rail Operations Control (ROC) and Bus Operations Control (BOC) functions. The existing BOC (located at the Metro Gateway Building) and ROC (located near Willowbrook-Rosa Parks Station) facilities have limited space to accommodate the expansion program, and are heavily taxed in accommodating training, conference, service, and staff office space necessary to provide effective management of bus and rail operations. Furthermore, it is important to develop a central location to house these operations centers to allow centralized communications and coordination, thereby improving business continuity in day-to-day operations, as well as enhancing Metro s disaster and terrorism response capabilities. Metro purchased the 410 Center St. property measuring about 78,000 square feet (1.8 acres) and currently uses it for bus layover operations as well as providing office, conference and training spaces for Los Angeles County Sheriff s Department (LASD). The site is primarily paved and contains a 5,000 square feet two-story building on the northern end of the property to provide office, conference, training and storage space for LASD for terrorism prevention. Construction of the new ESOC facility will require relocation of current bus and LASD operations, demolishing and clearing the existing building structure, and preparing the site as required. The ESOC facility is currently envisioned to be a 3-story building comprising approximately 100,000 square feet of office space and 150 parking spaces. The City of Los Angeles plans and zoning code designate the site for heavy manufacturing, which also allows for office uses. The construction of the project is proposed to begin in 2017 and is expected to be completed in Operation of the project site would result in an increase of approximately 1,165 daily vehicle trips, including 87 AM peak hour trips and 79 PM peak hour trips, determined in accordance with the methodology described in Section 2.0 below. This traffic analysis has been conducted to determine if the increased traffic volumes would result in changes in existing traffic patterns or volumes that would create an impact under Los Angeles Department of Transportation (LADOT) guidelines and the California Environmental Quality Act (CEQA). August 31,
6 Metro Emergency Security Operations Center Traffic Study 1.2 Study Area The project study area was determined in consultation with LADOT via a memorandum of understanding (MOU). The MOU is included in Appendix A-1. The project study area includes the following 5 signalized intersections: 1. Alameda Street & Temple Street 2. Garey Street/ US 101 Southbound Ramps & Commercial Street 3. Vignes Street & Ramirez Street/Patsaouras Plaza 4. Vignes Street & 1 st Street 5. Mission Road & 1 st Street Consistent with LADOT policy, a level of service (LOS) analysis was conducted at the signalized intersections. The development site locations and study intersections are illustrated in Figure 1. Figure 2 displays the existing lane geometry of the study intersections. 1.3 Baseline and Analysis Scenarios The baseline used to analyze impacts of the project is the existing traffic within the project study area. In addition, consistent with LADOT policy, an additional analysis of the impacts of the project is made based upon conditions anticipated to exist in the buildout year. Both dates of the signed MOU construction year (2017) and projected completion date (2019) were used in the analysis and traffic conditions for both years were conducted. This traffic analysis examines transportation and traffic conditions for the following six scenarios: Existing (2014) conditions Existing plus Project conditions Year 2017 Without Project conditions Year 2017 With Project conditions Year 2019 Without Project conditions Year 2019 With Project conditions August 31,
7
8 1 ALAMEDA 2 3 US 101 RAMPS VIGNES TEMPLE COMMERCIAL RAMIREZ GAREY ST ALAMEDA ST & TEMPLE ST GAREY ST/COMMERCIAL ST & US 101 RAMPS VIGNES ST & RAMIREZ ST 4 5 VIGNES MISSION Site Location 1ST ST 1ST ST # Study Intersection AM (PM) Peak Hour VIGNES ST & 1ST ST MISSION RD & 1ST ST
9 Metro Emergency Security Operations Center Traffic Study 2.0 METHODOLOGY This section details the methodologies for data collection, traffic projections, level of service methodology, and impact criteria. 2.1 Data Collection Detailed weekday AM and PM peak period intersection turning movements were obtained to determine existing traffic volumes on a typical weekday throughout the project area. Existing traffic counts for the study area intersections were taken on Wednesday, June 4 th, 2014 during the following peak periods: Weekday AM period: 7:00 AM to 10:00 AM Weekday PM period: 3:00 PM to 6:00 PM Schools in the Los Angeles Unified School District were still in session on the date of the traffic counts. Existing traffic counts are included in Appendix A Development Traffic volume forecasts for the horizon year 2017 and 2019 conditions were developed using an ambient growth factor provided by LADOT of 1 percent per year. This growth rate was applied to the 2014 existing volumes to forecast 2017 and Year 2017 volumes represent three years of growth (3 percent), and 2019 volumes represent five years of growth (5 percent) that were applied to existing volumes. Related Projects In addition to the ambient growth, future planned developments near the project study area will generate additional traffic; therefore, an evaluation of related projects was conducted to capture traffic generated by these projects and determine if there are any significant cumulative traffic impacts. Based on consultation with LADOT, information was obtained on 32 other developments (related projects) within a 2.25-mile radius of the project site for which applications are on file. Of the 32 related projects provided, LADOT determined that only 24 related projects will generate traffic at the study intersections, as the size and locations of the others were not sufficient that traffic from those projects would be expected to reach the study intersections. The 24 projects that will generate trips through study area intersections were included in the analysis: 1. Mixed-use development at the Broadway/College Street intersection. Development will construct 223 condominiums and have 25,000 square feet of retail. Project will generate an additional 155 AM and 184 PM peak hour trips. 2. Residential development at the Main Street/Rondout Street. Development will construction 300 condominiums and will generate an additional 71 AM and 87 PM peak hour trips. 3. Mixed-use development at the Fremont Ave/Temple Street intersection. Development will construct 600 apartments and have 30,000 square feet of retail. Project will generate an additional 361 AM and 503 PM peak hour trips. August 31,
10 Metro Emergency Security Operations Center Traffic Study 4. Mixed-use development at the Cesar Chavez Avenue/Grand Avenue intersection. Development will construct 247 apartments and have 8,000 square feet of retail. Project will generate an additional 69 AM and 120 PM peak hour trips. 5. Residential development at the Yale Street/Ord Street. Development will construction 65 apartments and will generate an additional 34 AM and 40 PM peak hour trips. 6. Mixed-use development at the Broadway/Cesar Chavez Avenue intersection. Development will construct 280 residential units and have 17,000 square feet of retail. Project will generate an additional 152 AM and 247 PM peak hour trips. 7. Metro Bus Maintenance and Operations Facility at the Vignes Street/Cesar Chavez Avenue intersection that will generate an additional 85 AM and 88 PM peak hour trips. 8. Retrofitting of the Hall of Justice Building on Temple Street between Broadway and Spring Street. Project will generate an additional 152 AM and 146 PM peak hour trips. 9. Mixed-use development at the Grand Ave/General Thaddeus Kosciuszko Way intersection. Development will construct 265 apartments and have 5,020 square feet of restaurant uses. Project will generate an additional 1,551 AM and 2,464 PM peak hour trips. 10. Mixed-use development at the Hill Street/3 rd Street intersection. Development will construct 330 condominiums and have 12,000 square feet of retail and restaurant uses. Project will generate an additional 94 AM and 108 PM peak hour trips. 11. Commercial development at the Broadway/2 nd Street intersection. Development will construct 27,765 square feet of retail and restaurant uses. Project will generate an additional -81 AM (due to transit credits) and 70 PM peak hour trips. 12. Mixed-use development on Los Angeles Street between Temple Street and 1 st Street. Development will construct 237,000 to 712,500 square feet of office space, 10,000 to 35,000 square feet of retail, and a 2,500 square foot child care center. Project will generate an additional 1,048 AM and 1,374 PM peak hour trips. 13. Two-acre Bus Maintenance and Inspection Facility at the Commercial Street/Hewitt Street intersection. This project will generate an additional 30 AM and 10 PM peak hour trips. 14. Mixed-use development at the 5 th Street/Olive Street intersection. Development will construct 615 apartments and have 16,309 square feet of restaurant uses. Project will generate an additional 158 AM and 261 PM peak hour trips. 15. Mixed-use development at the Broadway/4 th Street intersection. Development will construct 430 apartments, 10,000 square feet of retail, and a 5,000 square foot bar. Project will generate an additional 183 AM and 212 PM peak hour trips. 16. Mixed-use development on Los Angeles Street between 2 nd and 3 rd Streets. Development will construct 300 condominiums and have 3,400 square feet of retail. Project will generate an additional 224 AM and 126 PM peak hour trips. 17. Mixed-use development at the Los Angeles Street/2 nd Street intersection. Development will construct 280 condominiums and have 13,500 square feet of retail. Project will generate an additional 248 AM and 334 PM peak hour trips. 18. Mixed-use development at the 2 nd Street/Garey Street intersection. Development will construct 320 condominiums and have 18,716 square feet of retail. Project will generate an additional 64 AM and 92 PM peak hour trips. 19. Mixed-use development at the Spring Street/8 th Street intersection. Development will construct 247 condominiums and have 10,675 square feet of retail. Project will generate an additional 90 AM and 140 PM peak hour trips. 20. Mixed-use development at the Main Street/6 th Street intersection. Development will construct 444 apartments and have 32,000 square feet of retail. Project will generate an additional 199 AM and 274 PM peak hour trips. August 31,
11 Metro Emergency Security Operations Center Traffic Study 21. Mixed-use development on Main Street between 5 th and 6 th Streets. Development will construct 160 apartments, 18,000 square feet of retail, 3,500 square feet of restaurant use, and 3,500 square feet of fast-food use. Project will generate an additional 127 AM and 145 PM peak hour trips. 22. Mixed-use development at the Alameda Street/4 th Street intersection. Development will construct 60 apartments and have 3,000 square feet of restaurant use. Project will generate an additional 55 AM and 59 PM peak hour trips. 23. Santa Fe Freight Yard Redevelopment at the 3 rd Street/Santa Fe Avenue intersection. Project will generate an additional 339 AM and 458 PM peak hour trips. 24. Mixed-use development at the Santa Fe Avenue/3 rd Street intersection. Development will construct 420 apartments, 45,000 square feet of retail, 7,500 square feet of high quality restaurant, and 7,500 square feet of fast-food use. Project will generate an additional 208 AM and 229 PM peak hour trips. Figure 3 shows a map of the related projects, corresponding to the numbering above, that generate traffic at the study intersections. Figure 4 illustrates trips from the related projects. The entire list of related projects provided by LADOT is included in Appendix A Level of Service Methodology Intersection Methodology Traffic operations were analyzed using the Transportation Research Board, Circular 212 Critical Movement Analysis (CMA) Planning Method per LADOT Traffic Study Policies and Procedures. CMA is an analysis method that determines the volume to capacity (V/C) ratio on a critical lane basis. A level of service (LOS) is associated with each V/C ratio at a signalized intersection. LADOT s CMA spreadsheet (December 2010 version) was used to implement the CMA methodology in this study. V/C ratios are measured on a scale of 0 to LOS describes the quality of traffic flow and is a measure of such factors as travel speed, travel time and flow interruptions. LOS range from A to F with LOS A representing excellent, free flow conditions and LOS F representing jammed, forced flow conditions. Table 1 provides a description of each LOS and associated V/C ratios. August 31,
12
13 1 123(139) 102(90) 1(2) ALAMEDA 1(3) 37(33) 11(7) (27) 42(41) 11(24) US 101 RAMPS 23(17) 5(2) 22(17) 21(15) 5(4) VIGNES 4(6) 4(3) 25(17) TEMPLE COMMERCIAL RAMIREZ 92(182) 23(30) 17(25) 25(56) 18(42) 34(15) 64(110) 2(1) 2(3) GAREY ST 1(0) 25(51) 2(5) 14(26) 9(28) ALAMEDA ST & TEMPLE ST GAREY ST/COMMERCIAL ST & US 101 RAMPS VIGNES ST & RAMIREZ ST 4 42(44) 2(32) 19(31) VIGNES 37(32) 85(103) 0(17) 5 8(16) MISSION 56(92) Site Location 28(55) 77(110) 13(28) 1ST ST 22(22) 26(8) 18(6) 14(11) 74(75) 29(41) 31(41) 1ST ST # Study Intersection AM (PM) Peak Hour VIGNES ST & 1ST ST MISSION RD & 1ST ST
14 Metro Emergency Security Operations Center Traffic Study Table 1: Level of Service Definitions for Signalized Intersections Level of Service /Capacity Ratio A B C D E F Greater than Definition EXCELLENT. No vehicle waits longer than one red light and no approach phase is fully used. VERY GOOD. An occasional approach phase is fully utilized; many drivers begin to feel somewhat restricted within groups of vehicles. GOOD. Occasionally, drivers may have to wait through more than one red light; backups may develop behind turning vehicles. FAIR. Delays may be substantial during portions of the rush hours, but enough lower volume periods occur to permit clearing of developing lines, preventing excessive backups. POOR. Represents the most vehicles that intersection approaches can accommodate; may be long lines of waiting vehicles through several signal cycles. FAILURE. Backups from nearby intersections or on cross streets may restrict or prevent movement of vehicles out of the intersection approaches. Tremendous delays with continuously increasing queue lengths. Source: Transportation Research Board, Interim Materials on Highway Capacity, Transportation Circular No. 212, All of the five study intersections are signalized and currently controlled by the City s Automated Traffic Surveillance and Control (ATSAC) system. The CMA spreadsheet provided by LADOT applies a capacity increase of 7% to reflect the benefits of ATSAC. Per LADOT direction in September 2013, for analysis of future years of 2016 or later, it was assumed that all signalized intersections will be upgraded to the City s Adaptive Traffic Control System (ATCS). The CMA spreadsheet applies a total capacity increase of 10% to reflect the additional benefits of ATCS. A copy of an directive from LADOT regarding the use of capacity increases for ATSAC and ATCS is included in Appendix A Impact Determination Intersection Impact Determination Within the City of Los Angeles, a transportation impact at a signalized intersection shall be deemed significant in accordance with the criteria in Table 2. Table 2: Significant Transportation Impact - Intersections Level of Service Final V/C Ratio Project-Related Increase in V/C C > Equal to or greater than D > Equal to or greater than E > Equal to or greater than F Greater than Equal to or greater than Source: LADOT Traffic Study Policies and Procedures, August 2014 August 31,
15 Metro Emergency Security Operations Center Traffic Study 3.0 PROJECT TRIP CHARACTERISTICS This section summarizes the development of project trips based on a three-step process that involves trip generation, trip distribution, and trip assignment. Project Trip Generation The ESOC facility is currently envisioned to be a 3-story building comprising approximately 100,000 square feet of office space. Trip generation rates from Trip Generation, 9 th Edition (Institute of Transportation Engineers [ITE], 2012) were used to develop trip generation estimates for the proposed project, as shown in Table 3. As described below, transit credit adjustments and existing land use credits were deducted from the trip generation. According to the data submitted to AQMD, Metro employees currently use transit for 37 percent of work trips to all divisions. The share to Gateway Plaza is even higher. The proposed site is just over onequarter of a mile from Union Station, and less than one-half mile from the Little Tokyo LRT station. It is also well served by the DASH D line. Therefore, a 25 percent transit trip credit was applied to the trip generation. The existing land use at the project site is a bus depot and a Sheriff s station. This traffic analysis compares existing conditions to project conditions and therefore only the net new trips will result in an impact to the study area intersections. Traffic counts for the existing land uses were conducted on April 22, 2014 and used to determine the active land use credits incorporated into the trip generation estimate provided in Table 3. As shown in Table 3, the project will generate 87 new weekday AM peak hour trips (all inbound trips) and 79 new weekday PM peak hour trips (all outbound trips). Project Trip Distribution Trip distribution represents the paths that traffic will use to travel to and from a project site. Trip distribution is dependent upon the land use characteristics of a project and the general locations of other land uses at which project trips would originate or terminate. Since the majority of project trips during the peak hours will be employee trips, project trip distribution was based on the location of the project site in relation to freeway access points (US 101 Southbound ramps at Commercial Street and 4 th Street; US 101 Northbound ramps at Vignes Street/Ramirez Street and 1 st Street; and I-5 Northbound and Southbound ramps at Mission Road) and other major commuter routes. The selected intersections are along the routes most traffic would travel to get to and from the project site. Traffic will access the project from the Jackson Street and Ducommun Street driveways. Figure 5 illustrates the trip distribution patterns for the project site. Project Trip Assignment Trip assignment is the product of the project trip generation and the trip distribution percentages at each intersection. The final result of the trip assignment process is a full accounting of project trips, by direction and turning movement at the study intersections. Figure 6 illustrates the assignment of project trips through the study area intersections. August 31,
16 Metro Emergency Security Operations Center Traffic Study Land Use Table 3: Trip Generation Size Daily Trips AM Peak Hour Trips PM Peak Hour Trips ksf Rate Rate In Out Rate In Out Emergency Security Operations Center , Transit Credit (25%) Net Trips Existing Land Use Credit* Net New Trips** Based on ITE Trip Generation, 9th Edition, rates for Single Tenant Office Building (Code: 715) * Existing active Land Use credit is based on the actual driveway counts conducted on 4/22/2014 ** Peak hour total net new trips do not equal net trips minus credit for existing land uses because the net negative outbound trips in the AM peak hour and the net negative inbound trips in the PM peak hour are capped at zero. August 31,
17 1 ALAMEDA (10%) % 10% US 101 RAMPS (10%) VIGNES (20%) TEMPLE COMMERCIAL RAMIREZ 10% GAREY ST (10%) 20% ALAMEDA ST & TEMPLE ST GAREY ST/COMMERCIAL ST & US 101 RAMPS VIGNES ST & RAMIREZ ST 4 (20%) (30%) VIGNES 30% 5 15% MISSION 15% Site Location 20% 1ST ST (15%) (15%) 1ST ST # Study Intersection AM Inbound (PM)(Outbound) Peak Hour VIGNES ST & 1ST ST MISSION RD & 1ST ST
18 1 ALAMEDA 0(8) 2 3 9(0) 9(0) US 101 RAMPS 0(8) VIGNES 0(17) TEMPLE COMMERCIAL RAMIREZ 9(0) GAREY ST 0(8) 17(0) ALAMEDA ST & TEMPLE ST GAREY ST/COMMERCIAL ST & US 101 RAMPS VIGNES ST & RAMIREZ ST 4 0(16) 0(24) VIGNES 26(0) 5 13(0) MISSION 13(0) Site Location 17(0) 1ST ST 0(12) 0(12) 1ST ST # Study Intersection AM (PM) Peak Hour VIGNES ST & 1ST ST MISSION RD & 1ST ST
19 Metro Emergency Security Operations Center Traffic Study 4.0 EXISTING CONDITIONS This section documents the existing (2014) traffic conditions within the project study area. Specifically, this section focuses on the study intersections that could be affected by operation of the project. 4.1 Intersections The existing peak-hour turning movement volumes at the study intersections for the weekday AM and PM peak hours are illustrated in Figure 7. Table 4 provides the existing LOS for the five study area intersections. Table 4 indicates that all five study intersections operate at LOS C or better under existing conditions. The traffic analysis CMA worksheets for existing conditions are provided in Appendix A-5. Table 4: Intersection LOS Existing Conditions Control AM PEAK HOUR PM PEAK HOUR INTERSECTION Type V/C LOS V/C LOS 1 Alameda St & Temple St Signal A A 2 Garey St/Commercial St & US 101 SB Ramps Signal A A 3 Vignes St & Ramirez St Signal A B 4 Vignes St & 1st St Signal A A 5 Mission Rd & 1st St Signal C B V/C = volume/capacity 4.2 Roadway Segments Major roadway facilities within the project study area are described below. The discussion presented here focuses on roadways that are approaches to the study intersections or provide direct access to the project site. Alameda Street: Alameda Street is a north-south major highway (Class II). It varies between two and three lanes in each direction with a speed limit of 35 miles per hour within the study area. Alameda Street provides access to the El Monte Busway, to the west side of Union Station, and to northbound US 101. Vignes Street: Vignes Street is a north-south collector and is intersected within the study area by US 101. South of US 101, Vignes Street has one lane in each direction with metered parking on both sides of the street. Continuing north from the northbound US 101/ Vignes Street on- and off-ramps, Vignes Street connects to the east side of Union Station at Patsaouras Transit Plaza. North of Union Station, Vignes Street has two lanes in each direction with a 35 mile per hour speed limit. Garey Street: Garey Street is a north-south collector and connects to the US 101 Southbound on- and off-ramps at Commercial Street at its northern terminus. It has one lane in each direction with metered parking on both sides of the street. Mission Road: Mission Road is a north-south major highway (Class II). North of 1 st Street, Mission Road has two lanes in each direction with parking on both sides of the street and a 35 August 31,
20 Metro Emergency Security Operations Center Traffic Study mile per hour speed limit. South of 1 st Street, Mission Road has one lane in each direction with parking on both sides of the roadway with 25 miles per hour speed limit. Mission Road provides access to I-5. Temple Street: Temple Street runs east-west and is classified as a major highway (Class II) west of Alameda Street with two lanes in each direction. Metered parking exists along both sides of the street with a speed limit of 35 miles per hour. East of Alameda Street, Temple Street is classified as a secondary highway and has only one lane in each direction. Center Street: Center Street runs north-south and is classified as a major highway (Class II). It has one lane in each direction south of Commercial Street with no parking. North of Commercial Street, Center Street crosses under US 101 where it connects with Ramirez Street before connecting into Vignes Street and Union Station at Patsaouras Transit Plaza. 1 st Street: 1 st Street runs east-west and is classified as a major highway (Class II) west of Mission Road. East of Alameda Street, the Metro Gold Line runs within the median of 1 st Street and has two travel lanes in each direction with no parking available. This roadway has a speed limit of 30 miles per hour. East of Mission Road, 1 st Street is classified as secondary highway with the Metro Gold Line dividing the roadway with one lane in each direction. Commercial Street: Commercial Street is an east-west collector. It has two travel lanes in each direction with no on-street parking. This roadway primarily handles the traffic going to and from southbound US 101. Ramirez Street: Ramirez Street is classified as a major highway (Class II) as it connects with Center Street near Union Station. This 500-foot segment has two southbound lanes and three northbound lanes as it approaches the Vignes Street at Union Station. There is no parking along this segment. At the southern end of this segment, Ramirez Street continues to the east for 500 feet and is a minor roadway with one lane in each direction and parking on both sides of the street. August 31,
21 1 356(291) 852(712) 20(71) ALAMEDA 18(56) 162(155) 13(18) (183) 50(23) 167(93) US 101 RAMPS 80(319) 55(62) 5(3) 326(195) 112(147) 334(229) VIGNES 255(482) 163(153) 64(128) TEMPLE COMMERCIAL RAMIREZ 83(247) 233(428) 137(286) 163(447) 169(145) 212(72) 599(986) 39(58) 21(10) GAREY ST 10(4) 46(231) 5(11) 67(62) 71(56) 67(65) 133(407) 71(35) ALAMEDA ST & TEMPLE ST GAREY ST/COMMERCIAL ST & US 101 RAMPS VIGNES ST & RAMIREZ ST 4 25(22) 26(30) 23(43) VIGNES 125(31) 724(279) 144(53) 5 480(156) 131(95) 94(73) MISSION 124(97) 506(194) 9(1) Site Location 44(61) 178(813) 9(15) 1ST ST 5(6) 30(34) 29(129) 103(520) 115(474) 14(10) 1ST ST 11(18) 68(183) 4(4) # Study Intersection AM (PM) Peak Hour VIGNES ST & 1ST ST MISSION RD & 1ST ST
22 Metro Emergency Security Operations Center Traffic Study 4.3 Transit Service LADOT and Metro operate several transit lines throughout the study area due it its proximity to Union Station. Union Station is the region s primary transit hub and provides regional connections via the Metro bus and rail lines, Metrolink commuter rail, Amtrak long-stance rail, and numerous municipal carriers and specialty shuttles that connect into downtown Los Angeles. The Patsaouras Transit Plaza is the primary passenger bus facility at Union Station and is utilized by numerous Metro bus routes. The only ingress and egress location to the plaza is accessed through study intersection #3 (Vignes Street/Ramirez Street). Metro bus routes 33, 40, 442, 485, 699, 701, 704, 728, 733, and 745 have stops at the Patsaouras Transit Plaza as well as the LADOT Dash route D and Commuter Express Union Station/Bunker Hill Shuttle Route. The Dodger Stadium Express also uses the plaza to shuttle passengers between Union Station and Dodger Stadium on home game days, but only operates in the PM peak period on those days. LADOT operates DASH service in the study area. DASH route D traverses most of the study area utilizing Temple Street, Vignes Street, Commercial Street, Center Street, and Ramirez Street before connecting into Patsaouras Transit Plaza. DASH route A travels on 1 st Street west of Hewitt Street within the study area, then travels north-south on Hewitt Street. Descriptions of the transit services along the major roadways in the project study area are provided below: Alameda Street: Metro bus route 40 operates on Alameda Street north of Temple Street with buses arriving every minutes in the peak period. Every other route 40 bus terminates at Broadway and Washington without continuing onto Union Station. Buses that continue to Union Station have stops on the west side of Union Station at the Alameda Street/Arcadia Street intersection and on the east side of Union Station within Patsaouras Transit Plaza. Temple Street: Metro route 30/330 and DASH route D operate on Temple Street. Metro route 30/330 arrives every 5-7 minutes in the peak hour with a stop just west of the Temple Street/Vignes Street intersection. DASH route D has a stop at the Temple/Alameda intersection and buses arrive every 5 minutes throughout the day (until 6PM). Metro route 40 uses Temple Street west of Alameda Street before turning north onto Alameda Street. Multiple other transit service providers utilize the study area roadways to connect to Union Station, including but not limited to Santa Monica s Big Blue Bus, Orange County Transit, Torrance Transit, and LADOT Commuter Express. August 31,
23 Metro Emergency Security Operations Center Traffic Study 5.0 EXISTING PLUS PROJECT CONDITIONS This section provides a summary of existing conditions with the addition of project traffic at the study intersections. Intersection Analysis The traffic volumes analyzed for the existing plus project conditions include existing traffic volumes and the project trips (as discussed in section 3.0). Intersection peak hour volumes for existing plus project conditions are shown in Figure 8. Table 5 summarizes the peak hour LOS at the intersections in the project study area intersections under this scenario. Table 5: Intersection Impacts Existing plus Project ID# INTERSECTION 1 Alameda St & Temple St 2 Garey St/Commercial St & US 101 SB Ramps 3 Vignes St & Ramirez St 4 Vignes St & 1st St 5 Mission Rd & 1st St V/C = volume/capacity EXISTING PLUS Peak EXISTING Change In PROJECT Hour V/C V/C LOS V/C LOS Impact? AM A A No PM A A No AM A A No PM A A No AM A A No PM B B No AM A A No PM A A No AM C C No PM B B No As Table 5 indicates, all five study intersections are projected to continue to operate at LOS C or better under existing plus project conditions. The traffic analysis CMA worksheets are provided in Appendix A- 5. Impact Determination Under existing plus project conditions, none of the intersections is significantly impacted by the project trips based on the significance thresholds set forth above in Table 2. August 31,
24 1 356(291) 852(712) 20(71) ALAMEDA 18(56) 162(163) 13(18) (183) 59(23) 176(93) US 101 RAMPS 80(327) 55(62) 5(3) 326(195) 112(147) 334(229) VIGNES 255(482) 163(153) 64(144) TEMPLE COMMERCIAL RAMIREZ 83(247) 233(428) 137(286) 172(447) 169(145) 212(72) 599(986) 39(58) 21(10) GAREY ST 10(4) 46(239) 5(11) 67(62) 71(56) 67(65) 133(407) 88(35) ALAMEDA ST & TEMPLE ST GAREY ST/COMMERCIAL ST & US 101 RAMPS VIGNES ST & RAMIREZ ST 4 25(38) 26(30) 23(67) VIGNES 151(31) 724(279) 144(53) 5 493(156) 131(95) 94(73) MISSION 124(97) 519(194) 9(1) Site Location 61(61) 178(813) 9(15) 1ST ST 5(6) 30(34) 29(129) 103(532) 115(486) 14(10) 1ST ST 11(18) 68(183) 4(4) # Study Intersection AM (PM) Peak Hour VIGNES ST & 1ST ST MISSION RD & 1ST ST
25 Metro Emergency Security Operations Center Traffic Study CONDITIONS This section provides a summary of forecast construction year (2017) conditions with and without project traffic at the study intersections. 6.1 Without Project Intersection Analysis The traffic volumes analyzed for the 2017 Without Project conditions include the ambient area-wide growth and trips from related projects (as discussed in section 2.2). Intersection peak hour volumes for 2017 Without Project are shown in Figure 9. Table 6 summarizes the peak hour LOS at the intersections in the project study area intersections under this scenario. Table 6: Intersection LOS 2017 Without Project Control AM PEAK HOUR PM PEAK HOUR ID# INTERSECTION Type V/C LOS V/C LOS 1 Alameda St & Temple St Signal B C 2 Garey St/Commercial St & US 101 SB Ramps Signal A A 3 Vignes St & Ramirez St Signal A B 4 Vignes St & 1st St Signal A B 5 Mission Rd & 1st St Signal C C V/C = volume/capacity As Table 6 indicates, all five study intersections are projected to continue to operate at LOS C or better under year 2017 Without Project conditions. The traffic analysis CMA worksheets for year 2017 Without Project conditions are provided in Appendix A-5. August 31,
26 1 490(439) 980(823) 22(75) ALAMEDA 20(61) 204(193) 24(26) (215) 94(65) 183(120) US 101 RAMPS 105(346) 62(66) 5(3) 358(218) 136(166) 349(240) VIGNES 267(502) 172(161) 91(149) TEMPLE COMMERCIAL RAMIREZ 177(436) 263(471) 158(320) 193(516) 192(191) 252(89) 681(1126) 42(61) 24(13) GAREY ST 11(4) 72(289) 5(11) 71(69) 73(58) 69(67) 151(445) 82(64) ALAMEDA ST & TEMPLE ST GAREY ST/COMMERCIAL ST & US 101 RAMPS VIGNES ST & RAMIREZ ST 4 68(67) 29(63) 43(75) VIGNES 166(64) 831(390) 148(72) 5 502(177) 135(98) 97(75) MISSION 128(100) 577(292) 9(1) Site Location 73(118) 260(947) 22(43) 1ST ST 27(28) 57(43) 48(139) 120(547) 192(563) 43(51) 1ST ST 42(60) 70(188) 4(4) # Study Intersection AM (PM) Peak Hour VIGNES ST & 1ST ST MISSION RD & 1ST ST
27 Metro Emergency Security Operations Center Traffic Study 6.2 With Project Intersection Analysis The 2017 With Project traffic volumes represent the addition of project traffic to 2017 Without Project conditions. The traffic volumes analyzed for 2017 With Project conditions include the ambient growth rate, related project trips, and trips generated by the project. The 2017 With Project volumes are presented in Figure 10. All five signalized study intersections are projected to continue to operate at LOS C or better in the AM and PM peak hours. The results of 2017 With Project traffic analysis are shown in Table 7. The traffic analysis CMA worksheets for year 2017 With Project weekday conditions are also provided in Appendix A-5. Table 7: Intersection Impacts 2017 With Project ID# Intersection 1 Alameda St & Temple St 2 Garey St/Commercial St & US 101 SB Ramps 3 Vignes St & Ramirez St 4 Vignes St & 1st St 5 Mission Rd & 1st St Peak Without Project With Project Change in Hour V/C LOS V/C LOS V/C Impact? AM B B No PM C C No AM A A No PM A A No AM A A No PM B B No AM A A No PM B B No AM C C No PM C C No Impact Determination Under 2017 with project conditions, none of the intersections is significantly impacted by the project trips based on the significance thresholds set forth above in Table 2. August 31,
28 1 490(439) 980(823) 22(75) ALAMEDA 20(61) 204(201) 24(26) (215) 103(65) 192(120) US 101 RAMPS 105(354) 62(66) 5(3) 358(218) 136(166) 349(240) VIGNES 267(502) 172(161) 91(165) TEMPLE COMMERCIAL RAMIREZ 177(436) 263(471) 158(320) 202(516) 192(191) 252(89) 681(1126) 42(61) 24(13) GAREY ST 11(4) 72(297) 5(11) 71(69) 73(58) 69(67) 151(445) 99(64) ALAMEDA ST & TEMPLE ST GAREY ST/COMMERCIAL ST & US 101 RAMPS VIGNES ST & RAMIREZ ST 4 68(83) 29(63) 43(99) VIGNES 192(64) 831(390) 148(72) 5 515(177) 135(98) 97(75) MISSION 128(100) 590(292) 9(1) Site Location 90(118) 260(947) 22(43) 1ST ST 27(28) 57(43) 48(139) 120(559) 192(575) 43(51) 1ST ST 42(60) 70(188) 4(4) # Study Intersection AM (PM) Peak Hour VIGNES ST & 1ST ST MISSION RD & 1ST ST
29 Metro Emergency Security Operations Center Traffic Study CONDITIONS This section provides a summary of forecast opening year (2019) conditions with and without project traffic at the study intersections. 7.1 Without Project Intersection Analysis The traffic volumes analyzed for the 2019 Without Project conditions include the ambient area-wide growth and trips from related projects (as discussed in section 2.2). Intersection peak hour volumes for 2019 Without Project are shown in Figure 11. Table 8 summarizes the peak hour LOS at the intersections in the project study area intersections under this scenario. Table 8: Intersection LOS 2019 Without Project Control AM PEAK HOUR PM PEAK HOUR ID# INTERSECTION Type V/C LOS V/C LOS 1 Alameda St & Temple St Signal B C 2 Garey St/Commercial St & US 101 SB Ramps Signal A A 3 Vignes St & Ramirez St Signal A B 4 Vignes St & 1st St Signal A C 5 Mission Rd & 1st St Signal C C V/C = volume/capacity As Table 8 indicates, all five study intersections are projected to continue to operate at LOS C or better under year 2019 Without Project conditions. The traffic analysis CMA worksheets for year 2019 Without Project conditions are provided in Appendix A-5. August 31,
30 1 497(445) 997(838) 22(77) ALAMEDA 20(62) 207(196) 25(26) (219) 95(65) 186(122) US 101 RAMPS 107(352) 63(67) 5(3) 364(222) 139(169) 356(244) VIGNES 272(512) 175(164) 92(151) TEMPLE COMMERCIAL RAMIREZ 179(441) 268(479) 161(325) 196(525) 195(194) 257(91) 693(1145) 43(62) 24(14) GAREY ST 12(4) 73(294) 5(12) 72(70) 75(59) 70(68) 154(453) 84(65) ALAMEDA ST & TEMPLE ST GAREY ST/COMMERCIAL ST & US 101 RAMPS VIGNES ST & RAMIREZ ST 4 68(67) 29(64) 43(76) VIGNES 168(65) 845(396) 151(73) 5 512(180) 138(100) 99(77) MISSION 130(102) 587(296) 9(1) Site Location 74(119) 264(964) 22(44) 1ST ST 27(28) 58(44) 48(141) 122(557) 195(573) 44(52) 1ST ST 43(60) 71(192) 4(4) # Study Intersection AM (PM) Peak Hour VIGNES ST & 1ST ST MISSION RD & 1ST ST
31 Metro Emergency Security Operations Center Traffic Study 7.2 With Project Intersection Analysis The 2019 With Project traffic volumes represent the addition of project traffic to 2019 Without Project conditions. The traffic volumes analyzed for 2019 With Project conditions include the ambient growth rate, related project trips, and trips generated by the project. The 2019 With Project volumes are presented in Figure 12. All five signalized study intersections are projected to operate at LOS D or better in the AM and PM peak hours. The results of 2019 With Project traffic analysis are shown in Table 9. The traffic analysis CMA worksheets for year 2019 With Project weekday conditions are also provided in Appendix A-5. Table 9: Intersection Impacts 2019 With Project ID# Intersection 1 Alameda St & Temple St 2 Garey St/Commercial St & US 101 SB Ramps 3 Vignes St & Ramirez St 4 Vignes St & 1st St 5 Mission Rd & 1st St Peak Without Project With Project Change in Hour V/C LOS V/C LOS V/C Impact? AM B B No PM C C No AM A A No PM A B No AM A A No PM B B No AM A A No PM C C No AM C D No PM C C No Impact Determination Under 2019 with project conditions, none of the intersections is significantly impacted by the project trips based on the significance thresholds set forth above in Table 2. August 31,
 268(479) 161(325) 205(525) 195(194) 257(91) 693(1145) 43(62) 24(14) GAREY ST 12(4) 73(302) 5(12) 72(70) 75(59) 70(68) 154(453) 101(65) ALAMEDA ST & TEMPLE ST GAREY ST/COMMERCIAL ST &")
32 1 497(445) 997(838) 22(77) ALAMEDA 20(62) 207(204) 25(26) (219) 104(65) 195(122) US 101 RAMPS 107(360) 63(67) 5(3) 364(222) 139(169) 356(244) VIGNES 272(512) 175(164) 92(167) TEMPLE COMMERCIAL RAMIREZ 179(441) 268(479) 161(325) 205(525) 195(194) 257(91) 693(1145) 43(62) 24(14) GAREY ST 12(4) 73(302) 5(12) 72(70) 75(59) 70(68) 154(453) 101(65) ALAMEDA ST & TEMPLE ST GAREY ST/COMMERCIAL ST & US 101 RAMPS VIGNES ST & RAMIREZ ST 4 68(83) 29(64) 43(100) VIGNES 194(65) 845(396) 151(73) 5 525(180) 138(100) 99(77) MISSION 130(102) 600(296) 9(1) Site Location 91(119) 264(964) 22(44) 1ST ST 27(28) 58(44) 48(141) 122(569) 195(585) 44(52) 1ST ST 43(60) 71(192) 4(4) # Study Intersection AM (PM) Peak Hour VIGNES ST & 1ST ST MISSION RD & 1ST ST
33 Metro Emergency Security Operations Center Traffic Study 8.0 CONGESTION MANAGEMENT PROGRAM ANALYSIS The Los Angeles County Congestion Management Program (CMP) requires analysis using CMP methodologies of any CMP arterial monitoring intersections where the proposed project will add 50 or more trips during either the AM or PM weekday peak hours and of freeway monitoring locations where the project will add 150 or more trips, in either direction, during either the AM or PM weekday peak hours. As shown in Figure 6 of this Traffic Study, the proposed project will not add more than 50 trips to any location outside of the identified study intersections during the AM or PM peak hour. Therefore, no further CMP analysis is required. 9.0 PARKING AND ACCESS Parking and Access section will be updated when the details are provided by Metro PEDESTRIAN AND BICYCLE PATHS There are currently no designated bicycle routes in the study area, however, the 2010 City of Los Angeles Bicycle Plan calls for class II bicycle lanes on 1 st Street, and a bicycle-friendly street on 2 nd Street in the study area. All of the streets in the study area have sidewalks TRANSIT IMPACT ANALYSIS The project is a new Emergency Security Operations Center to manage daily operations of Metro s regional transit system. The purpose of the project is to provide more efficient transit service to the region. As shown in Table 3, the project itself would generate a total of 87 new vehicle trips to the site in the AM peak hour and 79 in the PM peak hour. Using the CMP methodology of calculating person trips by multiplying vehicle trips by 1.4 and then assigning 3.5% would result in a transit trip generation of 5 transit trips in the AM peak hour and 4 transit trips in the PM peak hour. However, due to the proximity of the project to Union Station and Little Tokyo station (Gold Line LRT), the trip generation calculated in Table 3 shows 45 transit trips in the AM peak hour and 44 in the PM peak hour. Assuming the more conservative, or higher, trip generation, the existing bus service was evaluated for the potential to meet the transit demand created by the development. As described previously in the Transit Service Section, Metro and LADOT operate several transit services throughout the study area due to its proximity to Union Station. Metro bus and rail lines, Metrolink commuter rail, Amtrak, and numerous municipal carriers and specialty shuttles operate at Union Station. Metro Gold Line has a stop at Little Tokyo station, which is also within walking distance from the project. In addition, LADOT DASH route D operates every 5 on weekdays during peak hours. Given the proximity of numerous high-frequency transit services, the project is not expected to cause any significant transit impact CONCLUSION Metro is proposing to build a new Emergency Security Operations Center (ESOC) of up to 100,000 square feet on an approximately 1.8-acre site, just south of Highway 101 across from the Metro Headquarters Building (Gateway Building). The construction of the project is proposed to begin in 2017 and is expected to be completed in Operation of the project site would result in an increase of approximately 1,165 daily vehicle trips, including 87 AM peak hour trips and 79 PM peak hour trips. August 31,
34 Metro Emergency Security Operations Center Traffic Study The results show that all intersections are currently operating at LOS D or better and are projected to continue to do so in all study scenarios. Based on the impact thresholds set forth by LADOT, none of the intersections is anticipated to be significantly impacted by the project under any study scenario (Existing plus Project, 2017, and 2019). Therefore, no mitigation measures are required LIST OF REFERENCES City of Los Angeles General Plan: Transportation Element. Institute of Transportation Engineers Trip Generation, 9 th Edition. Los Angeles County Metropolitan Transportation Authority Congestion Management Program. Los Angeles Department of Transportation (August). Traffic Study Policies and Procedures. August 31,
35 Metro Emergency Security Operations Center Traffic Study Appendix A-1 Memorandum of Understanding (MOU) August 2015
36 TRAFFIC STUDY - MEMORANDUM OF UNDERSTANDING (MOU) This MOU acknowledges that the traffic study for the following project will be prepared in accordance with the latest version of LADOT s Traffic Study Policies and Procedures: Project Name: Metro Security Operations Center Project Address: 410 Center Street, Los Angeles, CA Project Description: 100,000 square feet of Metro Emergency Security Operations Center (Office Building) Geographic Distribution: Please refer to map on Page 2 Attach graphic illustrating project trip distribution percentages at the studied intersections Trip Generation Rate(s): ITE 9th Edition / Other ITE 9 th Edition Attach trip generation table with a description of the proposed land uses, ITE rates, estimated morning and afternoon peak hour volumes (ins/outs/totals), proposed trip credits, etc. in out total AM Trips PM Trips Project Buildout Year: 2019 Ambient or CMP Growth Rate: 1.0 % Per Yr. Related Projects: (to be provided by LADOT) Subject to Freeway Impact Analysis Screening review: YES X NO The proposed project is a consolidated operations center for Metro to operate the regional rail and bus system. By efficiently operating the regional transit network, Metro will reduce vehicle trips on the regional freeway network. The project does not directly affect any Caltrans facility and does not require any Caltrans approval. Therefore, Metro believes that there is no basis for Caltrans to review the project. The 4 lanes in each direction of the mainline 101 have a capacity of 8,000 vph (based on an assumed capacity of 2,000 vehicles per hour per lane). We forecast that the project will add less than 80 peak hour trips in either direction of the 101 freeway during either the AM or PM peak hours. All of the off-ramps that project traffic will use are at least two-lane ramps, which have a capacity of 3,000 vph (based on two lanes and an assumed capacity of 1,500 vehicles per hour per lane). We forecast that the project will add less than 30 trips to these off-ramps in the AM or PM peak hours. However, according to Caltrans ramp data, that off-ramp is used by a total of 5,000 vehicles per day. With an assumed capacity of 3,000 vehicles per hour, it would not be operating at LOS E or F based on the current daily volumes. Furthermore, this off-ramp was constructed in 2006 and has an auxiliary lane that extends all the way back to the previous on-ramp from Los Angeles Street, so additional improvements should not be necessary. Study Intersections (Subject to LADOT revision after initial impact analysis) 1. Alameda St & Temple St 4. Vignes St & 1 st St 2. Garey St/Commercial St & US 101 SB Ramps 5. Mission Rd & 1 st St 3. Vignes St & Ramirez St Trip Credits: According to the attached data submitted to AQMD, Metro employees currently use transit for 37% of work trips to all divisions. The share to Gateway Plaza is even higher. The proposed site is just over ¼ mile from Union Station, less than ½ mile from the Little Tokyo LRT station. It is also well served by the DASH D line. Therefore, we are conservatively assuming a 25% transit credit in the trip generation. Transit Usage Transportation Demand Management Existing Active Land Use Previous Land Use Internal Trip Pass-By Trip X X Yes No X X X X
37
 100 11.65 1,165 1.8 180 160 20 1.")


38 Trip Generation Estimates Land Use Size Daily Trips AM Peak-Hour Trips PM Peak-Hour Trips ksf Rate Rate In Out Rate In Out 89% 11% 15% 85% Single Tenant Office Building (ITE Code: 715) , Transit credit (25%) Net trips Existing Land Use Credit* Net New Trips** Based on ITE Trip Generation, 9th Edition *Existing Land Use credit is based on the actual driveway counts conducted on 04/22/2014 **The totals do not add up because the negative outbound trips in the AM and the negative inbound trips in the PM peak hour are capped at zero. Geographic Distribution and Study Intersections
FINAL Traffic Report for the Proposed Golden Valley Road and Newhall Ranch Road Projects in the City of Santa Clarita, California May 5, 2005
 FINAL Traffic Report for the Proposed Golden Valley Road and Newhall Ranch Road Projects in the City of Santa Clarita, California May 5, 2005 Prepared For: EDAW, Inc. 1420 Kettner Boulevard, Suite 620
PLAZA MEXICO RESIDENCES
 PLAZA MEXICO RESIDENCES TRAFFIC STUDY PREPARED FOR: 3000 E. IMPERIAL, LLC. 6940 Beach Boulevard, D-501 Buena Park, California 90621 PREPARED BY: OCTOBER 5, 2017 translutions the transportatio n solutions
Traffic Impact Study
 Traffic Impact Study Statham DRI One University Parkway Prepared for: Barrow County Prepared by: October 2012 Table of Contents Executive Summary i Section 1. Introduction 1 Project Description 1 Methodology
NATHAN HALE HIGH SCHOOL PARKING AND TRAFFIC ANALYSIS. Table of Contents
 Parking and Traffic Analysis Seattle, WA Prepared for: URS Corporation 1501 4th Avenue, Suite 1400 Seattle, WA 98101-1616 Prepared by: Mirai Transportation Planning & Engineering 11410 NE 122nd Way, Suite
Market Street PDP. Nassau County, Florida. Transportation Impact Analysis. VHB/Vanasse Hangen Brustlin, Inc. Nassau County Growth Management
 Transportation Impact Analysis Market Street PDP Nassau County, Florida Submitted to Nassau County Growth Management Prepared for TerraPointe Services, Inc. Prepared by VHB/Vanasse Hangen Brustlin, Inc.
CVS Derwood. Local Area Transportation Review
 CVS Derwood Montgomery County, Maryland May 27, 2016 Local Area Transportation Review Prepared for: JC Bar Properties, Inc. Steve Fleming, PE 415 Fallowfield Road, Suite 301 Camp Hill, Pennsylvania 17011
Appendix I: Traffic Study
 City of Fontana Sierra Lakes Commerce Center Draft EIR Appendix I: Traffic Study FirstCarbon Solutions H:\Client (PN JN)\0144\01440050\EIR\1 ADEIR\01440050 Sec99 99 Appendix Dividers.doc THIS PAGE INTENTIONALLY
Appendix J: Transportation and Circulation
 Appendix J: Transportation and Circulation J 1: Transportation Analysis Report J 2: Los Angeles Department of Transportation (LADOT) Approval Letter J 3: Construction Traffic Analysis J 1: Transportation
TRAFFIC STUDY FOR THE GAFFEY POOL PROJECT LOS ANGELES, CALIFORNIA CITY OF LOS ANGELES, BUREAU OF ENGINEERING OCTOBER 2013 PREPARED FOR PREPARED BY
 TRAFFIC STUDY FOR THE GAFFEY POOL PROJECT LOS ANGELES, CALIFORNIA OCTOBER 2013 PREPARED FOR CITY OF LOS ANGELES, BUREAU OF ENGINEERING PREPARED BY DRAFT TRAFFIC STUDY FOR THE GAFFEY POOL PROJECT October
City of Hermosa Beach Beach Access and Parking Study. Submitted by. 600 Wilshire Blvd., Suite 1050 Los Angeles, CA
 City of Hermosa Beach Beach Access and Parking Study Submitted by 600 Wilshire Blvd., Suite 1050 Los Angeles, CA 90017 213.261.3050 January 2015 TABLE OF CONTENTS Introduction to the Beach Access and Parking
Appendixx C Travel Demand Model Development and Forecasting Lubbock Outer Route Study June 2014
 Appendix C Travel Demand Model Development and Forecasting Lubbock Outer Route Study June 2014 CONTENTS List of Figures-... 3 List of Tables... 4 Introduction... 1 Application of the Lubbock Travel Demand
Traffic Impact Analysis. for the STARBUCKS STORE. Located at 9900 BALBOA BOULEVARD. Submitted to CITY OF LOS ANGELES. January 2017.
 Traffic Impact Analysis for the STARBUCKS STORE Located at 9900 BALBOA BOULEVARD Submitted to CITY OF LOS ANGELES January 2017 Submitted By January 5, 2017 Ken A. Aitchison, P.E. Transportation Engineering
TRAFFIC IMPACT STUDY. Platte Canyon Villas Arapahoe County, Colorado (Arapahoe County Case Number: Z16-001) For
 For") TRAFFIC IMPACT STUDY For Platte Canyon Villas Arapahoe County, Colorado (Arapahoe County Case Number: Z16-001) February 2015 Revised: August 2015 April 2016 July 2016 September 2016 Prepared for: KB Home
TRAFFIC IMPACT STUDY For Platte Canyon Villas Arapahoe County, Colorado (Arapahoe County Case Number: Z16-001) February 2015 Revised: August 2015 April 2016 July 2016 September 2016 Prepared for: KB Home
California Urban Infill Trip Generation Study. Jim Daisa, P.E.
 California Urban Infill Trip Generation Study Jim Daisa, P.E. What We Did in the Study Develop trip generation rates for land uses in urban areas of California Establish a California urban land use trip
MEMORANDUM. The study area of the analysis was discussed with City staff and includes the following intersections:
 MEMORANDUM DATE: JULY 6, 2012 TO: FROM: RE: CC: MELANIE KNIGHT BRAD BYVELDS/ JENNIFER LUONG 1050 SOMERSET STREET PRELIMINARY TRAFFIC ANALYSIS OUR FILE NO. 111152 NEIL MALHOTRA The purpose of this memo
WEBER ROAD RESIDENTIAL DEVELOPMENT Single Family Residential Project
 WEBER ROAD RESIDENTIAL DEVELOPMENT Single Family Residential Project WEBER ROAD RESIDENTIAL DEVELOPMENT TRAFFIC IMPACT STUDY TABLE OF CONTENTS 1.0 Executive Summary Page 2.0 Introduction 2.1 DEVELOPMENT
April 10, Mr. Curt Van De Walle, City Manager City of Castle Hills 209 Lemonwood Drive Castle Hills, Texas 78213
 Mr. Curt Van De Walle, City Manager City of Castle Hills 209 Lemonwood Drive Castle Hills, Texas 78213 Subject: Revised Castle Hills BASIS Charter School Traffic Impact Analysis Review City of Castle Hills,
MEMORANDUM. Trip Generation Analysis
 MEMORANDUM To: RMC Architects From: Matthew Palmer, PE Subject: Trip Generation, Parking Analysis & Level of Service Project: Port of Everett, GTC #13-053 Date: August 25, 2014 The trip generation and
Environmental Analysis, Chapter 4 Consequences, and Mitigation
 Environmental Analysis, Chapter 4 4.17 Environmental Justice This section summarizes the potential impacts described in Chapter 3, Transportation Impacts and Mitigation, and other sections of Chapter 4,
VHD Daily Totals. Population 14.5% change. VMT Daily Totals Suffolk 24-hour VMT. 49.3% change. 14.4% change VMT
 6.9 Suffolk 6-54 VMT Population and Travel Characteristics Population 14.5% change 2014 1,529,202 VHD Daily Totals 2014 251,060 49.3% change 2040 1,788,175 2040 374,850 VMT Daily Totals 2014 39,731,990
III. FORECASTED GROWTH
 III. FORECASTED GROWTH In order to properly identify potential improvement projects that will be required for the transportation system in Milliken, it is important to first understand the nature and volume
Appendix C Traffic Study
 Final Environmental Impact Statement Appendix C Traffic Study Schofield Generating Station Project, Hawaii October 2015 C-1 Final Environmental Impact Statement This page intentionally left blank. Schofield
January 12, Mr. Ryan Granger TMGB Wilson, LLC 2221 Health Drive SW, Suite 2200 Wyoming, Michigan 49519
 January 12, 2018 Mr. Ryan Granger TMGB Wilson, LLC 2221 Health Drive SW, Suite 2200 Wyoming, Michigan 49519 Re: Proposed Reserve at Rivertown Mixed-Use Development Updated Trip Generation and Site Driveway
APPENDIX I: Traffic Forecasting Model and Assumptions
 APPENDIX I: Traffic Forecasting Model and Assumptions Appendix I reports on the assumptions and traffic model specifications that were developed to support the Reaffirmation of the 2040 Long Range Plan.
SHADE/SHADOW REPORT. For the Proposed 8777 Washington Project. Culver City, CA. Prepared for:
 SHADE/SHADOW REPORT For the Proposed 8777 Washington Project Culver City, CA Prepared for: VITRUVIAN CULVER CITY LLC (THE APPLICANT) 5822 WEST WASHINGTON BOULEVARD CULVER CITY, CALIFORNIA 90232 Prepared
JEP John E. Jack Pflum, P.E. Consulting Engineering 7541 Hosbrook Road, Cincinnati, OH Telephone:
 JEP John E. Jack Pflum, P.E. Consulting Engineering 7541 Hosbrook Road, Cincinnati, OH 45243 Email: jackpflum1@gmail.com Telephone: 513.919.7814 MEMORANDUM REPORT Traffic Impact Analysis Proposed Soccer
APPENDIX IV MODELLING
 APPENDIX IV MODELLING Kingston Transportation Master Plan Final Report, July 2004 Appendix IV: Modelling i TABLE OF CONTENTS Page 1.0 INTRODUCTION... 1 2.0 OBJECTIVE... 1 3.0 URBAN TRANSPORTATION MODELLING
Honorable Mayor and Members of the City Council
 TO: ATTENTION: FROM: SUBJECT: Honorable Mayor and Members of the City Council Jeffrey L. Stewart, City Manager Len Gorecki, Director of Public Works Jerry Stock, City Engineer Public Hearing to Consider
Travel Demand Management Plan
 Travel Demand Management Plan Tryg s & Apartment Building 8 West Lake Street Minneapolis, MN AUTHORIZED PROPERTY REPRESENTATIVE: By Dated: Mr. Johnny Carlson Trammell Crow Chicago Development, Inc. 5 South
KAISER SOUTH NORTHERN VIRGINIA HUB TRAFFIC IMPACT STUDY PRINCE WILLIAM COUNTY, VIRGINIA TABLE OF CONTENTS. Section 2 BACKGROUND INFORMATION 12
 KAISER SOUTH NORTHERN VIRGINIA HUB TRAFFIC IMPACT STUDY PRINCE WILLIAM COUNTY, VIRGINIA TABLE OF CONTENTS Page EXECUTIVE SUMMARY 1 Purpose of Report and Study Objectives... 1 Site Location and Study Area...
ALTA VISTA COMMERCIAL/ RESIDENTIAL PROJECT
 ALTA VISTA COMMERCIAL/ RESIDENTIAL PROJECT TRAFFIC IMPACT ANALYSIS Prepared For: Paul Conzelman SC Development 2151 Michelson Drive, Suite 140 Irvine, CA 92612 Prepared By: 2030 Main Street, Suite 1200
MADISON, WI STONE HOUSE DEVELOPMENT 1000 E. WASHINGTON AVENUE REDEVELOPMENT TRANSPORTATION STUDY DECEMBER 14, 2015
 MADISON, WI STONE HOUSE DEVELOPMENT 1000 E. WASHINGTON AVENUE REDEVELOPMENT TRANSPORTATION STUDY DECEMBER 14, 2015 TABLE OF CONTENTS... 3 Proposed Development... 3 Methodology... 3 Phase 1 Development...
TRAFFIC IMPACT STUDY MANUFACTURING COMPANY
 TRAFFIC IMPACT STUDY For MANUFACTURING COMPANY Prepared For: Airway Heights, WA Prepared By: SUNBURST ENGINEERING, P. S. 4310 S. Ball Dr. Veradale, WA 99037 April, 2013 TRAFFIC IMP ACT STUDY Manufacturing
City of Saginaw Right of Way Division Snow and Ice Removal Policy January 18, 2016
 Snow and Ice Removal Policy January 18, 2016 It is the policy of the to provide snowplowing and ice removal services in order to: Provide safe traveling conditions for motorists and pedestrians Assist
Final City of Colusa STREETS & ROADWAYS MASTER PLAN. October J Street Suite 390 Sacramento, CA 95814
 Final City of Colusa STREETS & ROADWAYS MASTER PLAN October 2009 660 J Street Suite 390 Sacramento, CA 95814 TABLE OF CONTENTS I. INTRODUCTION... 1 Report Organization...1 II. ANALYSIS METHODOLOGY... 2
6711 LEE HIGHWAY TRAFFIC IMPACT STUDY ARLINGTON, VIRGINIA
 6711 TRAFFIC IMPACT STUDY ARLINGTON, VIRGINIA Prepared for: NVR, Inc. Prepared by: Wells + Associates, Inc. Michael J. Workosky, PTP, TOPS, TSOS John J. Andrus William L. Zeid, PE 703.917.6620 May 4, 2017
WOODRUFF ROAD CORRIDOR ORIGIN-DESTINATION ANALYSIS
 2018 WOODRUFF ROAD CORRIDOR ORIGIN-DESTINATION ANALYSIS Introduction Woodruff Road is the main road to and through the commercial area in Greenville, South Carolina. Businesses along the corridor have
Expanding the GSATS Model Area into
 Appendix A Expanding the GSATS Model Area into North Carolina Jluy, 2011 Table of Contents LONG-RANGE TRANSPORTATION PLAN UPDATE 1. Introduction... 1 1.1 Background... 1 1.2 Existing Northern Extent of
Focused Traffic Analysis for the One Lincoln Park Project
 September 15, 2015 Mr. Bill Johnson Coldwell Banker 511 Sir Francis Drake Boulevard Greenbrae, CA 94904 Focused Traffic Analysis for the One Lincoln Park Project Dear Mr. Johnson; As requested, W-Trans
SUBJECT: SUMMARY OF FINDINGS. October 29, Mr. Carter Redish Carter Group Architects, Inc S. El Camino Real, Suite F San Clemente, CA 92672
 October 29, 2018 Mr. Carter Redish Carter Group Architects, Inc. 1810 S. El Camino Real, Suite F San Clemente, CA 92672 SUBJECT: CANYON STEEL FOCUSED TRAFFIC IMPACT ANALYSIS Dear Mr. Carter Redish: Urban
3.0 ANALYSIS OF FUTURE TRANSPORTATION NEEDS
 3.0 ANALYSIS OF FUTURE TRANSPORTATION NEEDS In order to better determine future roadway expansion and connectivity needs, future population growth and land development patterns were analyzed as part of
METRO Blue Line LRT Extension (BLRT) 5514 West Broadway Avenue, Suite 200, Crystal, MN
 5514 West Broadway Avenue, Suite 200, Crystal, MN") Robbinsdale Open House July 28, 2015 *All comments are recorded verbatim from comment cards and discussion worksheets. No grammatical, word choice changes or spelling has been corrected. If handwriting
Robbinsdale Open House July 28, 2015 *All comments are recorded verbatim from comment cards and discussion worksheets. No grammatical, word choice changes or spelling has been corrected. If handwriting
PRADO BASIN SEDIMENT REMOVAL PROJECT FOCUSED TRAFFIC ANALYSIS. May 31, 2016
 PRADO BASIN SEDIMENT REMOVAL PROJECT FOCUSED TRAFFIC ANALYSIS May 31, 2016 Kunzman Associates, Inc. PRADO BASIN SEDIMENT REMOVAL PROJECT FOCUSED TRAFFIC ANALYSIS May 31, 2016 Prepared by: Perrie Ilercil,
MnDOT Method for Calculating Measures of Effectiveness (MOE) From CORSIM Model Output
 From CORSIM Model Output") MnDOT Method for Calculating Measures of Effectiveness (MOE) From CORSIM Model Output Rev. April 29, 2005 MnDOT Method for Calculating Measures of Effectiveness (MOE) From CORSIM Model Output Table of
MnDOT Method for Calculating Measures of Effectiveness (MOE) From CORSIM Model Output Rev. April 29, 2005 MnDOT Method for Calculating Measures of Effectiveness (MOE) From CORSIM Model Output Table of
Urban Planning Word Search Level 1
 Urban Planning Word Search Level 1 B C P U E C O S Y S T E M P A R E U O E U R B A N P L A N N E R T N S T D H E C O U N T Y G E R E R D W R E N I C I T Y C O U N C I L A A A S U G G C I L A G P R I R
Attachment E: CADP Design Shadow Analysis
 Attachment E: CADP Design Shadow Analysis June 6, 2016 TO: Don Lewis San Francisco Planning Department 1650 Mission Street, Suite 400 San Francisco, CA 94103 SUBJECT: 2060 Folsom Street 17 th & Folsom
930 Old Northern Rd & 4 Post Office Rd, Glenorie
 Proposed Mixed Use Development 930 Old Northern & 4, Glenorie TRAFFIC AND PARKING ASSESSMENT REPORT 13 December 2016 Ref 16264 Suite 6, 20 Young Street, Neutral Bay NSW 2089 - PO Box 1868, Neutral Bay
CHAPTER 3 TRANSPORTATION
 CHAPTER 3 TRANSPORTATION This chapter presents information on transportation impacts of Section 2 of the Project that have changed from those identified in the published Westside Subway Extension Final
Regional Performance Measures
 G Performance Measures Regional Performance Measures Introduction This appendix highlights the performance of the MTP/SCS for 2035. The performance of the Revenue Constrained network also is compared to
Background and Planning Context 1.1 INTRODUCTION 1.2 PROJECT LOCATION
 Chapter 1: Background and Planning Context 1.1 INTRODUCTION Metro-North Commuter Railroad Company ( Metro-North or the Project Sponsor ) is proposing the construction of a new, expanded parking garage
Trip Generation Study: A 7-Eleven Gas Station with a Convenience Store Land Use Code: 945
 Trip Generation Study: A 7-Eleven Gas Station with a Convenience Store Land Use Code: 945 Introduction The Brigham Young University Institute of Transportation Engineers student chapter (BYU ITE) completed
2015 Grand Forks East Grand Forks TDM
 GRAND FORKS EAST GRAND FORKS 2015 TRAVEL DEMAND MODEL UPDATE DRAFT REPORT To the Grand Forks East Grand Forks MPO October 2017 Diomo Motuba, PhD & Muhammad Asif Khan (PhD Candidate) Advanced Traffic Analysis
HALFF 16196? TRAFFIC MANAGEMENT PLAN. Richardson ISD Aikin Elementary School Dallas, Texas North Bowser Road Richardson, Texas 75081
 30280 16196? TRAFFIC MANAGEMENT PLAN Exhibit 572B Aikin Elementary School Planned Development District No. 572 Approved City Plan Commission October20, 2016 July 12, 2016 Prepared for HALFF AVO 31586 PHO1
City of Laramie, Wyoming SNOW AND ICE POLICY
 City of Laramie, Wyoming SNOW AND ICE POLICY 11/02/89; rev 10/15/2007 I. INTRODUCTION The intention of this Policy is to set reasonable goals and general practices as a guide for the conduct of snow and
Forecasts for the Reston/Dulles Rail Corridor and Route 28 Corridor 2010 to 2050
 George Mason University Center for Regional Analysis Forecasts for the Reston/Dulles Rail Corridor and Route 28 Corridor 21 to 25 Prepared for the Fairfax County Department of Planning and Zoning Lisa
GIS Analysis of Crenshaw/LAX Line
 PDD 631 Geographic Information Systems for Public Policy, Planning & Development GIS Analysis of Crenshaw/LAX Line Biying Zhao 6679361256 Professor Barry Waite and Bonnie Shrewsbury May 12 th, 2015 Introduction
CITY OF NEW LONDON WINTER ROAD & SIDEWALK MAINTENANCE POLICY
 CITY OF NEW LONDON WINTER ROAD & SIDEWALK MAINTENANCE POLICY GENERAL The purpose of this policy is to set up acceptable procedures and policies for the winter maintenance of public areas in the City of
The Highline Development Traffic Impact Study
 The Highline Development Traffic Impact Study Columbia Falls, Montana Prepared For: TD&H Engineering 450 Corporate Drive, Suite 101 Kalispell, MT 59901 June, 2018 130 South Howie Street Helena, Montana
DOLLAR GENERAL PROJECT FOCUSED TRAFFIC ANALYSIS (REVISED) May 20, 2015
 May 20, 2015") DOLLAR GENERAL PROJECT FOCUSED TRAFFIC ANALYSIS (REVISED) May 20, 2015 May 20, 2015 Mr. Dan Biswas, VP of Development CJS DEVELOPMENT II, LLC 5111 North Scottsdale Road, Suite 200 Scottsdale, CA 85250
DOLLAR GENERAL PROJECT FOCUSED TRAFFIC ANALYSIS (REVISED) May 20, 2015 May 20, 2015 Mr. Dan Biswas, VP of Development CJS DEVELOPMENT II, LLC 5111 North Scottsdale Road, Suite 200 Scottsdale, CA 85250
TRANSPORTATION AND TRAFFIC ANALYSIS REPORT
 Square One Drive Extension Municipal Class Environmental Assessment Environmental Study Report Appendix B Transportation and Traffic Analysis Report TRANSPORTATION AND TRAFFIC ANALYSIS REPORT FINAL DRAFT
CITY OF BEAVER DAM SNOW & ICE REMOVAL POLICY
 CITY OF BEAVER DAM SNOW & ICE REMOVAL POLICY Revised January, 2016 Approved by Operations Committee: February 1, 2016 This snow and ice removal policy guides Public Works personnel with deicing, plowing,
Appendix C Final Methods and Assumptions for Forecasting Traffic Volumes
 Fairview Ave. and Main St. Improvements and Local Streets Plan Appendices Ada County Highway District Appendix C Final Methods and Assumptions for Forecasting Traffic Volumes January 3, 207 Appendices
Prepared for: San Diego Association Of Governments 401 B Street, Suite 800 San Diego, California 92101
 Activity-Based Travel Model Validation for 2012 Using Series 13 Data: Coordinated Travel Regional Activity Based Modeling Platform (CT-RAMP) for San Diego County Prepared for: San Diego Association Of
Engineer's Report. Main Street Business Area. Festoon Lighting and Sidewalk Cleaning Assessment District (Fiscal Year )
") Engineer's Report for the Main Street Business Area Festoon Lighting and Sidewalk Cleaning Assessment District (Fiscal Year 2008-09) Prepared under the provisions of the Benefit Assessment Act of 1982
Engineer's Report for the Main Street Business Area Festoon Lighting and Sidewalk Cleaning Assessment District (Fiscal Year 2008-09) Prepared under the provisions of the Benefit Assessment Act of 1982
Alternatives Analysis Report
 1.0 PURPOSE AND NEED The Southern California Association of Governments (SCAG), in coordination with the Los Angeles County Metropolitan Transportation Authority (Metro) and the Orange County Transportation
FARM 1065 PORTION 1, ATLANTIS TRAFFIC IMPACT ASSESSMENT
 FARM 1065 PORTION 1, ATLANTIS TRAFFIC IMPACT ASSESSMENT February 2018 FIRST ISSUE Prepared by: JG AFRIKA (PTY) LTD Branch: Cape Town PO Box 38561 Postal code: 7430 Telephone: 021 530 1800 Email: wink@
Regional Performance Measures
 G Performance Measures Regional Performance Measures Introduction This appendix highlights the performance of the MTP/SCS for 2035. The performance of the Revenue Constrained network also is compared to
Appendix B. Land Use and Traffic Modeling Documentation
 Appendix B Land Use and Traffic Modeling Documentation Technical Memorandum Planning Level Traffic for Northridge Sub-Area Study Office of Statewide Planning and Research Modeling & Forecasting Section
2129 NORTH MAIN STREET HOTE PROJECT ULI SHARED PARKING STUDY City of Santa Ana, California
 2129 NORTH MAIN STREET HOTE PROJECT ULI SHARED PARKING STUDY City of Santa Ana, California Prepared for: NET DEVELOPMENT COMPANY 3130 Airway Avenue Costa Mesa, CA 92626 Prepared by: RK ENGINEERING GROUP,
PW 001 SNOW REMOVAL AND SANDING FOR ROADWAYS AND SIDEWALKS October 6, 2014 (#223-14) Original October 19, 2015; October 15, 2018 Public Works
 Original October 19, 2015; October 15, 2018 Public Works") Policy Statement: The Village of Kitscoty will provide snow and ice control on municipal streets and sidewalks according to determined priorities. Purpose: To provide direction and information to employees
Policy Statement: The Village of Kitscoty will provide snow and ice control on municipal streets and sidewalks according to determined priorities. Purpose: To provide direction and information to employees
SNOW CONTROL OPERATIONS
 SNOW CONTROL OPERATIONS PUBLIC WORKS TEAM STREET MAINTENANCE DIVISION SNOW CONTROL OPERATIONS Standard Operating Procedures for Snow Removal Operations. 1. Plowing operations will be initiated when snow
Parking Regulations Dundas Street West, from Bathurst Street to Dovercourt Road
 STAFF REPORT ACTION REQUIRED Parking Regulations Dundas Street West, from Bathurst Street to Dovercourt Road Date: October 28, 2008 To: From: Toronto and East York Community Council Director, Transportation
Mapping Accessibility Over Time
 Journal of Maps, 2006, 76-87 Mapping Accessibility Over Time AHMED EL-GENEIDY and DAVID LEVINSON University of Minnesota, 500 Pillsbury Drive S.E., Minneapolis, MN 55455, USA; geneidy@umn.edu (Received
The Sunland Park flyover ramp is set to close the week of March 19 until early summer
 March 2, 2018 The Sunland Park flyover ramp is set to close the week of March 19 until early summer GO 10 is targeting the week of March 19 to close the Sunland Park Drive flyover entrance ramp to I 10
2011 South Western Region Travel Time Monitoring Program Congestion Management Process. Executive Summary
 2011 South Western Region Travel Monitoring Program Executive Summary Prepared by: South Western Regional Planning Agency 888 Washington Blvd, 3rd Floor Stamford, CT 06901 Telephone: 203.6.5190 Facsimile:
IV. ENVIRONMENTAL IMPACT ANALYSIS B. AESTHETICS SHADE/SHADOW
 IV. ENVIRONMENTAL IMPACT ANALYSIS B. AESTHETICS SHADE/SHADOW 1. INTRODUCTION Potential effects of the Proposed Project related to visual character, views and light/glare are addressed in Section IV.A,
RE: Existing and Future Parking Demand Analysis St. Joseph Center Expansion
 HAND DELIVERED December 12, 2003 Mr. James S. Bancroft Chair, Board of Directors St. Joseph Center 204 Hampton Drive Venice, California 90291-8633 RE: Existing and Future Parking Demand Analysis St. Joseph
DOWNTOWN SUB-AREA. Final Parking Study. Prepared for: City of Bellingham. March Prepared by:
 Final Parking Study DOWNTOWN SUB-AREA Prepared for: City of Bellingham March 2013 Prepared by: 11730 118 th Avenue NE, Suite 600 Kirkland, WA 98034-7120 Phone: 425-821-3665 Fax: 425-825-8434 www.transpogroup.com
StanCOG Transportation Model Program. General Summary
 StanCOG Transportation Model Program Adopted By the StanCOG Policy Board March 17, 2010 What are Transportation Models? General Summary Transportation Models are technical planning and decision support
Table of Contents Introduction... 4 Study Area... 5
 Table of Contents Introduction... 4 Study Area... 5 Streets and s... 5 Traffic Volumes... 8 Recent and Anticipated Development... 10 Crash Analysis... 10 Projected Traffic Volumes... 11 Trip Generation...
Town of Barnstable. Department of Public Work. Snow and Ice Control Operations Plan
 Town of Barnstable Department of Public Work Snow and Ice Control Operations Plan I. Mission: The mission of the Department of Public Works is to remove accumulations of snow and ice from town, county
Transit Time Shed Analyzing Accessibility to Employment and Services
 Transit Time Shed Analyzing Accessibility to Employment and Services presented by Ammar Naji, Liz Thompson and Abdulnaser Arafat Shimberg Center for Housing Studies at the University of Florida www.shimberg.ufl.edu
Flood Scenario Worksheet
 Flood Scenario Worksheet Scenario adapted from: http://www.epa.gov/watersecurity/tools/trainingcd/simple/source/scenario-8/ssc8-0.pdf Simple Tabletop Exercise, Interdependency Natural Disaster Scenario,
County of San Diego, Planning & Development Services
 County of San Diego, Planning & Development Services E N V I R O N M E N T A L R E V I E W U P D A T E A P P L I C A T I O N F O R A P P L I C A T I O N S C O V E R E D B Y A P R E V I O U S L Y C O M
South Western Region Travel Time Monitoring Program Congestion Management Process Spring 2008 Report
 South Western Region Travel Monitoring Program Congestion Management Process Spring 2008 Report Prepared by: South Western Regional Planning Agency 888 Washington Boulevard Stamford, CT 06901 Telephone:
Morgantown, West Virginia. Adaptive Control Evaluation, Deployment, & Management. Andrew P. Nichols, PhD, PE
 Morgantown, West Virginia Adaptive Control Evaluation, Deployment, & Management Andrew P. Nichols, PhD, PE Program Director of ITS Nick J. Rahall II, Appalachian Transportation Inst. Marshall University
King City URA 6D Concept Plan
 King City URA 6D Concept Plan King City s Evolution Among the fastest growing cities 2000 Census 1,949 2010 Census 3,111 60% increase 2016 Census estimate 3,817 23% increase Average annual rate 4.3% Surpassing
6 th Line Municipal Class Environmental Assessment
 6 th Line Municipal Class Environmental Assessment County Road 27 to St John s Road Town of Innisfil, ON September 6, 2016 APPENDIX L: TRAVEL DEMAND FORECASTING MEMORANDUM Accessible formats are available
CITY OF ORILLIA POLICY MANUAL. Winter Operations. Table of Contents. WINTER CONTROL Objectives 2. WINTER CONTROL Season 3
 Page 1 of 12 Winter Operations Table of Contents WINTER CONTROL Objectives 2 WINTER CONTROL Season 3 SNOW ACCUMULATION Road Plowing 4,5 ICY ROADWAYS Application of Deicers/Abrasives 6 SNOW ACCUMULATION
Date: June 19, 2013 Meeting Date: July 5, Consideration of the City of Vancouver s Regional Context Statement
 Section E 1.5 To: From: Regional Planning and Agriculture Committee Lee-Ann Garnett, Senior Regional Planner Planning, Policy and Environment Department Date: June 19, 2013 Meeting Date: July 5, 2013 Subject:
106 PURDUE ENGINEERING EXTENSION DEPARTMENT
 106 PURDUE ENGINEERING EXTENSION DEPARTMENT distribution by stations can best be studied by examining Figs. 3 and 4. Figure 4 shows the frequency distribution between stations, and Fig. 3 shows the actual
I. M. Schoeman North West University, South Africa. Abstract
 Urban Transport XX 607 Land use and transportation integration within the greater area of the North West University (Potchefstroom Campus), South Africa: problems, prospects and solutions I. M. Schoeman
Updating the Urban Boundary and Functional Classification of New Jersey Roadways using 2010 Census data
 Updating the Urban Boundary and Functional Classification of New Jersey Roadways using 2010 Census data By: Glenn Locke, GISP, PMP 1 GIS-T May, 2013 Presentation Overview Purpose of Project Methodology
SNOW CONTROL OPERATIONS 2017 PUBLIC SERVICES DEPARTMENT MAINTENANCE DIVISION
 SNOW CONTROL OPERATIONS 2017 PUBLIC SERVICES DEPARTMENT MAINTENANCE DIVISION 1 SNOW CONTROL OPERATIONS The following are the standard operating procedures f snow removal operations. 1. Plowing operations
Neighborhood Locations and Amenities
 University of Maryland School of Architecture, Planning and Preservation Fall, 2014 Neighborhood Locations and Amenities Authors: Cole Greene Jacob Johnson Maha Tariq Under the Supervision of: Dr. Chao
Kitsap County 2016 Comprehensive Plan Update. Appendix A: Growth Estimates
 Kitsap County 2016 Comprehensive Plan Update Appendix A: Growth Estimates Appendix A 1 April 2016 Kitsap County 2016 Comprehensive Plan Update Appendix A: Growth Estimates Land Capacity Land capacity
Trip Generation Calculations
 Trip Generation Calculations A HORIZON AIR ALLEGIANT AI R EMPLOYEES Daily Trip Generation Daily Trip Generation Daily Trip Generation Directional Flights (per day): 20 Directional Flights (per day): 2.8
Case Special Exception request for Planned Unit Development (PUD) The Vineyards
 The Vineyards") Case 1627 Applicant: Developer: Request: Location: Pointe South Land Trust Contact Information: Jimmy Garrett 901-271-3642 N/A Special Exception request for Planned Unit Development (PUD) The Vineyards
Case 1627 Applicant: Developer: Request: Location: Pointe South Land Trust Contact Information: Jimmy Garrett 901-271-3642 N/A Special Exception request for Planned Unit Development (PUD) The Vineyards
Forecasts from the Strategy Planning Model
 Forecasts from the Strategy Planning Model Appendix A A12.1 As reported in Chapter 4, we used the Greater Manchester Strategy Planning Model (SPM) to test our long-term transport strategy. A12.2 The origins
COUNCIL POLICY MANUAL
 COUNCIL POLICY MANUAL SECTION: PUBLIC WORKS SUBJECT: SNOW & ICE CONTROL POLICY 2012/2013 GOAL: Pages: 1 of 10 Approval Date: Dec. 3, 2012 Res. # 1001/2012 To annually identify the winter maintenance costs