MADISON, WI STONE HOUSE DEVELOPMENT 1000 E. WASHINGTON AVENUE REDEVELOPMENT TRANSPORTATION STUDY DECEMBER 14, 2015
|
|
|
- Archibald Wilkerson
- 5 years ago
- Views:
Transcription

1 MADISON, WI STONE HOUSE DEVELOPMENT 1000 E. WASHINGTON AVENUE REDEVELOPMENT TRANSPORTATION STUDY DECEMBER 14, 2015
2

3 TABLE OF CONTENTS... 3 Proposed Development... 3 Methodology... 3 Phase 1 Development TDM Measures... 5 Findings Figure 2: Site Plan Figure 6: Parking Demand Table by Block Face
4 2
5 Introduction Stone House Development is proposing a mixed use the former Madison Dairy site (Figure1). The 4.5 acre limited retail. The development team has been working with the city and the neighborhood to evaluate the parking minimizing these impacts. This report assesses the impacts of implemented to minimize their impact on the neighborhood. Proposed Development The proposed development layout is shown in Figure 2. The development will have access on Brearly Street and Ingersoll via will have right turn in and right turn out only. There will not be be internal to the development with a structured parking deck that is integrated with the building design. This arrangement will allow on-site shared parking between the Methodology Development shown in Figure 3. The analysis focused on the morning and volumes on the adjacent streets are at their peak. Based on the Figure 4. In was then distributed to the adjoining streets for inbound and and 5b. 3
6 of parking spaces needed are 454. Based on the city zoning supplied is shown in Figure 6. Parking for the development will be located on three separate levels. The main level at grade will contain 120 parking spaces with another 238 spaces provided on the two below grade This parking is currently unrestricted except on E. Washington order to encourage parking turnover for the retail and visitor that the 41 spaces on the three remaining block faces be See Figure 9. Madison Metro provides regular bus service on the following routes near the development site: Routes 2 & 5 on Gorham at Ingersoll) Last trip to North Transfer Point on 9:56pm weekends Last trip towards West Transfer Point on Route 6 (East- and Westbound on East Washington at Routes 3 and 4 would generally mirror those above. Routes 3 (and 7 on weekends) are generally every 30 minutes Routes 10, 14 and 15 do have evening service - but not to areas Route 81 serves the bus stop 4
7 See Figure 7 for weekday and weekend service routes and Figure 8 for evening service. is signed and controlled to give preference to bicycle riders. volumes on this corridor exceeded 100 per hour (peak hour). The focus of the TDM measures are to reduce automobile measures have been found to target employees as opposed to retail customers or residents. To this end the focus of TDM following TDM measures: The business tenants will designate an employee to provide bike usage. capacity available. of employee transit passes. Since the East Washington for employees using the transit system. that will include showers as well as space for parking up to 217 bicycles indoors. Since the development consists of a mix of uses including block of parking spaces will be designated as shared spaces. part of a car pool are ride share program. to provide at least one vehicle that will be parked in a designated space in the structured parking area. The developer is willing to work with the city on an agreement to provide up to 100 parking spaces that can adjacent Breese Stevens sports complex. Findings 1. faces (41 spaces) to 2 hour parking from 8:00 a.m. to 5:00 p.m. (Figure 9) would improve parking turnover and availability for the development. 2. an extended delay for the northeast bound (E. Washington) 5
8 3. 4. hour. 5. number of trips generated to the development and reduce 6

9 Figure 1 - Site Location 1000 East Washington Avenue 7


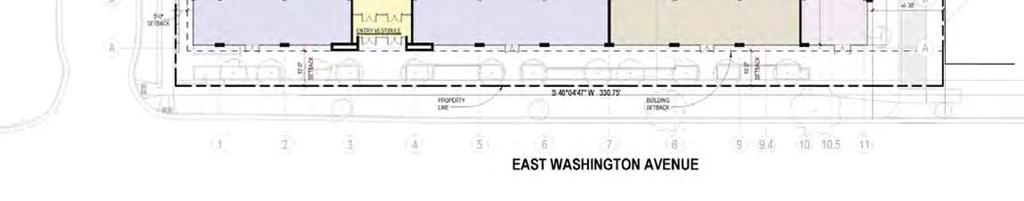
10 ACCESS POINT PHASE 1 PHASE 2 ACCESS POINT Figure 2 - Site Plan 1000 East Washington Avenue ACCESS POINT 8
11 ITE Trip Generation Rates - 8th Edition 09-Dec E. Washington Mixed Use Madison, WI Ayres Associates Phase 1 Description/ITE Code ITE Vehicle Trip Generation Rates Expected Total Generated Trips Total Distribution of Generated Trips Units (peak hours are for peak hour of adjacent street traffic unless highlighted) Units Weekday AM PM Pass-By AM In AM Out PM In PM Out Daily AM Hour PM Hour AM In AM Out Pass-By PM In PM Out Pass-By Retail 814 KSF NA 2.71 NA NA 44% 56% NA 54 NA NA Office 710 KSF % 12% 17% 83% Residential 223 DU NA % 69% 58% 42% NA Total RED Rates = Peak Hour of Adjacent Street Traffic, One Hour between 7 and 9 a.m. or 4 and 6 p.m. Green Rates = Peak Hour of Generator - (no peak rate for the rush hour of adjacent street traffic) NA = Not Available KSF 2 = Units of 1,000 square feet DU = Dwelling Unit Figure 3 - Trip Generation 1000 East Washington Avenue 9
12 E Mifflin St N Brearly St N Ingersoll St Curtis Ct E Washington Ave Figure 4 - Existing Traffic Control & Geometrics 1000 East Washington Avenue Feet 10
13 Figure5aIntersectionLevelofServiceAnalysisWeekdayAMPeakHour DevelopmentScenario EMifflinSt&NBrearly StExisting EMifflinSt&NBrearly StDeveloped EMifflinSt&N IngersollStExisting EMifflinSt&N IngersollSt Developed EWashingtonAve& BrearlySt Existing EWashingtonAve& BrearlySt Developed EWashingtonAve& IngersollSt Existing EWashingtonAve& IngersollSt Developed EWashingtonAve& IngersollSt Improved Traffic Control Intersection Levelof Service Southeastbound Northwestbound Northeastbound LT TH RT LT TH RT LT TH RT LT TH RT NBrearlySt NBrearlySt EMifflinSt EMifflinSt Stop A B B B B B B A A A A A A 2Way NBrearlySt NBrearlySt EMifflinSt EMifflinSt Stop A B B B B B B A A A A A A 2Way NIngersollSt NIngersollSt EMifflinSt EMifflinSt Stop A A A A A A A B B B B B B 2Way NIngersollSt NIngersollSt EMifflinSt EMifflinSt Stop A A A A A A A B B B B B B 2Way NBrearlySt SBrearlySt EWashingtonAve EWashingtonAve Stop A F C F A A E A A 2Way NBrearlySt SBrearlySt EWashingtonAve EWashingtonAve Stop A F C F A A E A A 2Way NIngersollSt SIngersollSt EWashingtonAve EWashingtonAve Traffic B D D D D D D C B A A B A Signal NIngersollSt SIngersollSt EWashingtonAve EWashingtonAve Traffic B E E E D D A F B A A B A Signal # NIngersollSt SIngersollSt EWashingtonAve EWashingtonAve Traffic B D D D D D A F B A A A A Signal # #95thpercentilevolumeexceedscapacity;queuemaybelonger. Key: Intersection IntersectionLOS AverageDelay (seconds) Southwestbound Lane LaneLOS ControlDelay(seconds) QueueLength95thPercentile(vehicles) 11
14 Figure5bIntersectionLevelofServiceAnalysisWeekdayPMPeakHour DevelopmentScenario EMifflinSt&NBrearly StExisting EMifflinSt&NBrearly StDeveloped EMifflinSt&N IngersollStExisting EMifflinSt&N IngersollSt Developed EWashingtonAve& BrearlySt Existing EWashingtonAve& BrearlySt Developed EWashingtonAve& IngersollSt Existing EWashingtonAve& IngersollSt Developed EWashingtonAve& IngersollSt Improved Traffic Control Intersection Levelof Service Southeastbound Northwestbound Northeastbound LT TH RT LT TH RT LT TH RT LT TH RT NBrearlySt NBrearlySt EMifflinSt EMifflinSt Stop A B B B B B B A A A A A A 2Way NBrearlySt NBrearlySt EMifflinSt EMifflinSt Stop A B B B B B B A A A A A A 2Way NIngersollSt NIngersollSt EMifflinSt EMifflinSt Stop B A A A A A A C C C B B B 2Way NIngersollSt NIngersollSt EMifflinSt EMifflinSt Stop B A A A A A A C C C B B B 2Way NBrearlySt SBrearlySt EWashingtonAve EWashingtonAve Stop A C F D A A F A A 2Way NBrearlySt SBrearlySt EWashingtonAve EWashingtonAve Stop B D F D A A F A A 2Way NIngersollSt SIngersollSt EWashingtonAve EWashingtonAve Traffic C E E E D D D B D A B A A Signal # NIngersollSt SIngersollSt EWashingtonAve EWashingtonAve Traffic D F F F E E D B D A B A A Signal # 7.3# 7.3# # NIngersollSt SIngersollSt EWashingtonAve EWashingtonAve Traffic C E D D E E D B D A B A A Signal # #95thpercentilevolumeexceedscapacity;queuemaybelonger. Key: Intersection IntersectionLOS AverageDelay (seconds) Southwestbound Lane LaneLOS ControlDelay(seconds) QueueLength95thPercentile(vehicles) 12
15 Land Use (ITE Code) Parking Generation Parking Spaces ITE Units No of Units Spaces/Unit Parking Spaces Spaces/Unit Parking Spaces per Code Auto Spaces Bike Spaces Parking Spaces Provided Auto Provided Bike Retail (880) KSF* per 400 sf Office (701) KSF* per 400 sf Residential (221) DU** per unit On-Street Total * 1000 square feet Figure 6 - Parking Demand Table 1000 East Washington Avenue 13
16 2, 5 2 N Paterson Street 2 2, 5 S Paterson Street 4, 7 Rutledge Street 2, 5, 10, 27, 28 2, 5, 10, 27, E Gorham Street E Johnson Street Norris Court E Dayton Street N Brearly Street N Blair Street N Blount Street N Few Street N Ingersoll Street N Baldwin Street N Franklin Street E Mifflin Street Curtis Court N Livingston Street 6 6, 14, 15, 25, 27, 29, 37, 56, 57 E Washington Avenue S Livingston Street S Blair Street E Main Street S Baldwin Street S Ingersoll Street S Brearly Street Railroad Street S Franklin Street 10, 38 Williamson Street S Blount Street S Few Street 3, 4, 10, 38 Jenifer Street E Wilson Street E Wilson Street Figure 7 - Existing Daytime Transit Service 1000 East Washington Avenue Legend Project Spaight Street E Washington Avenue Harvey Terrace Bus Routes - Weekdays Bus Routes - Weekends 7 Bus Routes - UW Academic Year Route Number Feet 14
17 2, 5 2, 5 2 N Livingston Street N Paterson Street 2 2, 5 2, 5 S Paterson Street 3, 4 4, 7 Rutledge Street E Gorham Street E Johnson Street Norris Court E Dayton Street N Brearly Street N Blair Street N Blount Street N Few Street N Ingersoll Street N Baldwin Street N Franklin Street E Mifflin Street Curtis Court E Washington Avenue 6 6 S Livingston Street S Blair Street E Main Street S Baldwin Street S Ingersoll Street S Brearly Street Railroad Street S Franklin Street Williamson Street S Blount Street S Few Street Jenifer Street E Wilson Street E Wilson Street Figure 8 - Existing Evening Transit Service 1000 East Washington Avenue Legend Project Spaight Street E Washington Avenue Harvey Terrace Bus Routes - Weekdays Bus Routes - Weekends 7 Bus Routes - UW Academic Year Route Number Feet 15
18 N Brearly Street N Ingersoll Street E Dayton Street 21 X X X 20 8 X 21 N Few Street E Mifflin Street X X X 13 Curtis Court X X X E Washington Avenue E Washington Avenue 44 S Ingersoll Street 6 11 X S Brearly Street 20 E Main Street Figure 9 - Parking Spaces by Block Face 1000 East Washington Avenue Feet 16 N Paterson Street S Paterson Street
19 EAST - WEST Mifflin Street 2581 North South Brearly St Brearly St & Mifflin St - Motor Vehicles Control: N/S Stop PM Peak from North (southbound) from East (westbound) from South (northbound) from West (eastbound) Intersxn Start Time Left Thru Right Total Left Thru Right Total Left Thru Right Total Left Thru Right Total Total 4:00 PM :15 PM :30 PM :45 PM :00 PM :15 PM :30 PM :45 PM AM Peak from North (southbound) from East (westbound) from South (northbound) from West (eastbound) Intersxn Start Time Left Thru Right Total Left Thru Right Total Left Thru Right Total Left Thru Right Total Total 7:00 AM :15 AM :30 AM :45 AM :00 AM :15 AM :30 AM :45 AM Peak Hour from North (southbound) from East (westbound) from South (northbound) from West (eastbound) Left Thru Right Total Left Thru Right Total Left Thru Right Total Left Thru Right Total 4:30-5: :15-8: from North East South West Total Approach Peak Hour Factor PM Peak sb wb nb eb from North East South West 4:30 PM PM Peak :45 PM AM Peak :00 PM :15 PM AM Peak sb wb nb eb 7:30 AM :45 AM :00 AM :15 AM SAA Design Group Madison College TIA Brearly & Mifflin - M. Vehicles Traffic Counts
20 EAST - WEST Mifflin Street 2581 North South Ingersoll St Ingersoll St & Mifflin St - Motor Vehicles Control: E/W Stop PM Peak from North (southbound) from East (westbound) from South (northbound) from West (eastbound) Intersxn Start Time Left Thru Right Total Left Thru Right Total Left Thru Right Total Left Thru Right Total Total 4:00 PM :15 PM :30 PM :45 PM :00 PM :15 PM :30 PM :45 PM AM Peak from North (southbound) from East (westbound) from South (northbound) from West (eastbound) Intersxn Start Time Left Thru Right Total Left Thru Right Total Left Thru Right Total Left Thru Right Total Total 7:00 AM :15 AM :30 AM :45 AM :00 AM :15 AM :30 AM :45 AM Peak Hour from North (southbound) from East (westbound) from South (northbound) from West (eastbound) Left Thru Right Total Left Thru Right Total Left Thru Right Total Left Thru Right Total 4:30-5: :15-8: from North East South West Total Approach Peak Hour Factor PM Peak sb wb nb eb from North East South West 4:30 PM PM Peak :45 PM AM Peak :00 PM :15 PM AM Peak sb wb nb eb 7:30 AM :45 AM :00 AM :15 AM SAA Design Group Madison College TIA Ingersoll & Mifflin - M. Vehicl Traffic Counts
21 EAST - WEST Mifflin Street 2581 North South Brearly St Brearly St & Mifflin St - Bicycles Control: N/S Stop PM Peak from North (southbound) from East (westbound) from South (northbound) from West (eastbound) Intersxn Start Time Left Thru Right Total Left Thru Right Total Left Thru Right Total Left Thru Right Total Total 4:00 PM :15 PM :30 PM :45 PM :00 PM :15 PM :30 PM :45 PM AM Peak from North (southbound) from East (westbound) from South (northbound) from West (eastbound) Intersxn Start Time Left Thru Right Total Left Thru Right Total Left Thru Right Total Left Thru Right Total Total 7:00 AM :15 AM :30 AM :45 AM :00 AM :15 AM :30 AM :45 AM Peak Hour from North (southbound) from East (westbound) from South (northbound) from West (eastbound) Left Thru Right Total Left Thru Right Total Left Thru Right Total Left Thru Right Total 4:30-5: :15-8: from North East South West Total Approach Peak Hour Factor PM Peak sb wb nb eb from North East South West 4:30 PM PM Peak :45 PM AM Peak :00 PM :15 PM AM Peak sb wb nb eb 7:30 AM :45 AM :00 AM :15 AM SAA Design Group Madison College TIA Brearly & Mifflin - Bicycles Traffic Counts
22 EAST - WEST Mifflin Street 2581 North South Ingersoll St Ingersoll St & Mifflin St - Bicycles Control: E/W Stop PM Peak from North (southbound) from East (westbound) from South (northbound) from West (eastbound) Intersxn Start Time Left Thru Right Total Left Thru Right Total Left Thru Right Total Left Thru Right Total Total 4:00 PM :15 PM :30 PM :45 PM :00 PM :15 PM :30 PM :45 PM AM Peak from North (southbound) from East (westbound) from South (northbound) from West (eastbound) Intersxn Start Time Left Thru Right Total Left Thru Right Total Left Thru Right Total Left Thru Right Total Total 7:00 AM :15 AM :30 AM :45 AM :00 AM :15 AM :30 AM :45 AM Peak Hour from North (southbound) from East (westbound) from South (northbound) from West (eastbound) Left Thru Right Total Left Thru Right Total Left Thru Right Total Left Thru Right Total 4:30-5: :15-8: from North East South West Total Approach Peak Hour Factor PM Peak sb wb nb eb from North East South West 4:30 PM PM Peak :45 PM AM Peak :00 PM :15 PM AM Peak sb wb nb eb 7:30 AM :45 AM :00 AM :15 AM SAA Design Group Madison College TIA Ingersoll & Mifflin - Bicycles Traffic Counts
23 1000 E. Washington Trip Distribution Gravity Model Distribution East West Street ADT % In Out In Out E. Washington 51,000 89% 30% 30% 45% 25% Ingersoll 3,500 6% 10% 10% Brearly 700 2% 10% 30% Mifflin 2,000 3% 5% 5% Total 57, % 100% 100%
24 Intersection Traffic Volume Report Count Basics Version 2013.J4.1 Page 1 of 11 Start Date: Tuesday, September 09, 2014 Weekday Schools in Session Total Number of Hours Counted: 3 Non Holiday No Special Events Base Information, Observed (3) Hour and Estimated (24) Hour Volume Summaries Intersection of: E. Washington and Ingersoll Site Information Municipality City of Madison County Dane WisDOT Region SE Traffic Control Traffic Signal Roadway Names North Direction North Leg Ingersoll East Leg E. Washington South Leg Ingersoll West Leg E. Washington Special Considerations Schools In Session Holidays None Special Events None Special Pedestrians Observed Pre school children None Elementry school age children None Visually impaired (white cane/helper dog) None Elderly/disabled (except wheelchairs) None Wheelchairs/electric scooters None Other (describe) None None Observed 3 Hour Volume Summary Count Information Hrs Counted: 7:00 AM 8:30 AM and 4:00 PM 5:30 PM 1st Day of Count Tuesday, September 09, 2014 Weather AM Peak Period Tuesday, September 09, 2014 Clear & Dry Midday Peak Period PM Peak Period Tuesday, September 09, 2014 Clear & Dry Calculated Peak Hours AM 7:15 8:15am MD PM 4:15 5:15pm Peak Hours Selected for Analysis AM 7:15 8:15am MD PM 4:15 5:15pm Daily/Seasonal Adjustment Group Other Count Expansion Group Other Daily/Seasonal Adjustment Factor #N/A Count Expansion Factor #N/A Company Name TranSmart Technologies, Inc. Manual Adj Observers AM Peak Period Allen Nyberg, Mitch Seholm Midday Peak Period PM Peak Period Allen Nyberg, Mitch Seholm Comments Version 2011.J DOT Factors OBSERVED 3 Ingersoll TOTAL ENTERING VOLUME HOUR VOLUMES PED: BIKE: 25 14, PED: 140 PED: North BIKE: BIKE: PED: BIKE: 32 Ingersoll E. Washington 13, Total Entering Hourly Volume ,561 E. Washington Estimated 24 Hour AADT E. Washington ESTIMATED Ingersoll 24 HOUR AADT #N/A #N/A #N/A #N/A #N/A #N/A #N/A #N/A North #N/A #N/A #N/A Daily/Seasonal Factor #N/A #N/A #N/A #N/A #N/A #N/A Count Expansion Factor #N/A #N/A Manual Adjustment Factor #N/A Total 24 Hr Expansion Factor #N/A Ingersoll #N/A #N/A #N/A TOTAL ENTERING VOLUME #N/A #N/A #N/A #N/A #N/A #N/A #N/A #N/A E. Washington
25 Intersection Traffic Volume Report Peak Hour Volume Graphical Summary E. Washington and Ingersoll Count Basics Start Date: Tuesday, September 09, 2014 Total Number of Hours Counted: 3 Weekday Non Holiday All Motor Vehicles Page 2 of 11 Schools in Session No Special Events AM Peak Hour Summary AM PEAK HOUR Ingersoll TOTAL ENTERING VOLUME 7:15 8:15am PED: BIKE: 13 4,762 Tuesday, September 09, PED: 48 PED: North BIKE: BIKE: PED: BIKE: 5 Ingersoll E. Washington 4,511 1,511 3,032 4,575 E. Washington Midday (MD) Peak Hour Summary E. Washington MD PEAK HOUR Ingersoll TOTAL ENTERING VOLUME PED: 0 0 BIKE: 0 0 N/A PED: 0 PED: North 0 BIKE: 0 0 BIKE: PED: 0 0 BIKE: 0 Ingersoll E. Washington PM Peak Hour Summary PM PEAK HOUR Ingersoll TOTAL ENTERING VOLUME 4:15 5:15pm PED: BIKE: 7 5,124 Tuesday, September 09, PED: 46 PED: North BIKE: BIKE: PED: BIKE: 13 Ingersoll E. Washington 4, ,898 E. Washington
26 Intersection Traffic Volume Report Peak Hour Volume Summary E. Washington and Ingersoll Count Basics Page 3 of 11 Start Date: Tuesday, September 09, 2014 Weekday Schools in Session Total Number of Hours Counted: 3 Non Holiday No Special Events All Motor Vehicles Peak Hour Volumes, Truck Percentages, and PHFs Tuesday, September 09, 2014 From North From East From South From West AM Peak Hour Ingersoll E. Washington Ingersoll E. Washington Start Time Right Thru Left U Tn Total Right Thru Left U Tn Total Right Thru Left U Tn Total Right Thru Left U Tn Total Totals 7:15 AM :30 AM :45 AM :00 AM Peak Hour Volume Rounded Hourly Volume % Single Unit Trucks % Heavy Trucks % Trucks (Total) Peak Hour Factor (PHF) AM Peak Hour N/A From North From East From South From West MD Peak Hour Ingersoll E. Washington Ingersoll E. Washington Start Time Right Thru Left U Tn Total Right Thru Left U Tn Total Right Thru Left U Tn Total Right Thru Left U Tn Total Totals 12:00 PM :15 PM :30 PM :45 PM Peak Hour Volume Rounded Hourly Volume % Single Unit Trucks % Heavy Trucks % Trucks (Total) Peak Hour Factor (PHF) Midday (MD) Peak Hour Tuesday, September 09, 2014 From North From East From South From West PM Peak Hour Ingersoll E. Washington Ingersoll E. Washington Start Time Right Thru Left U Tn Total Right Thru Left U Tn Total Right Thru Left U Tn Total Right Thru Left U Tn Total Totals 4:15 PM :30 PM :45 PM :00 PM Peak Hour Volume Rounded Hourly Volume % Single Unit Trucks % Heavy Trucks % Trucks (Total) Peak Hour Factor (PHF) PM Peak Hour Peak Hour Pedestrian and Bicyclist Volumes Pedestrians and Bicyclists Crossing North Approach Crossing East Approach Crossing South Approach Crossing West Approach Total Ped & Ingersoll E. Washington Ingersoll E. Washington Bike 15 Minute Start Time Pedestrian Bicyclist Total Pedestrian Bicyclist Total Pedestrian Bicyclist Total Pedestrian Bicyclist Total Volume 7:15 AM :30 AM :45 AM :00 AM Total AM MD PM 12:00 PM :15 PM :30 PM :45 PM Total :15 PM :30 PM :45 PM :00 PM Total
27 Intersection Traffic Volume Report Hourly Volume Summary Motor Vehicle Data E. Washington and Ingersoll Count Basics Page 4 of 11 Start Date: Tuesday, September 09, 2014 Weekday Schools in Session Total Number of Hours Counted: 3 Non Holiday No Special Events All Motor Vehicles One Hour Motor Vehicle Data One Hour From North From East From South From West Total Directional Time Period Ingersoll E. Washington Ingersoll E. Washington Vehicle Volume Totals Start Time Right Thru Left U Tn Total Right Thru Left U Tn Total Right Thru Left U Tn Total Right Thru Left U Tn Total Volume E/W N/S 6:00 AM :00 AM :00 AM :00 AM :00 AM :00 AM :00 PM :00 PM :00 PM :00 PM :00 PM :00 PM :00 PM :00 PM :00 PM :00 PM Totals AM MD PM 6000 Graphical Summary of Hourly Volumes All Motor Vehicles Southbound Approach Westbound Approach Northbound Approach Eastbound Approach Total Entering Vehicle Volume (Bar Chart) Entering Vehicle Volume By Approach (Line Chart) 0 6:00 AM 7:00 AM 8:00 AM 9:00 AM 10:00 AM 11:00 AM 12:00 PM 1:00 PM 2:00 PM 3:00 PM 4:00 PM 5:00 PM 6:00 PM 7:00 PM 8:00 PM 9:00 PM One Hour Time Period Start Time (For example, 6am represents volumes from 6am to 7am) 0
28 Intersection Traffic Volume Report 15 Minute Motor Vehicle Data E. Washington and Ingersoll Count Basics Page 5 of 11 Start Date: Tuesday, September 09, 2014 Weekday Schools in Session Total Number of Hours Counted: 3 Non Holiday No Special Events All Motor Vehicles 15 Minute Motor Vehicle Data 15 Minute Time Period From North Ingersoll From East E. Washington From South Ingersoll From West E. Washington 15 Min Hourly Start Time Right Thru Left U Tn Total Right Thru Left U Tn Total Right Thru Left U Tn Total Right Thru Left U Tn Total Totals Sum PHF 6:00 AM :15 AM :30 AM :45 AM :00 AM :15 AM :30 AM :45 AM :00 AM :15 AM :30 AM :45 AM :00 AM :15 AM :30 AM :45 AM :00 AM :15 AM :30 AM :45 AM :00 AM :15 AM :30 AM :45 AM :00 PM :15 PM :30 PM :45 PM :00 PM :15 PM :30 PM :45 PM :00 PM :15 PM :30 PM :45 PM :00 PM :15 PM :30 PM :45 PM :00 PM :15 PM :30 PM :45 PM :00 PM :15 PM :30 PM :45 PM :00 PM :15 PM :30 PM :45 PM :00 PM :15 PM :30 PM :45 PM :00 PM :15 PM :30 PM :45 PM :00 PM :15 PM :30 PM :45 PM Totals AM Peak Period Midday Peak Period PM Peak Period Peak Hour All Vehicle Volume Summary Hourly From North From East From South From West Total Time Period Ingersoll E. Washington Ingersoll E. Washington Hourly Start Time Right Thru Left U Tn Total Right Thru Left U Tn Total Right Thru Left U Tn Total Right Thru Left U Tn Total Volume PHF AM 7:15 AM MD 12:00 PM PM 4:15 PM
29 Intersection Traffic Volume Report Weekday Schools in Session 15 Minute Automobile Data E. Washington and Ingersoll Count Basics Page 6 of 11 Start Date: Tuesday, September 09, 2014 Total Number of Hours Counted: 3 Non Holiday No Special Events Automobiles (Cars, Light Trucks, & Motorcycles) 15 Minute Automobile Data 15 Minute Time Period From North Ingersoll From East E. Washington From South Ingersoll From West E. Washington 15 Min Hourly Start Time Right Thru Left U Tn Total Right Thru Left U Tn Total Right Thru Left U Tn Total Right Thru Left U Tn Total Totals Sum 6:00 AM :15 AM :30 AM :45 AM :00 AM :15 AM :30 AM :45 AM :00 AM :15 AM :30 AM :45 AM :00 AM :15 AM :30 AM :45 AM :00 AM :15 AM :30 AM :45 AM :00 AM :15 AM :30 AM :45 AM :00 PM :15 PM :30 PM :45 PM :00 PM :15 PM :30 PM :45 PM :00 PM :15 PM :30 PM :45 PM :00 PM :15 PM :30 PM :45 PM :00 PM :15 PM :30 PM :45 PM :00 PM :15 PM :30 PM :45 PM :00 PM :15 PM :30 PM :45 PM :00 PM :15 PM :30 PM :45 PM :00 PM :15 PM :30 PM :45 PM :00 PM :15 PM :30 PM :45 PM Totals AM Peak Period Midday Peak Period PM Peak Period Peak Hour Automobile Volume Summary Hourly From North From East From South From West Total Time Period Ingersoll E. Washington Ingersoll E. Washington Hourly Start Time Right Thru Left U Tn Total Right Thru Left U Tn Total Right Thru Left U Tn Total Right Thru Left U Tn Total Volume AM 7:15 AM MD 12:00 PM PM 4:15 PM
30 Intersection Traffic Volume Report Weekday Schools in Session 15 Minute Single Unit (SU) Truck & Bus Data E. Washington and Ingersoll Count Basics Page 7 of 11 Start Date: Tuesday, September 09, 2014 Total Number of Hours Counted: 3 Non Holiday No Special Events Single Unit (SU) Trucks & Buses 15 Minute Single Unit (SU) Truck & Bus Data 15 Minute Time Period From North Ingersoll From East E. Washington From South Ingersoll From West E. Washington 15 Min Hourly Start Time Right Thru Left U Tn Total Right Thru Left U Tn Total Right Thru Left U Tn Total Right Thru Left U Tn Total Totals Sum 6:00 AM :15 AM :30 AM :45 AM :00 AM :15 AM :30 AM :45 AM :00 AM :15 AM :30 AM :45 AM :00 AM :15 AM :30 AM :45 AM :00 AM :15 AM :30 AM :45 AM :00 AM :15 AM :30 AM :45 AM :00 PM :15 PM :30 PM :45 PM :00 PM :15 PM :30 PM :45 PM :00 PM :15 PM :30 PM :45 PM :00 PM :15 PM :30 PM :45 PM :00 PM :15 PM :30 PM :45 PM :00 PM :15 PM :30 PM :45 PM :00 PM :15 PM :30 PM :45 PM :00 PM :15 PM :30 PM :45 PM :00 PM :15 PM :30 PM :45 PM :00 PM :15 PM :30 PM :45 PM Totals AM Peak Period Midday Peak Period PM Peak Period Peak Hour Single Unit (SU) Truck & Buses Volume Summary Hourly From North From East From South From West Total Time Period Ingersoll E. Washington Ingersoll E. Washington Hourly Start Time Right Thru Left U Tn Total Right Thru Left U Tn Total Right Thru Left U Tn Total Right Thru Left U Tn Total Volume AM 7:15 AM MD 12:00 PM PM 4:15 PM
31 Intersection Traffic Volume Report 15 Minute Semi Truck Data E. Washington and Ingersoll Count Basics Page 8 of 11 Start Date: Tuesday, September 09, 2014 Weekday Schools in Session Total Number of Hours Counted: 3 Non Holiday No Special Events Semi Trucks 15 Minute Semi Truck Data 15 Minute Time Period From North Ingersoll From East E. Washington From South Ingersoll From West E. Washington 15 Min Hourly Start Time Right Thru Left U Tn Total Right Thru Left U Tn Total Right Thru Left U Tn Total Right Thru Left U Tn Total Totals Sum 6:00 AM :15 AM :30 AM :45 AM :00 AM :15 AM :30 AM :45 AM :00 AM :15 AM :30 AM :45 AM :00 AM :15 AM :30 AM :45 AM :00 AM :15 AM :30 AM :45 AM :00 AM :15 AM :30 AM :45 AM :00 PM :15 PM :30 PM :45 PM :00 PM :15 PM :30 PM :45 PM :00 PM :15 PM :30 PM :45 PM :00 PM :15 PM :30 PM :45 PM :00 PM :15 PM :30 PM :45 PM :00 PM :15 PM :30 PM :45 PM :00 PM :15 PM :30 PM :45 PM :00 PM :15 PM :30 PM :45 PM :00 PM :15 PM :30 PM :45 PM :00 PM :15 PM :30 PM :45 PM Totals AM Peak Period Midday Peak Period PM Peak Period Peak Hour Semi Truck Volume Summary Hourly From North From East From South From West Total Time Period Ingersoll E. Washington Ingersoll E. Washington Hourly Start Time Right Thru Left U Tn Total Right Thru Left U Tn Total Right Thru Left U Tn Total Right Thru Left U Tn Total Volume AM 7:15 AM MD 12:00 PM PM 4:15 PM
32 Intersection Traffic Volume Report Weekday Schools in Session 15 Minute Heavy Vehicle Data E. Washington and Ingersoll Count Basics Page 9 of 11 Start Date: Tuesday, September 09, 2014 Total Number of Hours Counted: 3 Non Holiday No Special Events Heavy Vehicles (Single Unit Trucks, Buses & Semi Trucks) 15 Minute Heavy Vehicle Data 15 Minute Time Period From North Ingersoll From East E. Washington From South Ingersoll From West E. Washington 15 Min Hourly Start Time Right Thru Left U Tn Total Right Thru Left U Tn Total Right Thru Left U Tn Total Right Thru Left U Tn Total Totals Sum 6:00 AM :15 AM :30 AM :45 AM :00 AM :15 AM :30 AM :45 AM :00 AM :15 AM :30 AM :45 AM :00 AM :15 AM :30 AM :45 AM :00 AM :15 AM :30 AM :45 AM :00 AM :15 AM :30 AM :45 AM :00 PM :15 PM :30 PM :45 PM :00 PM :15 PM :30 PM :45 PM :00 PM :15 PM :30 PM :45 PM :00 PM :15 PM :30 PM :45 PM :00 PM :15 PM :30 PM :45 PM :00 PM :15 PM :30 PM :45 PM :00 PM :15 PM :30 PM :45 PM :00 PM :15 PM :30 PM :45 PM :00 PM :15 PM :30 PM :45 PM :00 PM :15 PM :30 PM :45 PM Totals AM Peak Period Midday Peak Period PM Peak Period Peak Hour Heavy Vehicle Volume Summary Hourly From North From East From South From West Total Time Period Ingersoll E. Washington Ingersoll E. Washington Hourly Start Time Right Thru Left U Tn Total Right Thru Left U Tn Total Right Thru Left U Tn Total Right Thru Left U Tn Total Volume AM 7:15 AM MD 12:00 PM PM 4:15 PM
WEBER ROAD RESIDENTIAL DEVELOPMENT Single Family Residential Project
 WEBER ROAD RESIDENTIAL DEVELOPMENT Single Family Residential Project WEBER ROAD RESIDENTIAL DEVELOPMENT TRAFFIC IMPACT STUDY TABLE OF CONTENTS 1.0 Executive Summary Page 2.0 Introduction 2.1 DEVELOPMENT
MEMORANDUM. The study area of the analysis was discussed with City staff and includes the following intersections:
 MEMORANDUM DATE: JULY 6, 2012 TO: FROM: RE: CC: MELANIE KNIGHT BRAD BYVELDS/ JENNIFER LUONG 1050 SOMERSET STREET PRELIMINARY TRAFFIC ANALYSIS OUR FILE NO. 111152 NEIL MALHOTRA The purpose of this memo
CVS Derwood. Local Area Transportation Review
 CVS Derwood Montgomery County, Maryland May 27, 2016 Local Area Transportation Review Prepared for: JC Bar Properties, Inc. Steve Fleming, PE 415 Fallowfield Road, Suite 301 Camp Hill, Pennsylvania 17011
Focused Traffic Analysis for the One Lincoln Park Project
 September 15, 2015 Mr. Bill Johnson Coldwell Banker 511 Sir Francis Drake Boulevard Greenbrae, CA 94904 Focused Traffic Analysis for the One Lincoln Park Project Dear Mr. Johnson; As requested, W-Trans
TRAFFIC IMPACT STUDY MANUFACTURING COMPANY
 TRAFFIC IMPACT STUDY For MANUFACTURING COMPANY Prepared For: Airway Heights, WA Prepared By: SUNBURST ENGINEERING, P. S. 4310 S. Ball Dr. Veradale, WA 99037 April, 2013 TRAFFIC IMP ACT STUDY Manufacturing
Market Street PDP. Nassau County, Florida. Transportation Impact Analysis. VHB/Vanasse Hangen Brustlin, Inc. Nassau County Growth Management
 Transportation Impact Analysis Market Street PDP Nassau County, Florida Submitted to Nassau County Growth Management Prepared for TerraPointe Services, Inc. Prepared by VHB/Vanasse Hangen Brustlin, Inc.
SUBJECT: SUMMARY OF FINDINGS. October 29, Mr. Carter Redish Carter Group Architects, Inc S. El Camino Real, Suite F San Clemente, CA 92672
 October 29, 2018 Mr. Carter Redish Carter Group Architects, Inc. 1810 S. El Camino Real, Suite F San Clemente, CA 92672 SUBJECT: CANYON STEEL FOCUSED TRAFFIC IMPACT ANALYSIS Dear Mr. Carter Redish: Urban
JEP John E. Jack Pflum, P.E. Consulting Engineering 7541 Hosbrook Road, Cincinnati, OH Telephone:
 JEP John E. Jack Pflum, P.E. Consulting Engineering 7541 Hosbrook Road, Cincinnati, OH 45243 Email: jackpflum1@gmail.com Telephone: 513.919.7814 MEMORANDUM REPORT Traffic Impact Analysis Proposed Soccer
The Highline Development Traffic Impact Study
 The Highline Development Traffic Impact Study Columbia Falls, Montana Prepared For: TD&H Engineering 450 Corporate Drive, Suite 101 Kalispell, MT 59901 June, 2018 130 South Howie Street Helena, Montana
Trip Generation Study: A 7-Eleven Gas Station with a Convenience Store Land Use Code: 945
 Trip Generation Study: A 7-Eleven Gas Station with a Convenience Store Land Use Code: 945 Introduction The Brigham Young University Institute of Transportation Engineers student chapter (BYU ITE) completed
MEMORANDUM. Trip Generation Analysis
 MEMORANDUM To: RMC Architects From: Matthew Palmer, PE Subject: Trip Generation, Parking Analysis & Level of Service Project: Port of Everett, GTC #13-053 Date: August 25, 2014 The trip generation and
Traffic Impact Analysis. for the STARBUCKS STORE. Located at 9900 BALBOA BOULEVARD. Submitted to CITY OF LOS ANGELES. January 2017.
 Traffic Impact Analysis for the STARBUCKS STORE Located at 9900 BALBOA BOULEVARD Submitted to CITY OF LOS ANGELES January 2017 Submitted By January 5, 2017 Ken A. Aitchison, P.E. Transportation Engineering
PLAZA MEXICO RESIDENCES
 PLAZA MEXICO RESIDENCES TRAFFIC STUDY PREPARED FOR: 3000 E. IMPERIAL, LLC. 6940 Beach Boulevard, D-501 Buena Park, California 90621 PREPARED BY: OCTOBER 5, 2017 translutions the transportatio n solutions
6711 LEE HIGHWAY TRAFFIC IMPACT STUDY ARLINGTON, VIRGINIA
 6711 TRAFFIC IMPACT STUDY ARLINGTON, VIRGINIA Prepared for: NVR, Inc. Prepared by: Wells + Associates, Inc. Michael J. Workosky, PTP, TOPS, TSOS John J. Andrus William L. Zeid, PE 703.917.6620 May 4, 2017
TRAFFIC IMPACT STUDY. Platte Canyon Villas Arapahoe County, Colorado (Arapahoe County Case Number: Z16-001) For
 For") TRAFFIC IMPACT STUDY For Platte Canyon Villas Arapahoe County, Colorado (Arapahoe County Case Number: Z16-001) February 2015 Revised: August 2015 April 2016 July 2016 September 2016 Prepared for: KB Home
TRAFFIC IMPACT STUDY For Platte Canyon Villas Arapahoe County, Colorado (Arapahoe County Case Number: Z16-001) February 2015 Revised: August 2015 April 2016 July 2016 September 2016 Prepared for: KB Home
2014 Data Collection Project ITE Western District
 2014 Data Collection Project ITE Western District Project Completed By: Oregon State University OSU ITE Student Chapter 101 Kearney Hall Corvallis, OR 97331 Student Coordinator: Sarah McCrea (OSU ITE Student
Travel Demand Management Plan
 Travel Demand Management Plan Tryg s & Apartment Building 8 West Lake Street Minneapolis, MN AUTHORIZED PROPERTY REPRESENTATIVE: By Dated: Mr. Johnny Carlson Trammell Crow Chicago Development, Inc. 5 South
California Urban Infill Trip Generation Study. Jim Daisa, P.E.
 California Urban Infill Trip Generation Study Jim Daisa, P.E. What We Did in the Study Develop trip generation rates for land uses in urban areas of California Establish a California urban land use trip
NATHAN HALE HIGH SCHOOL PARKING AND TRAFFIC ANALYSIS. Table of Contents
 Parking and Traffic Analysis Seattle, WA Prepared for: URS Corporation 1501 4th Avenue, Suite 1400 Seattle, WA 98101-1616 Prepared by: Mirai Transportation Planning & Engineering 11410 NE 122nd Way, Suite
TRAFFIC IMPACT STUDY
 TRAFFIC IMPACT STUDY TERRE HAUTE CONVENTION CENTER WABASH AVENUE & 9 TH STREET TERRE HAUTE, INDIANA PREPARED FOR 8365 Keystone Crossing, Suite 201 Indianapolis, IN 46240 Phone: (317) 202-0864 Fax: (317)
Trip and Parking Generation Study of Orem Fitness Center-Abstract
 Trip and Parking Generation Study of Orem Fitness Center-Abstract The Brigham Young University Institute of Transportation Engineers student chapter (BYU ITE) completed a trip and parking generation study
TRAFFIC STUDY FOR THE GAFFEY POOL PROJECT LOS ANGELES, CALIFORNIA CITY OF LOS ANGELES, BUREAU OF ENGINEERING OCTOBER 2013 PREPARED FOR PREPARED BY
 TRAFFIC STUDY FOR THE GAFFEY POOL PROJECT LOS ANGELES, CALIFORNIA OCTOBER 2013 PREPARED FOR CITY OF LOS ANGELES, BUREAU OF ENGINEERING PREPARED BY DRAFT TRAFFIC STUDY FOR THE GAFFEY POOL PROJECT October
Appendix I: Traffic Study
 City of Fontana Sierra Lakes Commerce Center Draft EIR Appendix I: Traffic Study FirstCarbon Solutions H:\Client (PN JN)\0144\01440050\EIR\1 ADEIR\01440050 Sec99 99 Appendix Dividers.doc THIS PAGE INTENTIONALLY
Appendix BAL Baltimore, Maryland 2003 Annual Report on Freeway Mobility and Reliability
 (http://mobility.tamu.edu/mmp) Office of Operations, Federal Highway Administration Appendix BAL Baltimore, Maryland 2003 Annual Report on Freeway Mobility and Reliability This report is a supplement to:
FY 2010 Continuing i Planning Program Product Report. Local Transportation and Traffic Data. Wood-Washington-Wirt Interstate Planning Commission
 FY 2010 Continuing i Planning Program Product Report Local Transportation and Traffic Data Travel Time and Delay Data for Belpre and Marietta, Ohio Wood-Washington-Wirt Interstate Planning Commission CONTINUING
DOLLAR GENERAL PROJECT FOCUSED TRAFFIC ANALYSIS (REVISED) May 20, 2015
 May 20, 2015") DOLLAR GENERAL PROJECT FOCUSED TRAFFIC ANALYSIS (REVISED) May 20, 2015 May 20, 2015 Mr. Dan Biswas, VP of Development CJS DEVELOPMENT II, LLC 5111 North Scottsdale Road, Suite 200 Scottsdale, CA 85250
DOLLAR GENERAL PROJECT FOCUSED TRAFFIC ANALYSIS (REVISED) May 20, 2015 May 20, 2015 Mr. Dan Biswas, VP of Development CJS DEVELOPMENT II, LLC 5111 North Scottsdale Road, Suite 200 Scottsdale, CA 85250
Traffic Impact Study
 Traffic Impact Study Statham DRI One University Parkway Prepared for: Barrow County Prepared by: October 2012 Table of Contents Executive Summary i Section 1. Introduction 1 Project Description 1 Methodology
Signalized Intersections
 Signalized Intersections Kelly Pitera October 23, 2009 Topics to be Covered Introduction/Definitions D/D/1 Queueing Phasing and Timing Plan Level of Service (LOS) Signal Optimization Conflicting Operational
FINAL Traffic Report for the Proposed Golden Valley Road and Newhall Ranch Road Projects in the City of Santa Clarita, California May 5, 2005
 FINAL Traffic Report for the Proposed Golden Valley Road and Newhall Ranch Road Projects in the City of Santa Clarita, California May 5, 2005 Prepared For: EDAW, Inc. 1420 Kettner Boulevard, Suite 620
2129 NORTH MAIN STREET HOTE PROJECT ULI SHARED PARKING STUDY City of Santa Ana, California
 2129 NORTH MAIN STREET HOTE PROJECT ULI SHARED PARKING STUDY City of Santa Ana, California Prepared for: NET DEVELOPMENT COMPANY 3130 Airway Avenue Costa Mesa, CA 92626 Prepared by: RK ENGINEERING GROUP,
VHD Daily Totals. Population 14.5% change. VMT Daily Totals Suffolk 24-hour VMT. 49.3% change. 14.4% change VMT
 6.9 Suffolk 6-54 VMT Population and Travel Characteristics Population 14.5% change 2014 1,529,202 VHD Daily Totals 2014 251,060 49.3% change 2040 1,788,175 2040 374,850 VMT Daily Totals 2014 39,731,990
Appendix C Traffic Study
 Final Environmental Impact Statement Appendix C Traffic Study Schofield Generating Station Project, Hawaii October 2015 C-1 Final Environmental Impact Statement This page intentionally left blank. Schofield
FARM 1065 PORTION 1, ATLANTIS TRAFFIC IMPACT ASSESSMENT
 FARM 1065 PORTION 1, ATLANTIS TRAFFIC IMPACT ASSESSMENT February 2018 FIRST ISSUE Prepared by: JG AFRIKA (PTY) LTD Branch: Cape Town PO Box 38561 Postal code: 7430 Telephone: 021 530 1800 Email: wink@
April 10, Mr. Curt Van De Walle, City Manager City of Castle Hills 209 Lemonwood Drive Castle Hills, Texas 78213
 Mr. Curt Van De Walle, City Manager City of Castle Hills 209 Lemonwood Drive Castle Hills, Texas 78213 Subject: Revised Castle Hills BASIS Charter School Traffic Impact Analysis Review City of Castle Hills,
The Sunland Park flyover ramp is set to close the week of March 19 until early summer
 March 2, 2018 The Sunland Park flyover ramp is set to close the week of March 19 until early summer GO 10 is targeting the week of March 19 to close the Sunland Park Drive flyover entrance ramp to I 10
CONTINUING PLANNING PROGRAM LOCAL TRANSPORTATION AND TRAFFIC DATA PRODUCT REPORT [OH Corridors]
![CONTINUING PLANNING PROGRAM LOCAL TRANSPORTATION AND TRAFFIC DATA PRODUCT REPORT [OH Corridors]](/thumbs/94/120123757.jpg "CONTINUING PLANNING PROGRAM LOCAL TRANSPORTATION AND TRAFFIC DATA PRODUCT REPORT [OH Corridors]") CONTINUING PLANNING PROGRAM LOCAL TRANSPORTATION AND TRAFFIC DATA PRODUCT REPORT [OH Corridors] Travel Time and Delay Analysis for Belpre (OH) and Marietta (OH) Fiscal Year 2009 Report WOOD WASHINGTON
CONTINUING PLANNING PROGRAM LOCAL TRANSPORTATION AND TRAFFIC DATA PRODUCT REPORT [OH Corridors] Travel Time and Delay Analysis for Belpre (OH) and Marietta (OH) Fiscal Year 2009 Report WOOD WASHINGTON
TRANSPORTATION IMPACT STUDY WHEELER STREET CLOSURE
 TRANSPORTATION IMPACT STUDY WHEELER STREET CLOSURE Village of Greene, Chenango County, New York Prepared for: VILLAGE OF GREENE 49 Genesee Street Greene, NY 13778 Prepared by: LARSON DESIGN GROUP 1000
City of Hermosa Beach Beach Access and Parking Study. Submitted by. 600 Wilshire Blvd., Suite 1050 Los Angeles, CA
 City of Hermosa Beach Beach Access and Parking Study Submitted by 600 Wilshire Blvd., Suite 1050 Los Angeles, CA 90017 213.261.3050 January 2015 TABLE OF CONTENTS Introduction to the Beach Access and Parking
Date: August 3, Project #:
 To: Mr. Warren Nighan Total Athletics 128 Devon Lane Marston Mills, Massachusetts 02648 From: Randall C. Hart, Director of Transportation Planning & Engineering Kathleen Keen, EIT Date: August 3, 2016
Trip Generation Calculations
 Trip Generation Calculations A HORIZON AIR ALLEGIANT AI R EMPLOYEES Daily Trip Generation Daily Trip Generation Daily Trip Generation Directional Flights (per day): 20 Directional Flights (per day): 2.8
DOWNTOWN SUB-AREA. Final Parking Study. Prepared for: City of Bellingham. March Prepared by:
 Final Parking Study DOWNTOWN SUB-AREA Prepared for: City of Bellingham March 2013 Prepared by: 11730 118 th Avenue NE, Suite 600 Kirkland, WA 98034-7120 Phone: 425-821-3665 Fax: 425-825-8434 www.transpogroup.com
I. M. Schoeman North West University, South Africa. Abstract
 Urban Transport XX 607 Land use and transportation integration within the greater area of the North West University (Potchefstroom Campus), South Africa: problems, prospects and solutions I. M. Schoeman
January 12, Mr. Ryan Granger TMGB Wilson, LLC 2221 Health Drive SW, Suite 2200 Wyoming, Michigan 49519
 January 12, 2018 Mr. Ryan Granger TMGB Wilson, LLC 2221 Health Drive SW, Suite 2200 Wyoming, Michigan 49519 Re: Proposed Reserve at Rivertown Mixed-Use Development Updated Trip Generation and Site Driveway
HALFF 16196? TRAFFIC MANAGEMENT PLAN. Richardson ISD Aikin Elementary School Dallas, Texas North Bowser Road Richardson, Texas 75081
 30280 16196? TRAFFIC MANAGEMENT PLAN Exhibit 572B Aikin Elementary School Planned Development District No. 572 Approved City Plan Commission October20, 2016 July 12, 2016 Prepared for HALFF AVO 31586 PHO1
WOODRUFF ROAD CORRIDOR ORIGIN-DESTINATION ANALYSIS
 2018 WOODRUFF ROAD CORRIDOR ORIGIN-DESTINATION ANALYSIS Introduction Woodruff Road is the main road to and through the commercial area in Greenville, South Carolina. Businesses along the corridor have
Metro Emergency Security Operations Center (ESOC) 410 Center Street City of Los Angeles
 410 Center Street City of Los Angeles") Metro Emergency Security Operations Center (ESOC) 410 Center Street City of Los Angeles Traffic Study August 31, 2015 AECOM 515 South Flower Street, 4 th Floor Los Angeles, CA 90071 Job Number: 60323255
Metro Emergency Security Operations Center (ESOC) 410 Center Street City of Los Angeles Traffic Study August 31, 2015 AECOM 515 South Flower Street, 4 th Floor Los Angeles, CA 90071 Job Number: 60323255
Background and Planning Context 1.1 INTRODUCTION 1.2 PROJECT LOCATION
 Chapter 1: Background and Planning Context 1.1 INTRODUCTION Metro-North Commuter Railroad Company ( Metro-North or the Project Sponsor ) is proposing the construction of a new, expanded parking garage
APPENDIX. Sutter Street Bicycle Lanes Stockton, CA January 2010
 APPENDIX reet Bicycle Lanes Stockton, CA January 2010 1. Traffic count locations 2. Turning movement counts o AM PEAK - El Dorado Street at Ingram Street o PM PEAK - El Dorado Street at Ingram Street o
LIC SR INTERCHANGE OPERATIONS STUDY
 LIC SR 16 18.20 - INTERCHANGE OPERATIONS STUDY Project Summary Location SR 16 & W. Church St. Interchange Newark, Ohio Licking County PID 99478 Study Sponsor ODOT District 5 Proposed Work Add Left Turn
Brandywine Road Speed Study FINAL REPORT
 Brandywine Road Speed Study FINAL REPORT City of Albuquerque Brandywine Road Speed Study Final Report Albuquerque, New Mexico City of Albuquerque May, 2016 Brandywine Road Speed Study Final Report City
Parking Regulations Dundas Street West, from Bathurst Street to Dovercourt Road
 STAFF REPORT ACTION REQUIRED Parking Regulations Dundas Street West, from Bathurst Street to Dovercourt Road Date: October 28, 2008 To: From: Toronto and East York Community Council Director, Transportation
MnDOT Method for Calculating Measures of Effectiveness (MOE) From CORSIM Model Output
 From CORSIM Model Output") MnDOT Method for Calculating Measures of Effectiveness (MOE) From CORSIM Model Output Rev. April 29, 2005 MnDOT Method for Calculating Measures of Effectiveness (MOE) From CORSIM Model Output Table of
MnDOT Method for Calculating Measures of Effectiveness (MOE) From CORSIM Model Output Rev. April 29, 2005 MnDOT Method for Calculating Measures of Effectiveness (MOE) From CORSIM Model Output Table of
Date: April 3, 2018 Revised May 15, Project #: Re: Burlington Mall Retail Collection Transportation Evaluation
 To: Chuck Schneider Burlington S&S, LLC 225 West Washington Street Indianapolis, IN 46204 From: Patrick Dunford, P.E. Senior Project Manager Date: April 3, 2018 Revised May 15, 2018 Project #: 13482.01
Appendix J: Transportation and Circulation
 Appendix J: Transportation and Circulation J 1: Transportation Analysis Report J 2: Los Angeles Department of Transportation (LADOT) Approval Letter J 3: Construction Traffic Analysis J 1: Transportation
Greater Toronto Area Cordon Count Summary Analysis of Traffic Trends 1985 to 2011
 Greater Toronto Area Cordon Count Summary Analysis of Traffic Trends 1985 to 2011 Prepared by: Data Management Group Department of Civil Engineering University of Toronto Telephone: (416) 978-3916 Table
ALTA VISTA COMMERCIAL/ RESIDENTIAL PROJECT
 ALTA VISTA COMMERCIAL/ RESIDENTIAL PROJECT TRAFFIC IMPACT ANALYSIS Prepared For: Paul Conzelman SC Development 2151 Michelson Drive, Suite 140 Irvine, CA 92612 Prepared By: 2030 Main Street, Suite 1200
US 169/I-70 North Loop Planning & Environmental Linkages Study
 US 169/I-70 North Loop Planning & Environmental Linkages Study VISSIM Calibration Document Draft April 13, 2018 Page i Table of Contents 1. Overview... 1 2. Data Types... 2 3. Model Parameter Adjustments...
MEMORANDUM (DRAFT) DRAFT
 DRAFT") 117 Commercial St. NE, Suite 310 Salem, OR 97301 503.391.8773 www.dksassociates.com MEMORANDUM (DRAFT) DATE: February 15, 2017 TO: FROM: SUBJECT: Alex Dupey, MIG Scott Mansur, PE, PTOE; Garth Appanaitis,
117 Commercial St. NE, Suite 310 Salem, OR 97301 503.391.8773 www.dksassociates.com MEMORANDUM (DRAFT) DATE: February 15, 2017 TO: FROM: SUBJECT: Alex Dupey, MIG Scott Mansur, PE, PTOE; Garth Appanaitis,
APPENDIX IV MODELLING
 APPENDIX IV MODELLING Kingston Transportation Master Plan Final Report, July 2004 Appendix IV: Modelling i TABLE OF CONTENTS Page 1.0 INTRODUCTION... 1 2.0 OBJECTIVE... 1 3.0 URBAN TRANSPORTATION MODELLING
S.170 th Street Micro-Simulation Seattle-Tacoma International Airport Port of Seattle/Aviation Planning
 Seattle-acoma International Airport Port of Seattle/Aviation Planning Port of Seattle PO OF SEAE Aviation Planning Airport Operations January 24, 2013 Summary he Port is planning to relocate the cell phone
Freeway Work Zone Lane Capacity
 Freeway Work Zone Lane Capacity Thomas Notbohm, P.E. Wisconsin Department of Transportation Thomas.Notbohm@dot.state.wi.us Alex Drakopoulos Department of Civil & Environmental Engineering Marquette University,
Appendixx C Travel Demand Model Development and Forecasting Lubbock Outer Route Study June 2014
 Appendix C Travel Demand Model Development and Forecasting Lubbock Outer Route Study June 2014 CONTENTS List of Figures-... 3 List of Tables... 4 Introduction... 1 Application of the Lubbock Travel Demand
Non-Motorized Traffic Exploratory Analysis
 Non-Motorized Traffic Exploratory Analysis --------------------------------------------------------------- Chao Wu Advisor: Professor Greg Lindsey Humphrey School of Public Affairs University of Minnesota
Freeway Work Zone Lane Capacity
 Report Title Report Date: 2009 Freeway Work Zone Lane Capacity Principle Investigator Vendor Name and Address Name Drakopoulos, Alex «Vendor» Affiliation Marquette University Address 263 Haggerty Hall
Case Special Exception request for Planned Unit Development (PUD) The Vineyards
 The Vineyards") Case 1627 Applicant: Developer: Request: Location: Pointe South Land Trust Contact Information: Jimmy Garrett 901-271-3642 N/A Special Exception request for Planned Unit Development (PUD) The Vineyards
Case 1627 Applicant: Developer: Request: Location: Pointe South Land Trust Contact Information: Jimmy Garrett 901-271-3642 N/A Special Exception request for Planned Unit Development (PUD) The Vineyards
Bruce Freeman Rail Trail
 Functional Design Report Bruce Freeman Rail Trail Station Road to Concord Town Line Sudbury, Massachusetts PREPARED FOR Town of Sudbury Planning and Community Development 287 Old Sudbury Road Sudbury,
930 Old Northern Rd & 4 Post Office Rd, Glenorie
 Proposed Mixed Use Development 930 Old Northern & 4, Glenorie TRAFFIC AND PARKING ASSESSMENT REPORT 13 December 2016 Ref 16264 Suite 6, 20 Young Street, Neutral Bay NSW 2089 - PO Box 1868, Neutral Bay
METRO Blue Line LRT Extension (BLRT) 5514 West Broadway Avenue, Suite 200, Crystal, MN
 5514 West Broadway Avenue, Suite 200, Crystal, MN") Robbinsdale Open House July 28, 2015 *All comments are recorded verbatim from comment cards and discussion worksheets. No grammatical, word choice changes or spelling has been corrected. If handwriting
Robbinsdale Open House July 28, 2015 *All comments are recorded verbatim from comment cards and discussion worksheets. No grammatical, word choice changes or spelling has been corrected. If handwriting
Trip Generation Characteristics of Super Convenience Market Gasoline Pump Stores
 Trip Generation Characteristics of Super Convenience Market Gasoline Pump Stores This article presents the findings of a study that investigated trip generation characteristics of a particular chain of
CHAPTER 3 TRANSPORTATION
 CHAPTER 3 TRANSPORTATION This chapter presents information on transportation impacts of Section 2 of the Project that have changed from those identified in the published Westside Subway Extension Final
15.0 Operations and Maintenance Cost Calculations
 15.0 Operations and Maintenance Cost Calculations 15.1 Introduction Operations and Maintenance (O&M) costs were calculated for each of the four alternatives being considered in the analysis. No Build Alternative
KAISER SOUTH NORTHERN VIRGINIA HUB TRAFFIC IMPACT STUDY PRINCE WILLIAM COUNTY, VIRGINIA TABLE OF CONTENTS. Section 2 BACKGROUND INFORMATION 12
 KAISER SOUTH NORTHERN VIRGINIA HUB TRAFFIC IMPACT STUDY PRINCE WILLIAM COUNTY, VIRGINIA TABLE OF CONTENTS Page EXECUTIVE SUMMARY 1 Purpose of Report and Study Objectives... 1 Site Location and Study Area...
The Urbana Free Library Parking and Transportation Study
 CHAMPAIGN COUNTY REGIONAL PLANNING COMMISSION The Urbana Free Library Parking and Transportation Study Final Report 7/18/2013 Champaign Urbana Urbanized Area Transportation Study (CUUATS) TABLE OF CONTENTS
SHORT NIGHTTIME WATER SHUTDOWN TO OCCUR IN EARLY HOURS OF MAY 29
 Thank you for your interest in the Center City Connector Streetcar. In this weekly update, you ll find information about ongoing construction for the 1st phase of utility work in Pioneer Square. UPDATES
CHAPTER 3. CAPACITY OF SIGNALIZED INTERSECTIONS
 CHAPTER 3. CAPACITY OF SIGNALIZED INTERSECTIONS 1. Overview In this chapter we explore the models on which the HCM capacity analysis method for signalized intersections are based. While the method has
Critchfield Rd / SR-129
 NOVEMBER 27, 2017 Critchfield Rd / SR-129 Intersection Safety Study Alternatives Report CRITCHFIELD INTERSECTION SAFETY STUDY Contents Introduction...1 Purpose...2 Existing Conditions...2 Proposed Alternatives...2
Bus Timetable Effective January BxM9. Throgs Neck. Express service between Throgs Neck, Bronx, and Midtown, Manhattan
 Bus Timetable Effective January 2006 BxM9 Throgs Neck Express service between Throgs Neck, Bronx, and Midtown, Manhattan Fares Express bus fare is $5 (Senior-Disabled fare is $2.50). MetroCard - Pay-Per-Ride
Parking Study MAIN ST
 Parking Study This parking study was initiated to help understand parking supply and parking demand within Oneida City Center. The parking study was performed and analyzed by the Madison County Planning
Table of Contents Introduction... 4 Study Area... 5
 Table of Contents Introduction... 4 Study Area... 5 Streets and s... 5 Traffic Volumes... 8 Recent and Anticipated Development... 10 Crash Analysis... 10 Projected Traffic Volumes... 11 Trip Generation...
TRANSPORTATION AND TRAFFIC ANALYSIS REPORT
 Square One Drive Extension Municipal Class Environmental Assessment Environmental Study Report Appendix B Transportation and Traffic Analysis Report TRANSPORTATION AND TRAFFIC ANALYSIS REPORT FINAL DRAFT
Prepared for. 3D/International, Inc West Loop South, Suite 400 Houston, Texas November 2006
 DRAFT TRAFFIC IMPACT STUDY FOR PHASED DEVELOPMENT OF TAMU CC Prepared for 3D/International, Inc. 1900 West Loop South, Suite 400 Houston, Texas 77027 November 2006 Interim Review Only Document Incomplete:
ADAPTIVE SIGNAL CONTROL IV
 ADAPTIVE SIGNAL CONTROL IV Evaluation of the Adaptive Traffic Control System in Park City, Utah Dr. Peter T. Martin Associate Professor Aleksandar Stevanovic Research Associate Ivana Vladisavljevic Research
2011 South Western Region Travel Time Monitoring Program Congestion Management Process. Executive Summary
 2011 South Western Region Travel Monitoring Program Executive Summary Prepared by: South Western Regional Planning Agency 888 Washington Blvd, 3rd Floor Stamford, CT 06901 Telephone: 203.6.5190 Facsimile:
Appendix C Final Methods and Assumptions for Forecasting Traffic Volumes
 Fairview Ave. and Main St. Improvements and Local Streets Plan Appendices Ada County Highway District Appendix C Final Methods and Assumptions for Forecasting Traffic Volumes January 3, 207 Appendices
Appendix B. Durham Region Travel Demand Model Calibration
 Appendix B Durham Region Travel Demand Model Calibration AECOM 300 Water Street 905 668 9363 tel Whitby, ON, Canada L1N 9J2 905 668 0221 fax www.aecom.com To Ron Albright, Municipality of Clarington Page
Prepared for: San Diego Association Of Governments 401 B Street, Suite 800 San Diego, California 92101
 Activity-Based Travel Model Validation for 2012 Using Series 13 Data: Coordinated Travel Regional Activity Based Modeling Platform (CT-RAMP) for San Diego County Prepared for: San Diego Association Of
OREGON DEPARTMENT OF TRANSPORTATION STATEWIDE ROAD, WEATHER AND INCIDENT CONDITIONS 4/24/2019 5:16:03 PM
 OREGON DEPARTMENT OF TRANSPORTATION STATEWIDE ROAD, WEATHER AND INCIDENT CONDITIONS Incidents/: 4/24/2019 5:16:03 PM HWY372 22 22 Mount Bachelor Ski Area I-5 10 13 5 Mi S of Ashland Informational only
1 h. Page 1 of 12 FINAL EXAM FORMULAS. Stopping Sight Distance. (2 ) N st U Where N=sample size s=standard deviation t=z value for confidence level
 N st U Where N=sample size s=standard deviation t=z value for confidence level") Page 1 of 12 FINAL EXAM FORMULAS Stopping Sight Distance 2 2 V V d 1.47Vt 1.075 i f a 2 2 Vi Vf d 1.47Vt 30( f 0.01 G) Where d = distance (ft) V = speed (mph) t = time (sec) a=deceleration rate (ft/sec
Page 1 of 12 FINAL EXAM FORMULAS Stopping Sight Distance 2 2 V V d 1.47Vt 1.075 i f a 2 2 Vi Vf d 1.47Vt 30( f 0.01 G) Where d = distance (ft) V = speed (mph) t = time (sec) a=deceleration rate (ft/sec
March Grade Crossing Analysis
 March 2014 Grade Crossing Analysis T E C H N I C A L M E M O R A N D U M South Florida Freight and Passenger Rail Enhancement Study Phase 1A - Rehabilitate Existing Northwood Connection; FPID: 434948-1
CE351 Transportation Systems: Planning and Design
 CE351 Transportation Systems: Planning and Design TOPIC: Level of Service (LOS) at Traffic Signals 1 Course Outline Introduction to Transportation Highway Users and their Performance Geometric Design Pavement
River North Multi-Modal Transit Analysis
 River North Multi-Modal Transit Analysis November 7, 2006 Dan Meyers, AICP URS Corporation 612-373-6446 / dan_meyers@urscorp.com River North Study Area Reasons for initiating the study Downtown areas north
Wesley Chapel Area Roadway Needs Study Build-Out Analysis (Beardsley Dr/Oldwoods Ave Need Study) Project Progress Meeting 1
 Project Progress Meeting 1") Build-Out Analysis (Beardsley Dr/Oldwoods Ave Need Study) Project Progress Meeting 1 9:30 AM Pasco County Development Services Conference Room 1. Welcome/Introductions 2. Project Overview Purpose Major
Build-Out Analysis (Beardsley Dr/Oldwoods Ave Need Study) Project Progress Meeting 1 9:30 AM Pasco County Development Services Conference Room 1. Welcome/Introductions 2. Project Overview Purpose Major
Establishment of Local Trip Generation Rates or Equations for Mixed-Use Developments in Kansas
 Report No. K-TRAN: KU-11-7 FINAL REPORT October 2012 Establishment of Local Trip Generation Rates or Equations for Mixed-Use Developments in Kansas Mehrdad Givechi, P.E., PTOE George Sarkodee The University
OREGON DEPARTMENT OF TRANSPORTATION STATEWIDE ROAD, WEATHER AND INCIDENT CONDITIONS 4/13/2019 2:54:03 PM
 OREGON DEPARTMENT OF TRANSPORTATION STATEWIDE ROAD, WEATHER AND INCIDENT CONDITIONS Incidents/: 4/13/2019 2:54:03 PM 57 56 @ Corvallis - Newport Hwy OR34 HWY372 22 22 Mount Bachelor Ski Area I-5 10 13
1.0 INTRODUCTION AND SUMMARY...
 TABLE OF CONTENTS 1.0 INTRODUCTION AND SUMMARY... 1 1.1 Purpose and Study Objective... 1 1.2 Executive Summary... 1 2.0 ROADWAY CONDITIONS... 5 2.1 Granville Parkway (South Intersection)... 8 2.2 Tuscany
6 th Line Municipal Class Environmental Assessment
 6 th Line Municipal Class Environmental Assessment County Road 27 to St John s Road Town of Innisfil, ON September 6, 2016 APPENDIX L: TRAVEL DEMAND FORECASTING MEMORANDUM Accessible formats are available
Downtown Parking Study
 Downtown Parking Study Mount Prospect, Illinois Prepared For: VILLAGE OF MOUNT PROSPECT September 24, 2018 Contents List of Figures and Tables, ii 1. Introduction...1 2. Downtown Parking Surveys..2 3.
OREGON DEPARTMENT OF TRANSPORTATION STATEWIDE ROAD, WEATHER AND INCIDENT CONDITIONS 4/22/2019 4:20:05 AM
 OREGON DEPARTMENT OF TRANSPORTATION STATEWIDE ROAD, WEATHER AND INCIDENT CONDITIONS Incidents/: 4/22/2019 4:20:05 AM HWY372 22 22 Mount Bachelor Ski Area I-5 10 13 5 Mi S of Ashland Informational only
Appendix E FTA NOISE MODELING WORKSHEETS AND DETAILED METHODOLOGY
 Appendix E FTA NOISE MODELING WORKSHEETS AND DETAILED METHODOLOGY APPENDIX E General Noise Assessment The FTA General Noise Assessment procedure was used for calculating noise from transit sources associated
Susan Clark NRS 509 Nov. 29, 2005
 Susan Clark NRS 509 Nov. 29, 2005 The original intent of this project was to look at the role of GIS in the inventory of bicycle and pedestrian facilities. The research, however, indicates a different