Appendix I: Traffic Study
|
|
|
- Sybil Walton
- 6 years ago
- Views:
Transcription
1 City of Fontana Sierra Lakes Commerce Center Draft EIR Appendix I: Traffic Study FirstCarbon Solutions H:\Client (PN JN)\0144\ \EIR\1 ADEIR\ Sec99 99 Appendix Dividers.doc
2 THIS PAGE INTENTIONALLY LEFT BLANK

 660-1994 x222 Pranesh Tarikere, PE ptarikere@urbanxroads.")
3 Sierra Lakes Commerce Center TRAFFIC IMPACT ANALYSIS CITY OF FONTANA PREPARED BY: Aric Evatt, PTP (949) x204 Charlene So, PE (949) x222 Pranesh Tarikere, PE (949) x205 JUNE 3, Traffic Study Rev
4
5 Sierra Lakes Commerce Center Traffic Impact Analysis TABLE OF CONTENTS TABLE OF CONTENTS... I APPENDICES... III LIST OF EXHIBITS... IV LIST OF TABLES... V LIST OF ABBREVIATED TERMS... VI 1 INTRODUCTION Project Overview Analysis Scenarios Study Area Summary of Cumulative Impacts Recommended Improvements On-Site Roadway and Site Access Improvements METHODOLOGIES Level of Service Intersection Capacity Analysis LOS Criteria Thresholds of Significance Project Fair Share Calculation Methodology AREA CONDITIONS Existing Circulation Network City of Fontana Circulation Master Plan Truck Routes Transit Service Bicycle & Pedestrian Facilities Existing Traffic Counts Existing Conditions Intersection Operations Analysis Existing Conditions Recommended Improvements PROJECTED FUTURE TRAFFIC Project Trip Generation Project Trip Distribution Modal Split Project Trip Assignment Background Traffic Cumulative Development Traffic Horizon Year Volume Development EXISTING PLUS PROJECT TRAFFIC CONDITIONS Roadway Improvements Existing plus Project Traffic Volume Forecasts Intersection Operations Analysis Impacts and Mitigation Measures OPENING YEAR CUMULATIVE (2016) TRAFFIC CONDITIONS Roadway Improvements Traffic Study Rev i
6 Sierra Lakes Commerce Center Traffic Impact Analysis 6.2 Opening Year Cumulative Without Project Traffic Volume Forecasts Opening Year Cumulative With Project Traffic Volume Forecasts Intersection Operations Analysis Opening Year Cumulative Impacts and Recommended Improvements HORIZON YEAR (2035) TRAFFIC CONDITIONS Roadway Improvements Horizon Year Without Project Traffic Volume Forecasts Horizon Year With Project Traffic Volume Forecasts Intersection Operations Analysis Horizon Year Cumulative Impacts and Recommended Improvements SITE ACCESS AND ON-SITE CIRCULATION On-Site Roadway Improvements Site Access Improvements LOCAL AND REGIONAL FUNDING MECHANISMS Measure I City of Fontana Development Impact Fee (DIF) Fair Share Contribution REFERENCES Traffic Study Rev ii
7 Sierra Lakes Commerce Center Traffic Impact Analysis APPENDICES APPENDIX 3.1: EXISTING TRAFFIC COUNTS APPENDIX 3.2: EXISTING (2014) CONDITIONS INTERSECTION OPERATIONS ANALYSIS APPENDIX 3.3: EXISTING (2014) CONDITIONS INTERSECTION OPERATIONS ANALYSIS, WITH IMPROVEMENTS APPENDIX 5.1: EXISTING PLUS PROJECT CONDITIONS INTERSECTION OPERATIONS ANALYSIS APPENDIX 5.2: EXISTING PLUS PROJECT CONDITIONS INTERSECTION OPERATIONS ANALYSIS, WITH IMPROVEMENTS APPENDIX 6.1: OPENING YEAR CUMULATIVE (2016) WITHOUT PROJECT INTERSECTION OPERATIONS ANALYSIS APPENDIX 6.2: OPENING YEAR CUMULATIVE (2016) WITH PROJECT INTERSECTION OPERATIONS ANALYSIS APPENDIX 6.3: OPENING YEAR CUMULATIVE (2016) WITHOUT PROJECT INTERSECTION OPERATIONS ANALYSIS, WITH IMPROVEMENTS APPENDIX 6.4: OPENING YEAR CUMULATIVE (2016) WITH PROJECT INTERSECTION OPERATIONS ANALYSIS, WITH IMPROVEMENTS APPENDIX 7.1: HORIZON YEAR (2035) WITHOUT PROJECT CONDITIONS INTERSECTION OPERATIONS ANALYSIS APPENDIX 7.2: HORIZON YEAR (2035) WITH PROJECT CONDITIONS INTERSECTION OPERATIONS ANALYSIS APPENDIX 7.3: HORIZON YEAR (2035) WITHOUT PROJECT CONDITIONS INTERSECTION OPERATIONS ANALYSIS, WITH IMPROVEMENTS APPENDIX 7.4: HORIZON YEAR (2035) WITH PROJECT CONDITIONS INTERSECTION OPERATIONS ANALYSIS, WITH IMPROVEMENTS Traffic Study Rev iii
8 Sierra Lakes Commerce Center Traffic Impact Analysis LIST OF EXHIBITS EXHIBIT 1-1: PRELIMINARY SITE PLAN... 2 EXHIBIT 1-2: LOCATION MAP... 6 EXHIBIT 1-3: SITE ACCESS AND ADJACENT ROADWAY RECOMMENDATIONS EXHIBIT 3-1: EXISTING NUMBER OF THROUGH LANES AND INTERSECTION CONTROLS EXHIBIT 3-2: CITY OF FONTANA CIRCULATION MASTER PLAN EXHIBIT 3-3: CITY OF FONTANA GENERAL PLAN ROADWAY CROSS-SECTIONS EXHIBIT 3-4: CITY OF FONTANA EXISTING TRUCK ROUTES EXHIBIT 3-5: CITY OF FONTANA EXISTING TRANSIT ROUTES EXHIBIT 3-6: EXISTING PEDESTRIAN FACILITIES EXHIBIT 3-7: EXISTING (2014) TRAFFIC VOLUMES EXHIBIT 3-8: SUMMARY OF PEAK HOUR INTERSECTION LOS FOR EXISTING (2014) CONDITIONS EXHIBIT 4-1: PROJECT PASSENGER TRIP DISTRIBUTION (OUTBOUND) EXHIBIT 4-2: PROJECT PASSENGER CAR TRIP DISTRIBUTION (INBOUND) EXHIBIT 4-3: PROJECT (TRUCK) TRIP DISTRIBUTION (OUTBOUND) EXHIBIT 4-4: PROJECT (TRUCK) TRIP DISTRIBUTION (INBOUND) EXHIBIT 4-5: PROJECT ONLY TRAFFIC VOLUMES EXHIBIT 4-6: CUMULATIVE DEVELOPMENT LOCATION MAP EXHIBIT 5-1: EXISTING PLUS PROJECT TRAFFIC VOLUMES EXHIBIT 5-2: SUMMARY OF PEAK HOUR INTERSECTION LOS FOR EXISTING PLUS PROJECT EXHIBIT 6-1: OPENING YEAR CUMULATIVE (2016) TRAFFIC VOLUMES EXHIBIT 6-2: OPENING YEAR CUMULATIVE (2016) WITH PROJECT TRAFFIC VOLUMES EXHIBIT 6-3: SUMMARY OF PEAK HOUR INTERSECTION LOS FOR OPENING YEAR CUMULATIVE (2016) WITHOUT PROJECT CONDITIONS EXHIBIT 6-4: SUMMARY OF PEAK HOUR INTERSECTION LOS FOR OPENING YEAR CUMULATIVE (2016) WITH PROJECT CONDITIONS EXHIBIT 7-1: HORIZON YEAR (2035) TRAFFIC VOLUMES EXHIBIT 7-2: HORIZON YEAR (2035) WITH PROJECT TRAFFIC VOLUMES EXHIBIT 7-3: SUMMARY OF PEAK HOUR INTERSECTION LOS FOR HORIZON YEAR (2035) WITHOUT PROJECT TRAFFIC CONDITIONS EXHIBIT 7-4: SUMMARY OF INTERSECTION PEAK HOUR LOS FOR HORIZON YEAR (2035) WITH PROJECT CONDITIONS EXHIBIT 8-1: SITE ACCESS AND ADJACENT ROADWAY RECOMMENDATIONS Traffic Study Rev iv
9 Sierra Lakes Commerce Center Traffic Impact Analysis LIST OF TABLES TABLE 1-1: INTERSECTION ANALYSIS LOCATIONS... 7 TABLE 1-2: SUMMARY OF INTERSECTION IMPROVEMENTS TABLE 2-1: SIGNALIZED INTERSECTION LOS THRESHOLDS TABLE 2-2: UNSIGNALIZED INTERSECTION LOS THRESHOLDS TABLE 2-3: CMP INTERSECTIONS IN THE CITY OF FONTANA TABLE 3-1: INTERSECTION ANALYSIS FOR EXISTING (2014) CONDITIONS TABLE 3-2: EXISTING CONDITIONS INTERSECTION ANALYSIS SUMMARY, WITH IMPROVEMENTS TABLE 4-1: PROJECT TRIP GENERATION SUMMARY (ACTUAL VEHICLES) TABLE 4-2: PROJECT TRIP GENERATION SUMMARY (IN PCE) TABLE 4-3: CUMULATIVE DEVELOPMENT SUMMARY TABLE 5-1: INTERSECTION ANALYSIS FOR EXISTING PLUS PROJECT CONDITIONS TABLE 5-2: EXISTING PLUS PROJECT INTERSECTION ANALYSIS SUMMARY, WITH IMPROVEMENTS TABLE 6-1: OPENING YEAR CUMULATIVE (2016) INTERSECTION ANALYSIS SUMMARY TABLE 6-2: OPENING YEAR CUMULATIVE (2016) TRAFFIC CONDITIONS INTERSECTION ANALYSIS SUMMARY, WITH IMPROVEMENTS TABLE 7-1: HORIZON YEAR (2035) TRAFFIC CONDITIONS INTERSECTION ANALYSIS SUMMARY TABLE 7-2: INTERSECTION ANALYSIS FOR HORIZON YEAR CONDITIONS, WITH IMPROVEMENTS TABLE 9-1: SUMMARY OF INTERSECTION IMPROVEMENTS TABLE 9-2: PROJECT FAIR SHARE CALCULATIONS Traffic Study Rev v
10 Sierra Lakes Commerce Center Traffic Impact Analysis LIST OF ABBREVIATED TERMS (1) Reference ADT Average Daily Traffic Caltrans California Department of Transportation CEQA California Environmental Quality Act CMP Congestion Management Program DIF Development Impact Fee E+P Existing Plus Project HCM Highway Capacity Manual ITE Institute of Transportation Engineers LOS Level of Service PCE Passenger Car Equivalents PHF Peak Hour Factor Project Sierra Lakes Commerce Center RTP Regional Transportation Plan SANBAG San Bernardino Associated Governments SBTAM San Bernardino Transportation Analysis Model SCAG Southern California Association of Governments sf Square Feet TIA Traffic Impact Analysis tsf Thousand Square Feet vphg Vehicles Per Hour of Green Traffic Study Rev vi
11 Sierra Lakes Commerce Center Traffic Impact Analysis 1 INTRODUCTION This report presents the results of the traffic impact analysis (TIA) for the proposed Sierra Lakes Commerce Center ( Project ) located at the southeast corner of and Clubhouse Drive in the City of Fontana as shown on Exhibit 1-1. The purpose of this traffic impact analysis is to evaluate the potential impacts to traffic and circulation associated with the development of the proposed Project, and to recommend improvements to mitigate impacts considered significant in comparison to established regulatory thresholds. Based on discussions with City staff, the scope of this study is consistent with other recently completed TIAs in the area whose scopes were developed through consultation with the City of Fontana, and follows the San Bernardino County Congestion Management Program (CMP), California Department of Transportation (Caltrans) and the City of Fontana s traffic study requirements. 1.1 PROJECT OVERVIEW The proposed Project is anticipated to consist of the development of up to 597,818 square feet (sf) of high-cube warehouse use in a single building generally located on the southeast corner of and Club House Drive in the City of Fontana. The Project is anticipated to be constructed and occupied by the year Access to the site will be provided via three driveways on and three driveways along the future Mango Avenue. Clubhouse Drive will be restricted to passenger cars only with full access. Driveway 2 and Driveway 3 on will be restricted to right-in / right-out access only. The three driveways (Driveways 4, 5, and 6) on Mango Avenue will provide full access. Trips generated by the Project s proposed land uses have been estimated based on trip generation rates collected by the Institute of Transportation Engineers (ITE) as presented in ITE s most current edition of Trip Generation (9th Edition, 2012). (1) The Project is estimated to generate a net total of approximately 1,004 (1,576 passenger car equivalents or PCE) trip-ends per day with 66 (93 PCE) AM peak hour trips and 72 (108 PCE) PM peak hour trips. The assumptions and methods used to estimate the Project s trip generation characteristics are discussed in detail in Section 4.1 Project Trip Generation of this report. High-cube warehouse/distribution centers are a unique land use type within the larger, more generalized industrial land use category. ITE s most recent edition of the Trip Generation manual (ITE 9 th Edition), published in 2012, defines high-cube warehouses as used for storage of materials, goods and merchandise prior to their distribution to retail outlets, distribution centers or other warehouses. These facilities are typically characterized by ceiling heights of at least 24 feet with small employment counts due to a high level of mechanization. This definition is widely accepted by other engineering and planning disciplines. Over the years, the proliferation of high-cube warehouse/distribution center buildings throughout Southern California, and most notably the Inland Empire, has prompted both the public and private Traffic Study Rev 1 1
12 2
13 Sierra Lakes Commerce Center Traffic Impact Analysis sectors to conduct numerous studies to understand the trip generation characteristics of these unique buildings, and their associated impacts on the transportation system. 1.2 ANALYSIS SCENARIOS For the purposes of this traffic study, potential impacts to traffic and circulation have been assessed for each of the following conditions: Existing (2014) (1 scenario) Existing plus Project (1 scenarios) Opening Year Cumulative (2016), Without and With Project (2 scenarios) Horizon Year (2035), Without and With Project (2 scenarios) EXISTING (2014) CONDITIONS Information for Existing (2014) conditions is disclosed to represent the baseline traffic conditions as they existed at the time this report was prepared EXISTING PLUS PROJECT CONDITIONS The Existing Plus Project (E+P) analysis determines significant traffic impacts that would occur on the existing roadway system with the addition of Project traffic. Pursuant to the approved scoping agreement with the City of Fontana, the E+P analysis is intended to identify the Projectspecific impacts associated solely with the development of the proposed Project based on a comparison of the E+P traffic conditions to Existing conditions OPENING YEAR CUMULATIVE (2016) CONDITIONS The Opening Year Cumulative conditions analysis determines the near-term cumulative traffic impacts based on a comparison of the with Project traffic scenarios to the without Project traffic scenario. The Opening Year Cumulative conditions analyses uniquely identifies the specific traffic impacts associated with the proposed Project. To account for background traffic growth, traffic associated with other known cumulative development projects in conjunction with an ambient growth of 2 percent per year from Existing conditions is included for Opening Year Cumulative traffic conditions. The currently adopted Southern California Association of Governments (SCAG) 2012 Regional Transportation Plan (RTP) (April 2012) growth forecasts City of Fontana identifies projected growth in population of 193,900 in 2008 to 259,100 in 2035, or a 33.6% increase over the 27 year period. (1) The change in population equates to roughly a 1.08 percent growth rate compounded annually. Similarly, growth over the same 27 year period in households is projected to increase by 37.2 percent, or 1.18 percent annual growth rate. Finally, growth in employment over the same 27 year period is projected to increase by 44.9 percent, or a 1.39 percent annual growth rate. Based on a comparison of Existing (2014) traffic volumes to the Horizon Year (2035) forecasts, the average growth rate is estimated at approximately 5 percent compounded annually Traffic Study Rev 3 3
14 Sierra Lakes Commerce Center Traffic Impact Analysis between Existing (2014) and Horizon Year (2035) traffic conditions. The annual growth rate at each individual intersection is not lower than 2.0 percent compounded annually to as high as 6.5 percent compounded annually over the same time period. Therefore, the annual growth rate utilized for the purposes of this analysis would appear to conservatively approximate the anticipated regional growth in traffic volumes in the City of Fontana for Opening Year Cumulative (2016) and Horizon Year (2035) traffic conditions, especially when considered along with the addition of project-related traffic. As such, the growth in traffic volumes assumed in this traffic impact analysis would tend to overstate as opposed to understate the potential impacts to traffic and circulation HORIZON YEAR (2035) CONDITIONS The Horizon Year conditions analysis will be utilized to determine if improvements funded through local and regional transportation mitigation fee programs, such as the City of Fontana Development Impact Fee (DIF) program, or other approved funding mechanism can accommodate the cumulative traffic at the target level of service (LOS) identified by the City of Fontana (lead agency). If the planned and funded improvements can provide the target LOS, then the Project s payment into these established fee programs will be considered as cumulative mitigation for the long-range traffic impacts. City of Fontana staff provided the following traffic studies with published 2030 forecasts and indicated that the data included in these studies was the most appropriate source for background long range (2030) traffic projections for the study area: Summit at Rosena Specific Plan (2005) Sierra Crest Residential Project (2011) The Arboretum Specific Plan (2008) City provided Specific Plan information and Urban Crossroads obtained relevant traffic study materials independently. Fontana-Hans Project (2011) In addition, Urban Crossroads, Inc. also obtained the traffic study report for the Fontana Promenade Specific Plan project and contacted the San Bernardino Associated Governments to obtain the most current sub-regional traffic model forecasts. The traffic volumes for 2035 conditions have been extracted from the San Bernardino County Transportation Analysis Model SBTAM, and compared to 2030 projections contained in the various studies referenced previously. In cases where approved/published 2030 volumes are higher than 2035 data, the approved/published projections have been retained for local circulation design purposes. In general, the approved/published traffic study report volumes were in fact higher than the most current 2035 model volumes. Therefore, the long range forecasts in this report are identified as representative of 2035 conditions. The Horizon Year Without Project traffic conditions presented in this analysis were obtained from recently approved Fontana Industrial Development Traffic Impact Analysis (Revised December 13, 2013) prepared by Urban Crossroads, Inc., (3) whose forecasts were based on methodology described above Traffic Study Rev 4 4
15 Sierra Lakes Commerce Center Traffic Impact Analysis The Horizon Year traffic forecasts used in the traffic analysis were refined with existing peak hour traffic count data collected at intersection analysis locations. The initial estimate of the future peak hour turning movements has, therefore, been reviewed for reasonableness. The reasonableness checks performed include a review of traffic flow conservation in addition to a comparison with the Existing and Opening Year Cumulative traffic volumes. Where necessary, the Horizon Year volumes have been adjusted to achieve flow conservation, reasonable growth, and reasonable diversion between parallel routes. The Horizon Year With Project scenario includes the Horizon Year Without Project traffic volumes, plus the traffic generated by the proposed Project. 1.3 STUDY AREA INTERSECTIONS The following eleven study area intersection locations listed in Table 1-1 and shown on Exhibit 1-2 were selected for this TIA based on the City of Fontana s traffic study requirements that require analysis of intersection locations in which a proposed Project is anticipated to contribute 50 or more peak-hour trips, and in consultation with City of Fontana staff. The rationale for evaluating intersections where a Project would contribute 50 or more peakhour trips is standard industry practice and supported by substantial evidence. Furthermore, the potential impact threshold of 50 peak hour trips is identified in the San Bernardino County Congestion Management Plan (CMP) Traffic Study Guidelines, which is followed by the City of Fontana. It should also be noted that the 50 peak hour trip threshold is used by several other lead agencies throughout southern California including Caltrans, County of Riverside, and the County of Orange. The 50 peak hour trip threshold is based on the desire to analyze potential impacts when the project contributes 3% or more of the capacity of a typical signalized intersection. According to the Orange County Congestion Management Plan (CMP) Guidelines, the 50 peak hour threshold represents less than 3% of capacity of a signalized intersection for critical movements, estimated based on the Highway Capacity Manual at approximately 1700 vehicles per hour. In effect, acting as the lead agency, these jurisdictions have established 50 project trips as the threshold of significance for when to analyze signalized intersections. Therefore, a project trip contribution of less than 50 trips is considered less than significant and is typically not analyzed. The San Bernardino County CMP Traffic Study Guidelines state that Urban segments (i.e., segments on roadways that are generally signalized with spacing less than 2 miles) do not require segment analysis. Segment requirements can normally be determined by the analysis of lane requirements at intersections. Roadway segment analysis has not been requested by the City of Fontana for other recent projects in the area. As stated in the CMP, the more detailed peak hour intersection analysis explicitly accounts for factors that affect roadway capacity. Therefore, roadway segment analysis is typically only performed if explicitly required by the applicable jurisdiction s traffic study guidelines or specifically requested by the lead agency Traffic Study Rev 5 5
16 6
17 Sierra Lakes Commerce Center Traffic Impact Analysis TABLE 1-1: INTERSECTION ANALYSIS LOCATIONS ID Intersection Location Jurisdiction 1 / Summit Avenue Fontana 2 / Clubhouse Drive Fontana 3 / Driveway 2 Future Intersection Fontana 4 / Driveway 3 Future Intersection Fontana 5 / Sierra Lakes Parkway Fontana 6 / SR-210 Westbound Ramps Caltrans (CMP location) 7 / SR-210 Eastbound Ramps Caltrans (CMP location) 8 / Driveway 4 Future Intersection Fontana 9 / Driveway 5 Future Intersection Fontana 10 / Driveway 6 Future Intersection Fontana 11 Mango Avenue / Sierra Lakes Parkway Fontana Based on discussions with the City staff, although the Project is anticipated to contribute less than 50 peak hour trips at the intersections of / Summit Avenue and Sierra Avenue / SR-210 Eastbound ramps, these intersections are included in the study area, in order to be consistent with other recent traffic studies completed in the area FREEWAY MAINLINE ANALYSIS The San Bernardino County CMP traffic study guidelines require the freeway mainline analysis locations include the segments where the proposed Project is anticipated to contribute 100 or more two-way peak hour trips. As the Project is anticipated to contribute fewer than 50 peak hour trips in either direction, freeway mainline and ramp junction analysis is not required for this TIA. 1.4 SUMMARY OF CUMULATIVE IMPACTS Cumulative traffic impacts are deficiencies that are not directly caused by the Project, but occur as a result of regional growth combined with that or other nearby cumulative development projects. The Project s contribution to a particular cumulative transportation deficiency is deemed cumulatively considerable if the Project adds significant traffic to the forecasted deficiency (as measured by the 50 or more peak hour trip threshold) Existing Conditions For Existing traffic conditions, the following intersection was found to operate at an unacceptable LOS during one or more of the peak hours: ID Intersection Location Level of Service 5 / Sierra Lakes Parkway LOS D, PM peak hour Traffic Study Rev 7 7
18 Sierra Lakes Commerce Center Traffic Impact Analysis E+P Conditions The same intersection that was found to operate at a deficient LOS under Existing traffic conditions was also found to operate at a deficient LOS under E+P traffic conditions. In other words, there were no NEW traffic impacts identified due to the addition of Project traffic. Improvements needed to address E+P traffic conditions were the same as those identified for Existing traffic conditions Opening Year Cumulative Conditions Based on a comparison of Opening Year Cumulative Without and With Project traffic conditions to Existing traffic conditions, the same intersection previously identified to operate at an unacceptable LOS for Existing and E+P traffic conditions was also found to operate at an unacceptable LOS for Opening Year Cumulative Without and With Project traffic conditions. Similar to E+P traffic conditions, the improvements needed to address Opening Year Cumulative Without and With Project traffic conditions were the same as those identified for Existing traffic conditions Horizon Year Conditions Based on the assessment of Horizon Year Without and With Project traffic conditions, the following additional intersections were identified to operate at a deficient LOS in addition to those previously identified under Existing traffic conditions: ID Intersection Location Level of Service 1 / Summit Avenue LOS D, AM Peak Hour LOS F, PM Peak Hour 7 / SR-210 Eastbound Ramps LOS F, PM Peak Hour It should be noted that the Project is anticipated to contribute less than 50 peak hour trips to both of these intersections. However, in order to be consistent with other recent traffic studies completed in the area, improvements have been recommended for the intersections. 1.5 RECOMMENDED IMPROVEMENTS Table 1-2 lists the recommended improvements necessary to reduce the identified intersection LOS deficiencies by traffic condition. For improvements that do not appear to be in DIF, a fair share contribution based on the Project s percentage contribution may be imposed in order to mitigate the Project s share of impacts in lieu of construction. These fees are collected as part of a funding mechanism aimed at ensuring that regional highways and arterial expansions keep pace with the projected vehicle trip increases. Alternatively, minor fair share responsibilities may be waived when collection is infeasible or where other mitigation assignments substantially exceed the Project s demonstrated impacts. Additional information related to the fee programs are contained in Section 9 Local and Regional Funding Mechanisms of this report. Under the City s DIF program, the City may grant to developers a credit against specific components of fees when those developers construct certain facilities and landscaped medians identified in the list of improvements funded by the DIF program. The overall mitigation Traffic Study Rev 8 8
19 Sierra Lakes Commerce Center Traffic Impact Analysis program includes a cash payment through the City s DIF program which will lead to the improvement of select off site facilities with local and regional significance. A rough order of magnitude cost has been prepared to determine the appropriate contribution value based upon the Project s fair share of traffic as part of the project approval process. Table 1 2 also summarizes the applicable cost associated with each of the recommended improvements based on the preliminary construction cost estimates found in Appendix G of the San Bernardino County CMP (2) in conjunction with a cost escalation factor of 1.484% to reflect current (2014) costs. The total cost of needed study area intersection improvements is $1,023,960. Based on the project fair share percentages shown on Table 1 2, the project s fair share cost is estimated at $6,458. These estimates are a rough order of magnitude only as they are intended only for discussion purposes and do not imply any legal responsibility or formula for contributions or mitigation. 1.6 ON SITE ROADWAY AND SITE ACCESS IMPROVEMENTS Access to the site will be provided via three driveways on and three driveways along the future Mango Avenue. Clubhouse Drive will be restricted to passenger cars only with full access. Driveway 2 and Driveway 3 on will be restricted to right in / right out access only. The three driveways (Driveways 4, 5, and 6) on Mango Avenue will provide full access. Roadway improvements necessary to provide site access and on site circulation are assumed to be constructed in conjunction with site development and are described below. These improvements should be in place prior to occupancy ON SITE ROADWAY IMPROVEMENTS The recommended site adjacent roadway improvements for the Project are described below. Exhibit 1 3 illustrates the site adjacent roadway improvement recommendations. is a north south oriented roadway located along the Project s western boundary. is built to its ultimate number of travel lanes as indicated in the City of Fontana General Plan Circulation Element. Additional curb, gutter and parkway improvements are recommended along the Project s frontage consistent with City of Fontana standards and final conditions of approval. Mango Avenue Construct an additional 16 foot paved section in conjunction with 12 foot parkway of Mango Avenue from the Project s northern boundary to southern boundary prior to the Project s opening day to accommodate Project truck traffic and minimize truck traffic on, north of Sierra Lakes Parkway, in compliance with the applicable City of Fontana standards. A 28 foot paved section of Mango Avenue has recently been constructed by adjacent development SITE ACCESS IMPROVEMENTS The recommended site access driveway improvements for the Project are described below. Exhibit 1 3 illustrates the on site and site adjacent recommended roadway lane improvements Traffic Study Rev 9
20 Table 1 2 Summary of Intersection Improvements # Intersection Location Jurisdiction Existing (2014) E+P Recommended Improvements 1 Improvements in DIF? OYC (2016) Without Project OYC (2016) With Project HY (2035) Without Project HY (2035) With Project Total Cost 2,3,4 Fair Share Fair Share % 5 Cost 4 1 Sierra Av. / Summit Av. Fontana Restripe EB left turn lane as a shared left right turn lane Same No $37, % $ 378 2nd NB through lane Same Yes $267,120 $ 3rd NB through lane Same Yes $267,120 $ 5 7 Sierra Av. / Sierra Lakes Pkwy. Sierra Av. / SR 210 EB Ramps Fontana Modify the traffic signal to accommodate overlap phasing for EB right turn lane Same Same Same Same Same No $111, % $ 2,545 Restripe 2nd EB through lane as a 2nd EB right turn lane Same No $37,100 $ 848 Caltrans 3rd SB through lane Same No $267, % $ 2,359 Restripe EB shared left through right turn lane as a 2nd EB right turn lane Same No $37,100 $ 328 Total Costs for Horizon Year (2035) Improvements $1,023,960 $ 6,458 All recommended improvements are consistent with the general plan designations of the respective jurisdictions in which they are located. Costs have been estimated using the data provided in Appendix "G" of the CMP (2003 Update) for preliminary construction costs. Appendix "G" costs escalated by factor of Rough order of magnitude cost estimate. Program improvements constructed by project may be eligible for fee credit, at discretion of City. See Table 9 2 for Fair Share Calculations
21 11
22 Sierra Lakes Commerce Center Traffic Impact Analysis Construction of on site and site adjacent improvements shall occur in conjunction with adjacent Project development activity or as needed for Project access purposes. at Clubhouse Drive / Driveway 1 Modify the traffic signal to include the westbound approach and construct the intersection with the following geometrics: Northbound Approach: One left turn lane, three through lanes and one right turn lane. Southbound Approach: One left turn lane, three through lanes and one right turn lane. Eastbound Approach: One left turn lane and one shared through right turn lane. Westbound Approach: One left turn lane and one shared through right turn lane. Provide signage to restrict trucks access. at Driveway 2 Install a stop control on the westbound approach and construct the intersection with the following geometrics: Northbound Approach: Two through lanes and one shared through right turn lane. Southbound Approach: Three through lanes. Eastbound Approach: Not applicable. Westbound Approach: One right turn lane. Provide signage to restrict trucks access. at Driveway 3 Install a stop control on the westbound approach and construct the intersection with the following geometrics: Northbound Approach: Two through lanes and one shared through right turn lane. Southbound Approach: Three through lanes. Eastbound Approach: Not applicable. Westbound Approach: One right turn lane. Mango Avenue at Driveway 4 Install a stop control on the eastbound approach and construct the intersection with the following geometrics: Northbound Approach: One shared left through lane. Southbound Approach: One shared through right turn lane. Eastbound Approach: One right turn lane. Westbound Approach: Not applicable. Mango Avenue at Driveway 5 Install a stop control on the eastbound approach and construct the intersection with the following geometrics: Northbound Approach: One shared left through lane Traffic Study Rev 12 12
23 Sierra Lakes Commerce Center Traffic Impact Analysis Southbound Approach: One shared through right turn lane. Eastbound Approach: One shared left right turn lane. Westbound Approach: Not applicable. Mango Avenue at Driveway 6 Install a stop control on the eastbound approach and construct the intersection with the following geometrics: Northbound Approach: One shared left through lane. Southbound Approach: One shared through right turn lane. Eastbound Approach: One shared left right turn lane. Westbound Approach: Not applicable. On site traffic signing and striping should be implemented in conjunction with detailed construction plans for the Project site. Sight distance at each project access point should be reviewed with respect to standard Caltrans and City of Fontana sight distance standards at the time of preparation of final grading, landscape and street improvement plans Traffic Study Rev 13 13
24 Sierra Lakes Commerce Center Traffic Impact Analysis This Page Intentionally Left Blank Traffic Study Rev 14 14
25 Sierra Lakes Commerce Center Traffic Impact Analysis 2 METHODOLOGIES This section of the report presents the methodologies used to perform the traffic analyses summarized in this report. The methodologies described are consistent with City of Fontana, San Bernardino County Congestion Management Program (CMP) and Caltrans traffic study guidelines. (3) (2) (4) 2.1 LEVEL OF SERVICE Traffic operations of roadway facilities are described using the term "Level of Service" (LOS). LOS is a qualitative description of traffic flow based on several factors such as speed, travel time, delay, and freedom to maneuver. Six levels are typically defined ranging from LOS A, representing completely free-flow conditions, to LOS F, representing breakdown in flow resulting in stop-and-go conditions. LOS E represents operations at or near capacity, an unstable level where vehicles are operating with the minimum spacing for maintaining uniform flow. 2.2 INTERSECTION CAPACITY ANALYSIS The definitions of LOS for interrupted traffic flow (flow restrained by the existence of traffic signals and other traffic control devices) differ slightly depending on the type of traffic control. The LOS is typically dependent on the quality of traffic flow at the intersections along a roadway. The Highway Capacity Manual (HCM) methodology expresses the LOS at an intersection in terms of delay time for the various intersection approaches. (5) The HCM uses different procedures depending on the type of intersection control SIGNALIZED INTERSECTIONS The City of Fontana requires signalized intersection operations analysis based on the methodology described in Chapter 16 of the HCM. (5) Intersection LOS operations are based on an intersection s average control delay. Control delay includes initial deceleration delay, queue move-up time, stopped delay, and final acceleration delay. For signalized intersections LOS is directly related to the average control delay per vehicle and is correlated to a LOS designation as described in Table 2-1. TABLE 2-1: SIGNALIZED INTERSECTION LOS THRESHOLDS Level of Service A B C Description Operations with very low delay occurring with favorable progression and/or short cycle length. Operations with low delay occurring with good progression and/or short cycle lengths. Operations with average delays resulting from fair progression and/or longer cycle lengths. Individual cycle failures begin to appear. Average Control Delay (Seconds) 0 to to to Traffic Study Rev 15 15
26 Sierra Lakes Commerce Center Traffic Impact Analysis Level of Description Service Operations with longer delays due to a combination of unfavorable D progression, long cycle lengths, or high V/C ratios. Many vehicles stop and individual cycle failures are noticeable. Operations with high delay values indicating poor progression, long E cycle lengths, and high V/C ratios. Individual cycle failures are frequent occurrences. This is considered to be the limit of acceptable delay. Operation with delays unacceptable to most drivers occurring due to F over saturation, poor progression, or very long cycle lengths Source: HCM 2000, Chapter 16 Average Control Delay (Seconds) to to and up All the study area intersections have been analyzed using the software package Traffix (Version 8.0 R1, 2008). The LOS analysis for signalized intersections has been performed using optimized signal timing. This analysis has included an assumed lost time of four seconds per critical phase in accordance with San Bernardino County CMP recommended default values. (2) There were nominal pedestrian crossings (less than 5) observed during peak hours based on counts at the study area intersections. As such, a minimum green time of 10 seconds was used in the analysis. The peak hour traffic volumes have been adjusted using a peak hour factor (PHF) to reflect peak 15 minute volumes. Common practice for LOS analysis is to use a peak 15-mintue rate of flow. However, flow rates are typically expressed in vehicles per hour. The PHF is the relationship between the peak 15-minute flow rate and the full hourly volume (e.g. PHF = [Hourly Volume] / [4 x Peak 15-minute Flow Rate]). The use of a 15-minute PHF produces a more detailed analysis as compared to analyzing vehicles per hour. Existing PHFs have been used for all analysis scenarios. Per Chapter 8 of the HCM 2000, PHF values over 0.95 often are indicative of high traffic volumes with capacity constraints on peak hour flows while lower PHF values are indicative of greater variability of flow during the peak hour. (5) Saturation flow rates of 1,800 vehicles per hour of green (vphg) for through and right-turn lanes and 1,700 vphg for single left-turn lanes, 1,600 vphg per lane for dual left-turn lanes, and 1,500 vphg per lane for triple left-turn lanes have been assumed for all capacity analysis under Existing (2014) and Opening Year Cumulative conditions. For Horizon Year (2035) conditions, saturation flow rates of 1,900 vphg for through and right-turn lanes and 1,800 vphg for single left-turn lanes, 1,700 vphg per lane for dual left-turn lanes, 1,600 vphg per lane for triple left-turn lanes, and 1,800 vphg per lane for dual right-turn lanes have been assumed. These saturation flow rates are consistent with the recommended values in the CMP. (2) UNSIGNALIZED INTERSECTIONS The City of Fontana requires the operations of unsignalized intersections be evaluated using the methodology described in Chapter 17 of the HCM. (5) The LOS rating is based on the weighted average control delay expressed in seconds per vehicle (see Table 2-2) Traffic Study Rev 16 16
27 Sierra Lakes Commerce Center Traffic Impact Analysis Level of Service TABLE 2-2: UNSIGNALIZED INTERSECTION LOS THRESHOLDS Description Average Control Delay Per Vehicle (Seconds) A Little or no delays. 0 to B Short traffic delays to C Average traffic delays to D Long traffic delays to E Very long traffic delays to F Extreme traffic delays with intersection capacity exceeded. > Source: HCM 2000, Chapter 17 At two-way or side-street stop-controlled intersections, LOS is calculated for each controlled movement and for the left turn movement from the major street, as well as for the intersection as a whole. For approaches composed of a single lane, the delay is computed as the average of all movements in that lane. For all-way stop controlled intersections, LOS is computed for the intersection as a whole. 2.3 LOS CRITERIA The definition of an intersection deficiency has been obtained from each of the applicable jurisdictions. The City of Fontana has set the goal for acceptable LOS as LOS C or better, wherever feasible (see Goal #1, Policy #12 of the City of Fontana General Plan Circulation Element). However, in some instances maintaining the LOS C threshold within a built environment may require extensive roadway widening that could affect existing uses, property rights and substantial costs associated with implementing these improvements. In the event that the improvements required to maintain LOS C is determined to be infeasible, the City of Fontana recognizes that LOS D may be considered the worst acceptable level of service in urbanized areas of the City. Per the San Bernardino County Congestion Management Program (CMP), the acceptable LOS of service for CMP intersections is LOS E or better. However, for the purposes of this analysis, LOS D has been considered the LOS threshold for CMP intersections, consistent with the minimum LOS thresholds utilized by Caltrans. The following study area intersections are identified as CMP intersections (see Table 2-3): TABLE 2-3: CMP INTERSECTIONS IN THE CITY OF FONTANA ID Intersection Location Jurisdiction 6 / SR-210 Westbound Ramps Caltrans 7 / SR-210 Eastbound Ramps Caltrans Traffic Study Rev 17 17
28 Sierra Lakes Commerce Center Traffic Impact Analysis 2.4 THRESHOLDS OF SIGNIFICANCE For purposes of analyzing California Environmental Quality Act (CEQA) impacts, the E+P scenario will be used to establish direct project impacts. To determine whether the addition of Project traffic at a study intersection results in a significant impact, the following thresholds of significance have been utilized: A significant impact occurs at a study intersection if the addition of project trips causes the peak hour LOS to fall from acceptable (LOS A, B, or C) to an unacceptable (LOS D, E or F or see applicable jurisdictional LOS criteria). Cumulative traffic impacts are deficiencies that are not directly caused by the Project, but occur as a result of regional growth combined with that or other nearby cumulative development projects. The Project s contribution to a particular cumulative transportation deficiency is deemed cumulatively considerable if the Project adds significant traffic to the forecasted deficiency (as measured by the 50 or more peak hour trip threshold). A Project s contribution to a cumulatively considerable impact can be reduced to less than significant if the Project is required to implement or fund its fair share of improvements designed to alleviate the potential cumulative impact. If full funding of future cumulative improvements is not reasonably assured, a temporary unmitigated cumulative impact may occur until the needed improvement is fully funded and constructed. 2.5 PROJECT FAIR SHARE CALCULATION METHODOLOGY In cases where this TIA identifies that the proposed Project would have a significant cumulative impact to a roadway facility, and the recommended mitigation measure is a fair share monetary contribution, the following methodology was applied to determine the fair share contribution. A project s fair share contribution at an off-site study area intersection is determined based on the following equation, which is the ratio of Project traffic to new traffic, and new traffic is total future traffic subtracts existing baseline traffic: Project Fair Share % = Project Traffic / (2035 Total Traffic Existing Baseline Traffic) The Project fair share contribution calculations are presented in Section 9 Local and Regional Funding Mechanisms of this TIA Traffic Study Rev 18 18
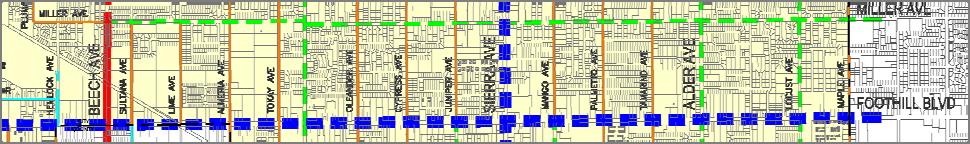
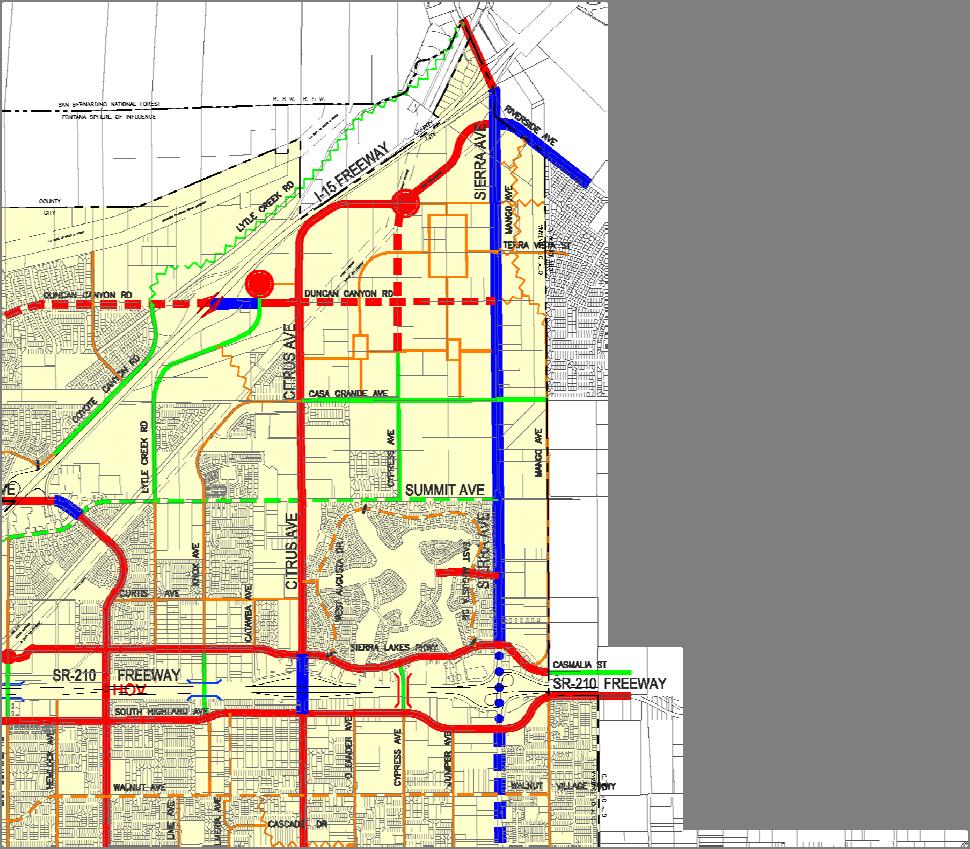
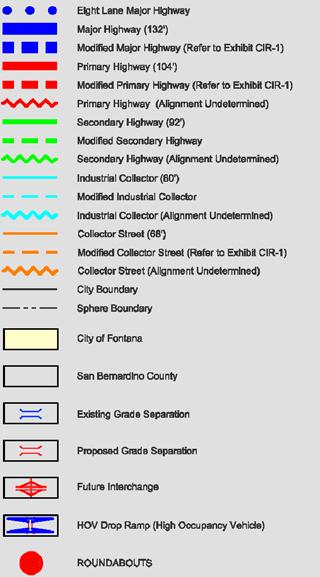
29 Sierra Lakes Commerce Center Traffic Impact Analysis 3 AREA CONDITIONS This section provides a summary of the existing circulation network, the City of Fontana General Plan Circulation Network, and a review of existing peak hour intersection operations. 3.1 EXISTING CIRCULATION NETWORK Pursuant to discussion with City of Fontana staff, the study area includes a total of eleven existing and future intersections as shown previously on Exhibit 1-1. Of these eleven intersections, the existing study area circulation network includes six intersections. Five intersections in the study area are future planned intersections that do not currently exist (Project driveways). Exhibit 3-1 illustrates the study area intersections located near the proposed Project and identifies the number of through traffic lanes for existing roadways and intersection traffic controls. 3.2 CITY OF FONTANA CIRCULATION MASTER PLAN As previously noted, the Project site is located within the City of Fontana. Exhibit 3-2 shows the City of Fontana Circulation Master Plan, and Exhibit 3-3 illustrates the City of Fontana General Plan roadway cross-sections. The roadway classifications and planned (ultimate) roadway cross-sections of the major roadways within the study area, as identified on the City of Fontana Circulation Master Plan, are described subsequently. Major Highways can accommodate six or eight travel lanes and may have raised medians. These facilities carry high traffic volumes and are the primary thoroughfares linking Fontana with adjacent cities and the regional highway system. Driveway access to these roadways is typically limited to provide efficient high volume traffic flow. Right of way (including sidewalks) on these facilities varies between 132 and 156 feet depending on the number of lanes. The following study area roadway within the City of Fontana is classified as Major Highway: Primary Highways are designed to accommodate four travel lanes with a median, within a typical 104-foot right of way, carry high traffic volumes and provide limited access. Their primary function is to link the major highways to the secondary highways as well as to carry vehicles entering and exiting the City from neighboring areas. Driveway access is also typically limited on these facilities, where feasible. The following study area roadways within the City of Fontana are classified as Primary Highways: Sierra Lakes Parkway Clubhouse Drive Traffic Study Rev 19 19
30 20

31 21
32 22
33 23
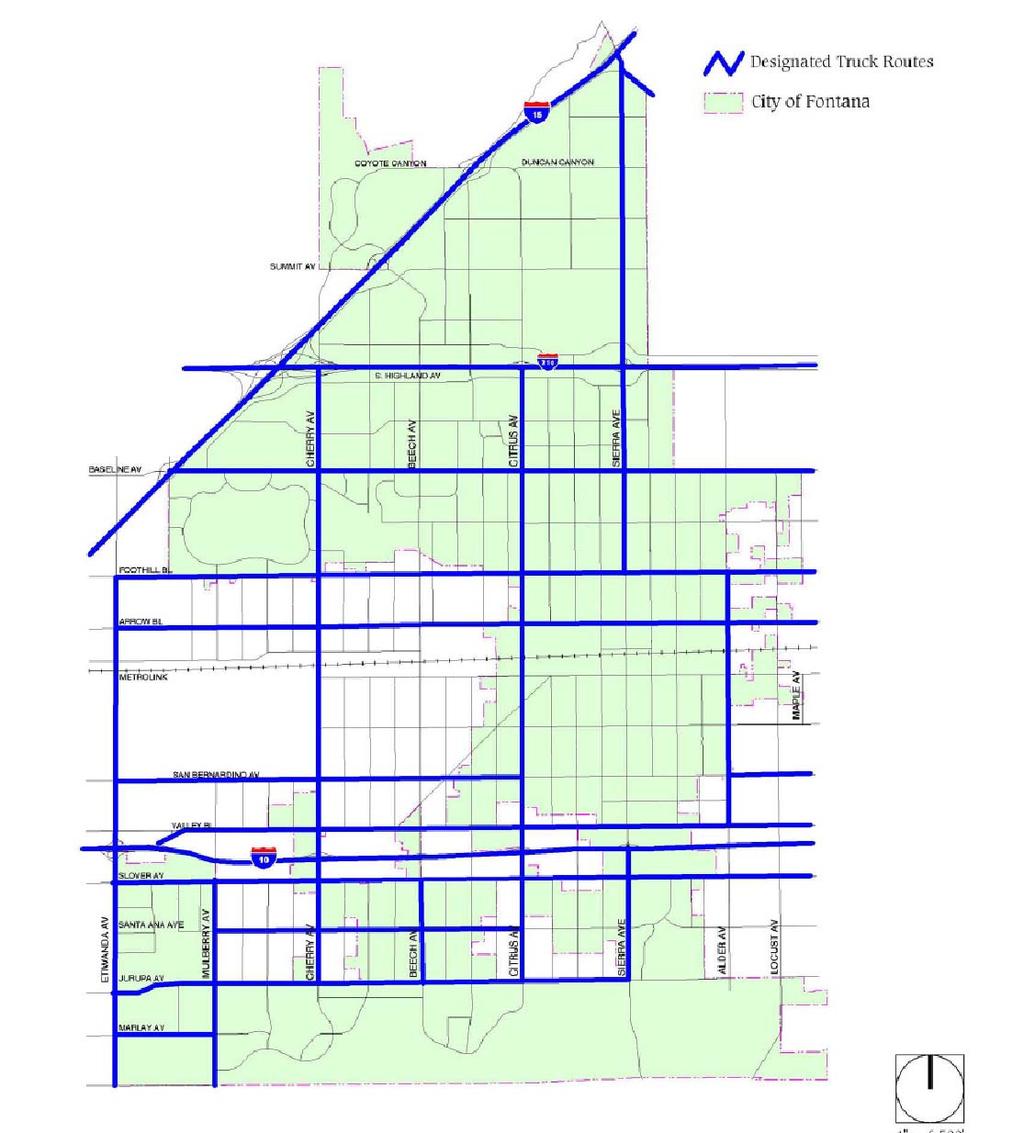
34 Sierra Lakes Commerce Center Traffic Impact Analysis Secondary Highways are typically four-lane streets, providing two lanes in each direction. These highways carry traffic along the perimeters of major developments, provide support to the major and primary highways, and are also through streets enabling traffic to travel uninterrupted for longer distances through the City. Secondary highways have a 92-foot wide right of way, which includes sidewalks. The following study area roadway within the City of Fontana is classified as Secondary Highway: Summit Avenue west of Collector Streets are typically two-lane streets that connect the local streets with the secondary highways allowing local traffic to access the regional transportation facilities. Collector streets have a 68-foot wide right of way and Industrial Collectors have a 80-foot right of way. The following study area roadway within the City of Fontana is classified as Collector Street: Mango Avenue 3.3 TRUCK ROUTES The City of Fontana designated truck route map is shown on Exhibit 3-4. is identified as designated City of Fontana truck route. The designated truck route map has been utilized to route truck traffic from both the proposed Project and future cumulative development projects throughout the study area. 3.4 TRANSIT SERVICE The study area is currently served by Omnitrans, a public transit agency serving various jurisdictions within San Bernardino County, with bus service along and Sierra Lakes Parkway via Route 82. The existing bus route provided within the area by Omnitrans is shown on Exhibit 3-5. Transit service is reviewed and updated by Omnitrans periodically to address ridership, budget and community demand needs. Changes in land use can affect these periodic adjustments which may lead to either enhanced or reduced service where appropriate. Based on the routes provided on Exhibit 3-5, it appears that Route 82 could potentially serve the Project in the future. 3.5 BICYCLE & PEDESTRIAN FACILITIES Field observations indicate nominal pedestrian and bicycle activity within the study area. Existing pedestrian facilities and bike lanes within the study area are shown on Exhibit Traffic Study Rev 24 24
35 25
36 26
37 27
38 Sierra Lakes Commerce Center Traffic Impact Analysis 3.6 EXISTING TRAFFIC COUNTS Manual AM and PM peak hour turning movement counts were conducted on May The raw manual peak hour turning movement traffic count data sheets are included in Appendix 3.1. The traffic counts collected in May 2014 include the vehicle classifications as shown below: Passenger Cars 2-Axle Trucks 3-Axle Trucks 4 or More Axle Trucks To represent the impact large trucks, buses and recreational vehicles have on traffic flow; all trucks were converted into PCEs. By their size alone, these vehicles occupy the same space as two or more passenger cars. In addition, the time it takes for them to accelerate and slow down is also much longer than for passenger cars, and varies depending on the type of vehicle and number of axles. For the purpose of this analysis, a PCE factor of 1.5 has been applied to 2-axle trucks, 2.0 for 3-axle trucks and 3.0 for 4+-axle trucks to estimate each turning movement. These factors are consistent with the values recommended for use in the CMP. (2) Existing average daily traffic (ADT) volumes on arterial highways throughout the study area are based upon factored intersection peak hour counts collected by Urban Crossroads, Inc. using the following formula for each intersection leg: Weekday PM Peak Hour (Approach Volume + Exit Volume) x = Leg Volume Based on a comparison of PM peak hour traffic count data to 24-hour tube count data along roadway segments in close proximity to the study area, it was determined that the PM peak hour volumes were approximately eight percent of the total 24-hour daily volume on select segments. As such, it was determined that the above equation could be utilized to approximate the ADT volume on the study area segments based on the same relationship (i.e., 8 percent PM peak-to-daily relationship). Existing ADT, AM and PM peak hour intersection volumes are shown on Exhibit 3-7. All of the intersection turning movement volumes illustrated on the exhibits and used in the traffic analysis are shown in terms of PCE. 3.7 EXISTING CONDITIONS INTERSECTION OPERATIONS ANALYSIS Existing (2014) peak hour traffic operations have been evaluated for the study area intersections based on the analysis methodologies presented in Section 2.2 Intersection Capacity Analysis of this report. The intersection operations analysis results are summarized in Table 3-1 which indicates that the existing study area intersections are currently operating at acceptable LOS during the peak hours with the exception of the following intersection: ID Intersection Location Level of Service 5 / Sierra Lakes Parkway LOS D, PM peak hour Traffic Study Rev 28 28
39 29
40 Table 3 1 Existing (2014) Conditions Intersection Analysis Summary ID Intersection 4 Intersection Approach Lanes 2 HCM Delay 3 Level of Traffic Northbound Southbound Eastbound Westbound (secs.) Service Control 1 Acceptable L T R L T R L T R L T R AM PM AM PM LOS 1 Sierra Av. / Summit Av. TS B B C 2 Sierra Av. / Clubhouse Dr. TS B B C 3 Sierra Av. / Driveway 2 Future Intersection Not Applicable C 4 Sierra Av. / Driveway 3 Future Intersection Not Applicable C 5 Sierra Av. / Sierra Lakes Pkwy. TS C D C 6 Sierra Av. / SR 210 WB Ramps TS 0 3 2>> 0 2 2>> ! B B D 7 Sierra Av. / SR 210 EB Ramps TS 0 3 1>> 0 2 2>> 1 1! A B D 8 Mango Av. / Driveway 4 Future Intersection Not Applicable C 9 Mango Av. / Driveway 5 Future Intersection Not Applicable C 10 Mango Av. / Driveway 6 Future Intersection Not Applicable C 11 Mango Av. / Sierra Lakes Pkwy. TS B B C * BOLD = LOS does not meet the applicable jurisdictional requirements (i.e., unacceptable LOS) TS = Traffic Signal When a right turn is designated, the lane can either be striped or unstriped. To function as a right turn lane there must be sufficient width for right turning vehicles to travel outside the through lanes (minimum 20 feet). L = Left; T = Through; R = Right; 1! = Shared Left Through Right Turn Lane; > = Right Turn Overlap Phasing; >> = Free Right Turn Lane Delay and level of service calculated using the following analysis software: Traffix (Version 8.0 R1, 2008) for signalized and unsignalized intersections. Per the 2000 Highway Capacity Manual, overall average intersection delay and level of service are shown for intersections with a traffic signal. For intersections with cross street stop control, the delay and level of service for the worst individual movement (or movements sharing a single lane) are shown. Pedestrians not accommodated on every cycle. 30
41 Sierra Lakes Commerce Center Traffic Impact Analysis Consistent with Table 3-1, a summary of the peak hour intersection LOS for Existing conditions are shown on Exhibit 3-8. The intersection operations analysis worksheets are included in Appendix 3.2 of this TIA. 3.8 EXISTING CONDITIONS RECOMMENDED IMPROVEMENTS Improvement strategies have been recommended to reduce the peak hour delay and LOS to acceptable levels for Existing conditions. The effectiveness of the recommended improvements discussed below for Existing traffic conditions are presented in Table 3-2. / Sierra Lakes Parkway (#5) This intersection was found to operate at an unacceptable LOS (LOS D ) during the weekday PM peak hour under Existing conditions. Recommended Improvement / Sierra Lakes Parkway (#5) The following improvements are necessary to reduce the peak hour delay and LOS to acceptable levels for Existing traffic conditions: Modify the traffic signal to implement overlap phasing on eastbound right turn lane. Existing traffic conditions intersection operations analysis worksheets, with recommended improvements, are provided in Appendix Traffic Study Rev 31 31
42 32
43 Table 3 2 Existing (2014) Conditions Intersection Analysis Summary, with Improvements ID Intersection 4 Traffic Control 1 L T R L T R L T R L T R AM PM AM PM 5 Sierra Av. / Sierra Lakes Pkwy. with Existing Geometry TS C D with Improvements TS > C C * BOLD = LOS does not meet the applicable jurisdictional requirements (i.e., unacceptable LOS). 1 TS = Traffic Signal 2 When a right turn is designated, the lane can either be striped or unstriped. To function as a right turn lane there must be sufficient width for right turning vehicles to travel outside the through lanes (minimum 20 feet). 3 Delay and level of service calculated using the following analysis software: Traffix (Version 8.0 R1, 2008) for signalized intersections. Per the 2000 Highway Capacity Manual, overall average intersection delay and level of service are shown for intersections with a traffic signal. 4 Pedestrians not accommodated on every cycle. Intersection Approach Lanes 2 HCM Delay 3 Northbound Southbound Eastbound Westbound L = Left; T = Through; R = Right; > = Right Turn Overlap Phasing; 1 = Improvement (secs.) Level of Service 33
44 Sierra Lakes Commerce Center Traffic Impact Analysis This Page Intentionally Left Blank Traffic Study Rev 34 34
45 Sierra Lakes Commerce Center Traffic Impact Analysis 4 PROJECTED FUTURE TRAFFIC This section presents the traffic volumes estimated to be generated by the Project, as well as the Project s trip assignment onto the study area roadway network. The proposed Project is anticipated to consist of the development of up to 597,818 sf of highcube warehouse use in a single building generally located on the southeast corner of Sierra Avenue and Clubhouse Drive in the City of Fontana. The Project is anticipated to be constructed and occupied by the year Access to the site will be provided via three driveways on and three driveways along the future Mango Avenue. 4.1 PROJECT TRIP GENERATION Trip generation represents the amount of traffic which is both attracted to and produced by a development. Determining traffic generation for a specific project is therefore based upon forecasting the amount of traffic that is expected to be both attracted to and produced by the specific land uses being proposed for a given development. The ITE Trip Generation manual is a nationally recognized source for estimating site specific trip generation. ITE recently released an updated edition of the Trip Generation manual (9 th Edition) in (6) The Trip Generation manual is based on more than 4,800 trip generation studies submitted to ITE by public agencies, consulting firms, universities/colleges, developers, associations and local sections/districts/student chapters of ITE. High-cube warehouse/distribution centers (ITE Land Use Code 152) are a unique land use type within the larger, more generalized industrial land use category. ITE s most recent edition of the Trip Generation manual (ITE 9 th Edition), published in 2012, defines high-cube warehouses as used for storage of materials, goods and merchandise prior to their distribution to retail outlets, distribution centers or other warehouses. These facilities are typically characterized by ceiling heights of at least 24 feet with small employment counts due to a high level of mechanization. The average square footage for the sites surveyed for high-cube warehouse/distribution center (Land Use 152) use is above 500,000 square feet. The number of sites observed in the compilation of this data ranges from sites of which more than 20 sites exceed 1,000,000 square feet in gross floor area. The weighted average daily trip generation rate for high-cube warehouse (Land Use 152) use is 1.68 trips per thousand square feet (TSF). The ITE Trip Generation manual includes data regarding the types of vehicles that are generated (passenger cars and trucks), but provides no guidance on vehicle mix (different sizes of trucks). While trucks, as a percentage of total traffic, has been based on the ITE Trip Generation manual, data regarding the vehicle mix has been obtained from a separate report; the South Coast Air Quality Management District s (SCAQMD) recent Warehouse Truck Trip Study. (7) The SCAQMD is currently recommending the use of the ITE Trip Generation manual in conjunction with their truck mix by axle-type to better quantify trip rates associated with local warehouse and Traffic Study Rev 35 35
46 Sierra Lakes Commerce Center Traffic Impact Analysis distribution projects, as truck emission represent more than 90 percent of air quality impacts from these projects. This recommended procedure has been utilized for the purposes of this analysis in effort to be consistent with other technical studies prepared for the Project. Trip generation rates used to estimate Project traffic and a summary of the Project s trip generation (actual vehicles) are shown in Table 4-1. As shown on Table 4-1, the Project is anticipated to generate a net total of approximately 1,004 trip-ends per day with 66 AM peak hour trips and 72 PM peak hour trips. PCE factors have been applied to the trip generation rates for heavy trucks (large 2-axles, 3- axles, 4+-axles). As directed by the City of Fontana and consistent with standard traffic engineering practice in Southern California, PCE factors have been utilized due to the expected heavy truck component for the proposed Project uses. PCE factors allow the typical realworld mix of vehicle types to be represented as a single, standardized unit, such as the passenger car, for the purposes of capacity and LOS analyses. PCE factors are applied to large truck types such as large two-axles, three-axles, 4+-axles. A PCE factor of 1.5 has been applied to large 2-axle trucks, a factor of 2.0 for 3-axle trucks and a factor of 3.0 for 4+-axle trucks. These PCE factors are consistent with the values recommended by the San Bernardino County CMP and are accepted factors in the City of Fontana. (2) Trip generation rates used to estimate Project traffic and a summary of the Project s trip generation (in PCE) are shown in Table 4-2. As shown on Table 4-2, the Project is anticipated to generate a net total of approximately 1,576 PCE trip-ends per day with 93 PCE AM peak hour trips and 108 PCE PM peak hour trips. In light of using conservative trip generation rates and vehicle mix in conjunction with the application of PCE factors, it is anticipated that the analysis would overstate as opposed to understate potential traffic impacts associated with the Project. 4.2 PROJECT TRIP DISTRIBUTION Trip distribution is the process of identifying the probable destinations, directions or traffic routes that will be utilized by Project traffic. The potential interaction between the planned land uses and surrounding regional access routes are considered, to identify the route where the Project traffic would distribute. The Project trip distribution was developed based on anticipated travel patterns to and from the Project site for both passenger cars and truck traffic. The truck trip distribution patterns have been developed based on the anticipated travel patterns for the high-cube warehousing trucks. The Project trip distribution patterns for both passenger cars and trucks were developed based on an understanding of existing travel patterns in the area, the geographical location of the site, and the site s proximity to the regional arterial and state highway system. The Project passenger car trip distribution patterns are graphically depicted on Exhibits 4-1 and 4-2 and the Project truck trip distribution patterns are graphically depicted on Exhibits 4-3 and Traffic Study Rev 36 36
47 Table 4-1 Project Trip Generation Summary (Actual Vehicles) 1 Project Trip Generation Rates ITE LU AM Peak Hour PM Peak Hour Land Use 1 Units 3 Code Inbound Outbound Total Inbound Outbound Total Daily High Cube Warehouse 2 TSF Passenger Cars Axle Trucks Axle Trucks Axle+ Trucks Project Trip Generation Summary AM Peak Hour PM Peak Hour Land Use Quantity Units 3 In Out Total In Out Total Daily Building TSF Passenger Cars: Truck Trips: axle: axle: axle: Net Truck Trips Passenger Cars Net Truck Trips Total Net Trips ,004 1 Trip Generation Source: Institute of Transportation Engineers (ITE), Trip Generation manual, Ninth Edition (2012). 2 Vehicle Mix Source: Total truck percentage source from ITE Trip Generation manual. Truck mix (by axle type) source from SCAQMD. AM peak hour = 72.7% passenger cars, 6.01% 2 Axle trucks, 4.83% 3 Axle trucks, 16.46% 4 Axle trucks PM peak hour = 66.7% passenger cars, 7.33% 2 Axle trucks, 5.89% 3 Axle trucks, 20.08% 4 Axle trucks ADT = 61.9% passenger cars, 8.38% 2 Axle trucks, 6.74% 3 Axle trucks, 22.98% 4 Axle trucks 3 TSF = thousand square feet 4 TOTAL TRIPS = Passenger Cars + Net Truck Trips 37
48 Table 4-2 Project Trip Generation Summary (in PCE) 1 ITE LU AM Peak Hour PM Peak Hour Land Use 1 Units 3 Code Inbound Outbound Total Inbound Outbound Total Daily High Cube Warehouse 2 TSF Passenger Cars Axle Trucks (PCE = 1.5) Axle Trucks (PCE = 2.0) Axle+ Trucks (PCE = 3.0) AM Peak Hour PM Peak Hour Land Use Quantity Units 3 In Out Total In Out Total Daily Building TSF Passenger Cars: Truck Trips: axle: axle: axle: Net Truck Trips (PCE) Passenger Cars Net Truck Trips (PCE) Total Net Trips (PCE) ,576 1 Trip Generation Source: Institute of Transportation Engineers (ITE), Trip Generation Manual, Ninth Edition (2012). 2 Vehicle Mix Source: Total truck percentage source from ITE Trip Generation manual. Truck mix (by axle type) source from SCAQMD. PCE rates are per SANBAG. AM peak hour = 72.7% passenger cars, 6.01% 2 Axle trucks, 4.83% 3 Axle trucks, 16.46% 4 Axle trucks PM peak hour = 66.7% passenger cars, 7.33% 2 Axle trucks, 5.89% 3 Axle trucks, 20.08% 4 Axle trucks ADT = 61.9% passenger cars, 8.38% 2 Axle trucks, 6.74% 3 Axle trucks, 22.98% 4 Axle trucks 3 TSF = thousand square feet 4 TOTAL TRIPS (PCE) = Passenger Cars + Net Truck Trips (PCE). 38
49 39
50 40
PLAZA MEXICO RESIDENCES
 PLAZA MEXICO RESIDENCES TRAFFIC STUDY PREPARED FOR: 3000 E. IMPERIAL, LLC. 6940 Beach Boulevard, D-501 Buena Park, California 90621 PREPARED BY: OCTOBER 5, 2017 translutions the transportatio n solutions
Market Street PDP. Nassau County, Florida. Transportation Impact Analysis. VHB/Vanasse Hangen Brustlin, Inc. Nassau County Growth Management
 Transportation Impact Analysis Market Street PDP Nassau County, Florida Submitted to Nassau County Growth Management Prepared for TerraPointe Services, Inc. Prepared by VHB/Vanasse Hangen Brustlin, Inc.
SUBJECT: SUMMARY OF FINDINGS. October 29, Mr. Carter Redish Carter Group Architects, Inc S. El Camino Real, Suite F San Clemente, CA 92672
 October 29, 2018 Mr. Carter Redish Carter Group Architects, Inc. 1810 S. El Camino Real, Suite F San Clemente, CA 92672 SUBJECT: CANYON STEEL FOCUSED TRAFFIC IMPACT ANALYSIS Dear Mr. Carter Redish: Urban
Traffic Impact Study
 Traffic Impact Study Statham DRI One University Parkway Prepared for: Barrow County Prepared by: October 2012 Table of Contents Executive Summary i Section 1. Introduction 1 Project Description 1 Methodology
TRAFFIC IMPACT STUDY. Platte Canyon Villas Arapahoe County, Colorado (Arapahoe County Case Number: Z16-001) For
 For") TRAFFIC IMPACT STUDY For Platte Canyon Villas Arapahoe County, Colorado (Arapahoe County Case Number: Z16-001) February 2015 Revised: August 2015 April 2016 July 2016 September 2016 Prepared for: KB Home
TRAFFIC IMPACT STUDY For Platte Canyon Villas Arapahoe County, Colorado (Arapahoe County Case Number: Z16-001) February 2015 Revised: August 2015 April 2016 July 2016 September 2016 Prepared for: KB Home
NATHAN HALE HIGH SCHOOL PARKING AND TRAFFIC ANALYSIS. Table of Contents
 Parking and Traffic Analysis Seattle, WA Prepared for: URS Corporation 1501 4th Avenue, Suite 1400 Seattle, WA 98101-1616 Prepared by: Mirai Transportation Planning & Engineering 11410 NE 122nd Way, Suite
FINAL Traffic Report for the Proposed Golden Valley Road and Newhall Ranch Road Projects in the City of Santa Clarita, California May 5, 2005
 FINAL Traffic Report for the Proposed Golden Valley Road and Newhall Ranch Road Projects in the City of Santa Clarita, California May 5, 2005 Prepared For: EDAW, Inc. 1420 Kettner Boulevard, Suite 620
WEBER ROAD RESIDENTIAL DEVELOPMENT Single Family Residential Project
 WEBER ROAD RESIDENTIAL DEVELOPMENT Single Family Residential Project WEBER ROAD RESIDENTIAL DEVELOPMENT TRAFFIC IMPACT STUDY TABLE OF CONTENTS 1.0 Executive Summary Page 2.0 Introduction 2.1 DEVELOPMENT
CVS Derwood. Local Area Transportation Review
 CVS Derwood Montgomery County, Maryland May 27, 2016 Local Area Transportation Review Prepared for: JC Bar Properties, Inc. Steve Fleming, PE 415 Fallowfield Road, Suite 301 Camp Hill, Pennsylvania 17011
JEP John E. Jack Pflum, P.E. Consulting Engineering 7541 Hosbrook Road, Cincinnati, OH Telephone:
 JEP John E. Jack Pflum, P.E. Consulting Engineering 7541 Hosbrook Road, Cincinnati, OH 45243 Email: jackpflum1@gmail.com Telephone: 513.919.7814 MEMORANDUM REPORT Traffic Impact Analysis Proposed Soccer
April 10, Mr. Curt Van De Walle, City Manager City of Castle Hills 209 Lemonwood Drive Castle Hills, Texas 78213
 Mr. Curt Van De Walle, City Manager City of Castle Hills 209 Lemonwood Drive Castle Hills, Texas 78213 Subject: Revised Castle Hills BASIS Charter School Traffic Impact Analysis Review City of Castle Hills,
Traffic Impact Analysis. for the STARBUCKS STORE. Located at 9900 BALBOA BOULEVARD. Submitted to CITY OF LOS ANGELES. January 2017.
 Traffic Impact Analysis for the STARBUCKS STORE Located at 9900 BALBOA BOULEVARD Submitted to CITY OF LOS ANGELES January 2017 Submitted By January 5, 2017 Ken A. Aitchison, P.E. Transportation Engineering
MEMORANDUM. The study area of the analysis was discussed with City staff and includes the following intersections:
 MEMORANDUM DATE: JULY 6, 2012 TO: FROM: RE: CC: MELANIE KNIGHT BRAD BYVELDS/ JENNIFER LUONG 1050 SOMERSET STREET PRELIMINARY TRAFFIC ANALYSIS OUR FILE NO. 111152 NEIL MALHOTRA The purpose of this memo
TRAFFIC IMPACT STUDY MANUFACTURING COMPANY
 TRAFFIC IMPACT STUDY For MANUFACTURING COMPANY Prepared For: Airway Heights, WA Prepared By: SUNBURST ENGINEERING, P. S. 4310 S. Ball Dr. Veradale, WA 99037 April, 2013 TRAFFIC IMP ACT STUDY Manufacturing
DOLLAR GENERAL PROJECT FOCUSED TRAFFIC ANALYSIS (REVISED) May 20, 2015
 May 20, 2015") DOLLAR GENERAL PROJECT FOCUSED TRAFFIC ANALYSIS (REVISED) May 20, 2015 May 20, 2015 Mr. Dan Biswas, VP of Development CJS DEVELOPMENT II, LLC 5111 North Scottsdale Road, Suite 200 Scottsdale, CA 85250
DOLLAR GENERAL PROJECT FOCUSED TRAFFIC ANALYSIS (REVISED) May 20, 2015 May 20, 2015 Mr. Dan Biswas, VP of Development CJS DEVELOPMENT II, LLC 5111 North Scottsdale Road, Suite 200 Scottsdale, CA 85250
III. FORECASTED GROWTH
 III. FORECASTED GROWTH In order to properly identify potential improvement projects that will be required for the transportation system in Milliken, it is important to first understand the nature and volume
Metro Emergency Security Operations Center (ESOC) 410 Center Street City of Los Angeles
 410 Center Street City of Los Angeles") Metro Emergency Security Operations Center (ESOC) 410 Center Street City of Los Angeles Traffic Study August 31, 2015 AECOM 515 South Flower Street, 4 th Floor Los Angeles, CA 90071 Job Number: 60323255
Metro Emergency Security Operations Center (ESOC) 410 Center Street City of Los Angeles Traffic Study August 31, 2015 AECOM 515 South Flower Street, 4 th Floor Los Angeles, CA 90071 Job Number: 60323255
Appendixx C Travel Demand Model Development and Forecasting Lubbock Outer Route Study June 2014
 Appendix C Travel Demand Model Development and Forecasting Lubbock Outer Route Study June 2014 CONTENTS List of Figures-... 3 List of Tables... 4 Introduction... 1 Application of the Lubbock Travel Demand
Appendix C Traffic Study
 Final Environmental Impact Statement Appendix C Traffic Study Schofield Generating Station Project, Hawaii October 2015 C-1 Final Environmental Impact Statement This page intentionally left blank. Schofield
Subject: Desert Palisades Specific Plan - Tram Way Access Sight Distance
 Endo Engineering Traffic Engineering Air Quality Studies Noise Assessments July 13, 2015 Mr. Ed Freeman Pinnacle View, LLC P.O. Box 1754 Lake Oswego, OR 97035-0579 Subject: Desert Palisades Specific Plan
MnDOT Method for Calculating Measures of Effectiveness (MOE) From CORSIM Model Output
 From CORSIM Model Output") MnDOT Method for Calculating Measures of Effectiveness (MOE) From CORSIM Model Output Rev. April 29, 2005 MnDOT Method for Calculating Measures of Effectiveness (MOE) From CORSIM Model Output Table of
MnDOT Method for Calculating Measures of Effectiveness (MOE) From CORSIM Model Output Rev. April 29, 2005 MnDOT Method for Calculating Measures of Effectiveness (MOE) From CORSIM Model Output Table of
ALTA VISTA COMMERCIAL/ RESIDENTIAL PROJECT
 ALTA VISTA COMMERCIAL/ RESIDENTIAL PROJECT TRAFFIC IMPACT ANALYSIS Prepared For: Paul Conzelman SC Development 2151 Michelson Drive, Suite 140 Irvine, CA 92612 Prepared By: 2030 Main Street, Suite 1200
California Urban Infill Trip Generation Study. Jim Daisa, P.E.
 California Urban Infill Trip Generation Study Jim Daisa, P.E. What We Did in the Study Develop trip generation rates for land uses in urban areas of California Establish a California urban land use trip
Table of Contents Introduction... 4 Study Area... 5
 Table of Contents Introduction... 4 Study Area... 5 Streets and s... 5 Traffic Volumes... 8 Recent and Anticipated Development... 10 Crash Analysis... 10 Projected Traffic Volumes... 11 Trip Generation...
Final City of Colusa STREETS & ROADWAYS MASTER PLAN. October J Street Suite 390 Sacramento, CA 95814
 Final City of Colusa STREETS & ROADWAYS MASTER PLAN October 2009 660 J Street Suite 390 Sacramento, CA 95814 TABLE OF CONTENTS I. INTRODUCTION... 1 Report Organization...1 II. ANALYSIS METHODOLOGY... 2
6711 LEE HIGHWAY TRAFFIC IMPACT STUDY ARLINGTON, VIRGINIA
 6711 TRAFFIC IMPACT STUDY ARLINGTON, VIRGINIA Prepared for: NVR, Inc. Prepared by: Wells + Associates, Inc. Michael J. Workosky, PTP, TOPS, TSOS John J. Andrus William L. Zeid, PE 703.917.6620 May 4, 2017
TRAFFIC STUDY FOR THE GAFFEY POOL PROJECT LOS ANGELES, CALIFORNIA CITY OF LOS ANGELES, BUREAU OF ENGINEERING OCTOBER 2013 PREPARED FOR PREPARED BY
 TRAFFIC STUDY FOR THE GAFFEY POOL PROJECT LOS ANGELES, CALIFORNIA OCTOBER 2013 PREPARED FOR CITY OF LOS ANGELES, BUREAU OF ENGINEERING PREPARED BY DRAFT TRAFFIC STUDY FOR THE GAFFEY POOL PROJECT October
MEMORANDUM. Trip Generation Analysis
 MEMORANDUM To: RMC Architects From: Matthew Palmer, PE Subject: Trip Generation, Parking Analysis & Level of Service Project: Port of Everett, GTC #13-053 Date: August 25, 2014 The trip generation and
3.0 ANALYSIS OF FUTURE TRANSPORTATION NEEDS
 3.0 ANALYSIS OF FUTURE TRANSPORTATION NEEDS In order to better determine future roadway expansion and connectivity needs, future population growth and land development patterns were analyzed as part of
KAISER SOUTH NORTHERN VIRGINIA HUB TRAFFIC IMPACT STUDY PRINCE WILLIAM COUNTY, VIRGINIA TABLE OF CONTENTS. Section 2 BACKGROUND INFORMATION 12
 KAISER SOUTH NORTHERN VIRGINIA HUB TRAFFIC IMPACT STUDY PRINCE WILLIAM COUNTY, VIRGINIA TABLE OF CONTENTS Page EXECUTIVE SUMMARY 1 Purpose of Report and Study Objectives... 1 Site Location and Study Area...
TRAFFIC IMPACT STUDY
 TRAFFIC IMPACT STUDY TERRE HAUTE CONVENTION CENTER WABASH AVENUE & 9 TH STREET TERRE HAUTE, INDIANA PREPARED FOR 8365 Keystone Crossing, Suite 201 Indianapolis, IN 46240 Phone: (317) 202-0864 Fax: (317)
Focused Traffic Analysis for the One Lincoln Park Project
 September 15, 2015 Mr. Bill Johnson Coldwell Banker 511 Sir Francis Drake Boulevard Greenbrae, CA 94904 Focused Traffic Analysis for the One Lincoln Park Project Dear Mr. Johnson; As requested, W-Trans
MADISON, WI STONE HOUSE DEVELOPMENT 1000 E. WASHINGTON AVENUE REDEVELOPMENT TRANSPORTATION STUDY DECEMBER 14, 2015
 MADISON, WI STONE HOUSE DEVELOPMENT 1000 E. WASHINGTON AVENUE REDEVELOPMENT TRANSPORTATION STUDY DECEMBER 14, 2015 TABLE OF CONTENTS... 3 Proposed Development... 3 Methodology... 3 Phase 1 Development...
Expanding the GSATS Model Area into
 Appendix A Expanding the GSATS Model Area into North Carolina Jluy, 2011 Table of Contents LONG-RANGE TRANSPORTATION PLAN UPDATE 1. Introduction... 1 1.1 Background... 1 1.2 Existing Northern Extent of
The Highline Development Traffic Impact Study
 The Highline Development Traffic Impact Study Columbia Falls, Montana Prepared For: TD&H Engineering 450 Corporate Drive, Suite 101 Kalispell, MT 59901 June, 2018 130 South Howie Street Helena, Montana
PRADO BASIN SEDIMENT REMOVAL PROJECT FOCUSED TRAFFIC ANALYSIS. May 31, 2016
 PRADO BASIN SEDIMENT REMOVAL PROJECT FOCUSED TRAFFIC ANALYSIS May 31, 2016 Kunzman Associates, Inc. PRADO BASIN SEDIMENT REMOVAL PROJECT FOCUSED TRAFFIC ANALYSIS May 31, 2016 Prepared by: Perrie Ilercil,
APPENDIX I: Traffic Forecasting Model and Assumptions
 APPENDIX I: Traffic Forecasting Model and Assumptions Appendix I reports on the assumptions and traffic model specifications that were developed to support the Reaffirmation of the 2040 Long Range Plan.
TRANSPORTATION IMPACT STUDY WHEELER STREET CLOSURE
 TRANSPORTATION IMPACT STUDY WHEELER STREET CLOSURE Village of Greene, Chenango County, New York Prepared for: VILLAGE OF GREENE 49 Genesee Street Greene, NY 13778 Prepared by: LARSON DESIGN GROUP 1000
TRANSPORTATION AND TRAFFIC ANALYSIS REPORT
 Square One Drive Extension Municipal Class Environmental Assessment Environmental Study Report Appendix B Transportation and Traffic Analysis Report TRANSPORTATION AND TRAFFIC ANALYSIS REPORT FINAL DRAFT
Appendix C Final Methods and Assumptions for Forecasting Traffic Volumes
 Fairview Ave. and Main St. Improvements and Local Streets Plan Appendices Ada County Highway District Appendix C Final Methods and Assumptions for Forecasting Traffic Volumes January 3, 207 Appendices
Signalized Intersections
 Signalized Intersections Kelly Pitera October 23, 2009 Topics to be Covered Introduction/Definitions D/D/1 Queueing Phasing and Timing Plan Level of Service (LOS) Signal Optimization Conflicting Operational
COUNCIL POLICY MANUAL
 COUNCIL POLICY MANUAL SECTION: PUBLIC WORKS SUBJECT: SNOW & ICE CONTROL POLICY 2012/2013 GOAL: Pages: 1 of 10 Approval Date: Dec. 3, 2012 Res. # 1001/2012 To annually identify the winter maintenance costs
CHAPTER 3. CAPACITY OF SIGNALIZED INTERSECTIONS
 CHAPTER 3. CAPACITY OF SIGNALIZED INTERSECTIONS 1. Overview In this chapter we explore the models on which the HCM capacity analysis method for signalized intersections are based. While the method has
1.0 INTRODUCTION AND SUMMARY...
 TABLE OF CONTENTS 1.0 INTRODUCTION AND SUMMARY... 1 1.1 Purpose and Study Objective... 1 1.2 Executive Summary... 1 2.0 ROADWAY CONDITIONS... 5 2.1 Granville Parkway (South Intersection)... 8 2.2 Tuscany
Freeway Work Zone Lane Capacity
 Report Title Report Date: 2009 Freeway Work Zone Lane Capacity Principle Investigator Vendor Name and Address Name Drakopoulos, Alex «Vendor» Affiliation Marquette University Address 263 Haggerty Hall
Travel Demand Management Plan
 Travel Demand Management Plan Tryg s & Apartment Building 8 West Lake Street Minneapolis, MN AUTHORIZED PROPERTY REPRESENTATIVE: By Dated: Mr. Johnny Carlson Trammell Crow Chicago Development, Inc. 5 South
VHD Daily Totals. Population 14.5% change. VMT Daily Totals Suffolk 24-hour VMT. 49.3% change. 14.4% change VMT
 6.9 Suffolk 6-54 VMT Population and Travel Characteristics Population 14.5% change 2014 1,529,202 VHD Daily Totals 2014 251,060 49.3% change 2040 1,788,175 2040 374,850 VMT Daily Totals 2014 39,731,990
2129 NORTH MAIN STREET HOTE PROJECT ULI SHARED PARKING STUDY City of Santa Ana, California
 2129 NORTH MAIN STREET HOTE PROJECT ULI SHARED PARKING STUDY City of Santa Ana, California Prepared for: NET DEVELOPMENT COMPANY 3130 Airway Avenue Costa Mesa, CA 92626 Prepared by: RK ENGINEERING GROUP,
LIC SR INTERCHANGE OPERATIONS STUDY
 LIC SR 16 18.20 - INTERCHANGE OPERATIONS STUDY Project Summary Location SR 16 & W. Church St. Interchange Newark, Ohio Licking County PID 99478 Study Sponsor ODOT District 5 Proposed Work Add Left Turn
Freeway Work Zone Lane Capacity
 Freeway Work Zone Lane Capacity Thomas Notbohm, P.E. Wisconsin Department of Transportation Thomas.Notbohm@dot.state.wi.us Alex Drakopoulos Department of Civil & Environmental Engineering Marquette University,
Roundabout Level of Service
 Roundabout Level of Service Rahmi Akçelik Director Akcelik & Associates Pty Ltd email: rahmi.akcelik@sidrasolutions.com web: www.sidrasolutions.com 8 January 2009 Contents 1. Introduction... 1 2. Fundamental
S.170 th Street Micro-Simulation Seattle-Tacoma International Airport Port of Seattle/Aviation Planning
 Seattle-acoma International Airport Port of Seattle/Aviation Planning Port of Seattle PO OF SEAE Aviation Planning Airport Operations January 24, 2013 Summary he Port is planning to relocate the cell phone
MEMORANDUM (DRAFT) DRAFT
 DRAFT") 117 Commercial St. NE, Suite 310 Salem, OR 97301 503.391.8773 www.dksassociates.com MEMORANDUM (DRAFT) DATE: February 15, 2017 TO: FROM: SUBJECT: Alex Dupey, MIG Scott Mansur, PE, PTOE; Garth Appanaitis,
117 Commercial St. NE, Suite 310 Salem, OR 97301 503.391.8773 www.dksassociates.com MEMORANDUM (DRAFT) DATE: February 15, 2017 TO: FROM: SUBJECT: Alex Dupey, MIG Scott Mansur, PE, PTOE; Garth Appanaitis,
APPENDIX IV MODELLING
 APPENDIX IV MODELLING Kingston Transportation Master Plan Final Report, July 2004 Appendix IV: Modelling i TABLE OF CONTENTS Page 1.0 INTRODUCTION... 1 2.0 OBJECTIVE... 1 3.0 URBAN TRANSPORTATION MODELLING
StanCOG Transportation Model Program. General Summary
 StanCOG Transportation Model Program Adopted By the StanCOG Policy Board March 17, 2010 What are Transportation Models? General Summary Transportation Models are technical planning and decision support
FY 2010 Continuing i Planning Program Product Report. Local Transportation and Traffic Data. Wood-Washington-Wirt Interstate Planning Commission
 FY 2010 Continuing i Planning Program Product Report Local Transportation and Traffic Data Travel Time and Delay Data for Belpre and Marietta, Ohio Wood-Washington-Wirt Interstate Planning Commission CONTINUING
Parking Regulations Dundas Street West, from Bathurst Street to Dovercourt Road
 STAFF REPORT ACTION REQUIRED Parking Regulations Dundas Street West, from Bathurst Street to Dovercourt Road Date: October 28, 2008 To: From: Toronto and East York Community Council Director, Transportation
FREEWAY WEAVING. Highway Capacity Manual 2000 CHAPTER 24 CONTENTS EXHIBITS
 CHAPTER 24 FREEWAY WEAVING CONTENTS I. INTRODUCTION... 24-1 Scope of the Methodology...24-1 Limitations of the Methodology...24-1 II. METHODOLOGY...24-1 LOS...24-2 Weaing Segment Parameters...24-3 Determining
PROPOSED PROJECT. Section PROJECT DESCRIPTION
 1 2 3 4 5 6 7 8 9 10 11 12 13 14 15 16 17 18 19 20 21 22 23 24 25 26 27 28 29 30 31 32 33 34 35 36 37 38 39 40 41 42 43 1.1 PROJECT DESCRIPTION This Environmental Assessment describes the proposed improvements
Approved Corrections and Changes for the Highway Capacity Manual 2000
 Approved Corrections and Changes for the Highway Capacity Manual 2000 Updated 7/8/2005 Previous update 2/27/2004 TRB Committee AHB40, Highway Capacity and Quality of Service Unless stated otherwise, corrections
Palmerston North Area Traffic Model
 Palmerston North Area Traffic Model Presentation to IPWEA 7 November 2014 PNATM Presentation Overview Model Scope and type Data collected The model Forecasting inputs Applications PNCC Aims and Objectives
North Carolina s First Quadrant Left: History and Lessons Learned
 North Carolina s First Quadrant Left: History and Lessons Learned Michael P. Reese, P.E. (Corresponding Author) Congestion Management Section Project Engineer North Carolina Department of Transportation
January 12, Mr. Ryan Granger TMGB Wilson, LLC 2221 Health Drive SW, Suite 2200 Wyoming, Michigan 49519
 January 12, 2018 Mr. Ryan Granger TMGB Wilson, LLC 2221 Health Drive SW, Suite 2200 Wyoming, Michigan 49519 Re: Proposed Reserve at Rivertown Mixed-Use Development Updated Trip Generation and Site Driveway
Cipra D. Revised Submittal 1
 Cipra D. Revised Submittal 1 Enhancing MPO Travel Models with Statewide Model Inputs: An Application from Wisconsin David Cipra, PhD * Wisconsin Department of Transportation PO Box 7913 Madison, Wisconsin
City of Saginaw Right of Way Division Snow and Ice Removal Policy January 18, 2016
 Snow and Ice Removal Policy January 18, 2016 It is the policy of the to provide snowplowing and ice removal services in order to: Provide safe traveling conditions for motorists and pedestrians Assist
North Carolina s First Quadrant Left: History and Lessons Learned
 0 0 0 North Carolina s First Quadrant Left: History and Lessons Learned Michael P. Reese, P.E. (Corresponding Author) Congestion Management Section Project Engineer North Carolina Department of Transportation
WOODRUFF ROAD CORRIDOR ORIGIN-DESTINATION ANALYSIS
 2018 WOODRUFF ROAD CORRIDOR ORIGIN-DESTINATION ANALYSIS Introduction Woodruff Road is the main road to and through the commercial area in Greenville, South Carolina. Businesses along the corridor have
CONTINUING PLANNING PROGRAM LOCAL TRANSPORTATION AND TRAFFIC DATA PRODUCT REPORT [OH Corridors]
![CONTINUING PLANNING PROGRAM LOCAL TRANSPORTATION AND TRAFFIC DATA PRODUCT REPORT [OH Corridors]](/thumbs/94/120123757.jpg "CONTINUING PLANNING PROGRAM LOCAL TRANSPORTATION AND TRAFFIC DATA PRODUCT REPORT [OH Corridors]") CONTINUING PLANNING PROGRAM LOCAL TRANSPORTATION AND TRAFFIC DATA PRODUCT REPORT [OH Corridors] Travel Time and Delay Analysis for Belpre (OH) and Marietta (OH) Fiscal Year 2009 Report WOOD WASHINGTON
CONTINUING PLANNING PROGRAM LOCAL TRANSPORTATION AND TRAFFIC DATA PRODUCT REPORT [OH Corridors] Travel Time and Delay Analysis for Belpre (OH) and Marietta (OH) Fiscal Year 2009 Report WOOD WASHINGTON
Project Level Traffic Forecast Report Business 40 Reconstruction Study Forsyth County
 Project Level Traffic Forecast Report Business 40 Reconstruction Study Forsyth County TIP No. U-2827 B WBS # 34872.1.1 June 2013 Prepared for North Carolina Department of Transportation Prepared by Project
CHAPTER 5 DELAY ESTIMATION FOR OVERSATURATED SIGNALIZED APPROACHES
 CHAPTER 5 DELAY ESTIMATION FOR OVERSATURATED SIGNALIZED APPROACHES Delay is an important measure of effectiveness in traffic studies, as it presents the direct cost of fuel consumption and indirect cost
6 th Line Municipal Class Environmental Assessment
 6 th Line Municipal Class Environmental Assessment County Road 27 to St John s Road Town of Innisfil, ON September 6, 2016 APPENDIX L: TRAVEL DEMAND FORECASTING MEMORANDUM Accessible formats are available
CE351 Transportation Systems: Planning and Design
 CE351 Transportation Systems: Planning and Design TOPIC: Level of Service (LOS) at Traffic Signals 1 Course Outline Introduction to Transportation Highway Users and their Performance Geometric Design Pavement
Appendix B. Land Use and Traffic Modeling Documentation
 Appendix B Land Use and Traffic Modeling Documentation Technical Memorandum Planning Level Traffic for Northridge Sub-Area Study Office of Statewide Planning and Research Modeling & Forecasting Section
FDOT Level 2 Roundabout b/c Evaluation
 FDOT Level 2 Roundabout b/c Evaluation This spreadsheet tool compares the cost of a roundabout to the cost of a traditional intersection, as specified by the user. A traditional intersection is defined
Brandywine Road Speed Study FINAL REPORT
 Brandywine Road Speed Study FINAL REPORT City of Albuquerque Brandywine Road Speed Study Final Report Albuquerque, New Mexico City of Albuquerque May, 2016 Brandywine Road Speed Study Final Report City
570 Hazeldean Road, Ottawa, ON Transportation Brief Mattamy Homes. Prepared By: Stantec Consulting Ltd. Project Number:
 570 Hazeldean Road, Ottawa, ON Transportation Brief Mattamy Homes Prepared By: Stantec Consulting Ltd. Project Number: 163600871 March 2013 570 HAZELDEAN ROAD, OTTAWA, ON TRANSPORTATION BRIEF MARCH 2013
PRELIMINARY WORKING DRAFT Work in Progress
 IV. ENVIRONMENTAL IMPACT ANALYSIS H. MINERAL RESOURCES 1.0 INTRODUCTION This section addresses the potential impacts of the Proposed Project on mineral resources (i.e., sand, gravel and petroleum). The
Bruce Freeman Rail Trail
 Functional Design Report Bruce Freeman Rail Trail Station Road to Concord Town Line Sudbury, Massachusetts PREPARED FOR Town of Sudbury Planning and Community Development 287 Old Sudbury Road Sudbury,
I-95/I-85 INTERCHANGE ROADWAY SAFETY ASSESSMENT
 FINAL REPORT I-95/I-85 INTERCHANGE ROADWAY SAFETY ASSESSMENT Prepared for: Prepared by: 117306012.B MARCH 2013 Final Report March 2013 I-95/I-85 Interchange ROADWAY SAFETY ASSESSMENT Prepared for: Prepared
Prepared for. 3D/International, Inc West Loop South, Suite 400 Houston, Texas November 2006
 DRAFT TRAFFIC IMPACT STUDY FOR PHASED DEVELOPMENT OF TAMU CC Prepared for 3D/International, Inc. 1900 West Loop South, Suite 400 Houston, Texas 77027 November 2006 Interim Review Only Document Incomplete:
TRAFFIC IMPACT STUDY FOR SOUTH BAY SALT POND RESTORATION PROJECT PHASE 2
 APPENDIX G TRAFFIC IMPACT STUDY FOR SOUTH BAY SALT POND RESTORATION PROJECT PHASE 2 South Bay Salt Pond Restoration Project Phase II May 2015 Draft Environmental Impact Statement/Report Traffic Impact
PW 001 SNOW REMOVAL AND SANDING FOR ROADWAYS AND SIDEWALKS October 6, 2014 (#223-14) Original October 19, 2015; October 15, 2018 Public Works
 Original October 19, 2015; October 15, 2018 Public Works") Policy Statement: The Village of Kitscoty will provide snow and ice control on municipal streets and sidewalks according to determined priorities. Purpose: To provide direction and information to employees
Policy Statement: The Village of Kitscoty will provide snow and ice control on municipal streets and sidewalks according to determined priorities. Purpose: To provide direction and information to employees
Tier 2 Final Environmental Assessment I-66 Transportation Technical Report. Appendix E. Travel Demand Forecasting Model Validation Memorandum
 Tier 2 Final Environmental Assessment I-66 Transportation Technical Report Appendix E Travel Demand Forecasting Model Validation Memorandum FINAL AUGUST 216 MEMORANDUM To: Robert Josef, VDOT Northern Virginia
HALFF 16196? TRAFFIC MANAGEMENT PLAN. Richardson ISD Aikin Elementary School Dallas, Texas North Bowser Road Richardson, Texas 75081
 30280 16196? TRAFFIC MANAGEMENT PLAN Exhibit 572B Aikin Elementary School Planned Development District No. 572 Approved City Plan Commission October20, 2016 July 12, 2016 Prepared for HALFF AVO 31586 PHO1
Technical Memorandum #2 Future Conditions
 Technical Memorandum #2 Future Conditions To: Dan Farnsworth Transportation Planner Fargo-Moorhead Metro Council of Governments From: Rick Gunderson, PE Josh Hinds PE, PTOE Houston Engineering, Inc. Subject:
Engineer's Report. Main Street Business Area. Festoon Lighting and Sidewalk Cleaning Assessment District (Fiscal Year )
") Engineer's Report for the Main Street Business Area Festoon Lighting and Sidewalk Cleaning Assessment District (Fiscal Year 2008-09) Prepared under the provisions of the Benefit Assessment Act of 1982
Engineer's Report for the Main Street Business Area Festoon Lighting and Sidewalk Cleaning Assessment District (Fiscal Year 2008-09) Prepared under the provisions of the Benefit Assessment Act of 1982
FARM 1065 PORTION 1, ATLANTIS TRAFFIC IMPACT ASSESSMENT
 FARM 1065 PORTION 1, ATLANTIS TRAFFIC IMPACT ASSESSMENT February 2018 FIRST ISSUE Prepared by: JG AFRIKA (PTY) LTD Branch: Cape Town PO Box 38561 Postal code: 7430 Telephone: 021 530 1800 Email: wink@
Guidelines on Using California Land Use/Transportation Planning Tools
 Guidelines on Using California Land Use/Transportation Planning Tools 1. Selecting Ds Analysis Modules Appropriate to a Region In almost all cases, the appropriate Ds Analysis Module to use for analysis
Changes in the Spatial Distribution of Mobile Source Emissions due to the Interactions between Land-use and Regional Transportation Systems
 Changes in the Spatial Distribution of Mobile Source Emissions due to the Interactions between Land-use and Regional Transportation Systems A Framework for Analysis Urban Transportation Center University
STAFF REPORT. MEETING DATE: July 3, 2008 AGENDA ITEM: 7
 STAFF REPORT SUBJECT: Travel Models MEETING DATE: July 3, 2008 AGENDA ITEM: 7 RECOMMENDATION: Receive information on status of travel model development in Santa Barbara County and review factors to achieve
Design Priciples of Traffic Signal
 Design Priciples of Traffic Signal Lecture Notes in Transportation Systems Engineering Prof. Tom V. Mathew Contents 1 Overview 1 2 Definitions and notations 2 3 Phase design 3 3.1 Two phase signals.................................
Jordan Harrison, Planner III, San Francisco Recreation and Park Department
 Date November 18, 2015 To: Through: From: Subject: Recreation and Park Commission Philip A. Ginsburg, General Manager Dawn Kamalanathan, Director, Capital & Planning Division Jordan Harrison, Planner III,
2015 Grand Forks East Grand Forks TDM
 GRAND FORKS EAST GRAND FORKS 2015 TRAVEL DEMAND MODEL UPDATE DRAFT REPORT To the Grand Forks East Grand Forks MPO October 2017 Diomo Motuba, PhD & Muhammad Asif Khan (PhD Candidate) Advanced Traffic Analysis
Prepared for: San Diego Association Of Governments 401 B Street, Suite 800 San Diego, California 92101
 Activity-Based Travel Model Validation for 2012 Using Series 13 Data: Coordinated Travel Regional Activity Based Modeling Platform (CT-RAMP) for San Diego County Prepared for: San Diego Association Of
CHAPTER 2. CAPACITY OF TWO-WAY STOP-CONTROLLED INTERSECTIONS
 CHAPTER 2. CAPACITY OF TWO-WAY STOP-CONTROLLED INTERSECTIONS 1. Overview In this chapter we will explore the models on which the HCM capacity analysis method for two-way stop-controlled (TWSC) intersections
1 Summary Monetary Component Public Purpose Land Provision Introduction Document Structure...
 1 Summary... 1 1.1 Monetary Component... 1 1.2 Public Purpose Land Provision... 1 2 Introduction... 5 2.1 Document Structure... 5 2.2 Planning & Environment Act 1987... 5 2.3 Strategic Planning & Justification...
Appendix B.1 EMME Model Calibration Memo
 Appendix B.1 EMME Model Calibration Memo itrans 144 Front Street West, Suite 655 Toronto, ON M5J 2L7 Tel: (416) 847-0005 Fax: (905) 882-1557 www.hdrinc.com www.itransconsulting.com File: 2.0 Memorandum
Speed Limit Review. Montague Road, West End. Prepared for Brisbane City Council CEB06842 CEB06842
 Speed Limit Review Montague Road, West End CEB06842 CEB06842 Prepared for Brisbane City Council 2 November 2016 Speed Limit Review Montague Road, West End Document Information Prepared for Brisbane City
City of Camrose Winter Road Maintenance Policy
 City of Camrose Winter Road Maintenance Policy The purpose of this policy is to outline the level of service that the City of Camrose delivers regarding the maintenance of roads in winter conditions. 1.
Per your request and authorization, we have prepared this traffic evaluation for the above referenced project.
 Memorandum To: From: Re: Marc Stout, P.E. City Engineer, City of Roseville Chris Gregerson, P.E., T.E. Matt Weir, P.E., T.E., PTOE Douglas Boulevard Coffee Kiosk Traffic Evaluation Roseville, California