DOLLAR GENERAL PROJECT FOCUSED TRAFFIC ANALYSIS (REVISED) May 20, 2015
|
|
|
- Claude Wilson
- 5 years ago
- Views:
Transcription
1 DOLLAR GENERAL PROJECT FOCUSED TRAFFIC ANALYSIS (REVISED) May 20, 2015
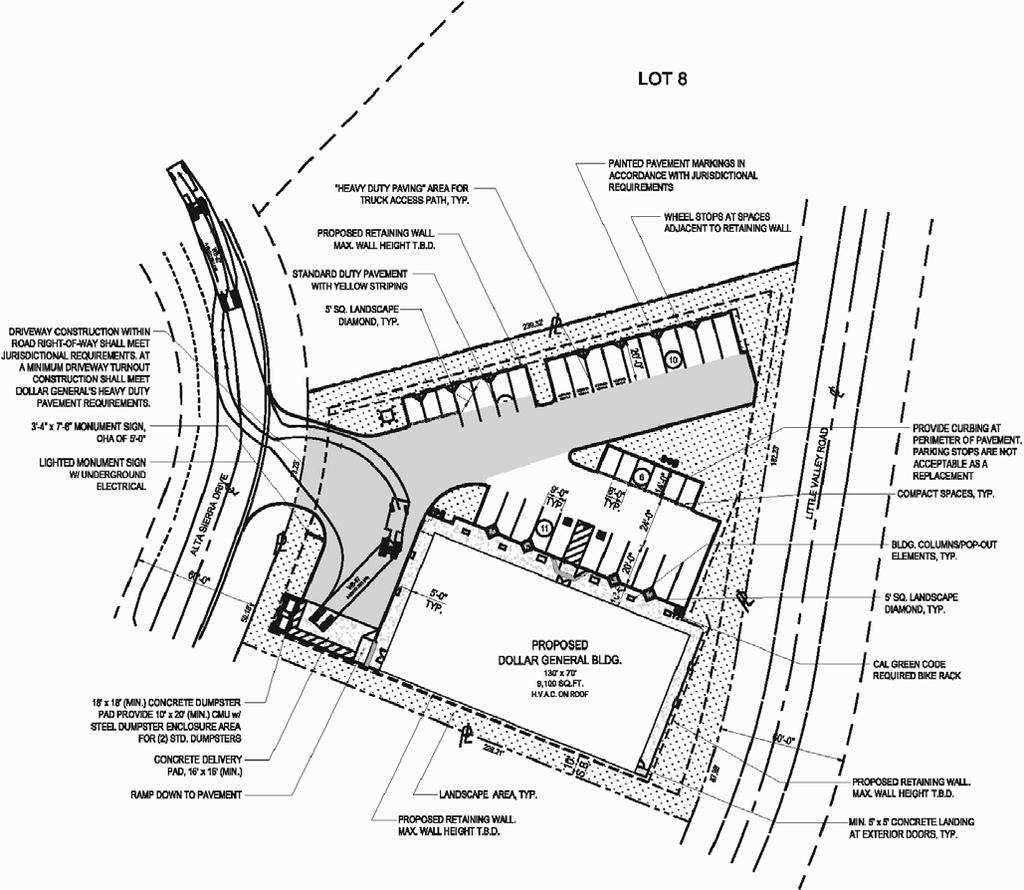
2 May 20, 2015 Mr. Dan Biswas, VP of Development CJS DEVELOPMENT II, LLC 5111 North Scottsdale Road, Suite 200 Scottsdale, CA Dear Mr. Biswas: INTRODUCTION The firm of Kunzman Associates, Inc. is pleased to provide this revised focused traffic analysis for the Dollar General project located at Alta Sierra Drive in the County of Nevada. The Dollar General project consists of a 9,100 square foot variety store and is located between Alta Sierra Drive and Little Valley Road, north of the intersection of Little Valley Road and Alta Sierra Drive (see Figure 1). Figure 2 illustrates the project site plan. Although this is a technical report, every effort has been made to write the report clearly and concisely. To assist the reader with those terms unique to transportation engineering, a glossary of terms is provided within Appendix A. TRAFFIC IMPACT ANALYSIS CRITERIA As stated in the Traffic Impact Analysis Guidelines, County of Nevada (November 2013), a traffic impact study may be required when a project meets at least one of the following criteria: 1. Project will substantially change the off-site transportation system or connections to it or may create or exacerbate a hazard to public safety. 2. Project is inconsistent with the current General Plan land use or current Nevada County Transportation Commission Traffic Model AND generates more traffic than the current General Plan or Traffic Model. 3. Project generates 100 or more new peak hour vehicle trips, or 4. Project generates 40 or more vehicle trips through an existing Level of Service C intersection in rural regions or Level of Service D in community regions during the AM or PM peak hour, or 5. Project generates 10 or more vehicle trips through an existing Level of Service D, E, or F intersection in rural regions or Level of Service E or F in community regions Town & Country Road, Suite 34 Orange, California (714)
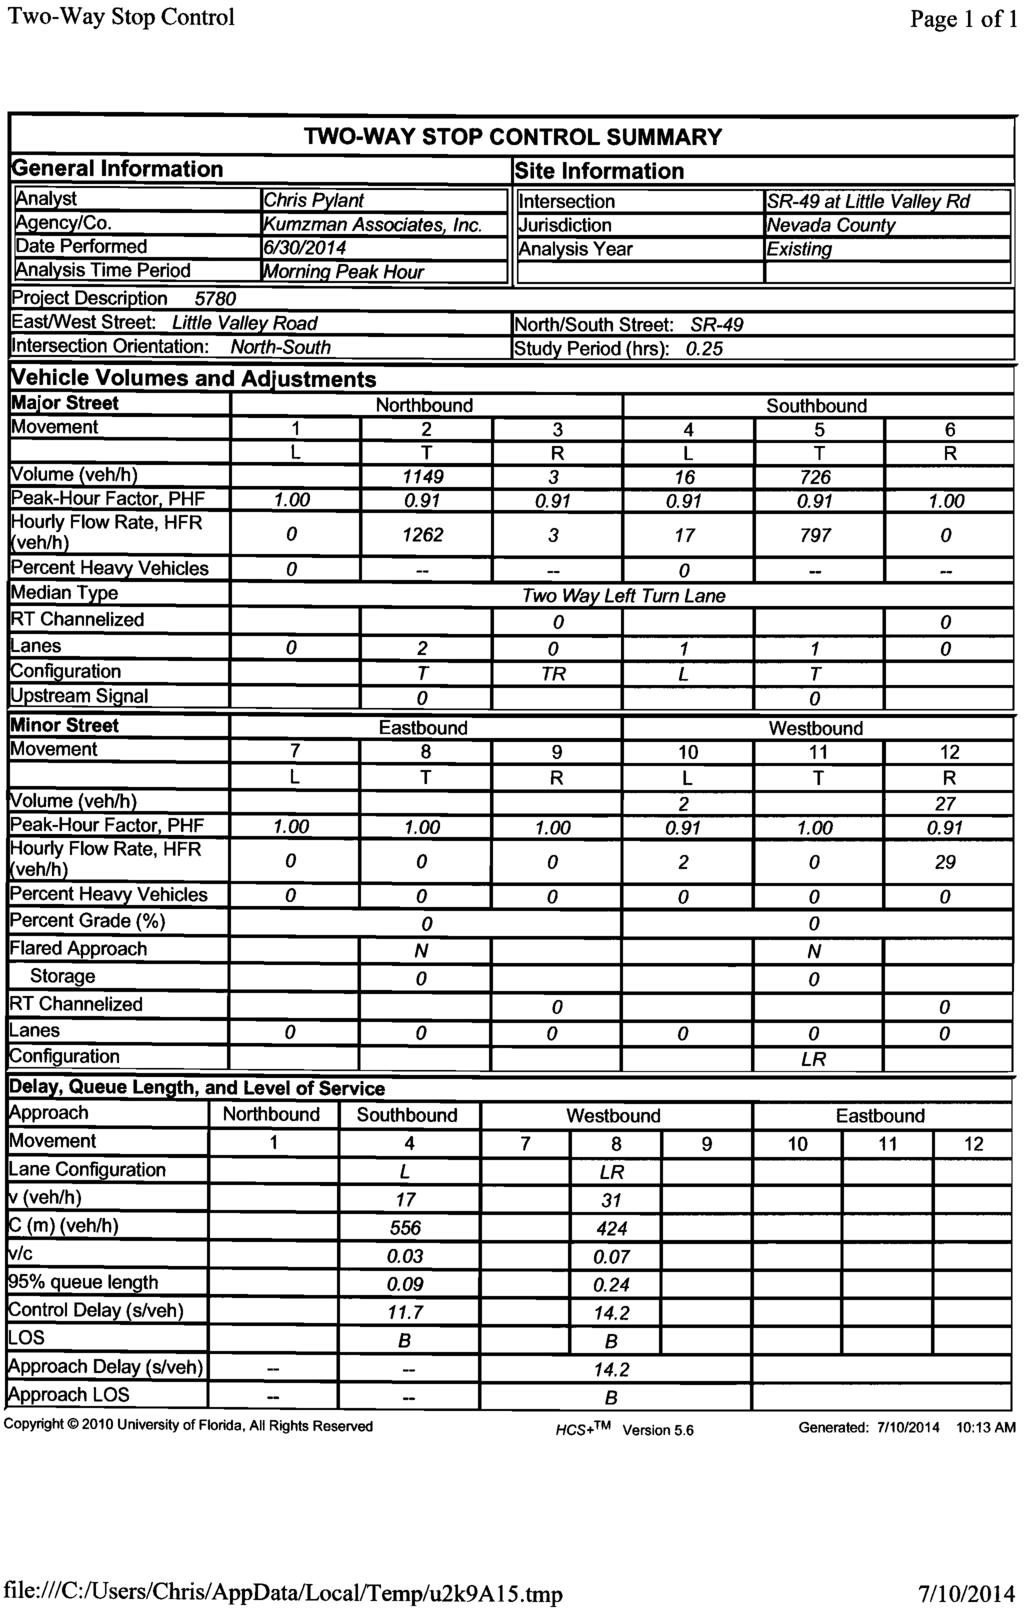
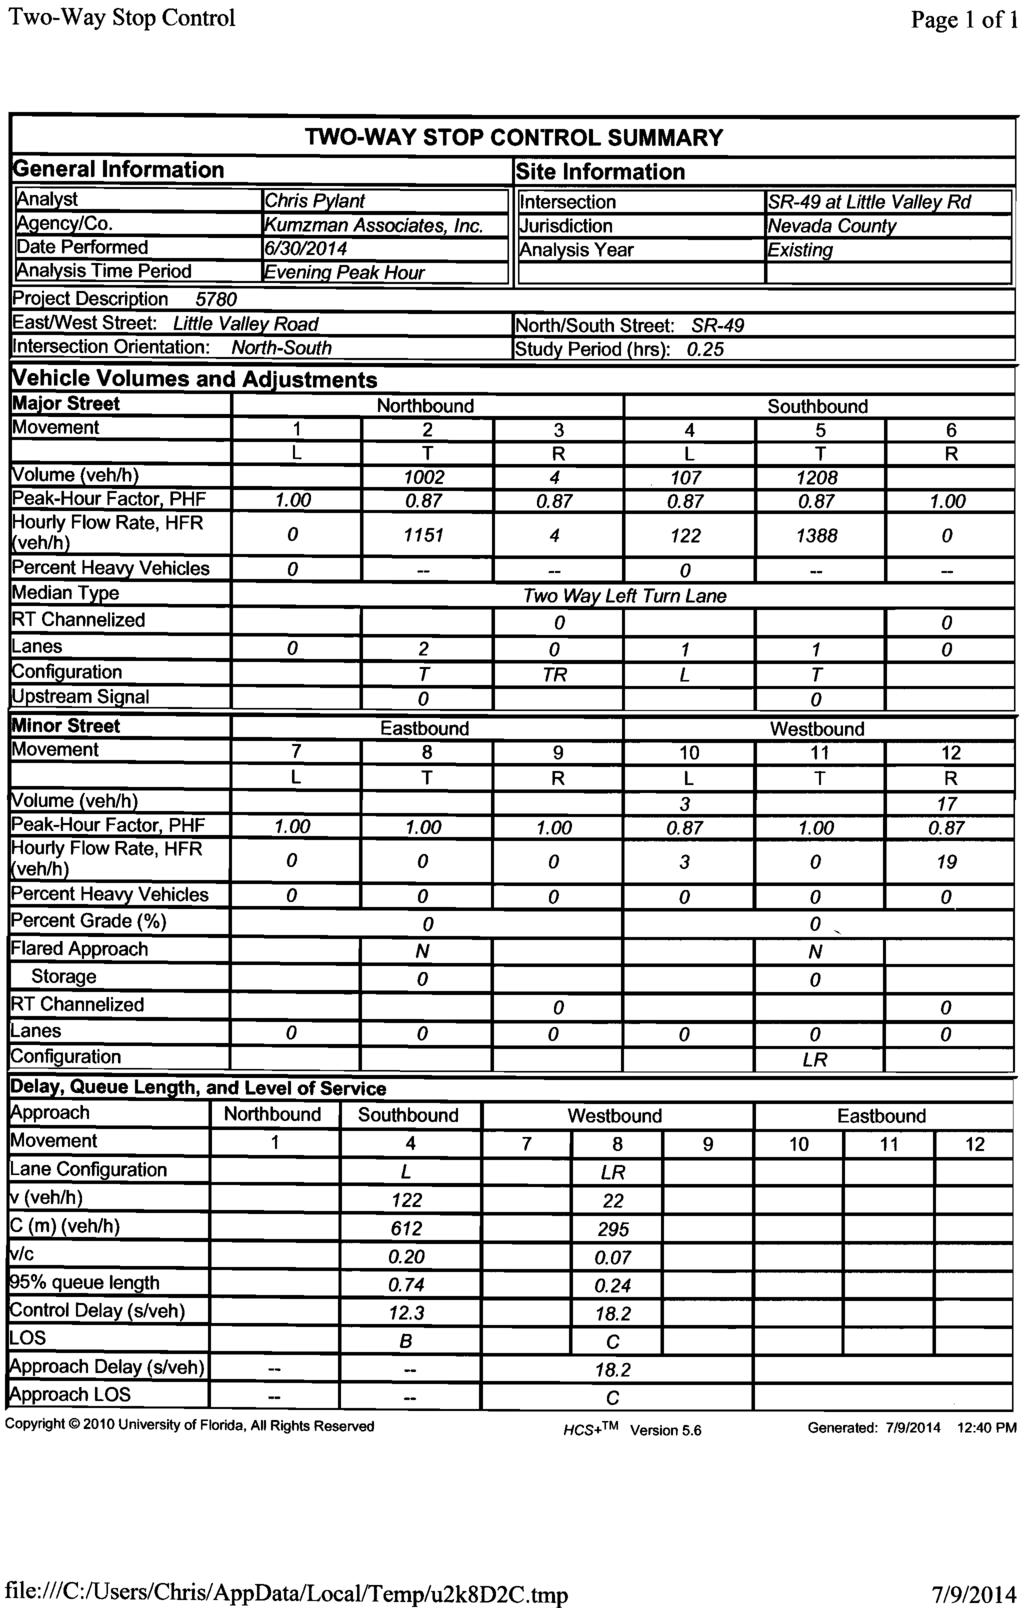
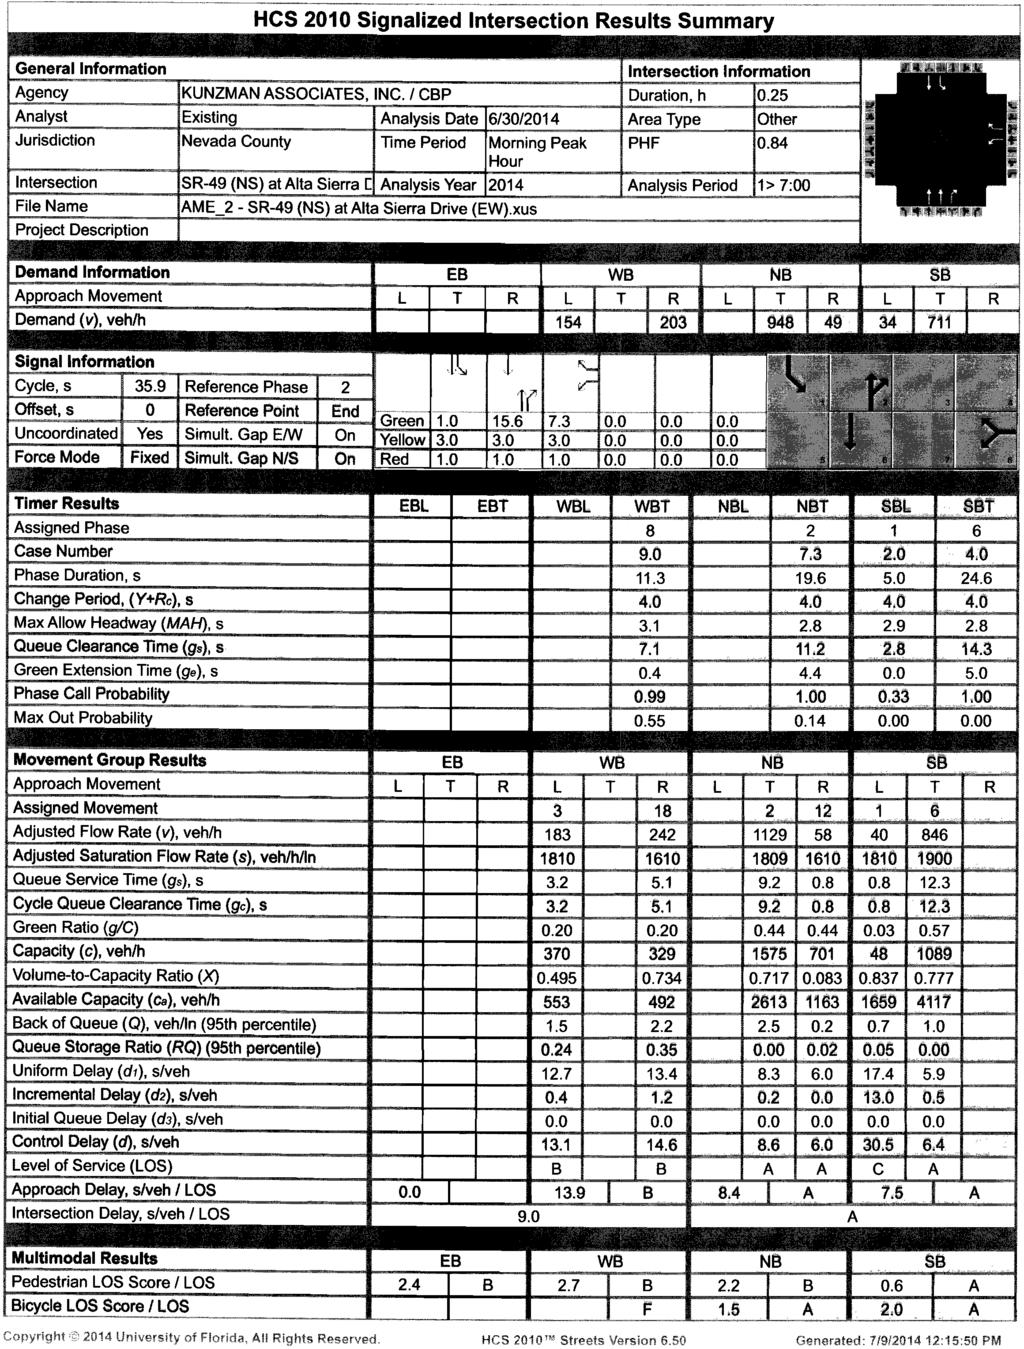
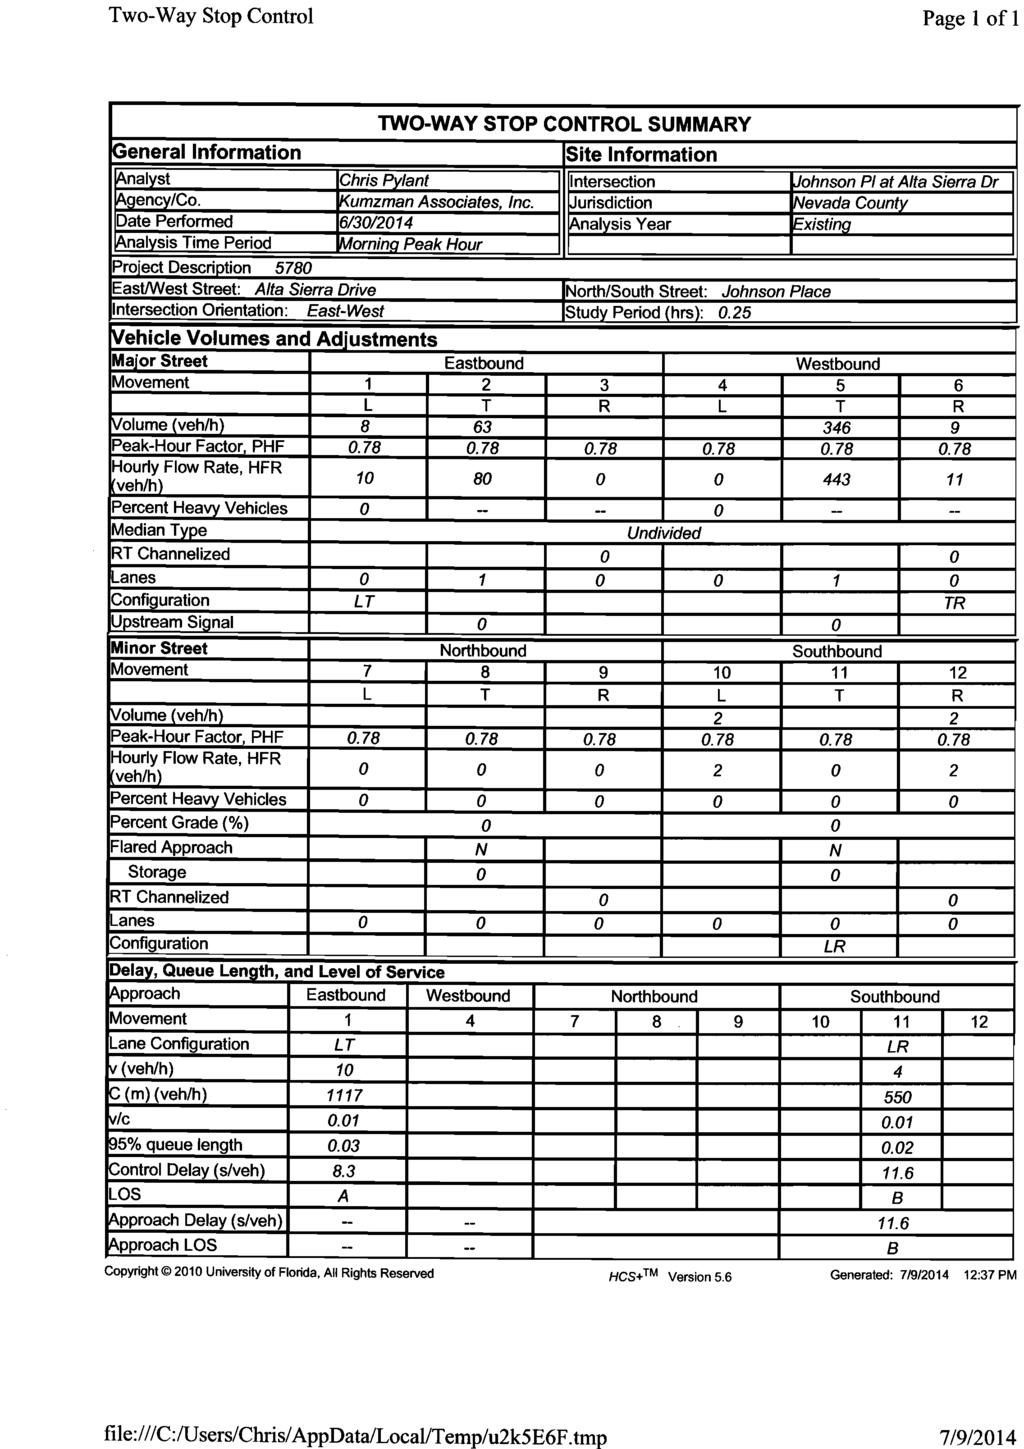
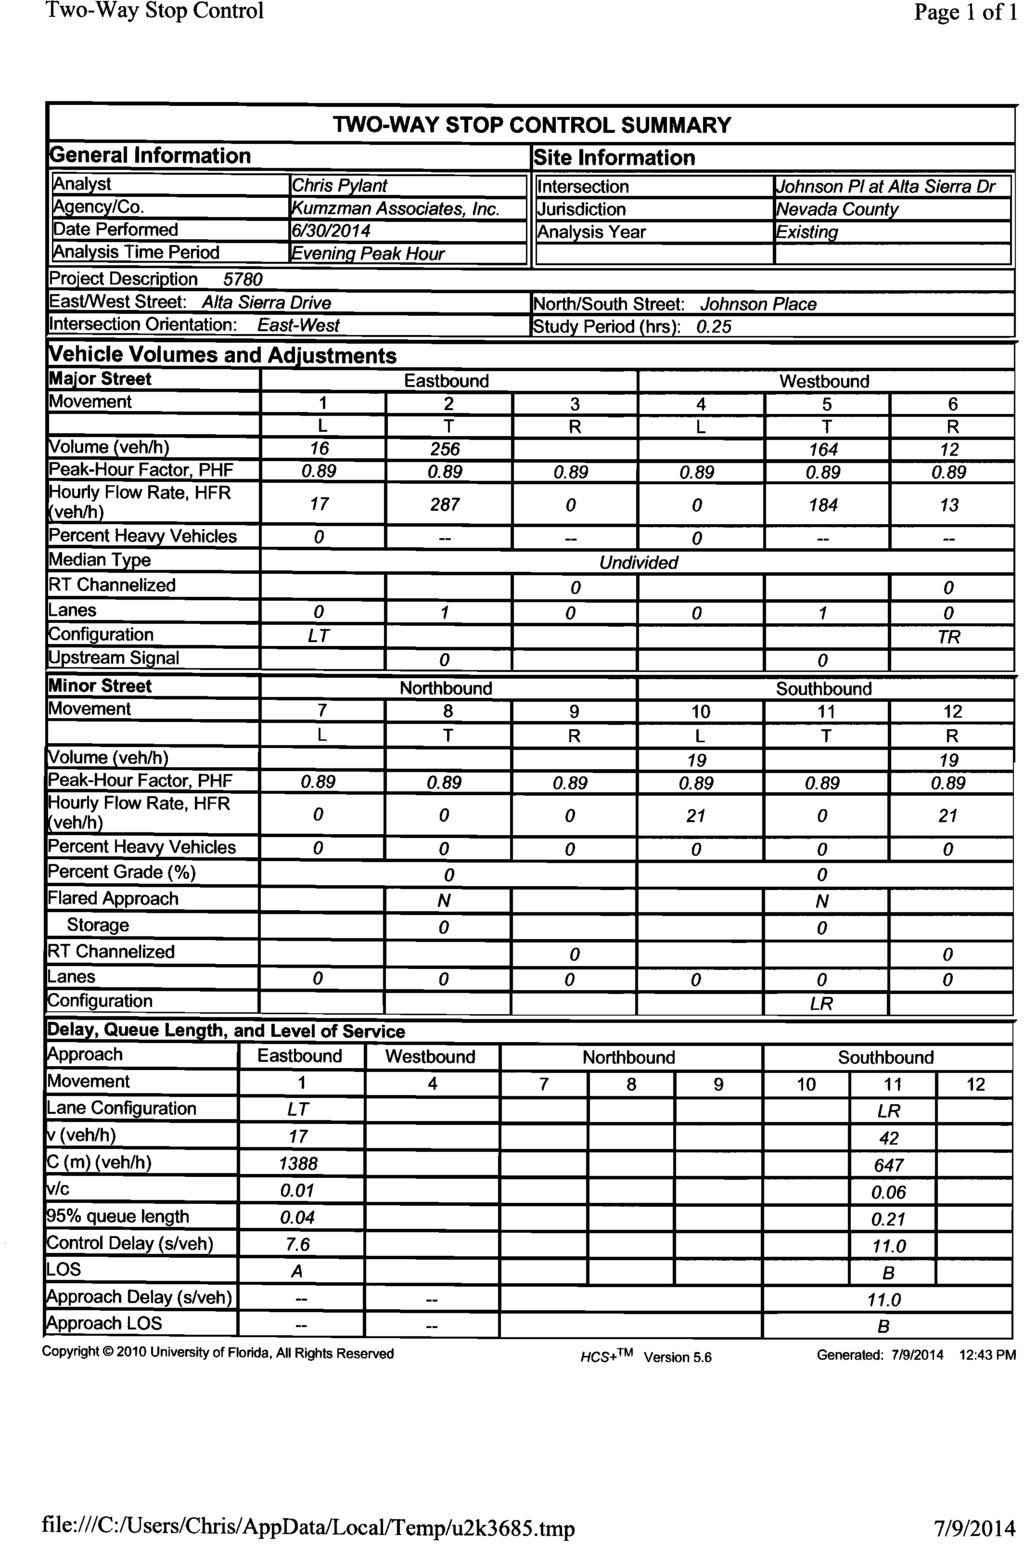
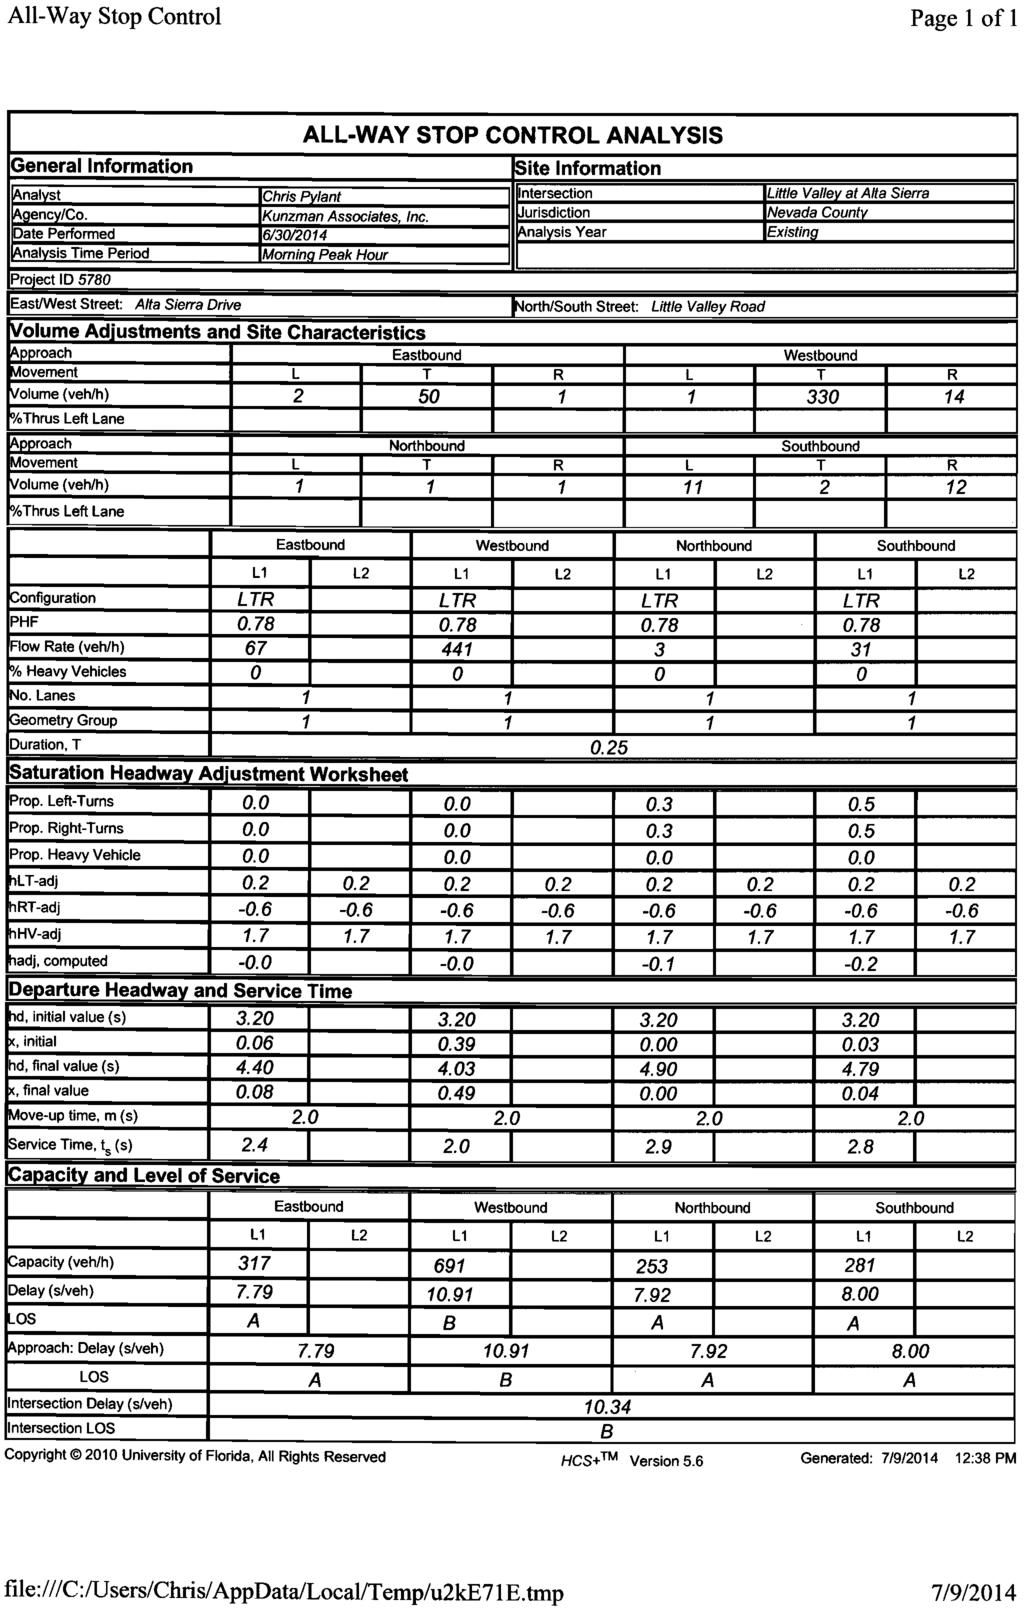
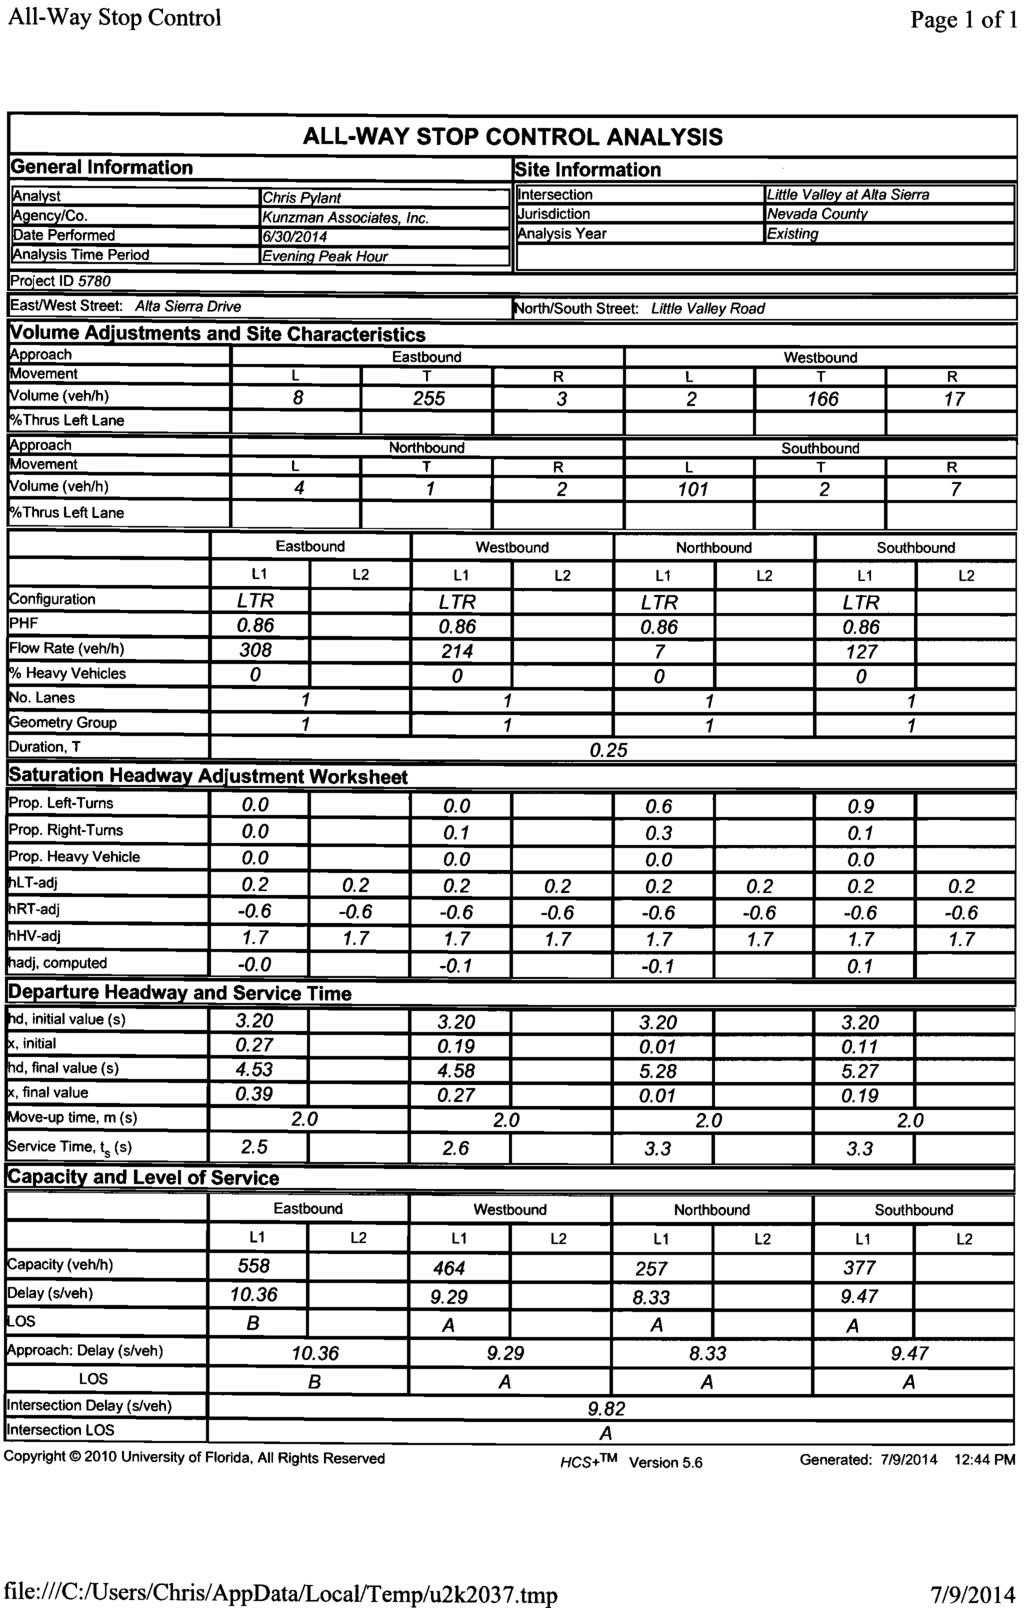
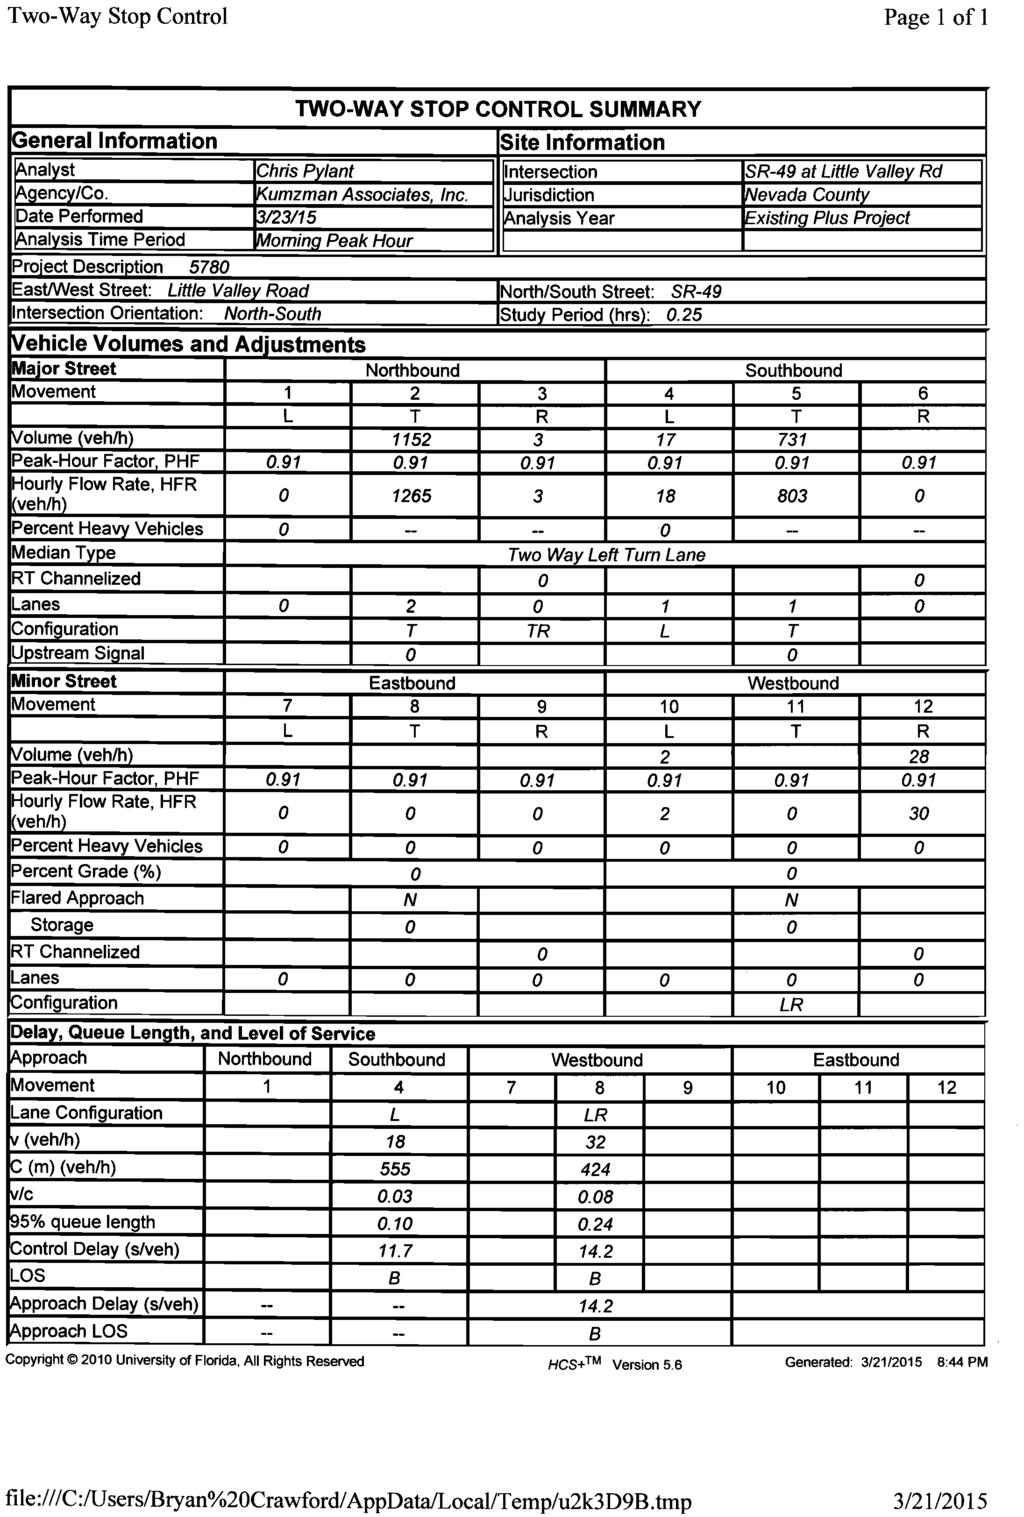
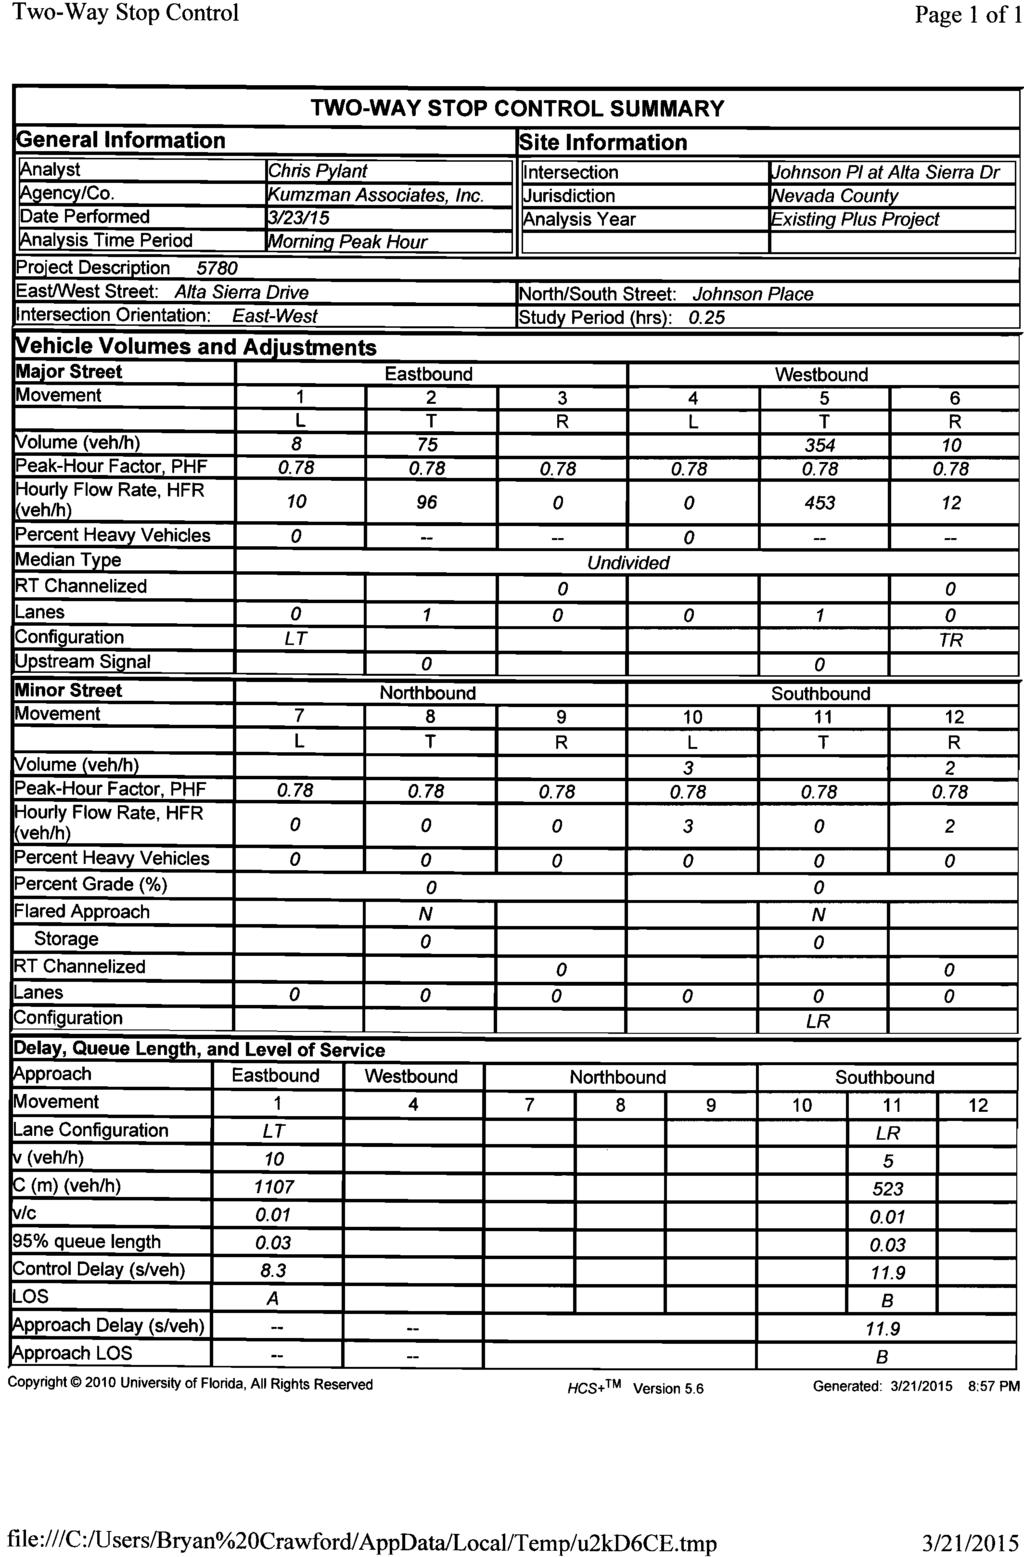
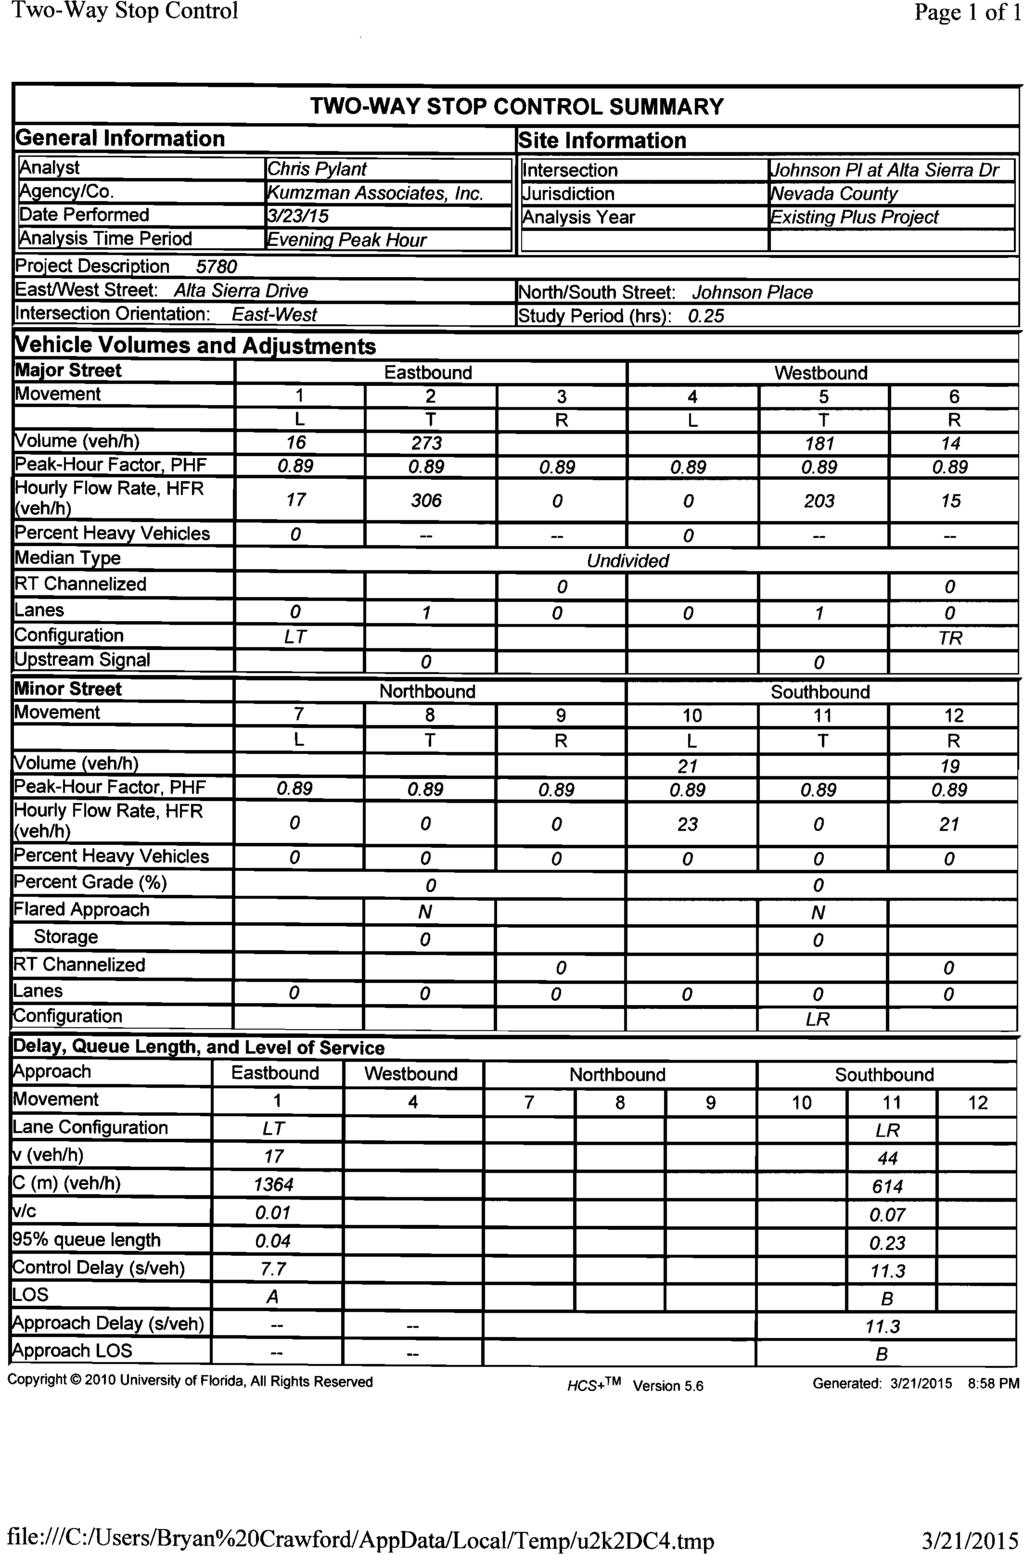
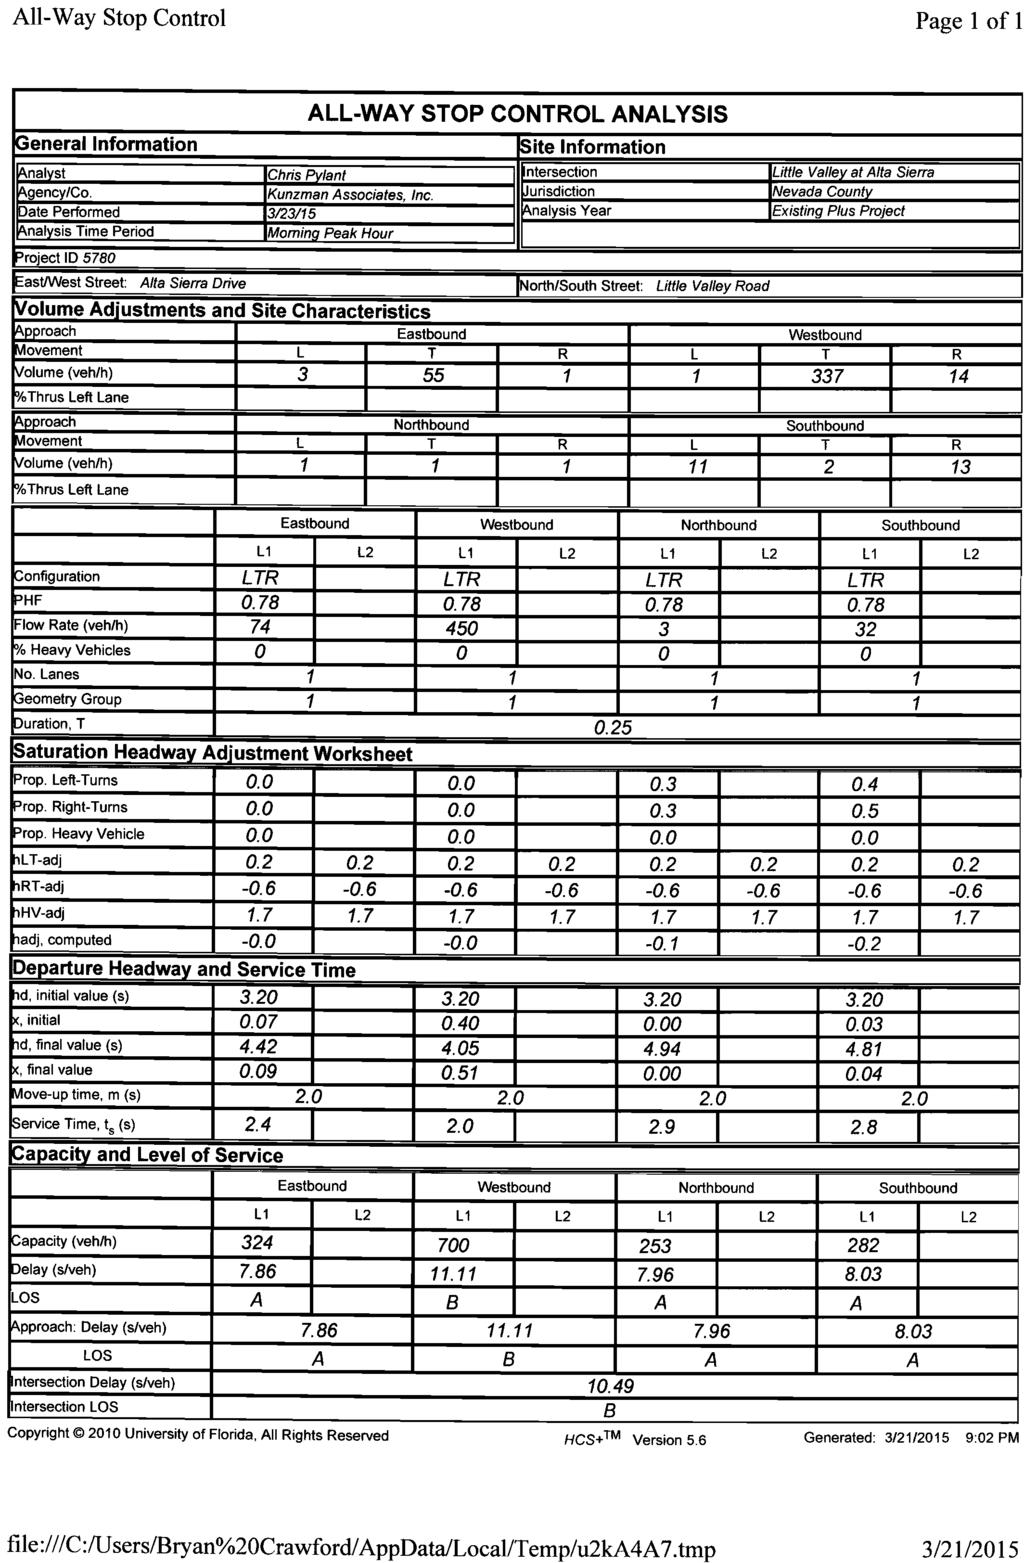
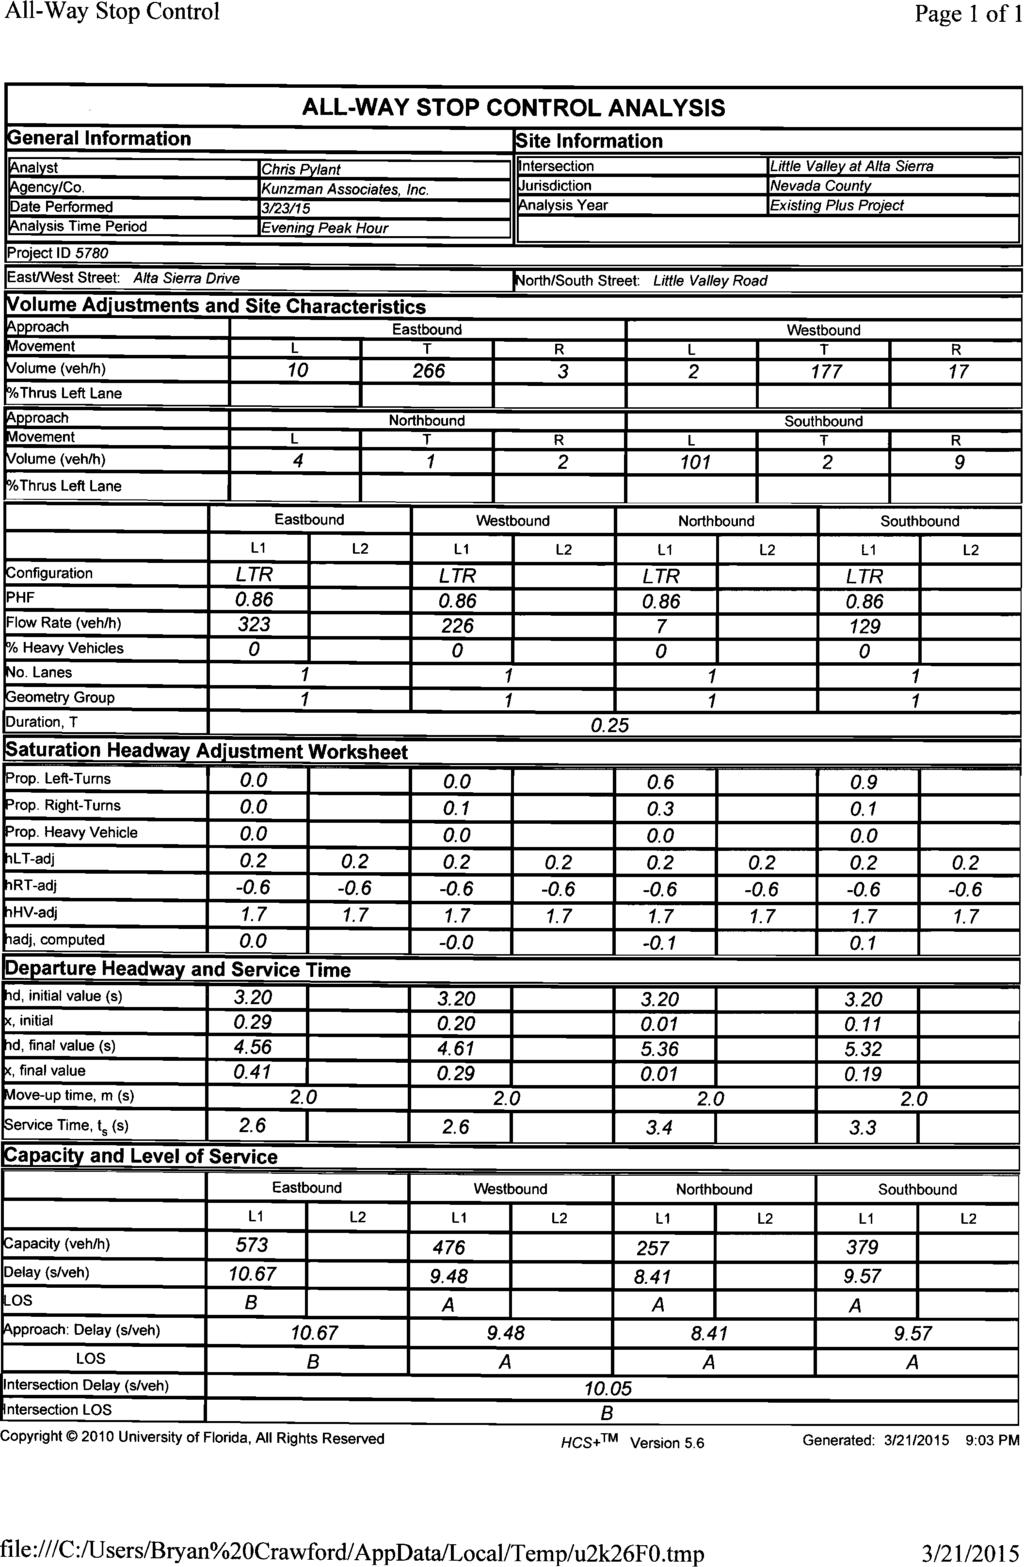
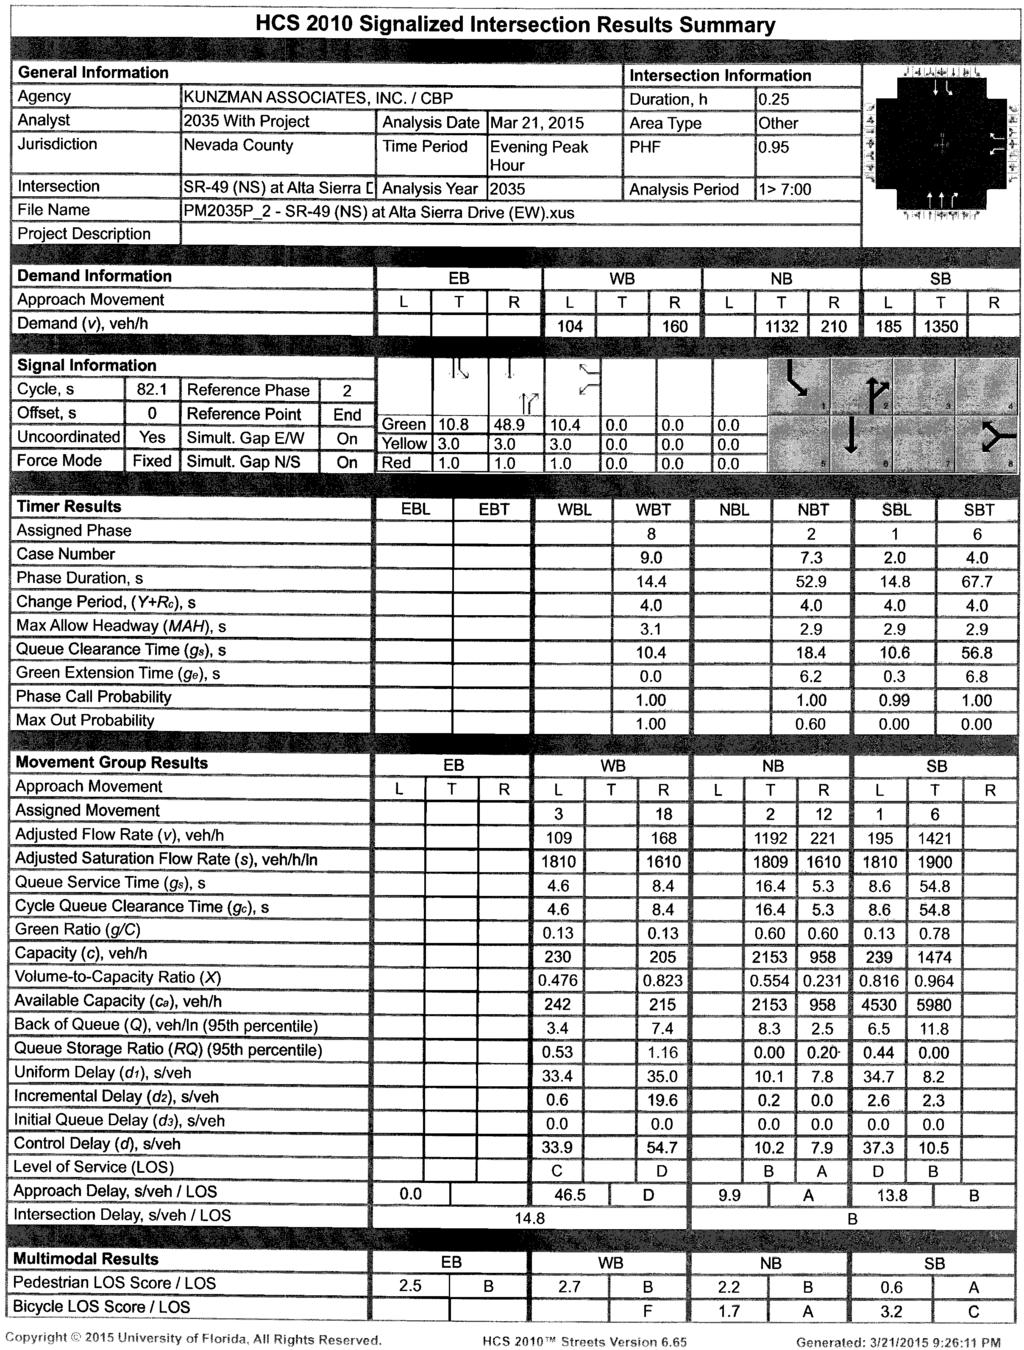
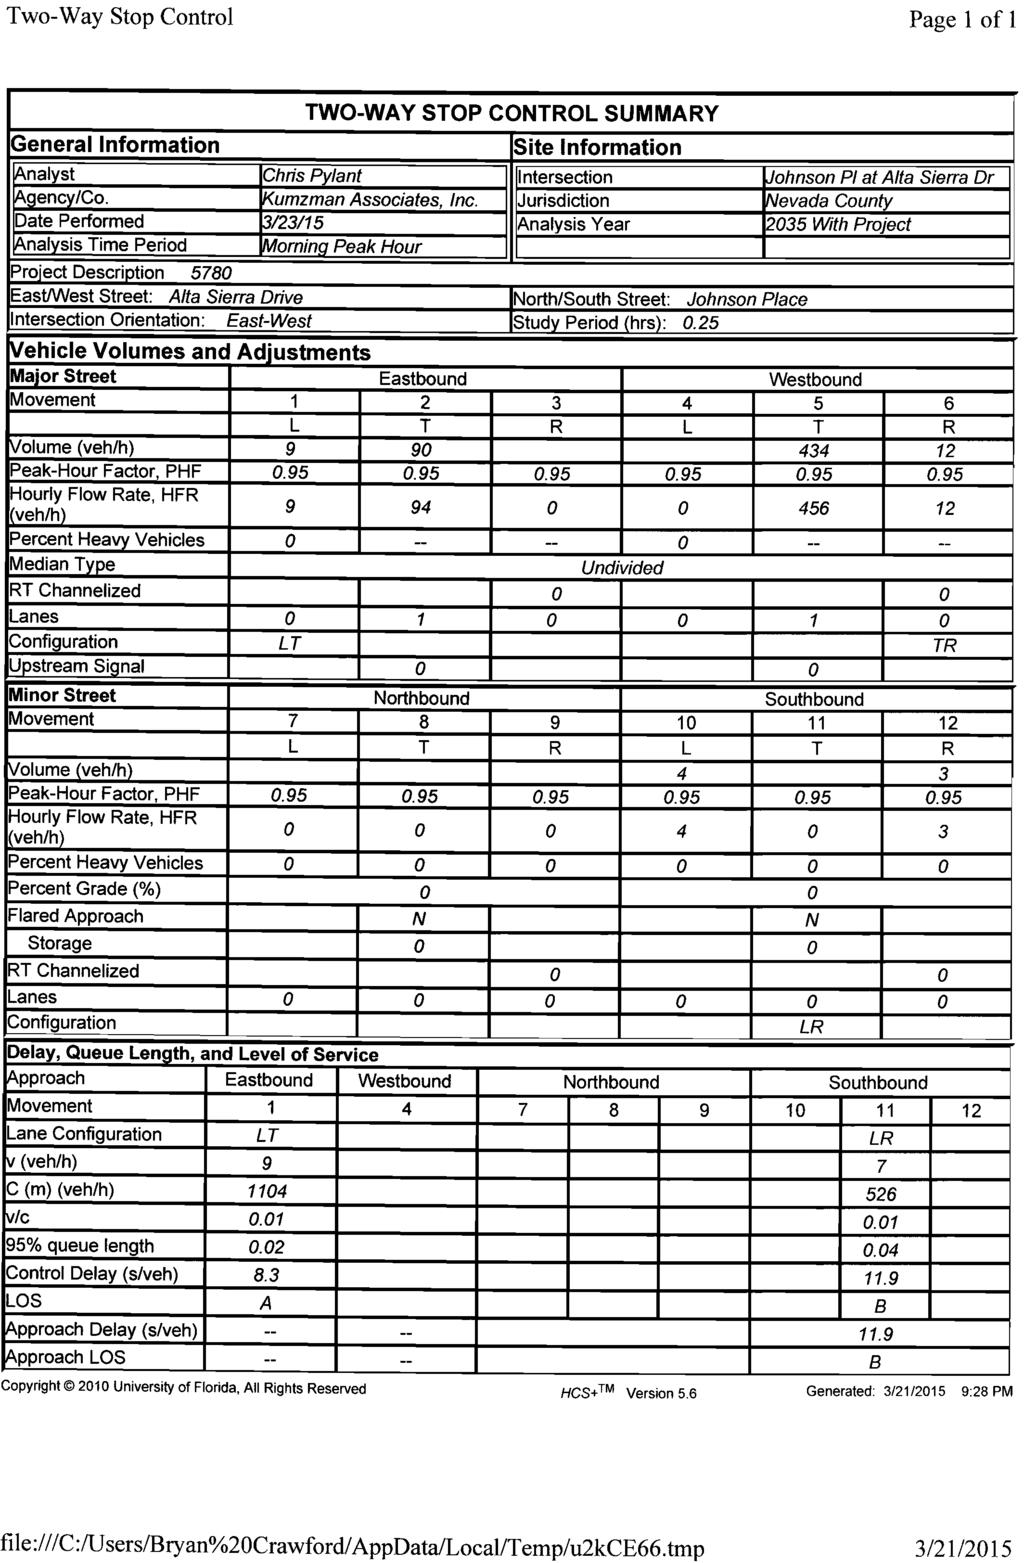
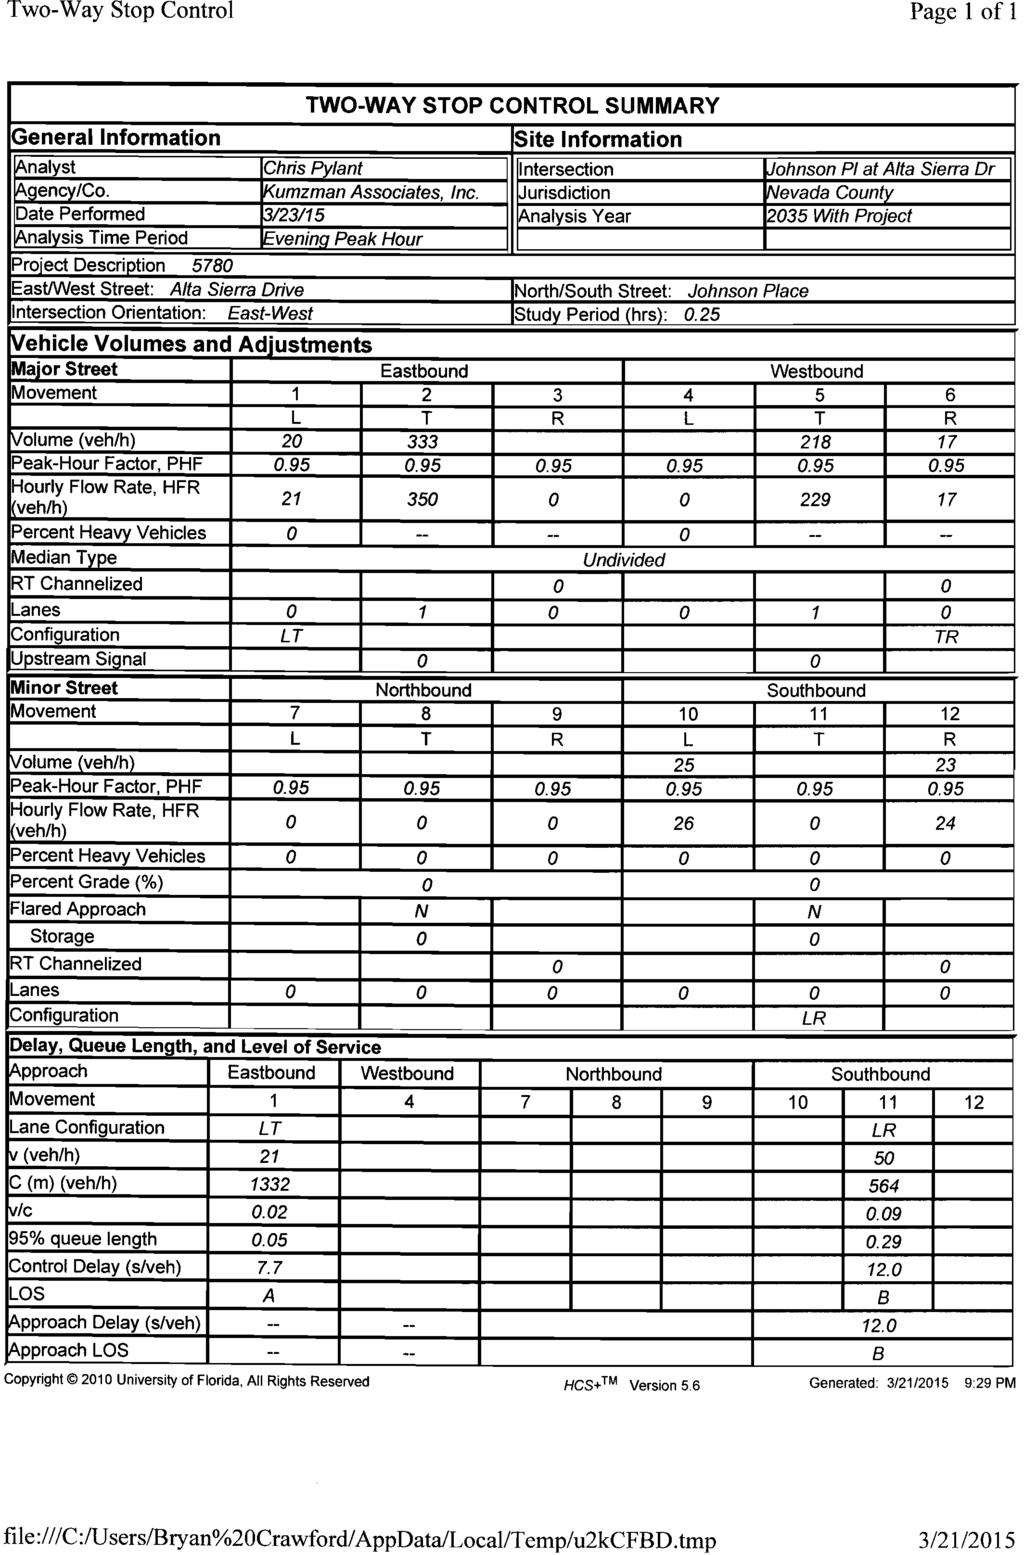
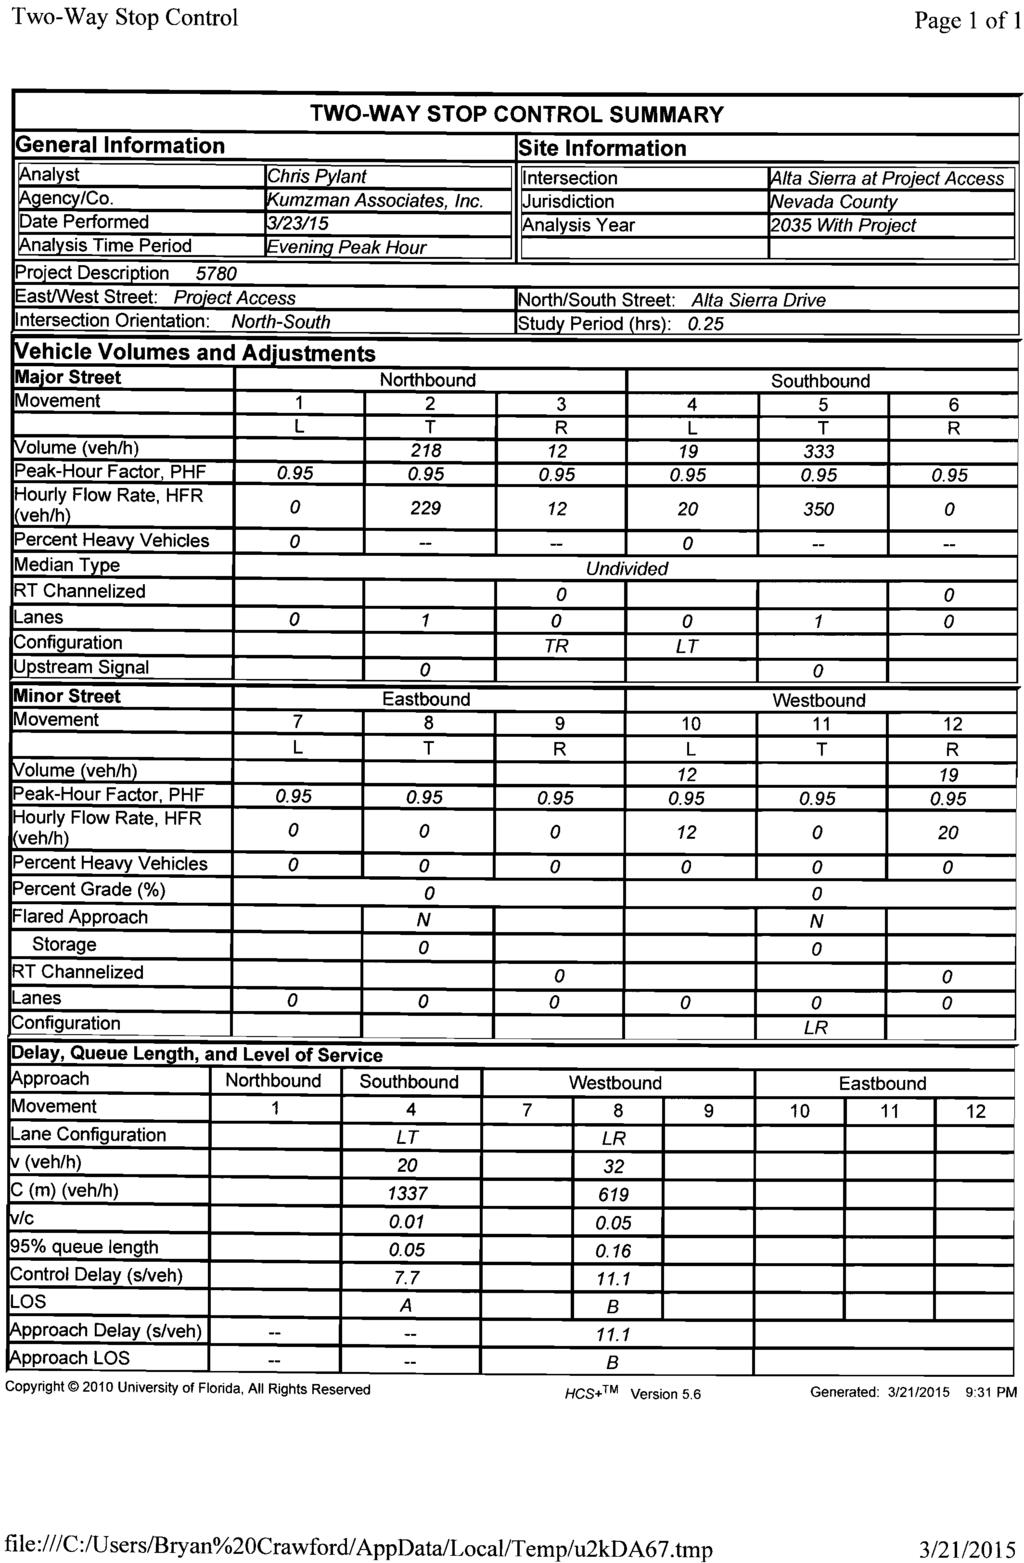
3 Mr. Dan Biswas, VP of Development CJS DEVELOPMENT II, LLC March 25, 2015 A traffic study may still be required where projects may significantly increase traffic during other time periods (i.e. daily, weekend, etc.), impacts an already congested or high collision location, or when specific site access and/or safety issues are of concern. EXISTING TRAFFIC CONDITIONS Figure 3 identifies the existing conditions for study area roadways. The number of through lanes for existing roadways and the existing intersection controls are identified. Existing intersection traffic conditions were established through morning and evening peak hour traffic counts obtained by Kunzman Associates, Inc. from June 2014 (see Appendix B). Explicit peak hour factors have been calculated using the data collected for this effort as well. The morning and evening peak hour traffic volumes were identified by counting the two hour periods from 7:00 AM 9:00 AM and 4:00 PM 6:00 PM. In order to provide for a "conservative" analysis, a growth rate of 9% has been applied to the existing morning and evening peak hour traffic volumes. Since the Pleasant Ridge Union School District went on summer break the week before the traffic counts were taken, and June traffic volumes may be less than during other months of the year due to school not being in session, vacations, etc., a growth rate was determined to provide for "peak month" traffic conditions. Existing average daily traffic volumes were obtained from the 2012 Traffic Volumes on California State Highways by the California Department of Transportation for SR 49 Golden Chain Highway north and south of Alta Sierra Drive. The average daily traffic volumes for these two segments were compared to the peak month average daily traffic volumes resulting in a 7% increase in average daily traffic volumes for SR 49 Golden Chain Highway south of Alta Sierra Drive, and a 11% increase in average daily traffic volumes for SR 49 Golden Chain Highway north of Alta Sierra Drive. The average of 9% was used as the growth rate to reflect "peak month" traffic conditions and applied to the existing morning and evening peak hour traffic volumes. The technique used to assess the capacity needs of an intersection is known as the Intersection Delay Method (see Appendix C) based on the 2010 Highway Capacity Manual Transportation Research Board. To calculate delay, the volume of traffic using the intersection is compared with the capacity of the intersection. The definition of an intersection deficiency has been obtained from the County of Nevada General Plan. The General Plan states that peak hour intersection operations of Level of Service C or better are generally acceptable for Rural Regions, except where existing Level of Service is less than C. In these situations, the Level of Service shall not be allowed to drop below the existing Level of Service. The General Plan states that peak hour intersection operations of Level of Service D or better are generally acceptable for Community Regions, except where existing Level of Service is less than D. In these situations, the Level of Service shall not be allowed to drop below the existing Level of Service. According to the County of Nevada Transportation Department staff, the proposed project is located in a Community Region, and therefore any intersection operating at Level of Service E to F will be considered deficient. 2
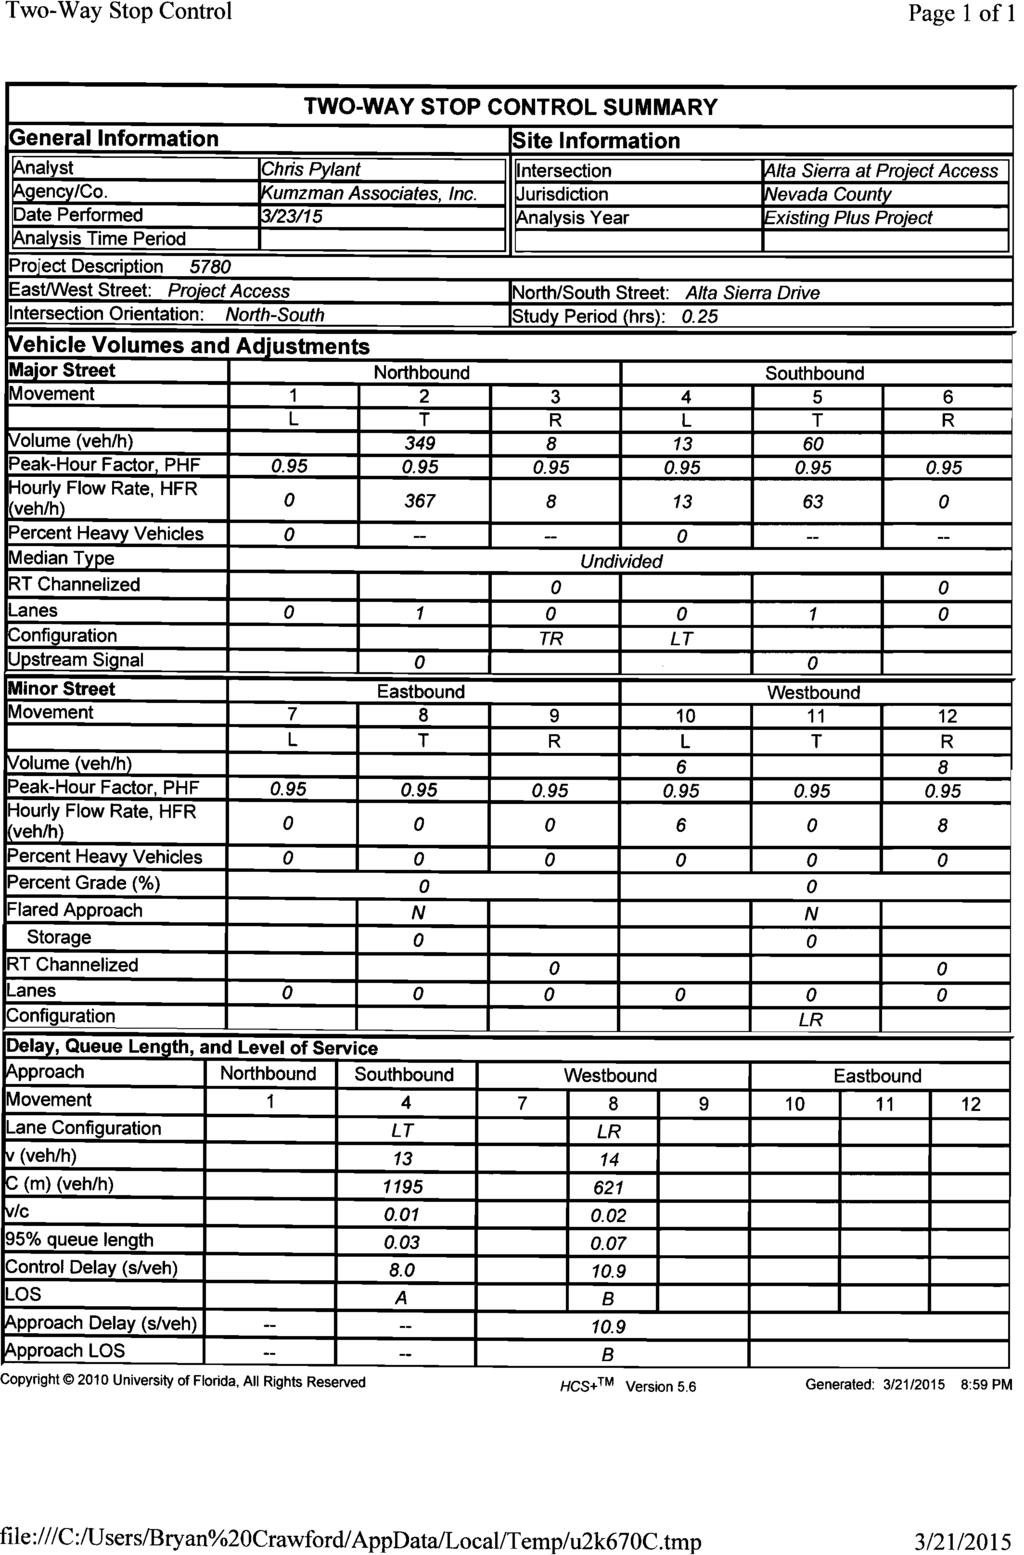
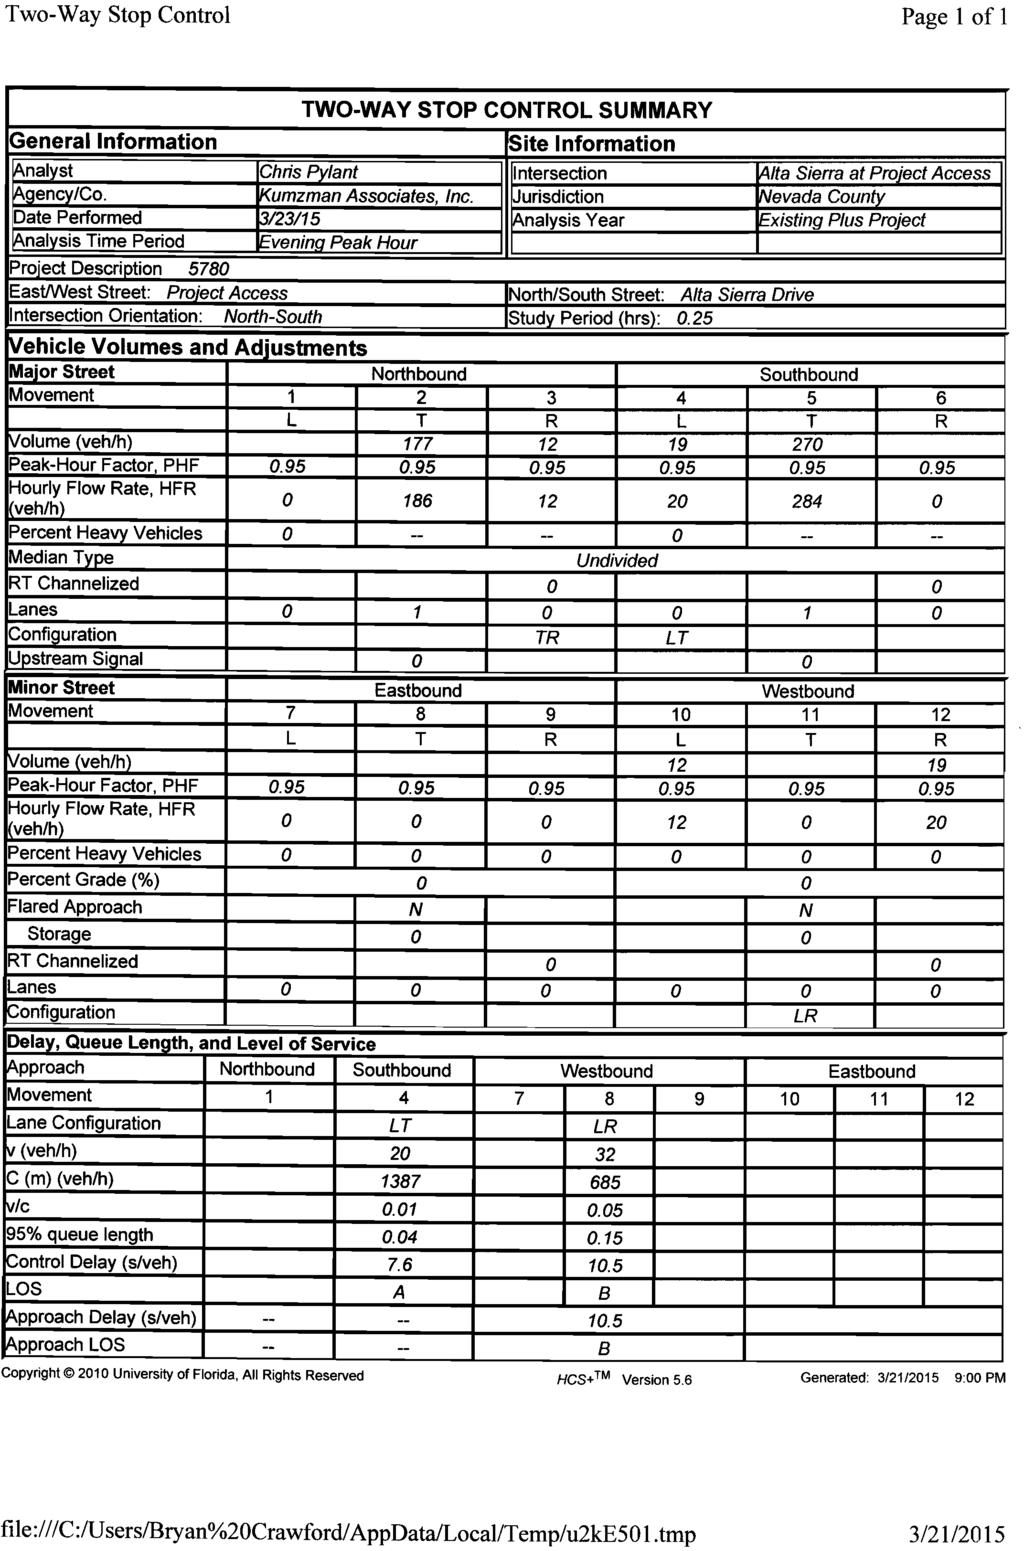
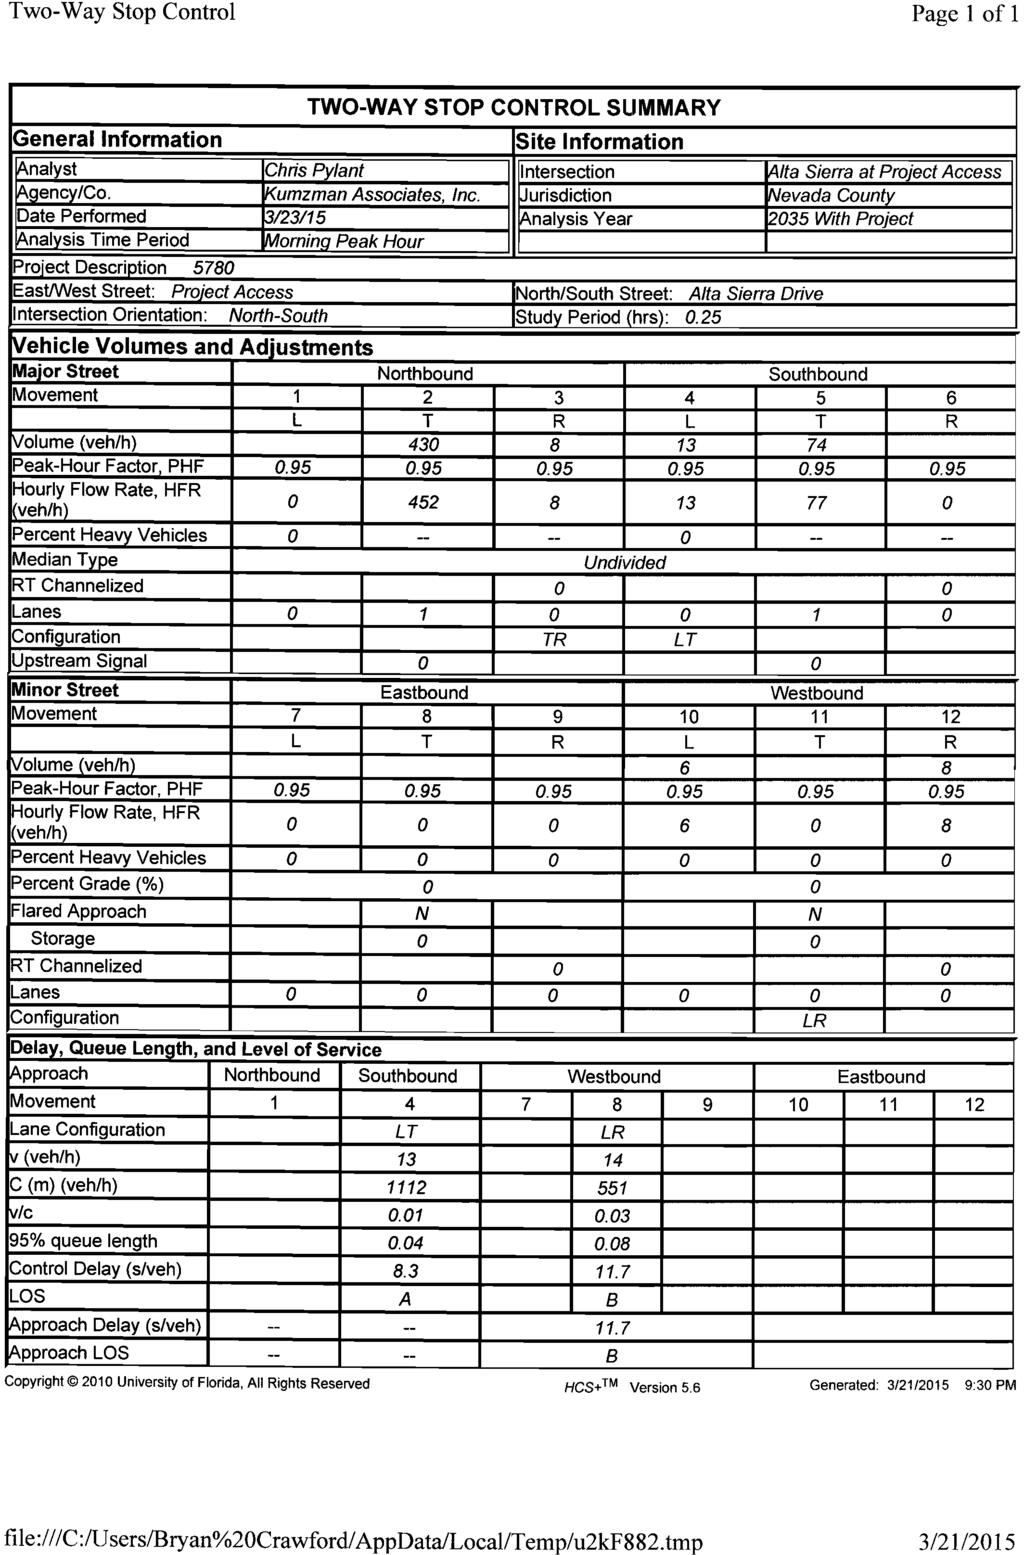
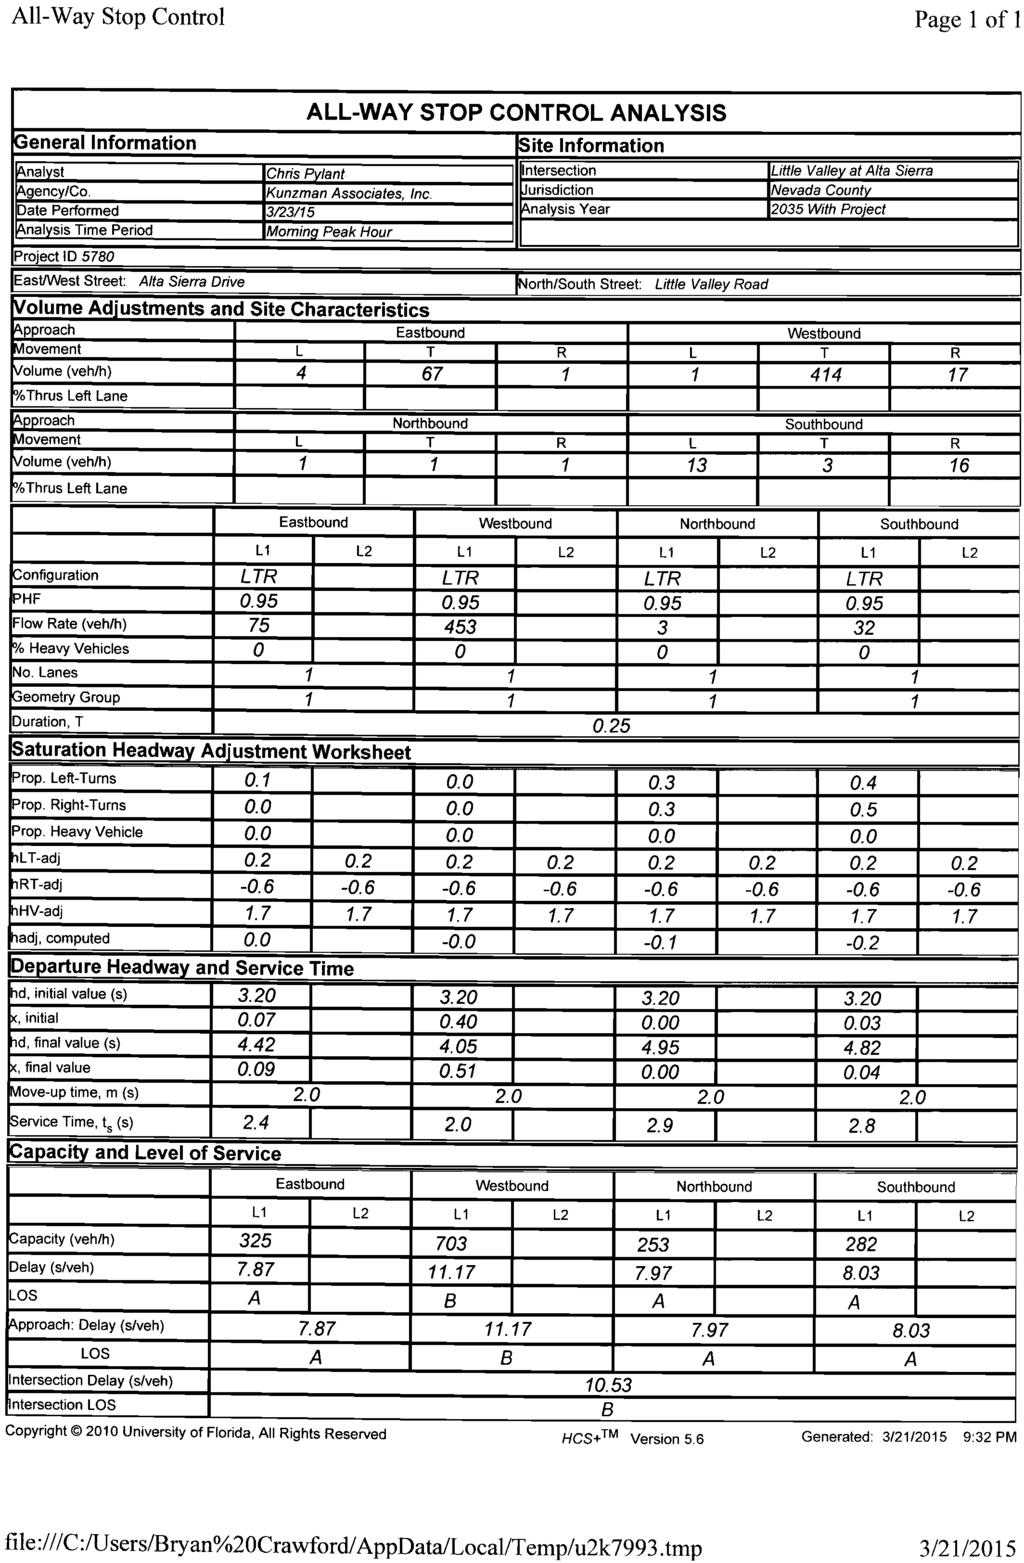
4 Mr. Dan Biswas, VP of Development CJS DEVELOPMENT II, LLC March 25, 2015 If the project traffic causes an intersection or roadway segment to worsen from an acceptable Level of Service to an unacceptable Level of Service or is distributed to an intersection or roadway segment currently operating at an unacceptable Level of service, the project is determined to cause a significant impact which may be mitigated. It is acceptable to mitigate an intersection or roadway segment from an unacceptable Level of Service to an acceptable Level of Service. The existing delay and Level of Service for the study area intersections are shown in Table 1. The study area intersections currently operate within acceptable Levels of Service during the peak hours for Existing traffic conditions. The Existing delay worksheets are provided in Appendix D. PROJECT TRIP GENERATION Trip generation rates were determined for daily traffic, morning peak hour inbound and outbound traffic, and evening peak hour inbound and outbound traffic for the proposed land use. By multiplying the trip generation rates by the land use quantity, the project generated traffic volumes are determined. Table 2 exhibits the trip generation rates, project peak hour volumes, and project daily traffic volumes. The trip generation rates are derived from the Institute of Transportation Engineers, Trip Generation, 9th Edition, In the absence of data from the Institute of Transportation Engineers, the morning and evening peak hour inbound/outbound ratio splits for specialty retail/strip commercial were obtained from the San Diego Association of Governments, Traffic Generators, April The proposed project has been identified as a Variety Store (Land Use: 814) in the Institute of Transportation Engineers, Trip Generation, 9th Edition, A Variety Store (15 study locations) is described as follows: A variety store is a retail store that sells a broad range of inexpensive items often at a single price. These stores are typically referred to as "dollar stores". Items sold at these stores typically include kitchen supplies, cleaning products, home office supplies, food products, household goods, decorations and toys. These stores are sometimes stand alone sites, but they may also be located in small strip shopping centers. Free standing discount store (Land Use 815) is a related use. The proposed development is projected to generate approximately 583 daily vehicle trips, 35 of which occur during the morning peak hour and 62 of which occur during the evening peak hour. PROJECT TRIP DISTRIBUTION Figure 4 contains the directional distribution of the project trips for the proposed land use. To determine the trip distribution for the proposed project, peak hour traffic counts of the existing directional distribution of traffic for existing areas in the vicinity of the site and other additional information on future development and traffic impacts in the area were reviewed. 3
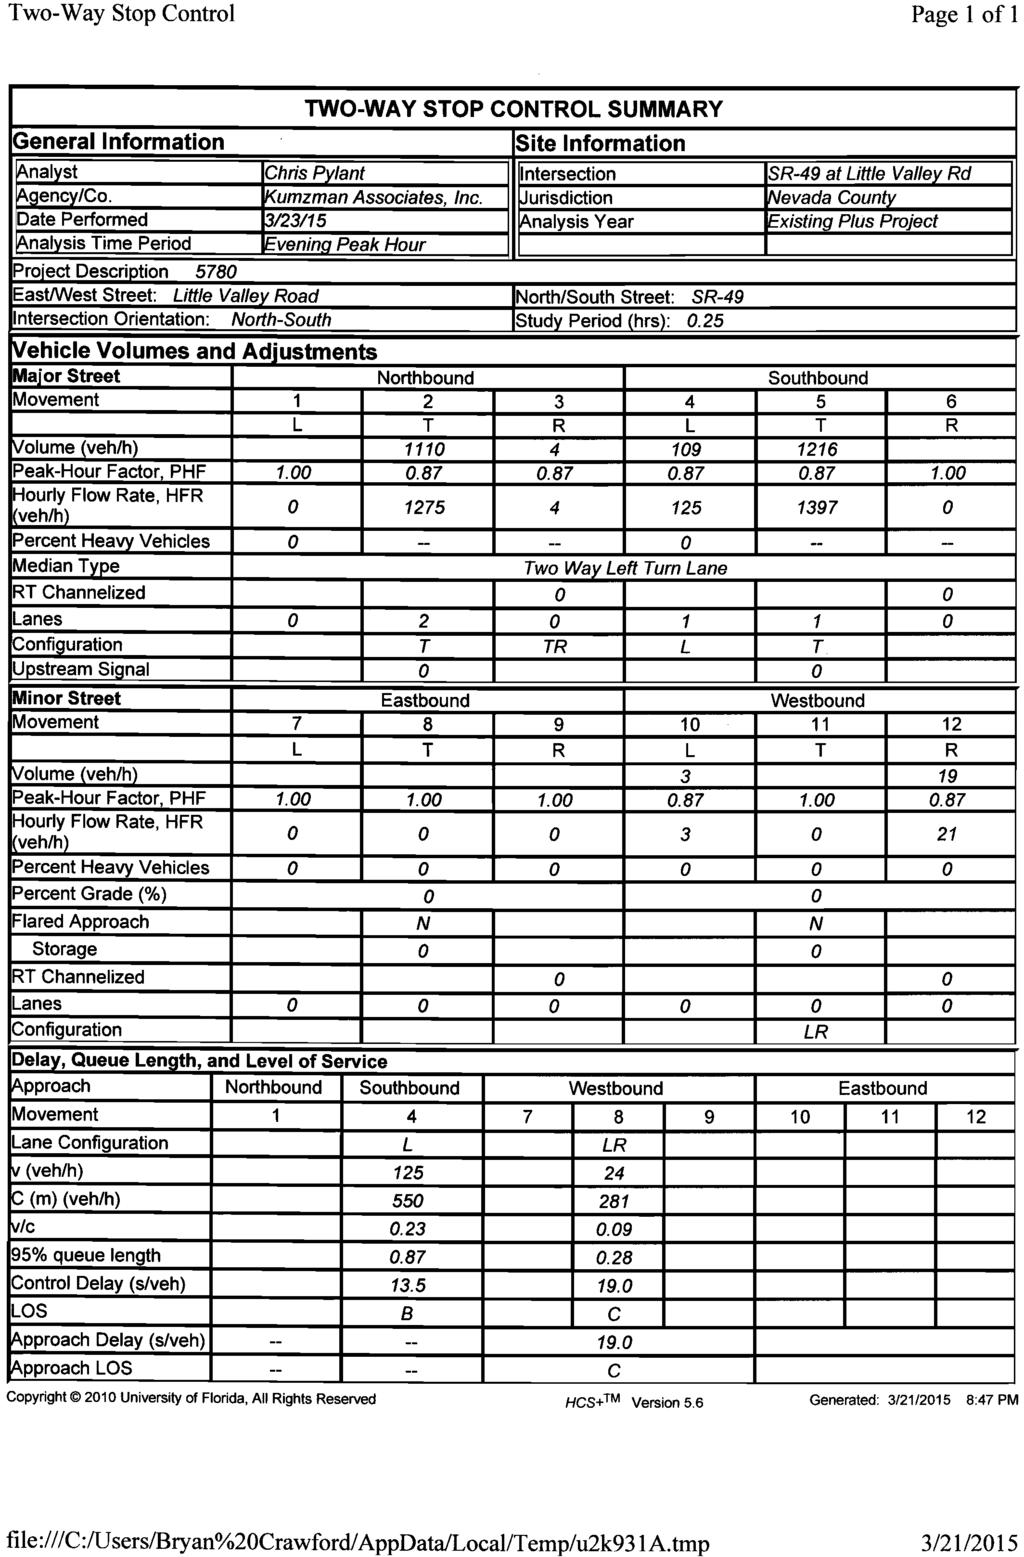
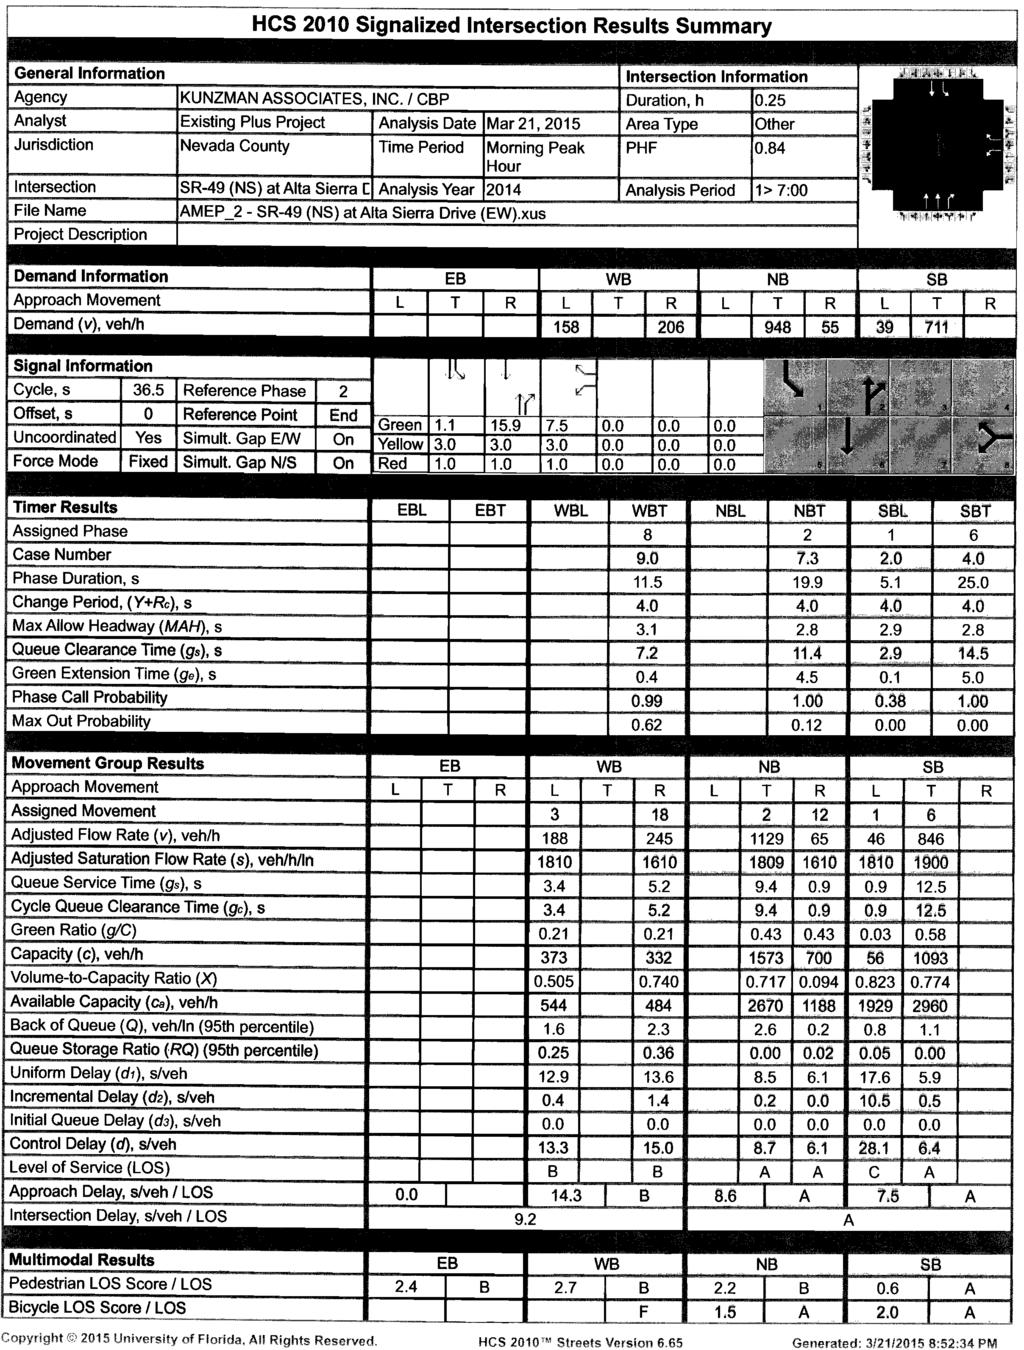
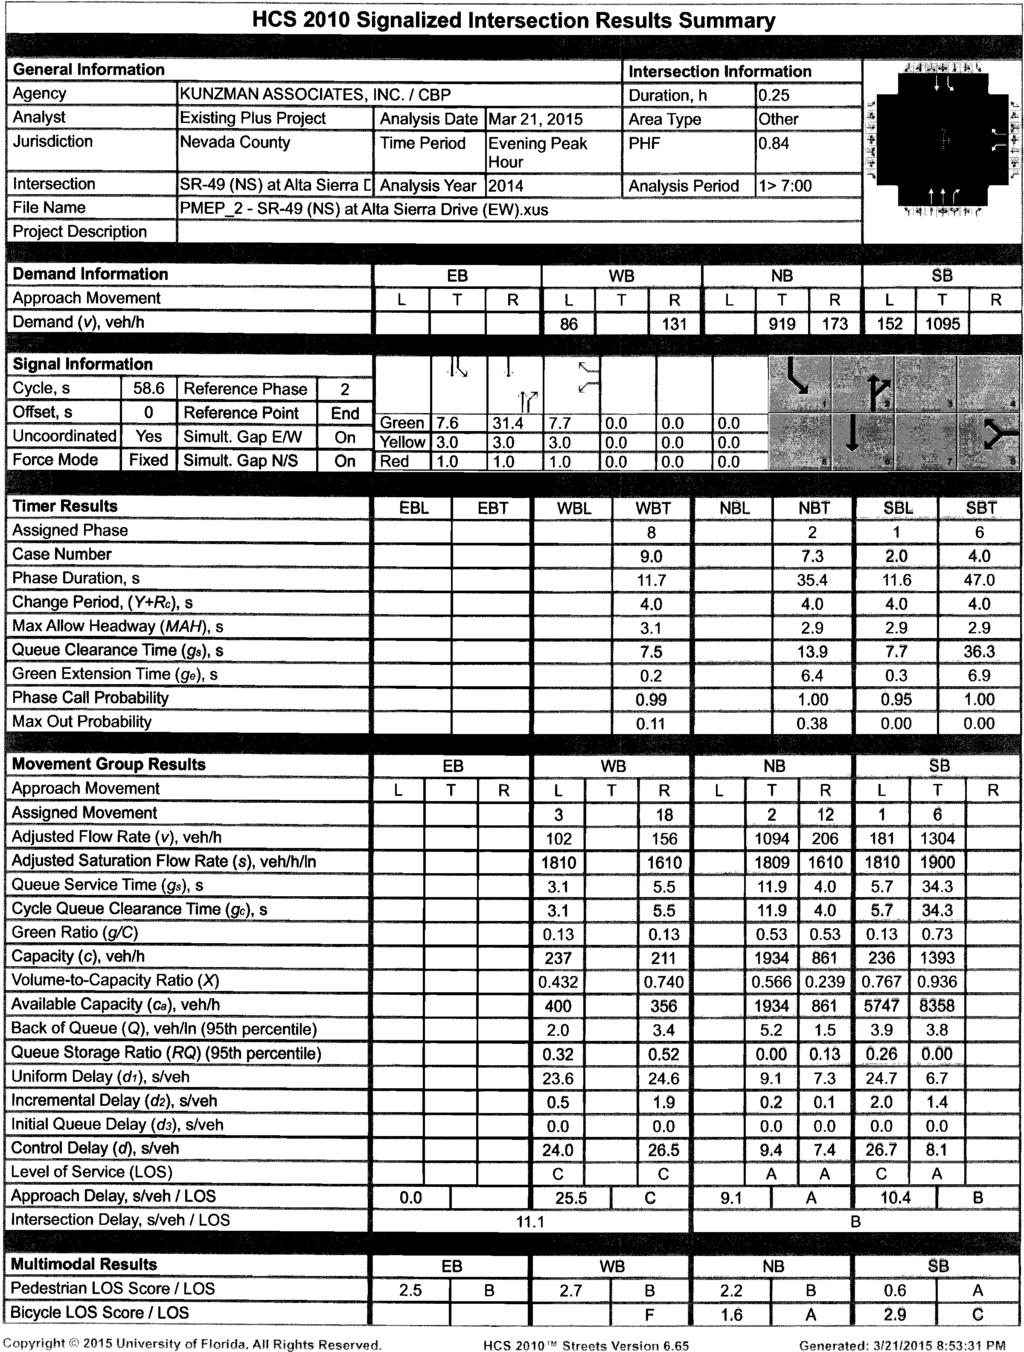
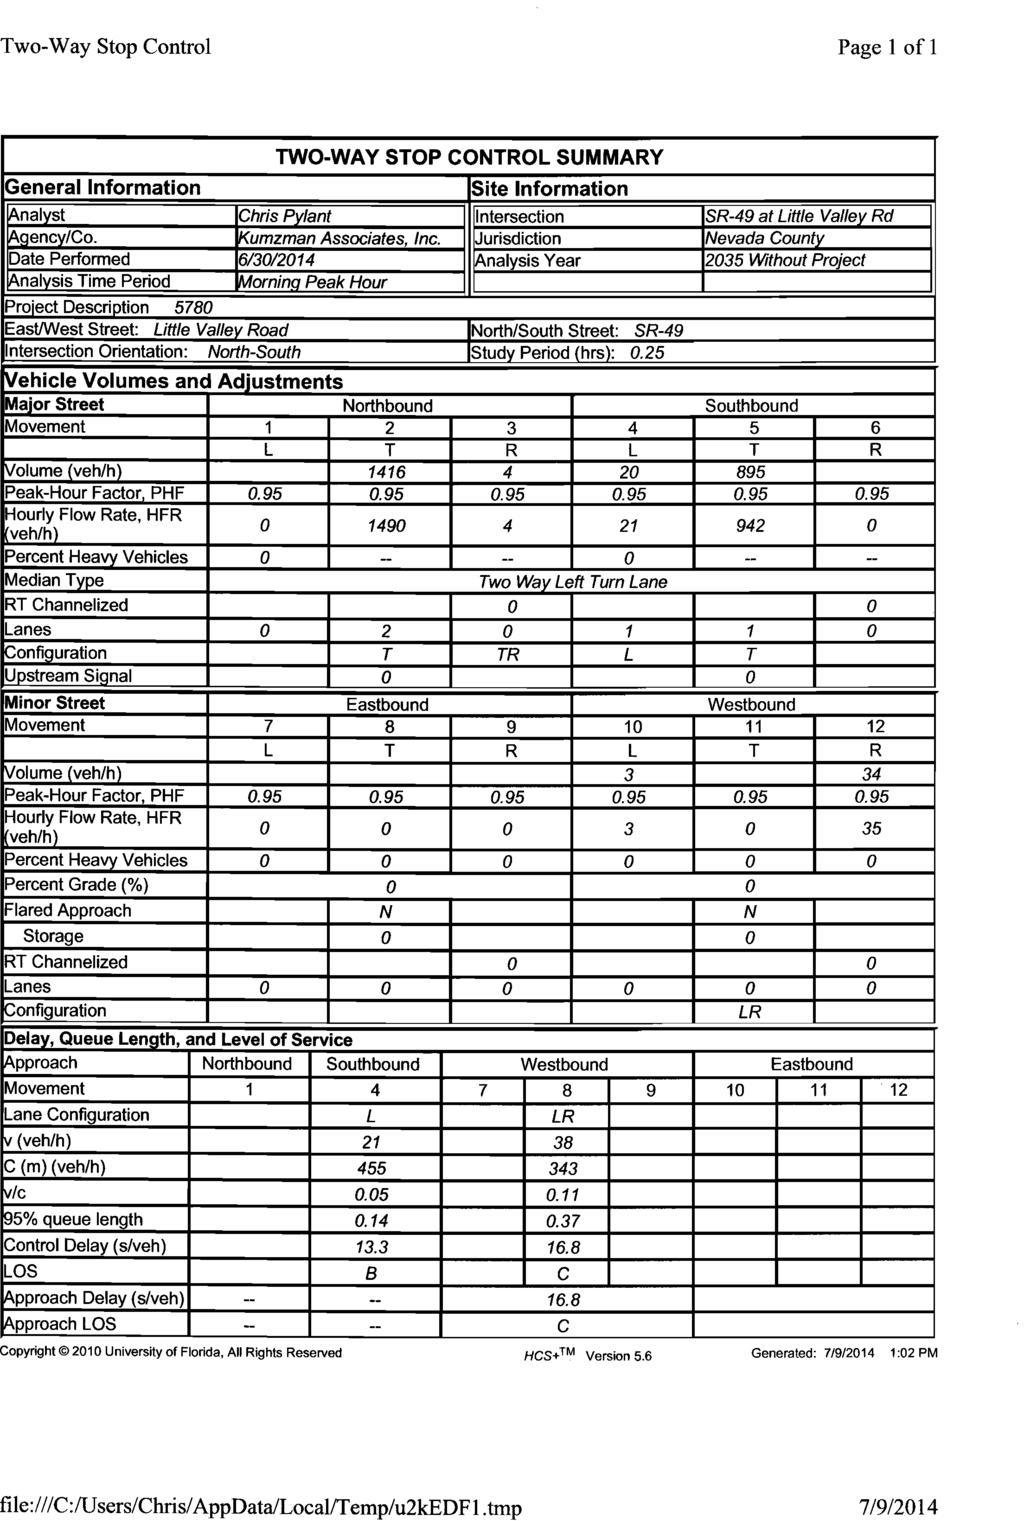
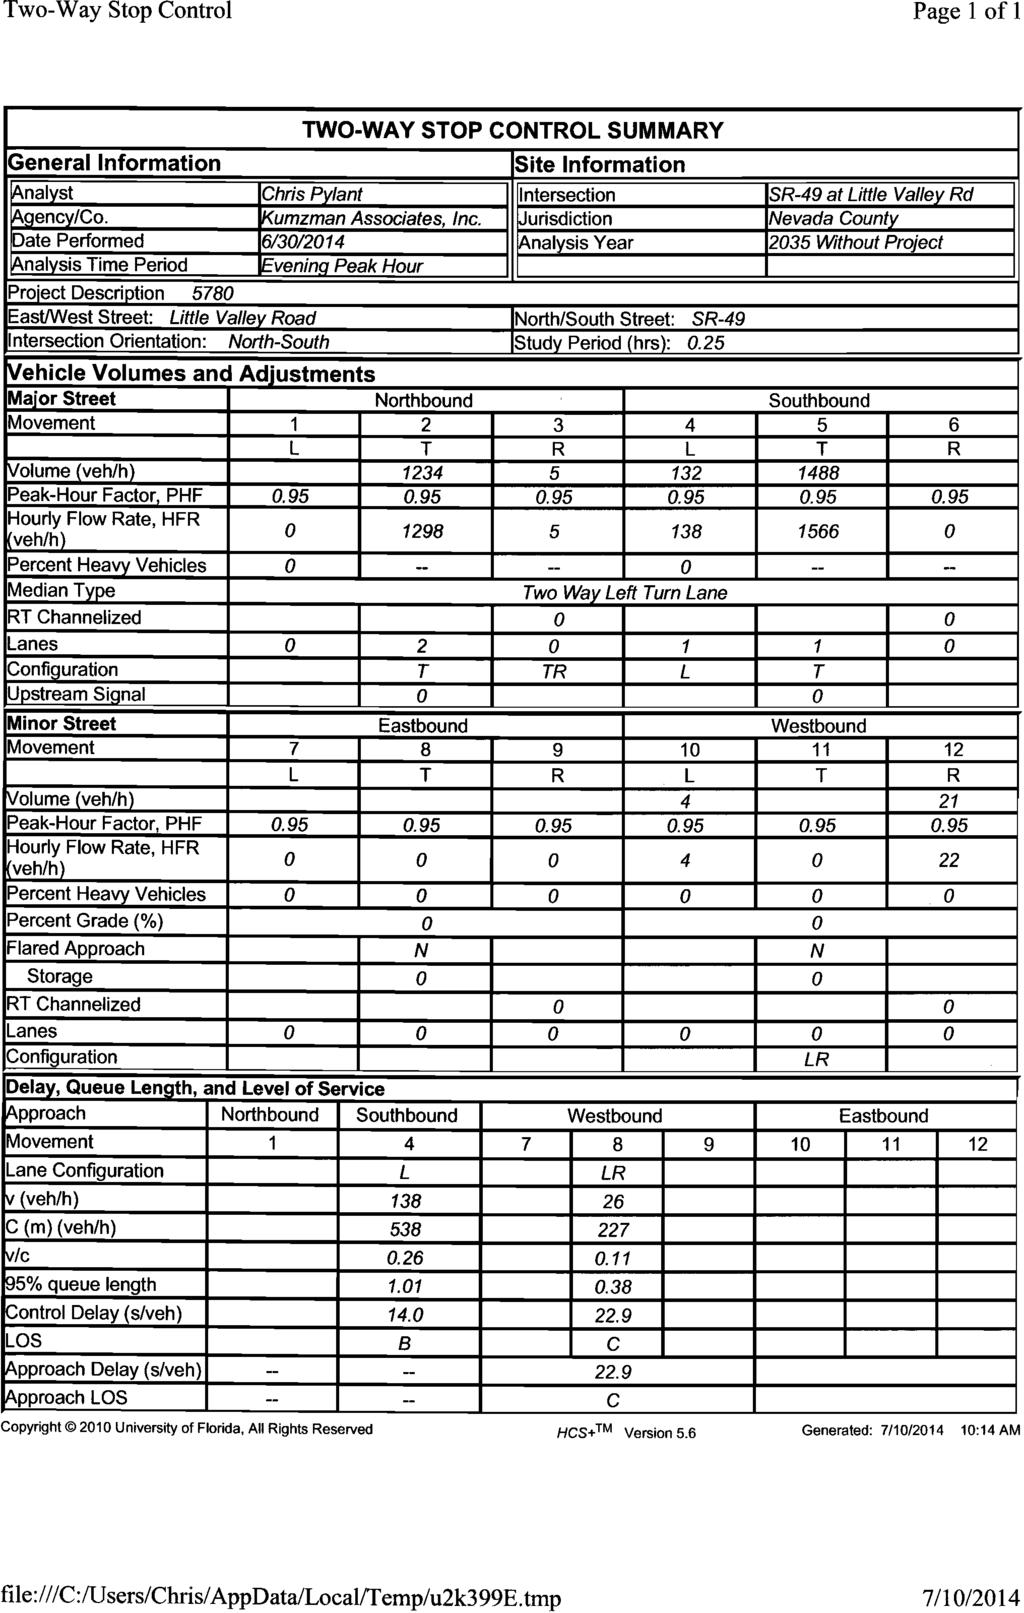
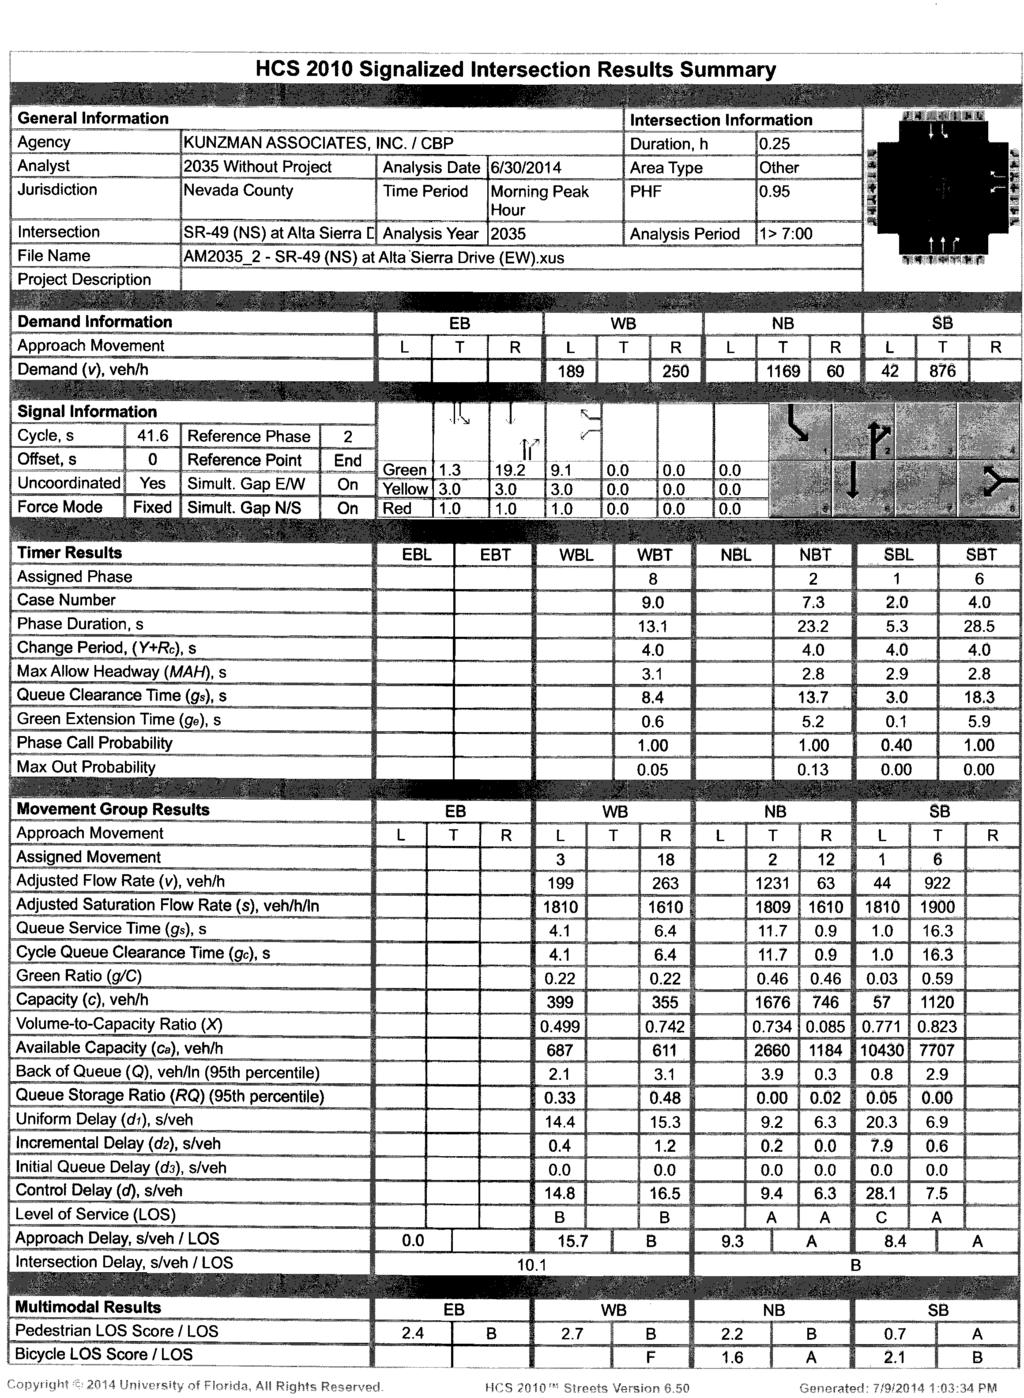
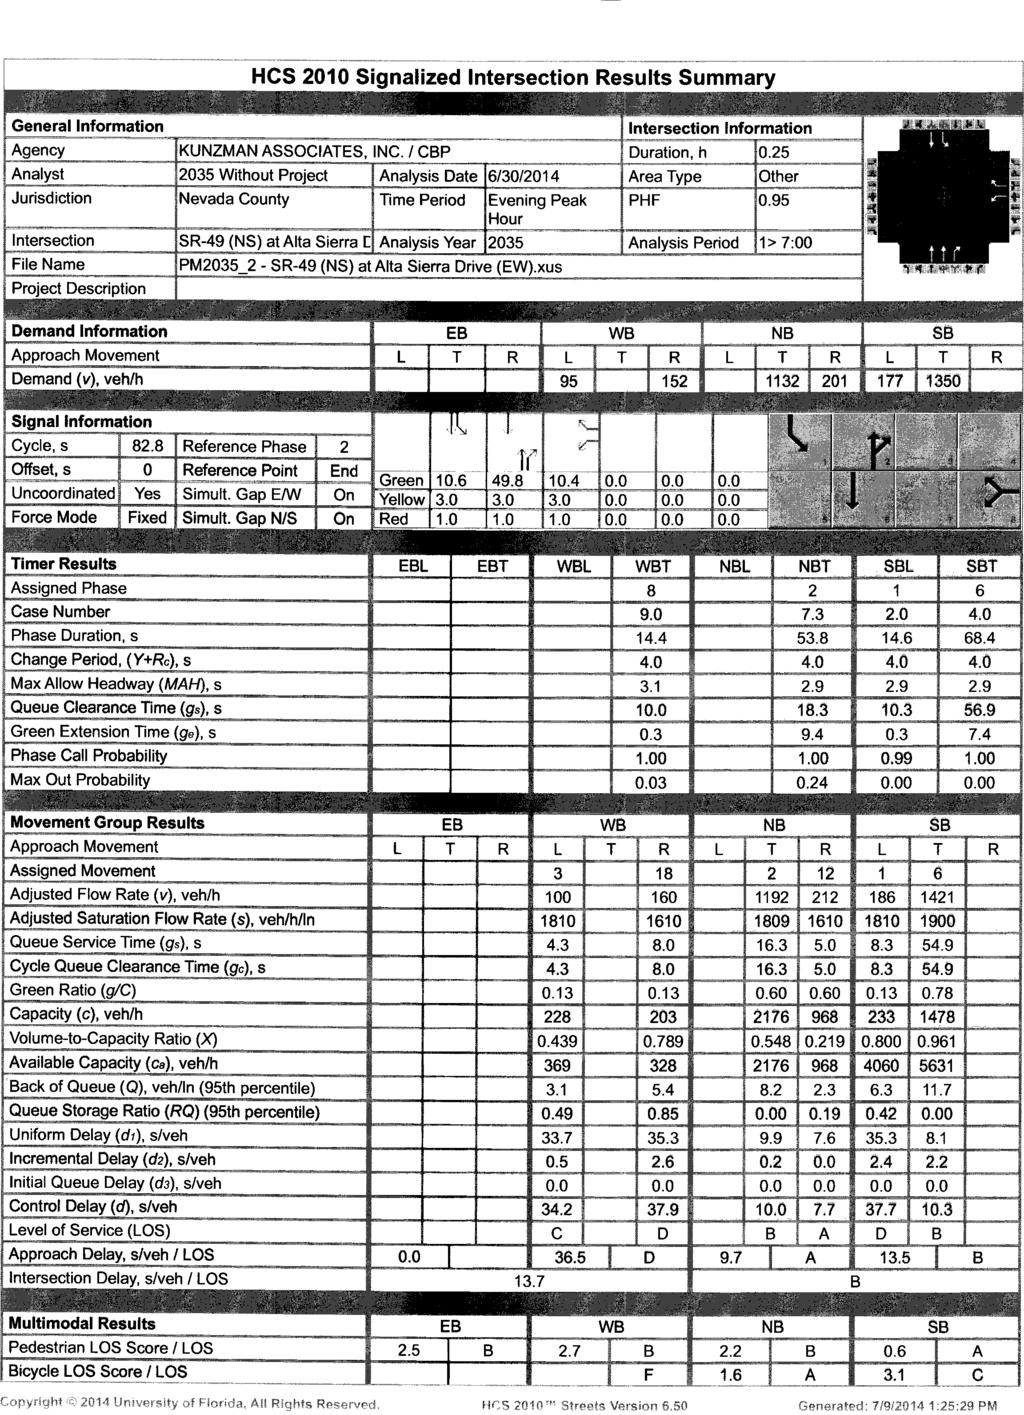
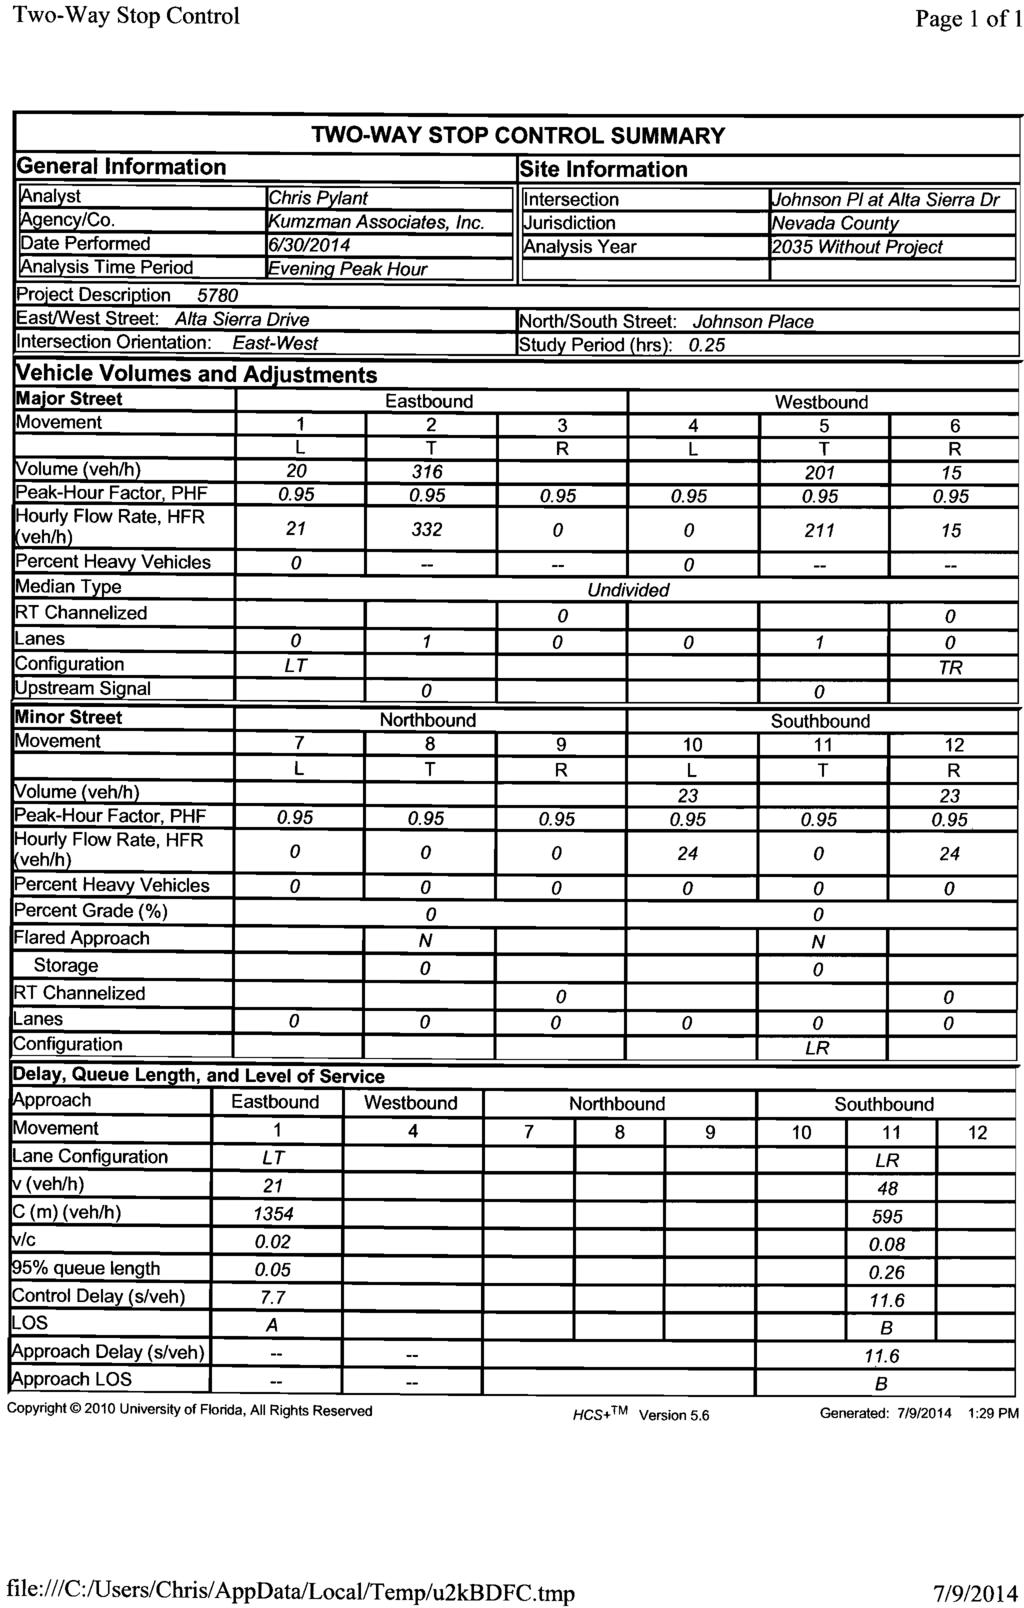
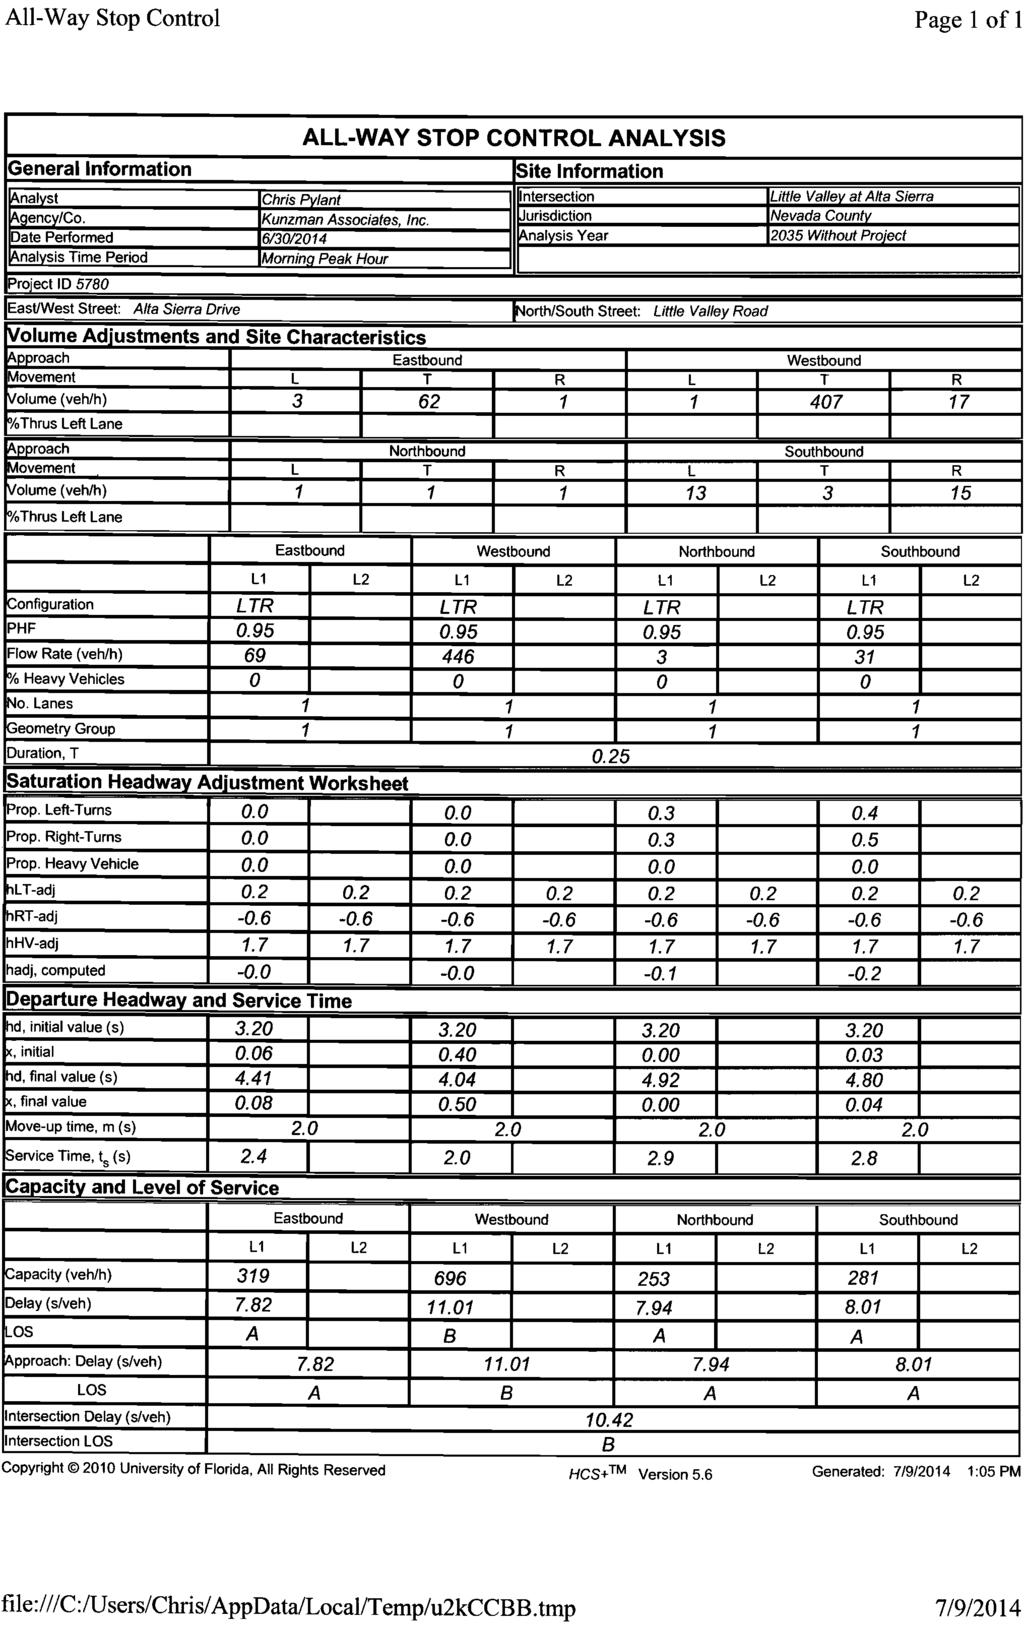
5 Mr. Dan Biswas, VP of Development CJS DEVELOPMENT II, LLC May 20, 2015 STUDY AREA TRAFFIC CONDITIONS The study area intersections were analyzed for Existing Plus Project, Year 2035 Without Project, and Year 2035 With Project traffic conditions (see Appendix D). According to the County of Nevada Transportation Department staff at the time the initial study was conducted, there were no existing projects in the area large enough to warrant an analysis of Existing Plus Approved Projects traffic conditions. Since then, the Forest Springs Mobile Home Park north of the project site has been approved for a 62 dwelling unit expansion. According to the Institute of Transportation Engineers, Trip Generation, 9th Edition, 2012 (Land Use: 240) the trip generation for this project is approximately 27 vehicles during the morning peak hour and 37 vehicles during the evening peak hour. With the majority of vehicles projected to travel north on SR 49, this project is not anticipated to generate significant traffic on the study are intersections and is encompassed within the annual ambient growth rate. Year 2035 was identified for future cumulative conditions. Since the Countywide Traffic Model was being updated when the initial study was conducted, future traffic volume forecasts were not available. In lieu of future traffic forecasts, an annual areawide growth rate of 1.0 percent has been applied for Year 2035 traffic conditions. The growth rate was provided by County of Nevada Transportation Department staff. For Year 2035 traffic conditions, existing traffic volumes have been increased by 1.0 percent annually over a 21 ( ) year period, culminating in a Year 2035 growth rate of (1.01^21) percent over existing traffic volumes. The technique used to assess the capacity needs of an intersection is known as the Intersection Delay Method (see Appendix D) based on the 2010 Highway Capacity Manual Transportation Research Board. To calculate delay, the volume of traffic using the intersection is compared with the capacity of the intersection. The signalized intersections are considered deficient (Level of Service F) if the overall intersection critical volume to capacity ratio equals or exceeds 1.0, even if the Level of Service defined by the delay value is below the defined Level of Service standard. The volume to capacity ratio is defined as the critical volumes divided by the intersection capacity. A volume to capacity ratio greater than 1.0 implies an infinite queue. For Existing Plus Project traffic conditions, the study area intersections are projected to operate at acceptable Levels of Service during the peak hours (see Table 3). For Year 2035 Without Project traffic conditions, the study area intersections are projected to operate at acceptable Levels of Service during the peak hours (see Table 4). For Year 2035 With Project traffic conditions, the study area intersections are projected to operate at acceptable Levels of Service during the peak hours (see Table 5). TRAFFIC QUEUING ANALYSIS Based upon discussions with County of Nevada Transportation Department staff, traffic queues at the study area intersections were evaluated. The lane storage lengths for Year 2035 With Project traffic conditions were determined based on the 95th percentile traffic queue lengths per the 2010 Highway Capacity Manual. 4
6 Mr. Dan Biswas, VP of Development CJS DEVELOPMENT II, LLC May 20, 2015 As shown in the following table, the existing turn pocket lengths exceed the expected 95th percentile traffic queue lengths, except for the southbound left turn pocket at the intersection of SR 49 Golden Chain Highway and Little Valley Road which is projected to be deficient by 6 feet, and the westbound left turn pocket at the intersection of SR 49 Golden Chain Highway and Alta Sierra Drive which is projected to be deficient by 25 feet. The 95th percentile queue lengths shown are the greater between the morning and evening peak hours. Intersection Turn Pocket 95th Percentile Queue Length Turn Pocket Length Sufficient Queuing SR 49 Golden Chain Highway at: Little Valley Road #1 SB Left 181 Feet 175 Feet No SB Left 163 Feet 425 Feet Yes SR 49 Golden Chain Highway at: NB Right 63 Feet 275 Feet Yes Alta Sierra Drive #2 WB Left 85 Feet 160 Feet Yes WB Right 185 Feet 160 Feet No SIGHT DISTANCE ANALYSIS Figure 5 shows the summary for the sight distance analysis. The posted speed limit along Alta Sierra Drive is 25 miles per hour. Per the County of Nevada Department of Transportation Standard Drawings, Required Site Line at Intersections/Driveways (A 6), the minimum required stopping site distance for the prevailing speed on a major road of 25 miles per hour is 150 feet. Appendix D contains the site distance standards. These requirements are consistent with Table in the Highway Design Manual. The stopping sight distance minimum requirement is 150 feet for the intersection of Alta Sierra Drive and Project Access, as the posted speed limit along Alta Sierra Drive is 25 miles per hour. The driver's eye for a vehicle located at the Project Access intending to head either northbound or southbound on Alta Sierra Drive is situated 42 inches above the pavement and 15 feet back from the edge of the travelway. The driver must have a minimum unobstructed sight line of 150 feet looking southbound at an object 51 inches above the pavement situated in the center of the northbound traffic lane, and must have a minimum unobstructed sight line of 150 feet looking northbound at an object 51 inches above the pavement situated in the center of the southbound traffic lane. Stopping sight distance requires 150 feet of unobstructed line of sight at the intersection of Alta Sierra Drive and Project Access. The intersection of Alta Sierra Drive at Project Access provides more than 150 feet and adequate stopping sight distance is provided. The restricted use areas are limited to the property frontage along the north and south sides of Alta Sierra Drive at Project Access. No objects within the restricted use areas should exceed the maximum height of eighteen (18) inches to insure a clear line of sight. Figure 6 shows the maximum sight distance available at the project access location. 5
7 Mr. Dan Biswas, VP of Development CJS DEVELOPMENT II, LLC May 20, 2015 TRUCK TURNING TEMPLATES Figures 7 and 8 show the truck turning templates for the project access. Truck turning templates are provided for both inbound and outbound truck turning movements at the project access. The truck turning templates utilized a WB 67 truck and are therefore a "worst case" analysis if Alta Sierra Drive became a STAA designated roadway, whereas the roadway is currently restricted to the California Legal trucks which are shorter in overall length than the STAA truck (WB 67). EMERGENCY ACCESS Figure 9 illustrates the distances from Alta Sierra Drive and Little Valley Road to the entrance of the building and property boundary for an emergency vehicle parked along Alta Sierra Drive or Little Valley Road. Since these distances are less than 1,000 feet, adequate emergency access is provided because emergency personnel can park along Alta Sierra Drive or Little Valley Road and provide emergency services in the event that the project access is blocked and inaccessible. TRAFFIC IMPACT FEES To offset the traffic impacts on the roadway network of future developments, the County of Nevada collects a Regional Transportation Mitigation Fee. The project site is located within the Western Nevada County Regional Transportation Mitigation Fee program area. The fee is calculated by multiplying the number of project generated daily vehicle trips (583) by the cost of $110 per retail trip, for a total of $64,130. In addition, the Local Traffic Mitigation Fee is assessed at $40 per retail trip, for a total of $23,320. The cumulative total for both fees is $87,450. It should be noted that Regional Transportation Mitigation Fee and Local Traffic Mitigation Fee shall both be calculated using the most recent fee schedules in effect at the time the fees are due. CONCLUSIONS The proposed development is projected to generate approximately 583 daily vehicle trips, 35 of which occur during the morning peak hour and 62 of which occur during the evening peak hour. For Existing Plus Project traffic conditions, the study area intersections are projected to operate at acceptable Levels of Service during the peak hours. For Year 2035 Without Project traffic conditions, the study area intersections are projected to operate at acceptable Levels of Service during the peak hours. For Year 2035 With Project traffic conditions, the study area intersections are projected to operate at acceptable Levels of Service during the peak hours. Stopping sight distance requires 150 feet of unobstructed line of sight at the intersection of Alta Sierra Drive and Project Access. The intersection of Alta Sierra Drive at Project Access provides more than 150 feet and adequate stopping sight distance is provided. 6

8 Mr. Dan Biswas, VP of Development CJS DEVELOPMENT II, LLC May 20, 2015 The Western Nevada County Regional Transportation Mitigation Fee for the project site is $64,130. The Local Traffic Mitigation Fee is $23,320. The cumulative total for both fees is $87,450. It should be noted that Regional Transportation Mitigation Fee and Local Traffic Mitigation Fee shall both be calculated using the most recent fee schedules in effect at the time the fees are due. RECOMMENDATIONS The following improvements are recommended in conjunction with the proposed development to ensure adequate circulation within the project itself (see Figure 10). Construct Alta Sierra Drive from the north project boundary to the south project boundary at its ultimate half section width including landscaping and parkway improvements in conjunction with development adhering to sight distance requirements. Construct Little Valley Road from the north project boundary to the south project boundary at its ultimate half section width including landscaping and parkway improvements in conjunction with development adhering to sight distance requirements. The site should provide sufficient parking spaces to meet County of Nevada parking code requirements in order to service on site parking demand. On site traffic signing/striping should be implemented in conjunction with detailed construction plans for the project site. As is the case for any roadway design, the County of Nevada should periodically review traffic operations in the vicinity of the project once the project is constructed to assure that the traffic operations are satisfactory. It has been a pleasure to service your needs on this project. Should you have any questions or if we can be of further assistance, please do not hesitate to call at (714) Sincerely, KUNZMAN ASSOCIATES, INC. KUNZMAN ASSOCIATES, INC. Bryan Crawford Associate William Kunzman, P.E. Principal #5780b 7
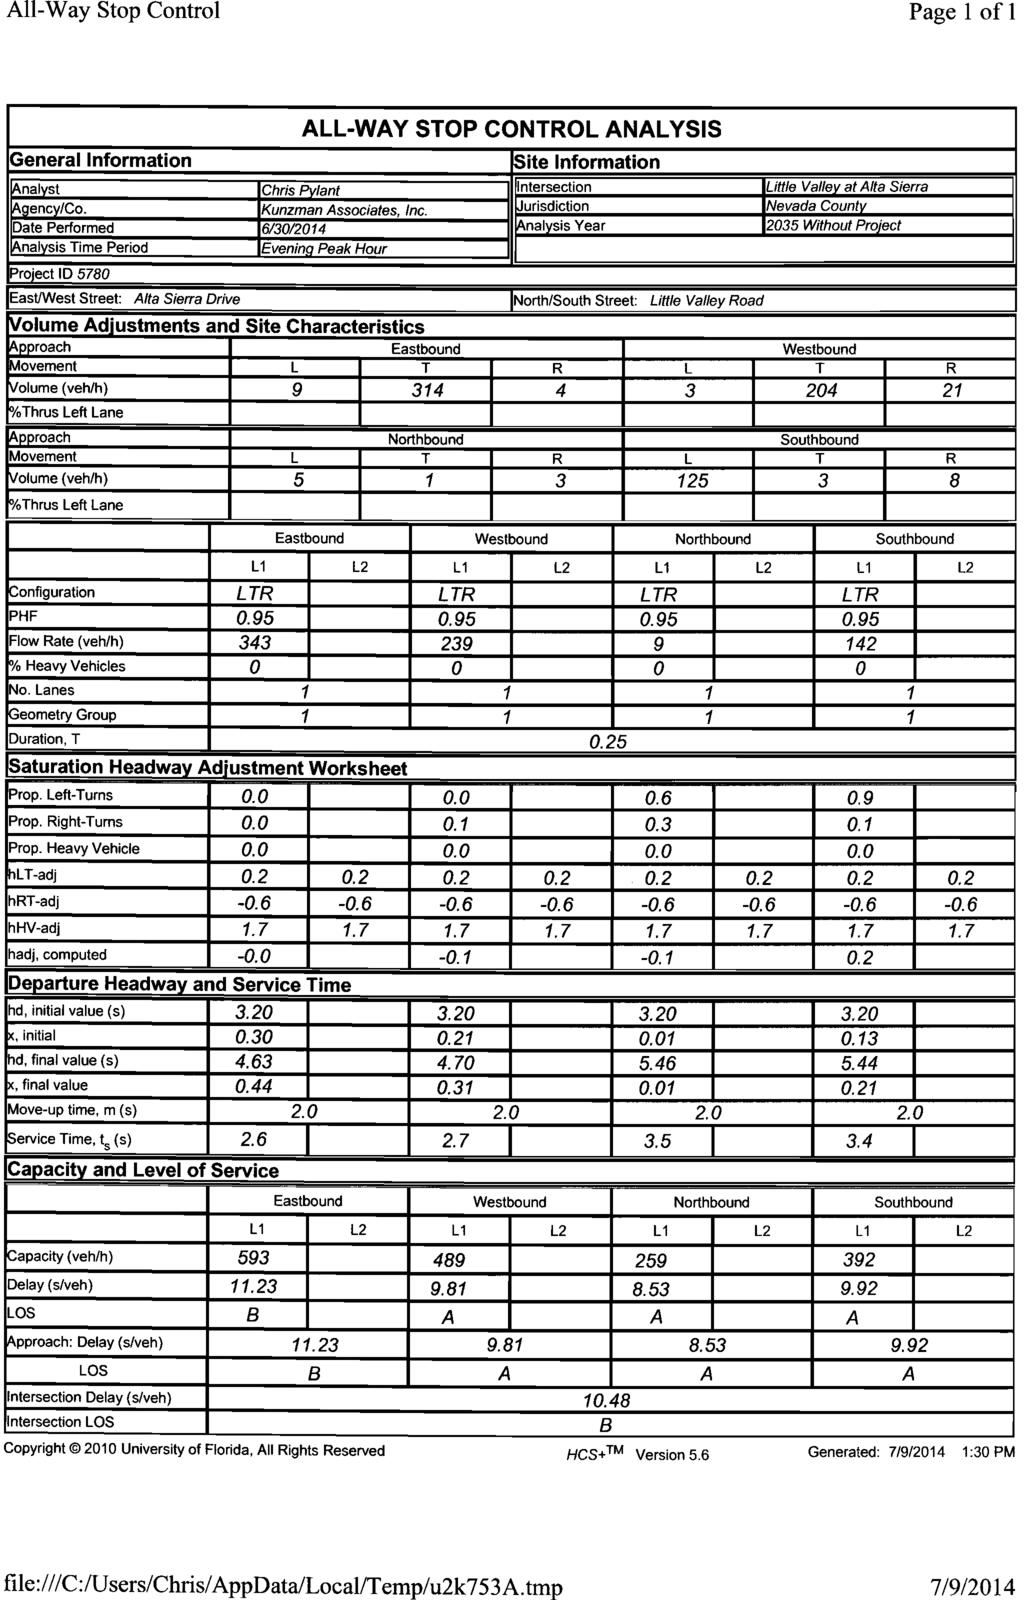
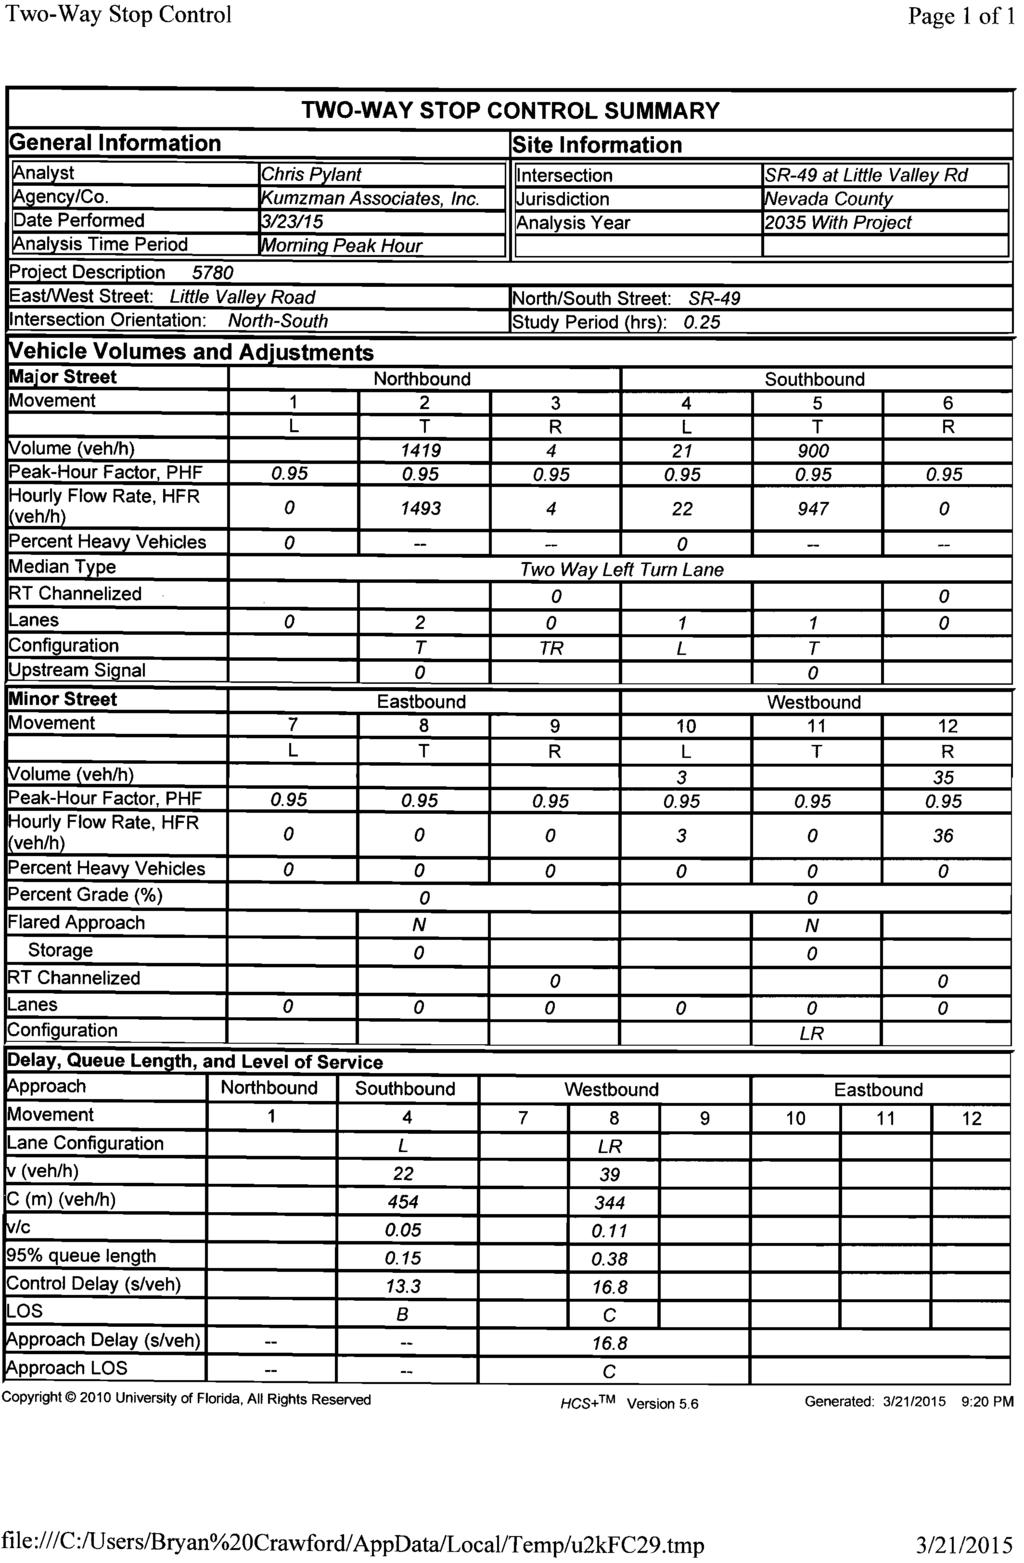
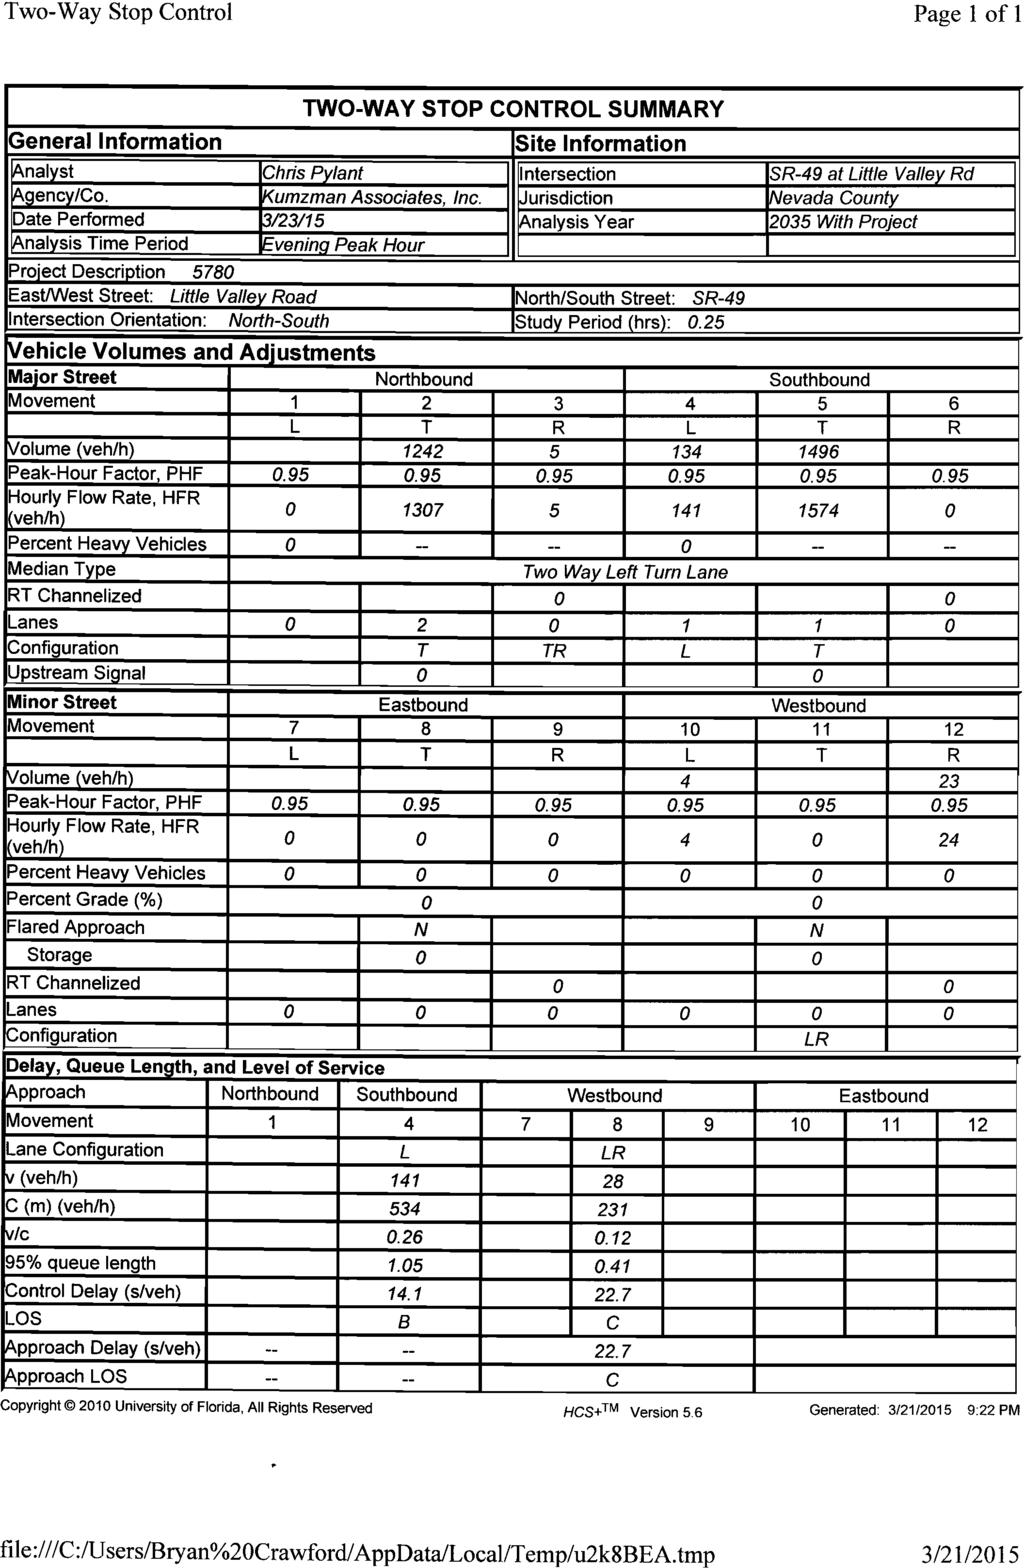
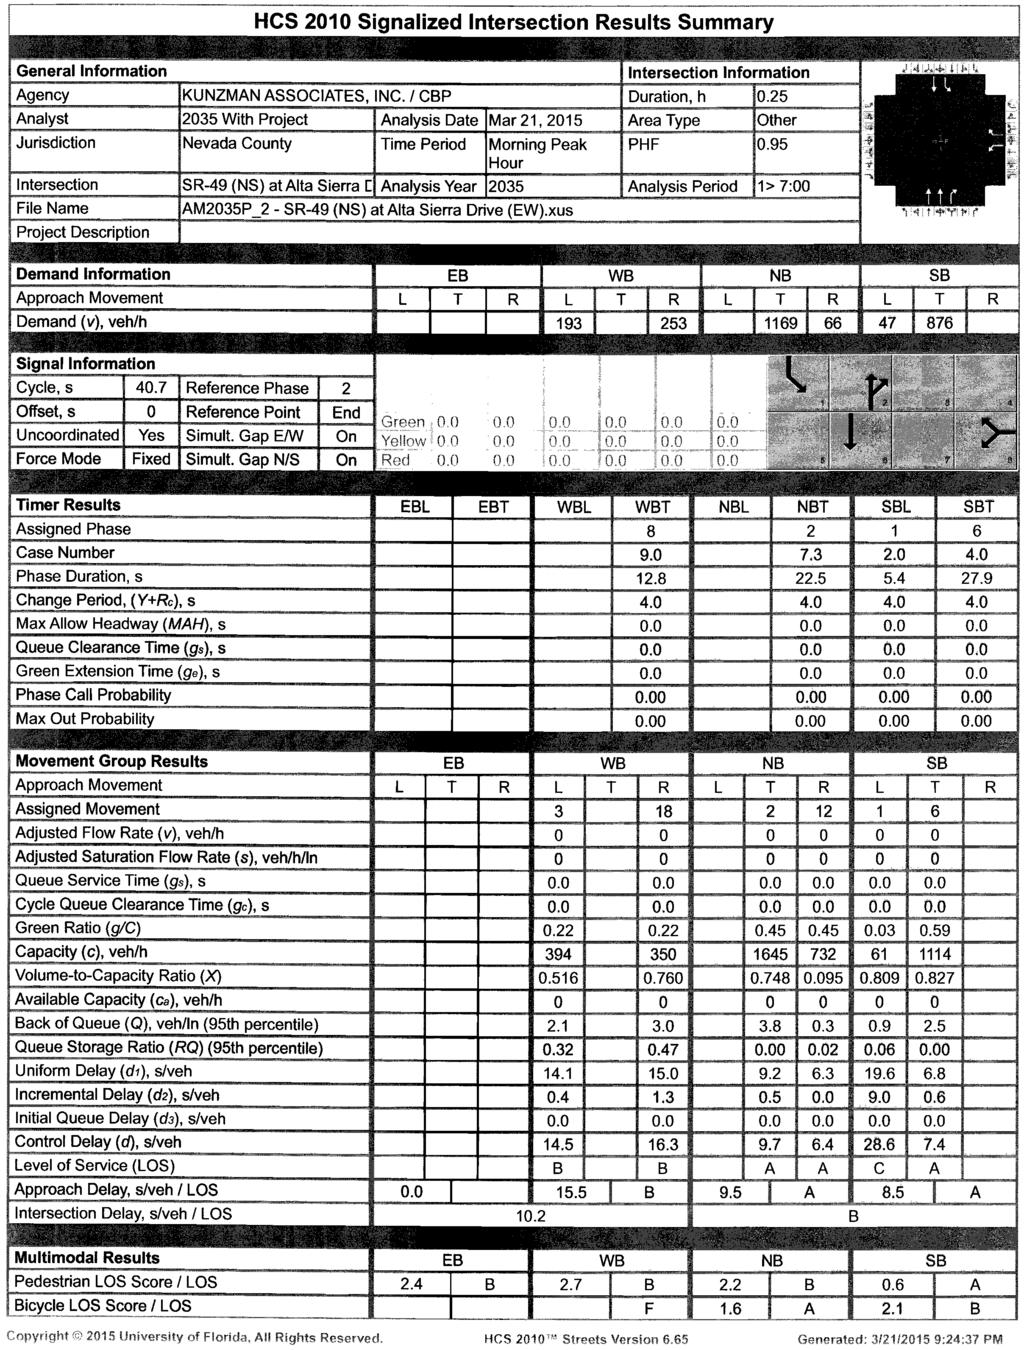
9 Table 1 Existing Intersection Delay and Level of Service Intersection SR 49 Golden Chain Highway (NS) at: Intersection Approach Lanes 1 Peak Hour Traffic Northbound Southbound Eastbound Westbound Delay LOS 2 Control 3 L T R L T R L T R L T R Morning Evening Little Valley Road (EW) #1 CSS B 18.2 C Alta Sierra Drive (EW) #2 TS A 10.5 B Johnson Place (NS) at: Alta Sierra Drive (EW) #3 CSS B 11.0 B Little Valley Road (NS) at: Alta Sierra Drive (EW) #5 AWS B 9.8 A 1 When a right turn lane is designated, the lane can either be striped or unstriped. To function as a right turn lane there must be sufficient width for right turning vehicles to travel outside the through lanes. L = Left; T = Through; R = Right 2 Delay and level of service has been calculated using the following analysis software: HCS+ Version 5.6. Per the 2010 Highway Capacity Manual, overall average for intersection delay and level of service are shown for intersections with traffic signal or all way stop control, the delay and level of service for the worst individual movement (or movements sharing a single lane) are shown. 3 CSS = Cross Street Stop; TS = Traffic Signal; AWS = All Way Stop 8
10 Table 2 Project Trip Generation 1 Morning Peak Hour Evening Land Use Quantity Units 2 Inbound Outbound Total Inbound Outbound Total Daily Trip Generation Rates Variety Store TSF Trips Generated Variety Store TSF Source: Institute of Transportation Engineers, Trip Generation, 9th Edition, 2012, Land Use Category 814. Since morning and evening peak hour inbound/ outbound ratios are not available, the morning and evening peak hour inbound/outbound ratio splits for specialty retail/strip commercial has been obtained from the San Diego Association of Governments, Traffic Generators, April TSF = Thousand Square Feet 9
11 Table 3 Existing Plus Project Intersection Delay and Level of Service Intersection SR 49 Golden Chain Highway (NS) at: Intersection Approach Lanes 1 Peak Hour Traffic Northbound Southbound Eastbound Westbound Delay LOS 2 Control 3 L T R L T R L T R L T R Morning Evening Little Valley Road (EW) #1 CSS B 19.0 C Alta Sierra Drive (EW) #2 TS A 11.1 B Johnson Place (NS) at: Alta Sierra Drive (EW) #3 CSS B 11.3 B Alta Sierra Drive (NS) at: Project Access (EW) #4 CSS B 10.5 B Little Valley Road (NS) at: Alta Sierra Drive (EW) #5 AWS B 10.1 B 1 When a right turn lane is designated, the lane can either be striped or unstriped. To function as a right turn lane there must be sufficient width for right turning vehicles to travel outside the through lanes. L = Left; T = Through; R = Right; 1 = Improvement 2 Delay and level of service has been calculated using the following analysis software: HCS+ Version 5.6. Per the 2010 Highway Capacity Manual, overall average for intersection delay and level of service are shown for intersections with traffic signal or all way stop control, the delay and level of service for the worst individual movement (or movements sharing a single lane) are shown. 3 CSS = Cross Street Stop; TS = Traffic Signal; AWS = All Way Stop 10
12 Table 4 Year 2035 Without Project Intersection Delay and Level of Service Intersection SR 49 Golden Chain Highway (NS) at: Intersection Approach Lanes 1 Peak Hour Traffic Northbound Southbound Eastbound Westbound Delay LOS 2 Control 3 L T R L T R L T R L T R Morning Evening Little Valley Road (EW) #1 CSS C 22.9 C Alta Sierra Drive (EW) #2 TS B 13.7 B Johnson Place (NS) at: Alta Sierra Drive (EW) #3 CSS B 11.6 B Little Valley Road (NS) at: Alta Sierra Drive (EW) #5 AWS B 10.5 B 1 When a right turn lane is designated, the lane can either be striped or unstriped. To function as a right turn lane there must be sufficient width for right turning vehicles to travel outside the through lanes. L = Left; T = Through; R = Right 2 Delay and level of service has been calculated using the following analysis software: HCS+ Version 5.6. Per the 2010 Highway Capacity Manual, overall average for intersection delay and level of service are shown for intersections with traffic signal or all way stop control, the delay and level of service for the worst individual movement (or movements sharing a single lane) are shown. 3 CSS = Cross Street Stop; TS = Traffic Signal; AWS = All Way Stop 11
13 Table 5 Year 2035 With Project Intersection Delay and Level of Service Intersection SR 49 Golden Chain Highway (NS) at: Intersection Approach Lanes 1 Peak Hour Traffic Northbound Southbound Eastbound Westbound Delay LOS 2 Control 3 L T R L T R L T R L T R Morning Evening Little Valley Road (EW) #1 CSS C 22.7 C Alta Sierra Drive (EW) #2 TS B 14.8 B Johnson Place (NS) at: Alta Sierra Drive (EW) #3 CSS B 12.0 B Alta Sierra Drive (NS) at: Project Access (EW) #4 CSS B 11.1 B Little Valley Road (NS) at: Alta Sierra Drive (EW) #5 AWS B 10.8 B 1 When a right turn lane is designated, the lane can either be striped or unstriped. To function as a right turn lane there must be sufficient width for right turning vehicles to travel outside the through lanes. L = Left; T = Through; R = Right; 1 = Improvement 2 Delay and level of service has been calculated using the following analysis software: HCS+ Version 5.6. Per the 2010 Highway Capacity Manual, overall average for intersection delay and level of service are shown for intersections with traffic signal or all way stop control, the delay and level of service for the worst individual movement (or movements sharing a single lane) are shown. 3 CSS = Cross Street Stop; TS = Traffic Signal; AWS = All Way Stop 12
14
15
16
17
18 Figure 5 Sight Distance Analysis 150' 150' Legend = Restricted Use Area = Stopping Sight Distance NTS Kunzman Associates, Inc. Over 35 Years of Excellent Service b/5
19 Figure 6 Maximum Sight Distance 171' 233' Legend = Restricted Use Area = Maximum Sight Distance NTS Kunzman Associates, Inc. Over 35 Years of Excellent Service b/6
20
21
22
23
24 APPENDIX A Glossary of Transportation Terms
25 COMMON ABBREVIATIONS GLOSSARY OF TRANSPORTATION TERMS AC: ADT: Caltrans: DU: ICU: LOS: TSF: V/C: VMT: Acres Average Daily Traffic California Department of Transportation Dwelling Unit Intersection Capacity Utilization Level of Service Thousand Square Feet Volume/Capacity Vehicle Miles Traveled TERMS AVERAGE DAILY TRAFFIC: The total volume during a year divided by the number of days in a year. Usually only weekdays are included. BANDWIDTH: The number of seconds of green time available for through traffic in a signal progression. BOTTLENECK: A constriction along a travelway that limits the amount of traffic that can proceed downstream from its location. CAPACITY: The maximum number of vehicles that can be reasonably expected to pass over a given section of a lane or a roadway in a given time period. CHANNELIZATION: The separation or regulation of conflicting traffic movements into definite paths of travel by the use of pavement markings, raised islands, or other suitable means to facilitate the safe and orderly movements of both vehicles and pedestrians. CLEARANCE INTERVAL: Nearly same as yellow time. If there is an all red interval after the end of a yellow, then that is also added into the clearance interval. CORDON: An imaginary line around an area across which vehicles, persons, or other items are counted (in and out). CYCLE LENGTH: The time period in seconds required for one complete signal cycle. CUL DE SAC STREET: A local street open at one end only, and with special provisions for turning around.
26 DAILY CAPACITY: The daily volume of traffic that will result in a volume during the peak hour equal to the capacity of the roadway. DELAY: The time consumed while traffic is impeded in its movement by some element over which it has no control, usually expressed in seconds per vehicle. DEMAND RESPONSIVE SIGNAL: Same as traffic actuated signal. DENSITY: The number of vehicles occupying in a unit length of the through traffic lanes of a roadway at any given instant. Usually expressed in vehicles per mile. DETECTOR: A device that responds to a physical stimulus and transmits a resulting impulse to the signal controller. DESIGN SPEED: A speed selected for purposes of design. Features of a highway, such as curvature, superelevation, and sight distance (upon which the safe operation of vehicles is dependent) are correlated to design speed. DIRECTIONAL SPLIT: The percent of traffic in the peak direction at any point in time. DIVERSION: The rerouting of peak hour traffic to avoid congestion. FORCED FLOW: Opposite of free flow. FREE FLOW: Volumes are well below capacity. Vehicles can maneuver freely and travel is unimpeded by other traffic. GAP: Time or distance between successive vehicles in a traffic stream, rear bumper to front bumper. HEADWAY: Time or distance spacing between successive vehicles in a traffic stream, front bumper to front bumper. INTERCONNECTED SIGNAL SYSTEM: A number of intersections that are connected to achieve signal progression. LEVEL OF SERVICE: A qualitative measure of a number of factors, which include speed and travel time, traffic interruptions, freedom to maneuver, safety, driving comfort and convenience, and operating costs. LOOP DETECTOR: A vehicle detector consisting of a loop of wire embedded in the roadway, energized by alternating current and producing an output circuit closure when passed over by a vehicle.
27 MINIMUM ACCEPTABLE GAP: Smallest time headway between successive vehicles in a traffic stream into which another vehicle is willing and able to cross or merge. MULTI MODAL: More than one mode; such as automobile, bus transit, rail rapid transit, and bicycle transportation modes. OFFSET: The time interval in seconds between the beginning of green at one intersection and the beginning of green at an adjacent intersection. PLATOON: A closely grouped component of traffic that is composed of several vehicles moving, or standing ready to move, with clear spaces ahead and behind. ORIGIN DESTINATION SURVEY: A survey to determine the point of origin and the point of destination for a given vehicle trip. PASSENGER CAR EQUIVALENTS: One car is one Passenger Car Equivalent. A truck is equal to 2 or 3 Passenger Car Equivalents in that a truck requires longer to start, goes slower, and accelerates slower. Loaded trucks have a higher Passenger Car Equivalent than empty trucks. PEAK HOUR: The 60 consecutive minutes with the highest number of vehicles. PRETIMED SIGNAL: A type of traffic signal that directs traffic to stop and go on a predetermined time schedule without regard to traffic conditions. Also, fixed time signal. PROGRESSION: A term used to describe the progressive movement of traffic through several signalized intersections. SCREEN LINE: An imaginary line or physical feature across which all trips are counted, normally to verify the validity of mathematical traffic models. SIGNAL CYCLE: The time period in seconds required for one complete sequence of signal indications. SIGNAL PHASE: movements. The part of the signal cycle allocated to one or more traffic STARTING DELAY: The delay experienced in initiating the movement of queued traffic from a stop to an average running speed through a signalized intersection. TRAFFIC ACTUATED SIGNAL: A type of traffic signal that directs traffic to stop and go in accordance with the demands of traffic, as registered by the actuation of detectors.
28 TRIP: The movement of a person or vehicle from one location (origin) to another (destination). For example, from home to store to home is two trips, not one. TRIP END: One end of a trip at either the origin or destination; i.e. each trip has two trip ends. A trip end occurs when a person, object, or message is transferred to or from a vehicle. TRIP GENERATION RATE: The quantity of trips produced and/or attracted by a specific land use stated in terms of units such as per dwelling, per acre, and per 1,000 square feet of floor space. TRUCK: A vehicle having dual tires on one or more axles, or having more than two axles. UNBALANCED FLOW: Heavier traffic flow in one direction than the other. On a daily basis, most facilities have balanced flow. During the peak hours, flow is seldom balanced in an urban area. VEHICLE MILES OF TRAVEL: A measure of the amount of usage of a section of highway, obtained by multiplying the average daily traffic by length of facility in miles.
29 APPENDIX B Traffic Count Worksheets
30 Nevada County All Vehicles on Unshifted Nothing on Bank 1 Nothing on Bank 2 ALL TRAFFIC DATA (916) orders@atdtraffic.com File Name : Date : State Route 49-Little Valley Road.ppd 6/19/2014 Unshifted Count = All Vehicles State Route 49 Little Valley Road State Route 49 Turnout Southbound Westbound Northbound Eastbound START TIME LEFT THRU RIGHT UTURNS APP.TOTAL LEFT THRU RIGHT UTURNS APP.TOTAL LEFT THRU RIGHT UTURNS APP.TOTAL LEFT THRU RIGHT UTURNS APP.TOTAL Total Uturn Total 07: : : : Total : : : : Total : : : : Total : : : : Total Grand Total Apprch % 5.8% 94.0% 0.2% 0.0% 12.5% 0.0% 87.5% 0.0% 0.0% 99.6% 0.4% 0.0% 0.0% 0.0% 0.0% 0.0% Total % 2.8% 45.8% 0.1% 0.0% 48.7% 0.2% 0.0% 1.1% 0.0% 1.3% 0.0% 49.8% 0.2% 0.0% 50.0% 0.0% 0.0% 0.0% 0.0% 0.0% 100.0%
31 Nevada County All Vehicles on Unshifted Nothing on Bank 1 Nothing on Bank 2 ALL TRAFFIC DATA (916) orders@atdtraffic.com File Name : Date : State Route 49-Little Valley Road.ppd 6/19/2014 Unshifted Count = All Vehicles AM PEAK State Route 49 Little Valley Road State Route 49 Turnout HOUR Southbound Westbound Northbound Eastbound START TIME LEFT THRU RIGHT UTURNS APP.TOTAL LEFT THRU RIGHT UTURNS APP.TOTAL LEFT THRU RIGHT UTURNS APP.TOTAL LEFT THRU RIGHT UTURNS APP.TOTAL Total Peak Hour Analysis From 07:30 to 08:30 Peak Hour For Entire Intersection Begins at 07:30 07: : : : Total Volume % App Total 2.2% 97.7% 0.1% 0.0% 7.4% 0.0% 92.6% 0.0% 0.0% 99.7% 0.3% 0.0% 0.0% 0.0% 0.0% 0.0% PHF PM PEAK HOUR State Route 49 Southbound Little Valley Road Westbound State Route 49 Northbound Turnout Eastbound START TIME LEFT THRU RIGHT UTURNS APP.TOTAL LEFT THRU RIGHT UTURNS APP.TOTAL LEFT THRU RIGHT UTURNS APP.TOTAL LEFT THRU RIGHT UTURNS APP.TOTAL Total Peak Hour Analysis From 16:45 to 17:45 Peak Hour For Entire Intersection Begins at 16:45 16: : : : Total Volume % App Total 8.1% 91.9% 0.0% 0.0% 15.8% 0.0% 84.2% 0.0% 0.0% 99.6% 0.4% 0.0% 0.0% 0.0% 0.0% 0.0% PHF
32 Nevada County All Vehicles on Unshifted Nothing on Bank 1 Nothing on Bank 2 ALL TRAFFIC DATA (916) orders@atdtraffic.com File Name : Date : State Route 49-Alta Sierra Drive.ppd 6/19/2014 Unshifted Count = All Vehicles State Route 49 Alta Sierra Drive State Route 49 Southbound Westbound Northbound Eastbound START TIME LEFT THRU RIGHT UTURNS APP.TOTAL LEFT THRU RIGHT UTURNS APP.TOTAL LEFT THRU RIGHT UTURNS APP.TOTAL LEFT THRU RIGHT UTURNS APP.TOTAL Total Uturn Total 07: : : : Total : : : : Total : : : : Total : : : : Total Grand Total Apprch % 8.9% 91.1% 0.0% 0.0% 41.1% 0.0% 58.9% 0.0% 0.0% 90.5% 9.5% 0.0% 0.0% 0.0% 0.0% 0.0% Total % 3.9% 39.5% 0.0% 0.0% 43.4% 5.2% 0.0% 7.4% 0.0% 12.5% 0.0% 39.9% 4.2% 0.0% 44.1% 0.0% 0.0% 0.0% 0.0% 0.0% 100.0%
33 Nevada County All Vehicles on Unshifted Nothing on Bank 1 Nothing on Bank 2 ALL TRAFFIC DATA (916) orders@atdtraffic.com File Name : Date : State Route 49-Alta Sierra Drive.ppd 6/19/2014 Unshifted Count = All Vehicles AM PEAK State Route 49 Alta Sierra Drive State Route 49 HOUR Southbound Westbound Northbound Eastbound START TIME LEFT THRU RIGHT UTURNS APP.TOTAL LEFT THRU RIGHT UTURNS APP.TOTAL LEFT THRU RIGHT UTURNS APP.TOTAL LEFT THRU RIGHT UTURNS APP.TOTAL Total Peak Hour Analysis From 07:30 to 08:30 Peak Hour For Entire Intersection Begins at 07:30 07: : : : Total Volume % App Total 4.5% 95.5% 0.0% 0.0% 43.1% 0.0% 56.9% 0.0% 0.0% 95.1% 4.9% 0.0% 0.0% 0.0% 0.0% 0.0% PHF PM PEAK HOUR State Route 49 Southbound Alta Sierra Drive Westbound State Route 49 Northbound Eastbound START TIME LEFT THRU RIGHT UTURNS APP.TOTAL LEFT THRU RIGHT UTURNS APP.TOTAL LEFT THRU RIGHT UTURNS APP.TOTAL LEFT THRU RIGHT UTURNS APP.TOTAL Total Peak Hour Analysis From 16:45 to 17:45 Peak Hour For Entire Intersection Begins at 16:45 16: : : : Total Volume % App Total 11.6% 88.4% 0.0% 0.0% 38.6% 0.0% 61.4% 0.0% 0.0% 84.9% 15.1% 0.0% 0.0% 0.0% 0.0% 0.0% PHF
34 Nevada County All Vehicles on Unshifted Nothing on Bank 1 Nothing on Bank 2 ALL TRAFFIC DATA (916) orders@atdtraffic.com File Name : Date : Johnson Place-Alta Sierra Drive.ppd 6/19/2014 Unshifted Count = All Vehicles Johnson Place Alta Sierra Drive Alta Sierra Drive Southbound Westbound Northbound Eastbound START TIME LEFT THRU RIGHT UTURNS APP.TOTAL LEFT THRU RIGHT UTURNS APP.TOTAL LEFT THRU RIGHT UTURNS APP.TOTAL LEFT THRU RIGHT UTURNS APP.TOTAL Total Uturn Total 07: : : : Total : : : : Total : : : : Total : : : : Total Grand Total Apprch % 49.2% 0.0% 50.8% 0.0% 0.0% 96.3% 3.7% 0.0% 0.0% 0.0% 0.0% 0.0% 7.7% 92.3% 0.0% 0.0% Total % 2.0% 0.0% 2.1% 0.0% 4.1% 0.0% 56.8% 2.2% 0.0% 59.0% 0.0% 0.0% 0.0% 0.0% 0.0% 2.8% 34.1% 0.0% 0.0% 36.9% 100.0%
35 Nevada County All Vehicles on Unshifted Nothing on Bank 1 Nothing on Bank 2 ALL TRAFFIC DATA (916) orders@atdtraffic.com File Name : Date : Johnson Place-Alta Sierra Drive.ppd 6/19/2014 Unshifted Count = All Vehicles AM PEAK Johnson Place Alta Sierra Drive Alta Sierra Drive HOUR Southbound Westbound Northbound Eastbound START TIME LEFT THRU RIGHT UTURNS APP.TOTAL LEFT THRU RIGHT UTURNS APP.TOTAL LEFT THRU RIGHT UTURNS APP.TOTAL LEFT THRU RIGHT UTURNS APP.TOTAL Total Peak Hour Analysis From 07:30 to 08:30 Peak Hour For Entire Intersection Begins at 07:30 07: : : : Total Volume % App Total 50.0% 0.0% 50.0% 0.0% 0.0% 97.5% 2.5% 0.0% 0.0% 0.0% 0.0% 0.0% 10.8% 89.2% 0.0% 0.0% PHF PM PEAK HOUR Johnson Place Southbound Alta Sierra Drive Westbound Northbound Alta Sierra Drive Eastbound START TIME LEFT THRU RIGHT UTURNS APP.TOTAL LEFT THRU RIGHT UTURNS APP.TOTAL LEFT THRU RIGHT UTURNS APP.TOTAL LEFT THRU RIGHT UTURNS APP.TOTAL Total Peak Hour Analysis From 17:00 to 18:00 Peak Hour For Entire Intersection Begins at 17:00 17: : : : Total Volume % App Total 50.0% 0.0% 50.0% 0.0% 0.0% 93.2% 6.8% 0.0% 0.0% 0.0% 0.0% 0.0% 6.0% 94.0% 0.0% 0.0% PHF
36 Nevada County All Vehicles on Unshifted Nothing on Bank 1 Nothing on Bank 2 ALL TRAFFIC DATA (916) orders@atdtraffic.com File Name : Date : Little Valley Road-Alta Sierra Drive.ppd 6/19/2014 Unshifted Count = All Vehicles Little Valley Road Alta Sierra Drive Little Valley Road Alta Sierra Drive Southbound Westbound Northbound Eastbound START TIME LEFT THRU RIGHT UTURNS APP.TOTAL LEFT THRU RIGHT UTURNS APP.TOTAL LEFT THRU RIGHT UTURNS APP.TOTAL LEFT THRU RIGHT UTURNS APP.TOTAL Total Uturn Total 07: : : : Total : : : : Total : : : : Total : : : : Total Grand Total Apprch % 83.8% 2.2% 14.0% 0.0% 0.9% 92.0% 7.2% 0.0% 61.9% 4.8% 33.3% 0.0% 4.0% 94.5% 1.5% 0.0% Total % 11.3% 0.3% 1.9% 0.0% 13.5% 0.5% 49.9% 3.9% 0.0% 54.2% 0.8% 0.1% 0.4% 0.0% 1.2% 1.2% 29.3% 0.5% 0.0% 31.0% 100.0%
37 Nevada County All Vehicles on Unshifted Nothing on Bank 1 Nothing on Bank 2 ALL TRAFFIC DATA (916) orders@atdtraffic.com File Name : Date : Little Valley Road-Alta Sierra Drive.ppd 6/19/2014 Unshifted Count = All Vehicles AM PEAK Little Valley Road Alta Sierra Drive Little Valley Road Alta Sierra Drive HOUR Southbound Westbound Northbound Eastbound START TIME LEFT THRU RIGHT UTURNS APP.TOTAL LEFT THRU RIGHT UTURNS APP.TOTAL LEFT THRU RIGHT UTURNS APP.TOTAL LEFT THRU RIGHT UTURNS APP.TOTAL Total Peak Hour Analysis From 07:30 to 08:30 Peak Hour For Entire Intersection Begins at 07:30 07: : : : Total Volume % App Total 43.5% 8.7% 47.8% 0.0% 0.3% 95.6% 4.1% 0.0% 50.0% 0.0% 50.0% 0.0% 4.1% 93.9% 2.0% 0.0% PHF PM PEAK HOUR Little Valley Road Southbound Alta Sierra Drive Westbound Little Valley Road Northbound Alta Sierra Drive Eastbound START TIME LEFT THRU RIGHT UTURNS APP.TOTAL LEFT THRU RIGHT UTURNS APP.TOTAL LEFT THRU RIGHT UTURNS APP.TOTAL LEFT THRU RIGHT UTURNS APP.TOTAL Total Peak Hour Analysis From 16:45 to 17:45 Peak Hour For Entire Intersection Begins at 16:45 16: : : : Total Volume % App Total 92.1% 2.0% 5.9% 0.0% 1.2% 89.4% 9.4% 0.0% 57.1% 14.3% 28.6% 0.0% 2.9% 95.9% 1.2% 0.0% PHF
38 APPENDIX C Explanation and Calculation of Intersection Delay
39 EXPLANATION AND CALCULATION OF INTERSECTION LEVEL OF SERVICE USING DELAY METHODOLOGY The levels of service at the unsignalized and signalized intersections are calculated using the delay methodology in the Highway Capacity Manual. This methodology views an intersection as consisting of several lane groups. A lane group is a set of lanes serving a movement. If there are two northbound left turn lanes, then the lane group serving the northbound left turn movement has two lanes. Similarly, there may be three lanes in the lane group serving the northbound through movement, one lane in the lane group serving the northbound right turn movement, and so forth. It is also possible for one lane to serve two lane groups. A shared lane might result in there being 1.5 lanes in the northbound left turn lane group and 2.5 lanes in the northbound through lane group. For each lane group, there is a capacity. That capacity is calculated by multiplying the number of lanes in the lane group times a theoretical maximum lane capacity per lane time s 12 adjustment factors. Each of the 12 adjustment factors has a value of approximately A value less than 1.00 is generally assigned when a less than desirable condition occurs. The 12 adjustment factors are as follows: 1. Peak hour factor (to account for peaking within the peak hour) 2. Lane utilization factor (to account for not all lanes loading equally) 3. Lane width 4. Percent of heavy trucks 5. Approach grade 6. Parking 7. Bus stops at intersections 8. Area type (CBD or other) 9. Right turns 10. Left turns
40 11. Pedestrian activity 12. Signal progression The maximum theoretical lane capacity and the 12 adjustment factors for it are all unknowns for which approximate estimates have been recommended in the Highway Capacity Manual. For the most part, the recommended values are not based on statistical analysis but rather on educated estimates. However, it is possible to use the delay method and get reasonable results as will be discussed below. Once the lane group volume is known and the lane group capacity is known, a volume to capacity ratio can be calculated for the lane group. With a volume to capacity ratio calculated, average delay per vehicle in a lane group can be estimated. The average delay per vehicle in a lane group is calculated using a complex formula provided by the Highway Capacity Manual, which can be simplified and described as follows: Delay per vehicle in a lane group is a function of the following: 1. Cycle length 2. Amount of red time faced by a lane group 3. Amount of yellow time for that lane group 4. The volume to capacity ratio of the lane group The average delay per vehicle for each lane group is calculated, and eventually an overall average delay for all vehicles entering the intersection is calculated. This average delay per vehicle is then used to judge Level of Service. The Level of Services are defined in the table that follows this discussion. Experience has shown that when a maximum lane capacity of 1,900 vehicles per hour is used (as recommended in the Highway Capacity Manual), little or no yellow time penalty is used, and none of the 12 penalty factors are applied, calculated delay is realistic. The delay calculation for instance assumes that yellow time is totally unused. Yet experience shows that most of the yellow time is used. An idiosyncrasy of the delay methodology is that it is possible to add traffic to an intersection and reduce the average total delay per vehicle. If the average total delay is 30 seconds per vehicle for all vehicles traveling through an intersection, and traffic is
41 added to a movement that has an average total delay of 15 seconds per vehicle, then the overall average total delay is reduced. The delay calculation for a lane group is based on a concept that the delay is a function of the amount of unused capacity available. As the volume approaches capacity and there is no more unused capacity available, then the delay rapidly increases. Delay is not proportional to volume, but rather increases rapidly as the unused capacity approaches zero. Because delay is not linearly related to volumes, the delay does not reflect how close an intersection is to overloading. If an intersection is operating at Level of Service C and has an average total delay of 18 seconds per vehicle, you know very little as to what percent the traffic can increase before Level of Service E is reached.
42 LEVEL OF SERVICE DESCRIPTION 1 Level Of Service A B C D E F Description Level of Service A occurs when progression is extremely favorable and most vehicles arrive during the green phase. Most vehicles do not stop at all. Short cycle lengths may also contribute to low delay. Level of Service B generally occurs with good progression and/or short cycle lengths. More vehicles stop than for Level of Service A, causing higher levels of average total delay. Level of Service C generally results when there is fair progression and/or longer cycle lengths. Individual cycle failures may begin to appear in this level. The number of vehicles stopping is significant at this level, although many still pass through the intersection without stopping. Level of Service D generally results in noticeable congestion. Longer delays may result from some combination of unfavorable progression, long cycle lengths, or high volume to capacity ratios. Many vehicles stop, and the proportion of vehicles not stopping declines. Individual cycle failures are noticeable. Level of Service E is considered to be the limit of acceptable delay. These high delay values generally indicate poor progression, long cycle lengths, and high volume to capacity ratios. Individual cycle failures are frequent occurrences. Level of Service F is considered to be unacceptable to most drivers. This condition often occurs with oversaturation, i.e., when arrival flow rates exceed the capacity of the intersection. It may also occur at high volume to capacity ratios below 1.00 with many individual cycle failures. Poor progression and long cycle lengths may also be major contributing causes to such delay levels. Average Total Delay Per Vehicle (Seconds) Signalized Unsignalized 0 to to to to to to to to to to and up and up 1 Source: Highway Capacity Manual Special Report 209, Transportation Research Board, National Research Council, Washington, D.C., 2000.
43 Existing
44
45
46
47
48
49
50
51
52 Existing Plus Project
53
54
55
56
57
58
59
60
61
62
63 Year 2035 Without Project
64
65
66
67

68
69
70
71
72 Year 2035 With Project
73
74
75
76
77
78
79
80
81

82
83 APPENDIX D Sight Distance Standards
84
 973-8383 www.")
85 1111 Town & Country Road, Suite 34 Orange, California (714)
TRAFFIC IMPACT STUDY. Platte Canyon Villas Arapahoe County, Colorado (Arapahoe County Case Number: Z16-001) For
 For") TRAFFIC IMPACT STUDY For Platte Canyon Villas Arapahoe County, Colorado (Arapahoe County Case Number: Z16-001) February 2015 Revised: August 2015 April 2016 July 2016 September 2016 Prepared for: KB Home
TRAFFIC IMPACT STUDY For Platte Canyon Villas Arapahoe County, Colorado (Arapahoe County Case Number: Z16-001) February 2015 Revised: August 2015 April 2016 July 2016 September 2016 Prepared for: KB Home
JEP John E. Jack Pflum, P.E. Consulting Engineering 7541 Hosbrook Road, Cincinnati, OH Telephone:
 JEP John E. Jack Pflum, P.E. Consulting Engineering 7541 Hosbrook Road, Cincinnati, OH 45243 Email: jackpflum1@gmail.com Telephone: 513.919.7814 MEMORANDUM REPORT Traffic Impact Analysis Proposed Soccer
Traffic Impact Study
 Traffic Impact Study Statham DRI One University Parkway Prepared for: Barrow County Prepared by: October 2012 Table of Contents Executive Summary i Section 1. Introduction 1 Project Description 1 Methodology
WEBER ROAD RESIDENTIAL DEVELOPMENT Single Family Residential Project
 WEBER ROAD RESIDENTIAL DEVELOPMENT Single Family Residential Project WEBER ROAD RESIDENTIAL DEVELOPMENT TRAFFIC IMPACT STUDY TABLE OF CONTENTS 1.0 Executive Summary Page 2.0 Introduction 2.1 DEVELOPMENT
SUBJECT: SUMMARY OF FINDINGS. October 29, Mr. Carter Redish Carter Group Architects, Inc S. El Camino Real, Suite F San Clemente, CA 92672
 October 29, 2018 Mr. Carter Redish Carter Group Architects, Inc. 1810 S. El Camino Real, Suite F San Clemente, CA 92672 SUBJECT: CANYON STEEL FOCUSED TRAFFIC IMPACT ANALYSIS Dear Mr. Carter Redish: Urban
Market Street PDP. Nassau County, Florida. Transportation Impact Analysis. VHB/Vanasse Hangen Brustlin, Inc. Nassau County Growth Management
 Transportation Impact Analysis Market Street PDP Nassau County, Florida Submitted to Nassau County Growth Management Prepared for TerraPointe Services, Inc. Prepared by VHB/Vanasse Hangen Brustlin, Inc.
PLAZA MEXICO RESIDENCES
 PLAZA MEXICO RESIDENCES TRAFFIC STUDY PREPARED FOR: 3000 E. IMPERIAL, LLC. 6940 Beach Boulevard, D-501 Buena Park, California 90621 PREPARED BY: OCTOBER 5, 2017 translutions the transportatio n solutions
Appendix I: Traffic Study
 City of Fontana Sierra Lakes Commerce Center Draft EIR Appendix I: Traffic Study FirstCarbon Solutions H:\Client (PN JN)\0144\01440050\EIR\1 ADEIR\01440050 Sec99 99 Appendix Dividers.doc THIS PAGE INTENTIONALLY
April 10, Mr. Curt Van De Walle, City Manager City of Castle Hills 209 Lemonwood Drive Castle Hills, Texas 78213
 Mr. Curt Van De Walle, City Manager City of Castle Hills 209 Lemonwood Drive Castle Hills, Texas 78213 Subject: Revised Castle Hills BASIS Charter School Traffic Impact Analysis Review City of Castle Hills,
MEMORANDUM. The study area of the analysis was discussed with City staff and includes the following intersections:
 MEMORANDUM DATE: JULY 6, 2012 TO: FROM: RE: CC: MELANIE KNIGHT BRAD BYVELDS/ JENNIFER LUONG 1050 SOMERSET STREET PRELIMINARY TRAFFIC ANALYSIS OUR FILE NO. 111152 NEIL MALHOTRA The purpose of this memo
The Highline Development Traffic Impact Study
 The Highline Development Traffic Impact Study Columbia Falls, Montana Prepared For: TD&H Engineering 450 Corporate Drive, Suite 101 Kalispell, MT 59901 June, 2018 130 South Howie Street Helena, Montana
NATHAN HALE HIGH SCHOOL PARKING AND TRAFFIC ANALYSIS. Table of Contents
 Parking and Traffic Analysis Seattle, WA Prepared for: URS Corporation 1501 4th Avenue, Suite 1400 Seattle, WA 98101-1616 Prepared by: Mirai Transportation Planning & Engineering 11410 NE 122nd Way, Suite
Subject: Desert Palisades Specific Plan - Tram Way Access Sight Distance
 Endo Engineering Traffic Engineering Air Quality Studies Noise Assessments July 13, 2015 Mr. Ed Freeman Pinnacle View, LLC P.O. Box 1754 Lake Oswego, OR 97035-0579 Subject: Desert Palisades Specific Plan
PRADO BASIN SEDIMENT REMOVAL PROJECT FOCUSED TRAFFIC ANALYSIS. May 31, 2016
 PRADO BASIN SEDIMENT REMOVAL PROJECT FOCUSED TRAFFIC ANALYSIS May 31, 2016 Kunzman Associates, Inc. PRADO BASIN SEDIMENT REMOVAL PROJECT FOCUSED TRAFFIC ANALYSIS May 31, 2016 Prepared by: Perrie Ilercil,
CVS Derwood. Local Area Transportation Review
 CVS Derwood Montgomery County, Maryland May 27, 2016 Local Area Transportation Review Prepared for: JC Bar Properties, Inc. Steve Fleming, PE 415 Fallowfield Road, Suite 301 Camp Hill, Pennsylvania 17011
Focused Traffic Analysis for the One Lincoln Park Project
 September 15, 2015 Mr. Bill Johnson Coldwell Banker 511 Sir Francis Drake Boulevard Greenbrae, CA 94904 Focused Traffic Analysis for the One Lincoln Park Project Dear Mr. Johnson; As requested, W-Trans
FINAL Traffic Report for the Proposed Golden Valley Road and Newhall Ranch Road Projects in the City of Santa Clarita, California May 5, 2005
 FINAL Traffic Report for the Proposed Golden Valley Road and Newhall Ranch Road Projects in the City of Santa Clarita, California May 5, 2005 Prepared For: EDAW, Inc. 1420 Kettner Boulevard, Suite 620
CHAPTER 3. CAPACITY OF SIGNALIZED INTERSECTIONS
 CHAPTER 3. CAPACITY OF SIGNALIZED INTERSECTIONS 1. Overview In this chapter we explore the models on which the HCM capacity analysis method for signalized intersections are based. While the method has
Traffic Impact Analysis. for the STARBUCKS STORE. Located at 9900 BALBOA BOULEVARD. Submitted to CITY OF LOS ANGELES. January 2017.
 Traffic Impact Analysis for the STARBUCKS STORE Located at 9900 BALBOA BOULEVARD Submitted to CITY OF LOS ANGELES January 2017 Submitted By January 5, 2017 Ken A. Aitchison, P.E. Transportation Engineering
Appendix C Traffic Study
 Final Environmental Impact Statement Appendix C Traffic Study Schofield Generating Station Project, Hawaii October 2015 C-1 Final Environmental Impact Statement This page intentionally left blank. Schofield
TRAFFIC IMPACT STUDY MANUFACTURING COMPANY
 TRAFFIC IMPACT STUDY For MANUFACTURING COMPANY Prepared For: Airway Heights, WA Prepared By: SUNBURST ENGINEERING, P. S. 4310 S. Ball Dr. Veradale, WA 99037 April, 2013 TRAFFIC IMP ACT STUDY Manufacturing
Signalized Intersections
 Signalized Intersections Kelly Pitera October 23, 2009 Topics to be Covered Introduction/Definitions D/D/1 Queueing Phasing and Timing Plan Level of Service (LOS) Signal Optimization Conflicting Operational
MADISON, WI STONE HOUSE DEVELOPMENT 1000 E. WASHINGTON AVENUE REDEVELOPMENT TRANSPORTATION STUDY DECEMBER 14, 2015
 MADISON, WI STONE HOUSE DEVELOPMENT 1000 E. WASHINGTON AVENUE REDEVELOPMENT TRANSPORTATION STUDY DECEMBER 14, 2015 TABLE OF CONTENTS... 3 Proposed Development... 3 Methodology... 3 Phase 1 Development...
MnDOT Method for Calculating Measures of Effectiveness (MOE) From CORSIM Model Output
 From CORSIM Model Output") MnDOT Method for Calculating Measures of Effectiveness (MOE) From CORSIM Model Output Rev. April 29, 2005 MnDOT Method for Calculating Measures of Effectiveness (MOE) From CORSIM Model Output Table of
MnDOT Method for Calculating Measures of Effectiveness (MOE) From CORSIM Model Output Rev. April 29, 2005 MnDOT Method for Calculating Measures of Effectiveness (MOE) From CORSIM Model Output Table of
Traffic flow theory involves the development of mathematical relationships among
 CHAPTER 6 Fundamental Principles of Traffic Flow Traffic flow theory involves the development of mathematical relationships among the primary elements of a traffic stream: flow, density, and speed. These
HALFF 16196? TRAFFIC MANAGEMENT PLAN. Richardson ISD Aikin Elementary School Dallas, Texas North Bowser Road Richardson, Texas 75081
 30280 16196? TRAFFIC MANAGEMENT PLAN Exhibit 572B Aikin Elementary School Planned Development District No. 572 Approved City Plan Commission October20, 2016 July 12, 2016 Prepared for HALFF AVO 31586 PHO1
January 12, Mr. Ryan Granger TMGB Wilson, LLC 2221 Health Drive SW, Suite 2200 Wyoming, Michigan 49519
 January 12, 2018 Mr. Ryan Granger TMGB Wilson, LLC 2221 Health Drive SW, Suite 2200 Wyoming, Michigan 49519 Re: Proposed Reserve at Rivertown Mixed-Use Development Updated Trip Generation and Site Driveway
VHD Daily Totals. Population 14.5% change. VMT Daily Totals Suffolk 24-hour VMT. 49.3% change. 14.4% change VMT
 6.9 Suffolk 6-54 VMT Population and Travel Characteristics Population 14.5% change 2014 1,529,202 VHD Daily Totals 2014 251,060 49.3% change 2040 1,788,175 2040 374,850 VMT Daily Totals 2014 39,731,990
Appendixx C Travel Demand Model Development and Forecasting Lubbock Outer Route Study June 2014
 Appendix C Travel Demand Model Development and Forecasting Lubbock Outer Route Study June 2014 CONTENTS List of Figures-... 3 List of Tables... 4 Introduction... 1 Application of the Lubbock Travel Demand
ALTA VISTA COMMERCIAL/ RESIDENTIAL PROJECT
 ALTA VISTA COMMERCIAL/ RESIDENTIAL PROJECT TRAFFIC IMPACT ANALYSIS Prepared For: Paul Conzelman SC Development 2151 Michelson Drive, Suite 140 Irvine, CA 92612 Prepared By: 2030 Main Street, Suite 1200
Per your request and authorization, we have prepared this traffic evaluation for the above referenced project.
 Memorandum To: From: Re: Marc Stout, P.E. City Engineer, City of Roseville Chris Gregerson, P.E., T.E. Matt Weir, P.E., T.E., PTOE Douglas Boulevard Coffee Kiosk Traffic Evaluation Roseville, California
California Urban Infill Trip Generation Study. Jim Daisa, P.E.
 California Urban Infill Trip Generation Study Jim Daisa, P.E. What We Did in the Study Develop trip generation rates for land uses in urban areas of California Establish a California urban land use trip
FY 2010 Continuing i Planning Program Product Report. Local Transportation and Traffic Data. Wood-Washington-Wirt Interstate Planning Commission
 FY 2010 Continuing i Planning Program Product Report Local Transportation and Traffic Data Travel Time and Delay Data for Belpre and Marietta, Ohio Wood-Washington-Wirt Interstate Planning Commission CONTINUING
TRANSPORTATION IMPACT STUDY WHEELER STREET CLOSURE
 TRANSPORTATION IMPACT STUDY WHEELER STREET CLOSURE Village of Greene, Chenango County, New York Prepared for: VILLAGE OF GREENE 49 Genesee Street Greene, NY 13778 Prepared by: LARSON DESIGN GROUP 1000
South Western Region Travel Time Monitoring Program Congestion Management Process Spring 2008 Report
 South Western Region Travel Monitoring Program Congestion Management Process Spring 2008 Report Prepared by: South Western Regional Planning Agency 888 Washington Boulevard Stamford, CT 06901 Telephone:
APPENDIX IV MODELLING
 APPENDIX IV MODELLING Kingston Transportation Master Plan Final Report, July 2004 Appendix IV: Modelling i TABLE OF CONTENTS Page 1.0 INTRODUCTION... 1 2.0 OBJECTIVE... 1 3.0 URBAN TRANSPORTATION MODELLING
KAISER SOUTH NORTHERN VIRGINIA HUB TRAFFIC IMPACT STUDY PRINCE WILLIAM COUNTY, VIRGINIA TABLE OF CONTENTS. Section 2 BACKGROUND INFORMATION 12
 KAISER SOUTH NORTHERN VIRGINIA HUB TRAFFIC IMPACT STUDY PRINCE WILLIAM COUNTY, VIRGINIA TABLE OF CONTENTS Page EXECUTIVE SUMMARY 1 Purpose of Report and Study Objectives... 1 Site Location and Study Area...
COUNCIL POLICY MANUAL
 COUNCIL POLICY MANUAL SECTION: PUBLIC WORKS SUBJECT: SNOW & ICE CONTROL POLICY 2012/2013 GOAL: Pages: 1 of 10 Approval Date: Dec. 3, 2012 Res. # 1001/2012 To annually identify the winter maintenance costs
6711 LEE HIGHWAY TRAFFIC IMPACT STUDY ARLINGTON, VIRGINIA
 6711 TRAFFIC IMPACT STUDY ARLINGTON, VIRGINIA Prepared for: NVR, Inc. Prepared by: Wells + Associates, Inc. Michael J. Workosky, PTP, TOPS, TSOS John J. Andrus William L. Zeid, PE 703.917.6620 May 4, 2017
CHAPTER 2. CAPACITY OF TWO-WAY STOP-CONTROLLED INTERSECTIONS
 CHAPTER 2. CAPACITY OF TWO-WAY STOP-CONTROLLED INTERSECTIONS 1. Overview In this chapter we will explore the models on which the HCM capacity analysis method for two-way stop-controlled (TWSC) intersections
Metro Emergency Security Operations Center (ESOC) 410 Center Street City of Los Angeles
 410 Center Street City of Los Angeles") Metro Emergency Security Operations Center (ESOC) 410 Center Street City of Los Angeles Traffic Study August 31, 2015 AECOM 515 South Flower Street, 4 th Floor Los Angeles, CA 90071 Job Number: 60323255
Metro Emergency Security Operations Center (ESOC) 410 Center Street City of Los Angeles Traffic Study August 31, 2015 AECOM 515 South Flower Street, 4 th Floor Los Angeles, CA 90071 Job Number: 60323255
MEMORANDUM. Trip Generation Analysis
 MEMORANDUM To: RMC Architects From: Matthew Palmer, PE Subject: Trip Generation, Parking Analysis & Level of Service Project: Port of Everett, GTC #13-053 Date: August 25, 2014 The trip generation and
The Sunland Park flyover ramp is set to close the week of March 19 until early summer
 March 2, 2018 The Sunland Park flyover ramp is set to close the week of March 19 until early summer GO 10 is targeting the week of March 19 to close the Sunland Park Drive flyover entrance ramp to I 10
CONTINUING PLANNING PROGRAM LOCAL TRANSPORTATION AND TRAFFIC DATA PRODUCT REPORT [OH Corridors]
![CONTINUING PLANNING PROGRAM LOCAL TRANSPORTATION AND TRAFFIC DATA PRODUCT REPORT [OH Corridors]](/thumbs/94/120123757.jpg "CONTINUING PLANNING PROGRAM LOCAL TRANSPORTATION AND TRAFFIC DATA PRODUCT REPORT [OH Corridors]") CONTINUING PLANNING PROGRAM LOCAL TRANSPORTATION AND TRAFFIC DATA PRODUCT REPORT [OH Corridors] Travel Time and Delay Analysis for Belpre (OH) and Marietta (OH) Fiscal Year 2009 Report WOOD WASHINGTON
CONTINUING PLANNING PROGRAM LOCAL TRANSPORTATION AND TRAFFIC DATA PRODUCT REPORT [OH Corridors] Travel Time and Delay Analysis for Belpre (OH) and Marietta (OH) Fiscal Year 2009 Report WOOD WASHINGTON
Appendix C Final Methods and Assumptions for Forecasting Traffic Volumes
 Fairview Ave. and Main St. Improvements and Local Streets Plan Appendices Ada County Highway District Appendix C Final Methods and Assumptions for Forecasting Traffic Volumes January 3, 207 Appendices
Expanding the GSATS Model Area into
 Appendix A Expanding the GSATS Model Area into North Carolina Jluy, 2011 Table of Contents LONG-RANGE TRANSPORTATION PLAN UPDATE 1. Introduction... 1 1.1 Background... 1 1.2 Existing Northern Extent of
Travel Demand Management Plan
 Travel Demand Management Plan Tryg s & Apartment Building 8 West Lake Street Minneapolis, MN AUTHORIZED PROPERTY REPRESENTATIVE: By Dated: Mr. Johnny Carlson Trammell Crow Chicago Development, Inc. 5 South
Table of Contents Introduction... 4 Study Area... 5
 Table of Contents Introduction... 4 Study Area... 5 Streets and s... 5 Traffic Volumes... 8 Recent and Anticipated Development... 10 Crash Analysis... 10 Projected Traffic Volumes... 11 Trip Generation...
TRAFFIC STUDY FOR THE GAFFEY POOL PROJECT LOS ANGELES, CALIFORNIA CITY OF LOS ANGELES, BUREAU OF ENGINEERING OCTOBER 2013 PREPARED FOR PREPARED BY
 TRAFFIC STUDY FOR THE GAFFEY POOL PROJECT LOS ANGELES, CALIFORNIA OCTOBER 2013 PREPARED FOR CITY OF LOS ANGELES, BUREAU OF ENGINEERING PREPARED BY DRAFT TRAFFIC STUDY FOR THE GAFFEY POOL PROJECT October
III. FORECASTED GROWTH
 III. FORECASTED GROWTH In order to properly identify potential improvement projects that will be required for the transportation system in Milliken, it is important to first understand the nature and volume
Parking Regulations Dundas Street West, from Bathurst Street to Dovercourt Road
 STAFF REPORT ACTION REQUIRED Parking Regulations Dundas Street West, from Bathurst Street to Dovercourt Road Date: October 28, 2008 To: From: Toronto and East York Community Council Director, Transportation
LIC SR INTERCHANGE OPERATIONS STUDY
 LIC SR 16 18.20 - INTERCHANGE OPERATIONS STUDY Project Summary Location SR 16 & W. Church St. Interchange Newark, Ohio Licking County PID 99478 Study Sponsor ODOT District 5 Proposed Work Add Left Turn
PW 001 SNOW REMOVAL AND SANDING FOR ROADWAYS AND SIDEWALKS October 6, 2014 (#223-14) Original October 19, 2015; October 15, 2018 Public Works
 Original October 19, 2015; October 15, 2018 Public Works") Policy Statement: The Village of Kitscoty will provide snow and ice control on municipal streets and sidewalks according to determined priorities. Purpose: To provide direction and information to employees
Policy Statement: The Village of Kitscoty will provide snow and ice control on municipal streets and sidewalks according to determined priorities. Purpose: To provide direction and information to employees
Approved Corrections and Changes for the Highway Capacity Manual 2000
 Approved Corrections and Changes for the Highway Capacity Manual 2000 Updated 7/8/2005 Previous update 2/27/2004 TRB Committee AHB40, Highway Capacity and Quality of Service Unless stated otherwise, corrections
Snow and Ice Control POLICY NO. P-01/2015. CITY OF AIRDRIE Snow and Ice Control Policy
 Page 1 CITY OF AIRDRIE Snow and Ice Control Effective Date: Approved By: Approved On: March 17, 2015 City Council March 16, 2015 Revision Date: Resolution #: ------ PURPOSE: The City of Airdrie is responsible
TRAFFIC IMPACT STUDY
 TRAFFIC IMPACT STUDY TERRE HAUTE CONVENTION CENTER WABASH AVENUE & 9 TH STREET TERRE HAUTE, INDIANA PREPARED FOR 8365 Keystone Crossing, Suite 201 Indianapolis, IN 46240 Phone: (317) 202-0864 Fax: (317)
FARM 1065 PORTION 1, ATLANTIS TRAFFIC IMPACT ASSESSMENT
 FARM 1065 PORTION 1, ATLANTIS TRAFFIC IMPACT ASSESSMENT February 2018 FIRST ISSUE Prepared by: JG AFRIKA (PTY) LTD Branch: Cape Town PO Box 38561 Postal code: 7430 Telephone: 021 530 1800 Email: wink@
INTRODUCTION PURPOSE DATA COLLECTION
 DETERMINATION OF VEHICLE OCCUPANCY ON THE KATY AND NORTHWEST FREEWAY MAIN LANES AND FRONTAGE ROADS Mark Ojah and Mark Burris Houston Value Pricing Project, March 2004 INTRODUCTION In the late 1990s, an
Organized Chain-Up and VSL
 Organized Chain-Up and VSL Jim Mahugh, PE WSDOT SC Region Traffic Engineer North/West Passage VSL Peer Exchange January 28, 2015 Snoqualmie Pass 2 Limits of VSL EB: MP 48.12 to 66.56 WB: MP 46.69 to 66.90
1.0 INTRODUCTION AND SUMMARY...
 TABLE OF CONTENTS 1.0 INTRODUCTION AND SUMMARY... 1 1.1 Purpose and Study Objective... 1 1.2 Executive Summary... 1 2.0 ROADWAY CONDITIONS... 5 2.1 Granville Parkway (South Intersection)... 8 2.2 Tuscany
Encapsulating Urban Traffic Rhythms into Road Networks
 Encapsulating Urban Traffic Rhythms into Road Networks Junjie Wang +, Dong Wei +, Kun He, Hang Gong, Pu Wang * School of Traffic and Transportation Engineering, Central South University, Changsha, Hunan,
Town of Oconomowoc Snow & Ice Control Policy
 Town of Oconomowoc Snow & Ice Control Policy Introduction The purpose of this policy is to provide a detailed overview of the Town s snow & ice control operations including its goals and objectives. All
Final City of Colusa STREETS & ROADWAYS MASTER PLAN. October J Street Suite 390 Sacramento, CA 95814
 Final City of Colusa STREETS & ROADWAYS MASTER PLAN October 2009 660 J Street Suite 390 Sacramento, CA 95814 TABLE OF CONTENTS I. INTRODUCTION... 1 Report Organization...1 II. ANALYSIS METHODOLOGY... 2
Chapter 5 Traffic Flow Characteristics
 Chapter 5 Traffic Flow Characteristics 1 Contents 2 Introduction The Nature of Traffic Flow Approaches to Understanding Traffic Flow Parameters Connected with Traffic Flow Categories of Traffic Flow The
Appendix B. Land Use and Traffic Modeling Documentation
 Appendix B Land Use and Traffic Modeling Documentation Technical Memorandum Planning Level Traffic for Northridge Sub-Area Study Office of Statewide Planning and Research Modeling & Forecasting Section
Traffic Modelling for Moving-Block Train Control System
 Commun. Theor. Phys. (Beijing, China) 47 (2007) pp. 601 606 c International Academic Publishers Vol. 47, No. 4, April 15, 2007 Traffic Modelling for Moving-Block Train Control System TANG Tao and LI Ke-Ping
Technical Memorandum #2 Future Conditions
 Technical Memorandum #2 Future Conditions To: Dan Farnsworth Transportation Planner Fargo-Moorhead Metro Council of Governments From: Rick Gunderson, PE Josh Hinds PE, PTOE Houston Engineering, Inc. Subject:
Data Collection. Lecture Notes in Transportation Systems Engineering. Prof. Tom V. Mathew. 1 Overview 1
 Data Collection Lecture Notes in Transportation Systems Engineering Prof. Tom V. Mathew Contents 1 Overview 1 2 Survey design 2 2.1 Information needed................................. 2 2.2 Study area.....................................
Perth County Road Fatal Head-on Collision - A Common and Dangerous Issue
 Perth County Road Fatal Head-on Collision - A Common and Dangerous Issue Posting Date: 25-Aug-2016 Figure 1: View looking east long "Speeders Alley" - a more appropriate name for the long, straight and
Typical information required from the data collection can be grouped into four categories, enumerated as below.
 Chapter 6 Data Collection 6.1 Overview The four-stage modeling, an important tool for forecasting future demand and performance of a transportation system, was developed for evaluating large-scale infrastructure
CE351 Transportation Systems: Planning and Design
 CE351 Transportation Systems: Planning and Design TOPIC: Level of Service (LOS) at Traffic Signals 1 Course Outline Introduction to Transportation Highway Users and their Performance Geometric Design Pavement
TOWN OF GRAND FALLS WINDSOR
 TOWN OF GRAND FALLS WINDSOR DEPARTMENT OF ENGINEERING AND WORKS FREQUENTLY ASKED QUESTIONS FOR WINTER OPERATIONS... What streets are the first to be plowed & salted/sanded? The roads crews are each assigned
Prepared for: San Diego Association Of Governments 401 B Street, Suite 800 San Diego, California 92101
 Activity-Based Travel Model Validation for 2012 Using Series 13 Data: Coordinated Travel Regional Activity Based Modeling Platform (CT-RAMP) for San Diego County Prepared for: San Diego Association Of
TRAFFIC IMPACT STUDY FOR SOUTH BAY SALT POND RESTORATION PROJECT PHASE 2
 APPENDIX G TRAFFIC IMPACT STUDY FOR SOUTH BAY SALT POND RESTORATION PROJECT PHASE 2 South Bay Salt Pond Restoration Project Phase II May 2015 Draft Environmental Impact Statement/Report Traffic Impact
US 169/I-70 North Loop Planning & Environmental Linkages Study
 US 169/I-70 North Loop Planning & Environmental Linkages Study VISSIM Calibration Document Draft April 13, 2018 Page i Table of Contents 1. Overview... 1 2. Data Types... 2 3. Model Parameter Adjustments...
Trip Generation Calculations
 Trip Generation Calculations A HORIZON AIR ALLEGIANT AI R EMPLOYEES Daily Trip Generation Daily Trip Generation Daily Trip Generation Directional Flights (per day): 20 Directional Flights (per day): 2.8
3.0 ANALYSIS OF FUTURE TRANSPORTATION NEEDS
 3.0 ANALYSIS OF FUTURE TRANSPORTATION NEEDS In order to better determine future roadway expansion and connectivity needs, future population growth and land development patterns were analyzed as part of
Prepared for. 3D/International, Inc West Loop South, Suite 400 Houston, Texas November 2006
 DRAFT TRAFFIC IMPACT STUDY FOR PHASED DEVELOPMENT OF TAMU CC Prepared for 3D/International, Inc. 1900 West Loop South, Suite 400 Houston, Texas 77027 November 2006 Interim Review Only Document Incomplete:
Appendix BAL Baltimore, Maryland 2003 Annual Report on Freeway Mobility and Reliability
 (http://mobility.tamu.edu/mmp) Office of Operations, Federal Highway Administration Appendix BAL Baltimore, Maryland 2003 Annual Report on Freeway Mobility and Reliability This report is a supplement to:
WOODRUFF ROAD CORRIDOR ORIGIN-DESTINATION ANALYSIS
 2018 WOODRUFF ROAD CORRIDOR ORIGIN-DESTINATION ANALYSIS Introduction Woodruff Road is the main road to and through the commercial area in Greenville, South Carolina. Businesses along the corridor have
Mapping Accessibility Over Time
 Journal of Maps, 2006, 76-87 Mapping Accessibility Over Time AHMED EL-GENEIDY and DAVID LEVINSON University of Minnesota, 500 Pillsbury Drive S.E., Minneapolis, MN 55455, USA; geneidy@umn.edu (Received
Tahlequah Public Schools Inclement Weather Transportation Plan
 Tahlequah Public Schools Inclement Weather Transportation Plan Inclement Weather with Ice and Snow From time to time throughout the school year, weather may force a change in the District s normal operating
Trip Generation Study: A 7-Eleven Gas Station with a Convenience Store Land Use Code: 945
 Trip Generation Study: A 7-Eleven Gas Station with a Convenience Store Land Use Code: 945 Introduction The Brigham Young University Institute of Transportation Engineers student chapter (BYU ITE) completed
Design Priciples of Traffic Signal
 Design Priciples of Traffic Signal Lecture Notes in Transportation Systems Engineering Prof. Tom V. Mathew Contents 1 Overview 1 2 Definitions and notations 2 3 Phase design 3 3.1 Two phase signals.................................
Town of Windsor. Department of Public Works
 Town of Windsor Department of Public Works 860.285.1855 TOWN OF WINDSOR PUBLIC WORKS SNOW REMOVAL PLAN In Windsor, as throughout the New England states, winter can bring a variety of weather conditions
Impact of Day-to-Day Variability of Peak Hour Volumes on Signalized Intersection Performance
 Impact of Day-to-Day Variability of Peak Hour Volumes on Signalized Intersection Performance Bruce Hellinga, PhD, PEng Associate Professor (Corresponding Author) Department of Civil and Environmental Engineering,
MEMORANDUM (DRAFT) DRAFT
 DRAFT") 117 Commercial St. NE, Suite 310 Salem, OR 97301 503.391.8773 www.dksassociates.com MEMORANDUM (DRAFT) DATE: February 15, 2017 TO: FROM: SUBJECT: Alex Dupey, MIG Scott Mansur, PE, PTOE; Garth Appanaitis,
117 Commercial St. NE, Suite 310 Salem, OR 97301 503.391.8773 www.dksassociates.com MEMORANDUM (DRAFT) DATE: February 15, 2017 TO: FROM: SUBJECT: Alex Dupey, MIG Scott Mansur, PE, PTOE; Garth Appanaitis,
Town of Bowden Province of Alberta Policy Document ( ) SNOW REMOVAL POLICY
 SNOW REMOVAL POLICY") Town of Bowden Box 338, 2101 20 th Ave Bowden, Alberta, T0M 0K0 Town of Bowden Province of Alberta Policy Document (2019-01) SNOW REMOVAL POLICY 1 INTRODUCTION The purpose of this policy is to establish
Town of Bowden Box 338, 2101 20 th Ave Bowden, Alberta, T0M 0K0 Town of Bowden Province of Alberta Policy Document (2019-01) SNOW REMOVAL POLICY 1 INTRODUCTION The purpose of this policy is to establish
City of Camrose Winter Road Maintenance Policy
 City of Camrose Winter Road Maintenance Policy The purpose of this policy is to outline the level of service that the City of Camrose delivers regarding the maintenance of roads in winter conditions. 1.
CITY OF NEW LONDON WINTER ROAD & SIDEWALK MAINTENANCE POLICY
 CITY OF NEW LONDON WINTER ROAD & SIDEWALK MAINTENANCE POLICY GENERAL The purpose of this policy is to set up acceptable procedures and policies for the winter maintenance of public areas in the City of
The Urbana Free Library Parking and Transportation Study
 CHAMPAIGN COUNTY REGIONAL PLANNING COMMISSION The Urbana Free Library Parking and Transportation Study Final Report 7/18/2013 Champaign Urbana Urbanized Area Transportation Study (CUUATS) TABLE OF CONTENTS
City of Hermosa Beach Beach Access and Parking Study. Submitted by. 600 Wilshire Blvd., Suite 1050 Los Angeles, CA
 City of Hermosa Beach Beach Access and Parking Study Submitted by 600 Wilshire Blvd., Suite 1050 Los Angeles, CA 90017 213.261.3050 January 2015 TABLE OF CONTENTS Introduction to the Beach Access and Parking
106 PURDUE ENGINEERING EXTENSION DEPARTMENT
 106 PURDUE ENGINEERING EXTENSION DEPARTMENT distribution by stations can best be studied by examining Figs. 3 and 4. Figure 4 shows the frequency distribution between stations, and Fig. 3 shows the actual
2014 Data Collection Project ITE Western District
 2014 Data Collection Project ITE Western District Project Completed By: Oregon State University OSU ITE Student Chapter 101 Kearney Hall Corvallis, OR 97331 Student Coordinator: Sarah McCrea (OSU ITE Student
TRANSPORTATION AND TRAFFIC ANALYSIS REPORT
 Square One Drive Extension Municipal Class Environmental Assessment Environmental Study Report Appendix B Transportation and Traffic Analysis Report TRANSPORTATION AND TRAFFIC ANALYSIS REPORT FINAL DRAFT
Appendix B. Durham Region Travel Demand Model Calibration
 Appendix B Durham Region Travel Demand Model Calibration AECOM 300 Water Street 905 668 9363 tel Whitby, ON, Canada L1N 9J2 905 668 0221 fax www.aecom.com To Ron Albright, Municipality of Clarington Page
Accessing and Using Indiana Traffic Data
 Accessing and Using Indiana Traffic Data Purdue Road School March 6, 2013 Presented by: Gregory Katter, PE Asset Planning Indiana Traffic Data 1. Overview of Traffic Data Collection Program 2. Accessing
Appendix B.1 EMME Model Calibration Memo
 Appendix B.1 EMME Model Calibration Memo itrans 144 Front Street West, Suite 655 Toronto, ON M5J 2L7 Tel: (416) 847-0005 Fax: (905) 882-1557 www.hdrinc.com www.itransconsulting.com File: 2.0 Memorandum
Trip Generation Characteristics of Super Convenience Market Gasoline Pump Stores
 Trip Generation Characteristics of Super Convenience Market Gasoline Pump Stores This article presents the findings of a study that investigated trip generation characteristics of a particular chain of
I. M. Schoeman North West University, South Africa. Abstract
 Urban Transport XX 607 Land use and transportation integration within the greater area of the North West University (Potchefstroom Campus), South Africa: problems, prospects and solutions I. M. Schoeman