Chapter 5 Traffic Flow Characteristics
|
|
|
- Scott Hawkins
- 5 years ago
- Views:
Transcription

1 Chapter 5 Traffic Flow Characteristics 1
2 Contents 2 Introduction The Nature of Traffic Flow Approaches to Understanding Traffic Flow Parameters Connected with Traffic Flow Categories of Traffic Flow The Uninterrupted Traffic Flow Model Analysis of Speed, Flow, and Density Relationship Empirical Studies of Traffic Stream Characteristics Trajectory Diagrams General Model of Vehicle Stream Flow Centrally Versus Individually Controlled Modes
3 1. Introduction It is aimed to examine the flow of vehicles moving individually or in groups on a roadway or track, subject to constraints imposed by human behavior and vehicle dynamics. At the present time, there is no unified theory of traffic flow, much of the knowledge currently available in this field is largely empirical. 3
4 2. The Nature of Traffic Flow 4 Traffic flow is a complex phenomenon, and a stochastic process, with random variations in vehicles and driver characteristics and their interactions. Relationship between traffic flow and speed Deterministic models vs. stochastic models
5 3. Approaches to Understanding Traffic Flow Three main approaches to the understanding and quantification of traffic flow: Macroscopic approach: it looks at the flow in an aggregate sense. Microscopic approach: it considers the response of each individual vehicle in a disaggregate manner. Human-factor approach: it seeks to define the mechanism by which an individual driver (and his or her vehicle) locates himself or herself with reference to other vehicles and to the highway/guidance system. 5
6 4. Parameters Connected with Traffic Flow There are at least eight basic variables or measures used in describing traffic flow. The three primary variables are speed (v), volume (q), and density (k). Three other variables used in traffic flow analysis are headway (h), spacing (s), and occupancy (R). The corresponding measures of spacing and headway are two parameters: clearance (c) and gap (g). 6
7 Speed Speed is defined as a rate of motion, as distance per unit time, generally in miles per hour (mph) or kilometers per hour (km/hr). Because there is a broad distribution of individual speeds in a traffic stream, an average travel speed is considered. 7
8 8 Space mean speed (v s ) If the travel times t 1, t 2,, t n, are observed for n vehicles traversing a segment of length L, the average travel speed is: where L nl = = n n t i t n i= 1 v s = space mean speed (mph) v s L = length of the highway segment (miles) t i = travel time of the i th vehicle to traverse the section (hours) i= 1 n = number of travel times observed i
9 Time mean speed (v t ) This is the arithmetic mean of the measured speeds of all vehicles passing a fixed roadside point during a given interval of time, in which case, the individual speeds are known as spot speeds. The time mean speed is defined as follows: 9 v t n i= 1 = n where v i is the spot speed, and n is the number of vehicles observed. v i
10 It can be shown that whereas the time mean speed is the arithmetic mean of the spot speeds, the space mean speed is their harmonic mean. Time mean speed is always greater than space mean speed except in the situation where all vehicles travel at the same speed. 10
11 Relationship between space mean speed and time mean speed: σ 2 σ 2 s vt = vs + v = v t s t v v s t where σ s2 is the variance of the space mean speeds. 11
12 Volume and rate of flow Volume is the actual number of vehicles observed or predicted to be passing a point during a given time interval. The rate of flow represents the number of vehicles passing a point during a time interval less than 1 hour, but expressed as an equivalent hourly rate. 12
13 13 Density or concentration Density is defined as the number of vehicles occupying a given length of lane or roadway, averaged over time, usually expressed as vehicles per mile (veh/mi), and it is a critical parameter in describing freedom of maneuverability. Direct measurement of density can be obtained through aerial photography, but more commonly it is calculated from the following equation: q = v where, q = rate of flow (veh/hr) v = average travel speed (mph) k = average density (veh/mi) k
14 Spacing and headway Spacing (s) is defined as the distance between successive vehicles in a traffic stream as measured from front bumper to front bumper. Headway is the corresponding time between successive vehicles as they pass a point on a roadway. Both spacing and headway are related to speed, flow rate, and density. Spacing (s) of vehicles can be observed from aerial photographs, and headways of vehicles can be measured using stopwatch observations as vehicles pass a point on a lane. 14
15 Relationships of spacing, headway, and q, k, v Avg. density (k), veh/mi = 5280, ft / mi avg. spacing ( s), ft / veh Avg. headway (h), sec/veh = avg. spacing ( s), ft / veh avg. speed ( v), ft / sec Avg. flow rate (q), veh/hr = 3600,sec/ hr avg. headway( h),sec/ veh 15
16 Lane occupancy Lane occupancy is a measure used in freeway surveillance. If one could measure the lengths of vehicles on a given roadway section and compute the following ratio, then R could be divided by the average length of a vehicle to give an estimate of the density (k). R = D L i 16
17 Lane occupancy (LO) can also be described as the ratio of the time that vehicles are present at a detection station in a traffic lane compared to the time of sampling. LO can be expressed through the following equation: LO t = T 0 17
18 Speed obtained from loop detector Space mean speed can be obtained by measuring the time duration of a vehicle passing through a loop detector. It can be expressed through the following equation: t 0 = L + v s C or L + v s = where L is the average length of vehicle, and C is the distance between the loop of the detector. t 0 C 18
19 19 Illustration of the use of a detector in traffic engineering work
20 The effective length of a vehicle as measured by the detector in use to calculate lane occupancy by the following expression: k = LO 5280 L + C In most cases, the detector is actuated as soon as the front bumper crosses the detector and remains on until the rear bumper leaves the detector. 20
21 Clearance and gap Clearance and gap correspond to parameters of spacing (ft) and headway (sec). The difference between spacing and clearance is obviously the average length of a vehicle in feet. Similarly, the difference between headway and gap is the time equivalence of the average length of a vehicle (L/v). 21
22 Relationships of clearance-gap and spacing-headway g L = h ( ) c = g v and v where, g = mean gap (sec) L = mean length of vehicles (ft) c = mean clearance (ft) h = mean headway (sec) v = mean speed (ft/sec) 22
23 23 Clearance-Gap and Spacing-Headway Concept
24 5. Categories of Traffic Flow Vehicle flow on transportation facilities may be generally classified into two categories: Uninterrupted flow: it can occur on facilities that have no fixed elements, such as traffic signals, external to the traffic stream, that cause interruptions to traffic flow. Interrupted flow: it occurs on transportation facilities that have fixed elements causing periodic interruptions to traffic flow. Such elements include traffic signals, stop signs, and other types of controls. 24
25 25 Uninterrupted and interrupted flow are terms that describe the facility and not the quality of flow. Internal vs. external elements Multi-lane and two-lane highways may also operate with almost uninterrupted flow, especially in a long segments between points of fixed interruptions, such as segments where signal spacing exceeds 2 miles.
26 Types of Transportation Facilities 26 Table 5-1 Types of Transportation Facilities Uninterrupted flow Freeways Multilane highways Two-lane highways Interrupted flow Signalized streets Unsignalized streets with stop signs Arterials Transits Pedestrian walkways Bicycle paths
27 6. The Uninterrupted Traffic Flow Model The model can best be described by means of a typical speed-flow curve. Uninfluenced-flow (unforced-flow) region vs. forced-flow region Free-flow speed (point C) vs. maximumdensity speed (point A) Capacity flow (point B) 27
28 28 Typical Speed-Flow Curve
29 7. Analysis of Speed, Flow, and Density Relationship 29 If it is hypothesized that a linear relationship between the speed of traffic on an uninterrupted traffic lane and the traffic density (veh/mile), then mathematically this relationship can be represented by: v = A Bk where, v = mean speed of vehicles (mph) k = average density of vehicles (veh/mile) A, B = empirically determined parameters or k = ( v A) B
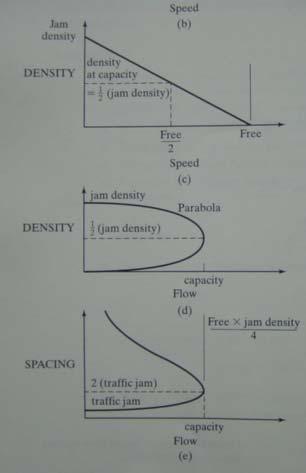
30 Because the flow of an uninterrupted traffic stream is the product of the density and the speed, we have: 2 1) q =f (k) or 2) q = g (v) q q = = kv kv = = Ak ( v At almost zero density, the mean free speed equals A, and at almost zero speed, the jam density equals A/B. The maximum flow occurs at about half the mean free speed and is equal to A 2 /4B. Bk A) v B = A B v 2 v B 30
31 31 Speed-Flow-Density Curves
32 32 Flow-Density Curve
33 33 Speed-Density and Speed-Flow Curves
34 Relationships between Mean Speed, Density, and Flow Free flow Forced flow Maximum volume Jam density 34
35 8. Empirical Studies of Traffic Stream Characteristics Macroscopic Models for Traffic Flow Greenshields Model The general model connecting speed, flow, and density is a linear model proposed by Greenshields in The evaluation of models proceeded along two lines: Relationships of q-k-v were tested in terms of goodness of fit to actual field data. Relationships were supposed to satisfy certain boundary conditions. 35
36 Greenberg s Model Greenberg (1959) developed a model taking speed, flow, and density measurements in Lincoln Tunnel resulting in a speed-density model, and used fluid-flow analogy concept, using the following form: v s = C ln( k / k ) C is a constant, in fact C is the speed at maximum flow. Greenberg s model shows better goodness-of-fit as compared to Greenshield s model, although it violates the boundary conditions in that zero density can only be attained at an infinitely high speed. j 36
37 General and Linear Speed-Density Relationship General speed-density relationship vs. linear speed-density relationship, and their corresponding traffic flow variables basic assumptions on speed-density relationships of the above two set of models: nonlinear vs. linear 37

38 38 General Speed-Flow-Spacing Relationship

39 39 General Speed-Flow-Spacing Relationship

40 40 Speed-Flow-Spacing-Density Relationship Based on Free Speed and a Linear Speed- Density Curve
41 41
42 The Moving-Vehicle Estimation Method It consists of the following tasks: making a series of runs in a test vehicle, recording the number of vehicles that overtake the test vehicle, the number of vehicles passed by the test vehicle, and the travel time for the test vehicle. 42
43 9. Trajectory Diagrams aggregate behavior of vehicles in a traffic stream vs. the behavior of individual vehicles A trajectory diagram can provide individual vehicle behaviors. Each trajectory represents the movement through space and time of a particular vehicle, and the combination lines illustrates the interaction between vehicles. The slope of the trajectories are the speeds of vehicles. Such diagrams have wide applications in the study in platoon formation and dispersion, and the coordination of traffic. 43
44 Shock Waves and Bottlenecks shock wave due to the geometric characteristics of roadway (e.g., uphill and downhill). Another shock wave a decompression of traffic flow occurs. shock wave due to a bottleneck situation. A reverse shock wave may occur after vehicles have negotiated the bottleneck. shock wave due to traffic signal at an intersection. 44

45 45 Time-Space Diagram

46 46 Shock Wave Measurements
47 Crawl speed: vehicles approaching the bottleneck are forced to reduce their speed to the maximum flow level of the bottleneck section. Wave velocity: the changes through the stream of vehicles travel at a velocity given by the following equation: u w = dq dk 47
48 The wave velocity can be represented by: u w = q k B B q k A A 48 If the sign of the shock wave is positive, the wave is proceeding in the direction of the stream flow (downstream). If the sign of the shock wave is negative, the shock wave is moving against the stream flow (upstream). A stationary shock wave exists if u w = 0.
49 Shock Wave Propagation assuming Greenshields traffic flow model, v f represents the mean free speed and k j is the jam density, v i = v f (1 k k i j ) and let k i / k j = x, then v i = v f (1-x). General representation of shock wave propagation: u w = v f [ 1 ( x 1 + x2 )] 49
50 Shock wave caused by nearly equal densities u w = v f ( 1 2x1) Shock wave caused by stopping (x 2 = 1) u w = v f [ 1 ( x1 + 1)] = ( v f )( x1) 50 Shock wave caused by starting (x 1 = 1) u w = v f [ 1 (1 + x = v x 2 )] = v f ( x2) f 2
51 10. General Model of Vehicle Stream Flow Consider two successive vehicles (or trains), called the lead vehicle and following vehicle, moving at a cruising speed, v (ft/sec), along a long stretch of highway or guideway. Then the minimum headway can be written as: minimum headway (sec) = minimum spacing (ft) / cruise speed (ft/sec) The minimum spacing consists of four components: The distance covered during the P+R time The difference between the braking distances of the following and lead vehicles The distance between successive vehicles when stopped The vehicle length 51
52 Expressing the above four components algebraically, the minimum spacing is given as: 52 where, 2 2 v v smin = vt r + ( ) + s0 + 2b 2b v = speed of vehicle (ft/sec) t r = P+R time (sec) b 1, b 2 = deceleration rate of leading and following vehicles, respectively (ft/sec ) s 0 = distance between two vehicles when stopped L = length of the vehicle (ft) 2 1 L

53 53 Vehicle Stream Flow

54 54 Combinations of Braking Rates

55 55 Distance vs. Speed

56 56 Speed vs. Density

57 57 Flow vs. Speed

58 58 Flow vs. Density
59 11. Centrally Versus Individually Controlled Modes 59 Centrally controlled mode: rules of controlling the longitudinal spacing of vehicles, the stopping schedule of vehicles, and the time of operation are subject to their designer s decisions. Most train modes operating on exclusive or principally exclusive right-of-way fall into this group. Individually controlled mode: individual drivers make their own decisions regarding headways, speed, and so on, subject to state or local traffic laws. Private automobiles as well as transit vehicles operating in mixed traffic fall into this group.

60 60 Centrally vs. Individually Controlled Flow
Traffic flow theory involves the development of mathematical relationships among
 CHAPTER 6 Fundamental Principles of Traffic Flow Traffic flow theory involves the development of mathematical relationships among the primary elements of a traffic stream: flow, density, and speed. These
2.1 Traffic Stream Characteristics. Time Space Diagram and Measurement Procedures Variables of Interest
 2.1 Traffic Stream Characteristics Time Space Diagram and Measurement Procedures Variables of Interest Traffic Stream Models 2.1 Traffic Stream Characteristics Time Space Diagram Speed =100km/h = 27.78
CE351 Transportation Systems: Planning and Design
 CE351 Transportation Systems: Planning and Design TOPIC: Level of Service (LOS) at Traffic Signals 1 Course Outline Introduction to Transportation Highway Users and their Performance Geometric Design Pavement
CHAPTER 3. CAPACITY OF SIGNALIZED INTERSECTIONS
 CHAPTER 3. CAPACITY OF SIGNALIZED INTERSECTIONS 1. Overview In this chapter we explore the models on which the HCM capacity analysis method for signalized intersections are based. While the method has
Traffic Flow Theory and Simulation
 Traffic Flow Theory and Simulation V.L. Knoop Lecture 2 Arrival patterns and cumulative curves Arrival patterns From microscopic to macroscopic 24-3-2014 Delft University of Technology Challenge the future
1 h. Page 1 of 12 FINAL EXAM FORMULAS. Stopping Sight Distance. (2 ) N st U Where N=sample size s=standard deviation t=z value for confidence level
 N st U Where N=sample size s=standard deviation t=z value for confidence level") Page 1 of 12 FINAL EXAM FORMULAS Stopping Sight Distance 2 2 V V d 1.47Vt 1.075 i f a 2 2 Vi Vf d 1.47Vt 30( f 0.01 G) Where d = distance (ft) V = speed (mph) t = time (sec) a=deceleration rate (ft/sec
Page 1 of 12 FINAL EXAM FORMULAS Stopping Sight Distance 2 2 V V d 1.47Vt 1.075 i f a 2 2 Vi Vf d 1.47Vt 30( f 0.01 G) Where d = distance (ft) V = speed (mph) t = time (sec) a=deceleration rate (ft/sec
Assignment 4:Rail Analysis and Stopping/Passing Distances
 CEE 3604: Introduction to Transportation Engineering Fall 2012 Date Due: September 28, 2012 Assignment 4:Rail Analysis and Stopping/Passing Distances Instructor: Trani Problem 1 You are ased to evaluate
MnDOT Method for Calculating Measures of Effectiveness (MOE) From CORSIM Model Output
 From CORSIM Model Output") MnDOT Method for Calculating Measures of Effectiveness (MOE) From CORSIM Model Output Rev. April 29, 2005 MnDOT Method for Calculating Measures of Effectiveness (MOE) From CORSIM Model Output Table of
MnDOT Method for Calculating Measures of Effectiveness (MOE) From CORSIM Model Output Rev. April 29, 2005 MnDOT Method for Calculating Measures of Effectiveness (MOE) From CORSIM Model Output Table of
CHAPTER 5 DELAY ESTIMATION FOR OVERSATURATED SIGNALIZED APPROACHES
 CHAPTER 5 DELAY ESTIMATION FOR OVERSATURATED SIGNALIZED APPROACHES Delay is an important measure of effectiveness in traffic studies, as it presents the direct cost of fuel consumption and indirect cost
Research Article Headway Distributions Based on Empirical Erlang and Pearson Type III Time Methods Compared
 Research Journal of Applied Sciences, Engineering and Technology 7(21): 4410-4414, 2014 DOI:10.19026/rjaset.7.817 ISSN: 2040-7459; e-issn: 2040-7467 2014 Maxwell Scientific Publication Corp. Submitted:
CE351 Transportation Systems: Planning and Design
 CE351 Transportation Systems: Planning and Design TOPIC: HIGHWAY USERS PERFORMANCE (Part III) 1 ANOUNCEMENT Updated d Schedule on: http://wiki.cecs.pdx.edu/bin/view/main/slidesce 351 Course Outline Introduction
Worksheet 1: One-Dimensional Kinematics
 Worksheet 1: One-Dimensional Kinematics Objectives Relate,, and in examples of motion along one dimension. Visualize motion using graphs of,, and vs.. Solve numeric problems involving constant and constant.
To convert a speed to a velocity. V = Velocity in feet per seconds (ft/sec) S = Speed in miles per hour (mph) = Mathematical Constant
 S = Speed in miles per hour (mph) = Mathematical Constant") To convert a speed to a velocity V S ( 1.466) V Velocity in feet per seconds (ft/sec) S Speed in miles per hour (mph) 1.466 Mathematical Constant Example Your driver just had a rear-end accident and says
To convert a speed to a velocity V S ( 1.466) V Velocity in feet per seconds (ft/sec) S Speed in miles per hour (mph) 1.466 Mathematical Constant Example Your driver just had a rear-end accident and says
Signalized Intersections
 Signalized Intersections Kelly Pitera October 23, 2009 Topics to be Covered Introduction/Definitions D/D/1 Queueing Phasing and Timing Plan Level of Service (LOS) Signal Optimization Conflicting Operational
Development and Evaluation of Online Estimation Methods for a Feedback-Based Freeway Ramp Metering Strategy
 Development and Evaluation of Online Estimation Methods for a Feedback-Based Freeway Ramp Metering Strategy Kaan Ozbay, Ph.D. Associate Professor Rutgers University, Civil and Environmental Engineering,
Signalized Intersection Delay Models
 Signalized Intersection Delay Models Lecture Notes in Transportation Systems Engineering Prof. Tom V. Mathew Contents 1 Introduction 1 2 Types of delay 2 2.1 Stopped Time Delay................................
Estimating Density and Lane Inflow on a Freeway Segment
 Estimating Density and Lane Inflow on a Freeway Segment Benjamin Coifman, PhD Assistant Professor, Department of Civil and Environmental Engineering and Geodetic Science Assistant Professor, Department
Hysteresis in traffic flow revisited: an improved measurement method
 Hysteresis in traffic flow revisited: an improved measurement method Jorge A. Laval a, a School of Civil and Environmental Engineering, Georgia Institute of Technology Abstract This paper presents a method
Signalized Intersection Delay Models
 Chapter 35 Signalized Intersection Delay Models 35.1 Introduction Signalized intersections are the important points or nodes within a system of highways and streets. To describe some measure of effectiveness
Signalized Intersection Delay Models
 Transportation System Engineering 56. Signalized Intersection Delay Models Chapter 56 Signalized Intersection Delay Models 56.1 Introduction Signalized intersections are the important points or nodes within
CEE 320 Midterm Examination (50 minutes)
") CEE 320 Midterm Examination (50 minutes) Fall 2009 Please write your name on this cover. Please write your last name on all other exam pages This exam is NOT open book, but you are allowed to use one 8.5x11
CEE 320 Midterm Examination (50 minutes) Fall 2009 Please write your name on this cover. Please write your last name on all other exam pages This exam is NOT open book, but you are allowed to use one 8.5x11
CHAPTER 2. CAPACITY OF TWO-WAY STOP-CONTROLLED INTERSECTIONS
 CHAPTER 2. CAPACITY OF TWO-WAY STOP-CONTROLLED INTERSECTIONS 1. Overview In this chapter we will explore the models on which the HCM capacity analysis method for two-way stop-controlled (TWSC) intersections
Traffic Progression Models
 Traffic Progression Models Lecture Notes in Transportation Systems Engineering Prof. Tom V. Mathew Contents 1 Introduction 1 2 Characterizing Platoon 2 2.1 Variables describing platoon............................
Partial elliptical two regime speed flow traffic model based on the highway capacity manual
 Partial elliptical two regime speed flow traffic model based on the highway capacity manual Yousif, S Title Authors Type URL Partial elliptical two regime speed flow traffic model based on the highway
Vehicle Motion Equations:
 1 Vehicle Motion Equations: v = at + v (2.2.4) x x = v2 2 v 2a (2.2.6) v 2 = v 2 + 2a(x x ) (2.2.6) x = 1 2 at2 + v t + x (2.2.7) D b = x cos α (2.2.10) x = vt D b = v 2 v 2 2g(f G) (2.2.14) e + f s =
Shock wave analysis. Chapter 8. List of symbols. 8.1 Kinematic waves
 Chapter 8 Shock wave analysis Summary of the chapter. Flow-speed-density states change over time and space. When these changes of state occur, a boundary is established that demarks the time-space domain
Approved Corrections and Changes for the Highway Capacity Manual 2000
 Approved Corrections and Changes for the Highway Capacity Manual 2000 Updated 7/8/2005 Previous update 2/27/2004 TRB Committee AHB40, Highway Capacity and Quality of Service Unless stated otherwise, corrections
FUNDAMENTALS OF TRANSPORTATION ENGINEERING By Jon D. Fricker and Robert K. Whitford
 FUNDAMENTALS OF TRANSPORTATION ENGINEERING By Jon D. Fricker and Robert K. Whitford This table includes typos Dr. Saito found besides the ones listed in the authors official errata sheet. Please note that
Variable Speed Approach for Congestion Alleviation on Boshporus Bridge Crossing
 Variable Speed Approach for Congestion Alleviation on Boshporus Bridge Crossing A. Akbas a,1, V. Topuz a,1, H.H. Celik b,2 and M. Ergun c,3 a University of Marmara, Vocational High School of Technical
Traffic Flow Theory & Simulation
 Traffic Flow Theory & Simulation S.P. Hoogendoorn Lecture 4 Shockwave theory Shockwave theory I: Introduction Applications of the Fundamental Diagram February 14, 2010 1 Vermelding onderdeel organisatie
h CIVIL ENGINEERING FLUID MECHANICS section. ± G = percent grade divided by 100 (uphill grade "+")
") FLUID MECHANICS section. TRANSPORTATION U.S. Customary Units a = deceleration rate (ft/sec ) A = absolute value of algebraic difference in grades (%) e = superelevation (%) f = side friction factor ± G
FLUID MECHANICS section. TRANSPORTATION U.S. Customary Units a = deceleration rate (ft/sec ) A = absolute value of algebraic difference in grades (%) e = superelevation (%) f = side friction factor ± G
EVALUATION OF SAFETY PERFORMANCES ON FREEWAY DIVERGE AREA AND FREEWAY EXIT RAMPS. Transportation Seminar February 16 th, 2009
 EVALUATION OF SAFETY PERFORMANCES ON FREEWAY DIVERGE AREA AND FREEWAY EXIT RAMPS Transportation Seminar February 16 th, 2009 By: Hongyun Chen Graduate Research Assistant 1 Outline Introduction Problem
Kinematics II Mathematical Analysis of Motion
 AP Physics Kinematics II Mathematical Analysis of Motion Introduction: Everything in the universe is in a state of motion. It might seem impossible to find a simple way to describe and understand the motion
Traffic signal design-ii
 CHAPTER 4. TRAFFIC SIGNAL DESIGN-II NPTEL May 3, 007 Chapter 4 Traffic signal design-ii 4.1 Overview In the previous chapter, a simple design of cycle time was discussed. Here we will discuss how the cycle
EMPIRICAL STUDY OF TRAFFIC FEATURES AT A FREEWAY LANE DROP
 EMPIRICAL STUDY OF TRAFFIC FEATURES AT A FREEWAY LANE DROP Robert L. Bertini, Assistant Professor Member, American Society of Civil Engineers Department of Civil & Environmental Engineering Portland State
Spontaneous Jam Formation
 Highway Traffic Introduction Traffic = macroscopic system of interacting particles (driven or self-driven) Nonequilibrium physics: Driven systems far from equilibrium Collective phenomena physics! Empirical
Speed-Flow and Bunching Relationships for Uninterrupted Flows
 25th Conference of Australian Institutes of Transport Research (CAITR 2003), University of South Australia, Adelaide, Australia, 3-5 December 2003 First Version: 2 December 03 Speed-Flow and Bunching Relationships
Fundamental diagrams. Chapter 4. List of symbols. 4.1 Introduction
 Chapter 4 Fundamental diagrams Contents of this chapter. This chapter introduces the concept of the fundamental diagram. Some models used in practice will be discussed, also one with a so called capacity
Traffic Flow Theory & Simulation
 Traffic Flow Theory & Simulation S.P. Hoogendoorn Lecture 1 Introduction Photo by Wikipedia / CC BY SA Course 4821 - Introduction 1 57 Photo by wikipedia / CC BY SA Traffic Flow Theory & Simulation An
Traffic Management and Control (ENGC 6340) Dr. Essam almasri. 8. Macroscopic
 Dr. Essam almasri. 8. Macroscopic") 8. Macroscopic Traffic Modeling Introduction In traffic stream characteristics chapter we learned that the fundamental relation (q=k.u) and the fundamental diagrams enable us to describe the traffic state
8. Macroscopic Traffic Modeling Introduction In traffic stream characteristics chapter we learned that the fundamental relation (q=k.u) and the fundamental diagrams enable us to describe the traffic state
NATHAN HALE HIGH SCHOOL PARKING AND TRAFFIC ANALYSIS. Table of Contents
 Parking and Traffic Analysis Seattle, WA Prepared for: URS Corporation 1501 4th Avenue, Suite 1400 Seattle, WA 98101-1616 Prepared by: Mirai Transportation Planning & Engineering 11410 NE 122nd Way, Suite
Subject: Desert Palisades Specific Plan - Tram Way Access Sight Distance
 Endo Engineering Traffic Engineering Air Quality Studies Noise Assessments July 13, 2015 Mr. Ed Freeman Pinnacle View, LLC P.O. Box 1754 Lake Oswego, OR 97035-0579 Subject: Desert Palisades Specific Plan
Traffic Modelling for Moving-Block Train Control System
 Commun. Theor. Phys. (Beijing, China) 47 (2007) pp. 601 606 c International Academic Publishers Vol. 47, No. 4, April 15, 2007 Traffic Modelling for Moving-Block Train Control System TANG Tao and LI Ke-Ping
$QDO\]LQJ$UWHULDO6WUHHWVLQ1HDU&DSDFLW\ RU2YHUIORZ&RQGLWLRQV
![$QDO\]LQJ$UWHULDO6WUHHWVLQ1HDU&DSDFLW\ RU2YHUIORZ&RQGLWLRQV](/thumbs/76/73951207.jpg "$QDO\]LQJ$UWHULDO6WUHHWVLQ1HDU&DSDFLW\ RU2YHUIORZ&RQGLWLRQV") Paper No. 001636 $QDO\]LQJ$UWHULDO6WUHHWVLQ1HDU&DSDFLW\ RU2YHUIORZ&RQGLWLRQV Duplication for publication or sale is strictly prohibited without prior written permission of the Transportation Research Board
Paper No. 001636 $QDO\]LQJ$UWHULDO6WUHHWVLQ1HDU&DSDFLW\ RU2YHUIORZ&RQGLWLRQV Duplication for publication or sale is strictly prohibited without prior written permission of the Transportation Research Board
Kinematics II Mathematical Analysis of Motion
 AP Physics-B Kinematics II Mathematical Analysis of Motion Introduction: Everything in the universe is in a state of motion. It might seem impossible to find a simple way to describe and understand the
Signalized Intersection Delay Models
 hapter 56 Signalized Intersection Delay Models 56.1 Introduction Signalized intersections are the important points or nodes within a system of highways and streets. To describe some measure of effectiveness
Traffic Flow Theory & Simulation
 Traffic Flow Theory & Simulation S.P. Hoogendoorn Lecture 7 Introduction to Phenomena Introduction to phenomena And some possible explanations... 2/5/2011, Prof. Dr. Serge Hoogendoorn, Delft University
LIC SR INTERCHANGE OPERATIONS STUDY
 LIC SR 16 18.20 - INTERCHANGE OPERATIONS STUDY Project Summary Location SR 16 & W. Church St. Interchange Newark, Ohio Licking County PID 99478 Study Sponsor ODOT District 5 Proposed Work Add Left Turn
Modeling Driver Behavior During Merge Maneuvers
 Southwest Region University Transportation Center Modeling Driver Behavior During Merge Maneuvers SWUTC/98/472840-00064-1 Center for Transportation Research University of Texas at Austin 3208 Red River,
Vehicle Longitudinal Control and Traffic Stream Modeling
 Vehicle Longitudinal Control and Traffic Stream Modeling Daiheng Ni, Ph.D. (corresponding author) Assistant Professor Department of Civil and Environmental Engineering, University of Massachusetts Amherst
Flow and Capacity Characteristics on Two-Lane Rural Highways
 128 TRANSPORTATON RESEARCH RECORD 1320 Flow and Capacity Characteristics on Two-Lane Rural Highways ABSHA PoLus, JosEPH CRAus, AND MosHE LrvNEH Traffic operation on two-lane rural highways is unique; no
Accumulated change from rates of change
 Section 6.1 1 Accumulated change from rates of change Suppose that r(t) measures a rate of change with respect to a time variable t. For example, say that for a two-hour period ( 0 t 2), we have r(t) =
Answers to Problem Set Number 02 for MIT (Spring 2008)
") Answers to Problem Set Number 02 for 18.311 MIT (Spring 2008) Rodolfo R. Rosales (MIT, Math. Dept., room 2-337, Cambridge, MA 02139). March 10, 2008. Course TA: Timothy Nguyen, MIT, Dept. of Mathematics,
Answers to Problem Set Number 02 for 18.311 MIT (Spring 2008) Rodolfo R. Rosales (MIT, Math. Dept., room 2-337, Cambridge, MA 02139). March 10, 2008. Course TA: Timothy Nguyen, MIT, Dept. of Mathematics,
OVERVIEW OF A SIMULATION STUDY OF THE HIGHWAY 401 FTMS
 OVERVIEW OF A SIMULATION STUDY OF THE HIGHWAY 401 FTMS HELLINGA, Bruce 1, BAKER, Mark 1, VAN AERDE, Michel 1, AULTMAN-HALL, Lisa 1, and MASTERS, Philip 2 1 Transportation Systems Research Group Queen's
Interactive Traffic Simulation
 Interactive Traffic Simulation Microscopic Open-Source Simulation Software in Javascript Martin Treiber and Arne Kesting July 2017 Traffic and congestion phenomena belong to our everyday experience. Our
KINEMATICS WHERE ARE YOU? HOW FAST? VELOCITY OR SPEED WHEN YOU MOVE. Typical Cartesian Coordinate System. usually only the X and Y axis.
 KINEMATICS File:The Horse in Motion.jpg - Wikimedia Foundation 1 WHERE ARE YOU? Typical Cartesian Coordinate System usually only the X and Y axis meters File:3D coordinate system.svg - Wikimedia Foundation
A Continuous Model for Two-Lane Traffic Flow
 A Continuous Model for Two-Lane Traffic Flow Richard Yi, Harker School Prof. Gabriele La Nave, University of Illinois, Urbana-Champaign PRIMES Conference May 16, 2015 Two Ways of Approaching Traffic Flow
Existence, stability, and mitigation of gridlock in beltway networks
 Existence, stability, and mitigation of gridlock in beltway networks Wen-Long Jin a, a Department of Civil and Environmental Engineering, 4000 Anteater Instruction and Research Bldg, University of California,
JEP John E. Jack Pflum, P.E. Consulting Engineering 7541 Hosbrook Road, Cincinnati, OH Telephone:
 JEP John E. Jack Pflum, P.E. Consulting Engineering 7541 Hosbrook Road, Cincinnati, OH 45243 Email: jackpflum1@gmail.com Telephone: 513.919.7814 MEMORANDUM REPORT Traffic Impact Analysis Proposed Soccer
WEBER ROAD RESIDENTIAL DEVELOPMENT Single Family Residential Project
 WEBER ROAD RESIDENTIAL DEVELOPMENT Single Family Residential Project WEBER ROAD RESIDENTIAL DEVELOPMENT TRAFFIC IMPACT STUDY TABLE OF CONTENTS 1.0 Executive Summary Page 2.0 Introduction 2.1 DEVELOPMENT
From experimemts to Modeling
 Traffic Flow: From experimemts to Modeling TU Dresden 1 1 Overview Empirics: Stylized facts Microscopic and macroscopic models: typical examples: Linear stability: Which concepts are relevant for describing
Cumulative Count Curve and Queueing Analysis
 Introduction Traffic flow theory (TFT) Zhengbing He, Ph.D., http://zhengbing.weebly.com School of traffic and transportation, Beijing Jiaotong University September 27, 2015 Introduction Outline 1 Introduction
Design Priciples of Traffic Signal
 Design Priciples of Traffic Signal Lecture Notes in Transportation Systems Engineering Prof. Tom V. Mathew Contents 1 Overview 1 2 Definitions and notations 2 3 Phase design 3 3.1 Two phase signals.................................
Empirical Study of Traffic Velocity Distribution and its Effect on VANETs Connectivity
 Empirical Study of Traffic Velocity Distribution and its Effect on VANETs Connectivity Sherif M. Abuelenin Department of Electrical Engineering Faculty of Engineering, Port-Said University Port-Fouad,
A high fidelity traffic simulation model based on cellular automata and car-following concepts
 Transportation Research Part C 12 (2004) 1 32 www.elsevier.com/locate/trc A high fidelity traffic simulation model based on cellular automata and car-following concepts Ghulam H. Bham *, Rahim F. Benekohal
KINEMATICS. File:The Horse in Motion.jpg - Wikimedia Foundation. Monday, June 17, 13
 KINEMATICS File:The Horse in Motion.jpg - Wikimedia Foundation 1 WHERE ARE YOU? Typical Cartesian Coordinate System usually only the X and Y axis meters File:3D coordinate system.svg - Wikimedia Foundation
arxiv:cond-mat/ v3 [cond-mat.stat-mech] 18 Aug 2003
![arxiv:cond-mat/ v3 [cond-mat.stat-mech] 18 Aug 2003](/thumbs/80/81188192.jpg "arxiv:cond-mat/ v3 [cond-mat.stat-mech] 18 Aug 2003") arxiv:cond-mat/0211684v3 [cond-mat.stat-mech] 18 Aug 2003 Three-Phase Traffic Theory and Highway Capacity Abstract Boris S. Kerner Daimler Chrysler AG, RIC/TS, T729, 70546 Stuttgart, Germany Hypotheses
arxiv:cond-mat/0211684v3 [cond-mat.stat-mech] 18 Aug 2003 Three-Phase Traffic Theory and Highway Capacity Abstract Boris S. Kerner Daimler Chrysler AG, RIC/TS, T729, 70546 Stuttgart, Germany Hypotheses
III. DISEÑO OPERACIONAL Y TRÁNSITO
 Estudios Técnicos y Ambientales del Corredor Segregado de Alta Capacidad (COSAC I) y sus terminales de transferencia. III. DISEÑO OPERACIONAL Y TRÁNSITO ANEXO 36. TRÁNSITO III.2. TRANSITO.- ANEXOS. Anexo
1.225 Transportation Flow Systems Quiz (December 17, 2001; Duration: 3 hours)
") 1.225 Transportation Flow Systems Quiz (December 17, 2001; Duration: 3 hours) Student Name: Alias: Instructions: 1. This exam is open-book 2. No cooperation is permitted 3. Please write down your name
1.225 Transportation Flow Systems Quiz (December 17, 2001; Duration: 3 hours) Student Name: Alias: Instructions: 1. This exam is open-book 2. No cooperation is permitted 3. Please write down your name
nario is a hypothetical driving process aiming at testing these models under various driving regimes (such as free flow and car following); the
; the") 1 Preface For years, I have been thinking about writing an introductory book on traffic flow theory. The main purpose is to help readers like me who are new to this subject and do not have much preparation
1 Preface For years, I have been thinking about writing an introductory book on traffic flow theory. The main purpose is to help readers like me who are new to this subject and do not have much preparation
CHAPTER 2 DESCRIBING MOTION: KINEMATICS IN ONE DIMENSION
 CHAPTER 2 DESCRIBING MOTION: KINEMATICS IN ONE DIMENSION OBJECTIVES After studying the material of this chapter, the student should be able to: state from memory the meaning of the key terms and phrases
suppressing traffic flow instabilities
 suppressing traffic flow instabilities S S VF VC VL D D Berthold K.P. Horn Traffic flow instabilities waste energy: At high densities traffic flow becomes unstable Traffic acts as if it was a dilatant
Use. of a Computer and Vehicle Loop Detectors To Measure Queues and Delays At Signalized Intersections
 Use. of a Computer and Vehicle Loop Detectors To Measure Queues and Delays At Signalized ntersections A. CHRSTENSEN, Computing Devices of Canada, Ottaa A computer program has been developed to obtain from
Advancing Traffic Flow Theory Using Empirical Microscopic Data
 MN WI MI IL IN OH USDOT Region V Regional University Transportation Center Final Report NEXTRANS Project No. 174OSUY2.2 Advancing Traffic Flow Theory Using Empirical Microscopic Data By Benjamin Coifman,
Appendix E FTA NOISE MODELING WORKSHEETS AND DETAILED METHODOLOGY
 Appendix E FTA NOISE MODELING WORKSHEETS AND DETAILED METHODOLOGY APPENDIX E General Noise Assessment The FTA General Noise Assessment procedure was used for calculating noise from transit sources associated
Mesoscopic Traffic Flow Model Considering Overtaking Requirements*
 Journal of Highway and Transponation Research and Development Vol. 9,No. 4 (2015)085 Mesoscopic Traffic Flow Model Considering Overtaking Requirements* LU Shou-feng (p ili )1**, WANG Jie(J:. )1, XUE Zhi-gui(M
Analyzing busway Station Potential Capacity under Mixed and Non-Stopping Operation
 Widanapathiranage, Bunker and Bhaskar Analyzing busway Station Potential Capacity under Mixed and Non-Stopping Operation Corresponding Author: Rakkitha Widanapathiranage Civil Engineering and Built Environment
Chapter 2: Motion along a straight line
 Chapter 2: Motion along a straight line This chapter uses the definitions of length and time to study the motions of particles in space. This task is at the core of physics and applies to all objects irregardless
CVS Derwood. Local Area Transportation Review
 CVS Derwood Montgomery County, Maryland May 27, 2016 Local Area Transportation Review Prepared for: JC Bar Properties, Inc. Steve Fleming, PE 415 Fallowfield Road, Suite 301 Camp Hill, Pennsylvania 17011
Using High-Resolution Detector and Signal Data to Support Crash Identification and Reconstruction. Indrajit Chatterjee Gary Davis May, 2011
 Using High-Resolution Detector and Signal Data to Support Crash Identification and Reconstruction Indrajit Chatterjee Gary Davis May, 2011 Introduction Road accidents are complex phenomenon. Causal factors
Impact of Day-to-Day Variability of Peak Hour Volumes on Signalized Intersection Performance
 Impact of Day-to-Day Variability of Peak Hour Volumes on Signalized Intersection Performance Bruce Hellinga, PhD, PEng Associate Professor (Corresponding Author) Department of Civil and Environmental Engineering,
Position, Velocity, and Acceleration. Mr. Miehl
 Position, Velocity, and Acceleration Mr. Miehl www.tesd.net/miehl miehlm@tesd.net Velocity is the rate of change of position with respect to time. Velocity ΔD = Δ T Acceleration is the rate of change of
Cell Transmission Models
 Cell Transmission Models Lecture Notes in Transportation Systems Engineering Prof. Tom V. Mathew Contents 1 Introduction 1 2 Single source and sink CTM model 2 2.1 Basic Premise...................................
arxiv: v2 [physics.soc-ph] 29 Sep 2014
![arxiv: v2 [physics.soc-ph] 29 Sep 2014](/thumbs/87/97179887.jpg "arxiv: v2 [physics.soc-ph] 29 Sep 2014") Universal flow-density relation of single-file bicycle, pedestrian and car motion J. Zhang, W. Mehner, S. Holl, and M. Boltes Jülich Supercomputing Centre, Forschungszentrum Jülich GmbH, 52425 Jülich,
Universal flow-density relation of single-file bicycle, pedestrian and car motion J. Zhang, W. Mehner, S. Holl, and M. Boltes Jülich Supercomputing Centre, Forschungszentrum Jülich GmbH, 52425 Jülich,
Modeling Traffic Flow on Multi-Lane Road: Effects of Lane-Change Manoeuvres Due to an On-ramp
 Global Journal of Pure and Applied Mathematics. ISSN 973-768 Volume 4, Number 28, pp. 389 46 Research India Publications http://www.ripublication.com/gjpam.htm Modeling Traffic Flow on Multi-Lane Road:
Automatic fitting procedure for the fundamental diagram
 Automatic fitting procedure for the fundamental diagram V. L. Knoop PhD Delft University of Technology Transport & Planning Stevinweg 1 Delft, The Netherlands +31 15 278 8413 v.l.knoop@tudelft.nl W. Daamen
The Physics of Traffic Jams: Emergent Properties of Vehicular Congestion
 December 10 2008 David Zeb Rocklin The Physics of Traffic Jams: Emergent Properties of Vehicular Congestion The application of methodology from statistical physics to the flow of vehicles on public roadways
Assessing the uncertainty in micro-simulation model outputs
 Assessing the uncertainty in micro-simulation model outputs S. Zhu 1 and L. Ferreira 2 1 School of Civil Engineering, Faculty of Engineering, Architecture and Information Technology, The University of
An improved CA model with anticipation for one-lane traffic flow
 An improved CA model with anticipation for one-lane traffic flow MARÍA ELENA. LÁRRAGA JESÚS ANTONIO DEL RÍ0 Facultad de Ciencias, Computer Science Dept. Universidad Autónoma del Estado de Morelos Av. Universidad
c) What are cumulative curves, and how are they constructed? (1 pt) A count of the number of vehicles over time at one location (1).
 What are cumulative curves, and how are they constructed? (1 pt) A count of the number of vehicles over time at one location (1).") Exam 4821 Duration 3 hours. Points are indicated for each question. The exam has 5 questions 54 can be obtained. Note that half of the points is not always suffcient for a 6. Use your time wisely! Remarks:
Exam 4821 Duration 3 hours. Points are indicated for each question. The exam has 5 questions 54 can be obtained. Note that half of the points is not always suffcient for a 6. Use your time wisely! Remarks:
Fundamental Relations of Traffic Flow
 Fundamental Relations of Traffic Flow Lecture Notes in Transportation Systems Engineering Prof. Tom V. Mathew Contents 1 Overview 1 Time mean speed (v t ) 3 Space mean speed ( ) 4 Illustration of mean
TRAFFIC IMPACT STUDY. Platte Canyon Villas Arapahoe County, Colorado (Arapahoe County Case Number: Z16-001) For
 For") TRAFFIC IMPACT STUDY For Platte Canyon Villas Arapahoe County, Colorado (Arapahoe County Case Number: Z16-001) February 2015 Revised: August 2015 April 2016 July 2016 September 2016 Prepared for: KB Home
TRAFFIC IMPACT STUDY For Platte Canyon Villas Arapahoe County, Colorado (Arapahoe County Case Number: Z16-001) February 2015 Revised: August 2015 April 2016 July 2016 September 2016 Prepared for: KB Home
SAFLUX Study on Influence of Overtaking Rule on Freeway Performance
 Summary Currently, in countries where automobiles are moving on the right, drivers are required to drive in the right most lane. To overtake another vehicle, they move one lane to the left, pass, and return
Empirical Relation between Stochastic Capacities and Capacities Obtained from the Speed-Flow Diagram
 Empirical Relation between Stochastic Capacities and Capacities Obtained from the Speed-Flow Diagram Dr.-Ing. Justin Geistefeldt Institute for Transportation and Traffic Engineering Ruhr-University Bochum
Enhancing and Calibrating the Rakha-Pasumarthy-Adjerid Car-Following Model using Naturalistic Driving Data
 International Journal of Transportation Science and Technology vol. 3 no. 3 204 pages 229 248 229 Enhancing and Calibrating the Rakha-Pasumarthy-Adjerid Car-Following Model using Naturalistic Driving Data
Solutions to the Problems
 Solutions to the Problems Problems of Chapter 2 2.1 Floating-Car Data GPS data provide space-time data points and (anonymized) IDs of the equipped vehicles. We can obtain their trajectories by connecting
Improved Velocity Estimation Using Single Loop Detectors
 Improved Velocity Estimation Using Single Loop Detectors Benjamin Coifman, PhD Assistant Professor, Civil and Environmental Engineering and Geodetic Science Assistant Professor, Electrical Engineering
Chapter 2 Linear Motion
 Chapter 2 Linear Motion Conceptual Questions 2.1 An object will slow down when its acceleration vector points in the opposite direction to its velocity vector. Recall that acceleration is the change in
Airborne Traffic Flow Data and Traffic Management. Mark Hickman and Pitu Mirchandani
 Airborne Traffic Flow Data and Traffic Management Mark Hickman and Pitu Mirchandani University of Arizona, ATLAS Center Greenshields 75 Symposium July 8-10, 2008 Outline Basics of airborne traffic data
FIRST MIDTERM - REVIEW PROBLEMS
 Physics 10 Spring 009 George Williams FIRST MIDTERM - REVIEW PROBLEMS A data sheet is provided at the end. Problems labeled [Ch. 4] are relevant to the second midterm. 1. Convert 747 m to feet. Convert