Arizona Climate Summary September 2017 Summary of conditions for August 2017
|
|
|
- Irene Hopkins
- 6 years ago
- Views:
Transcription

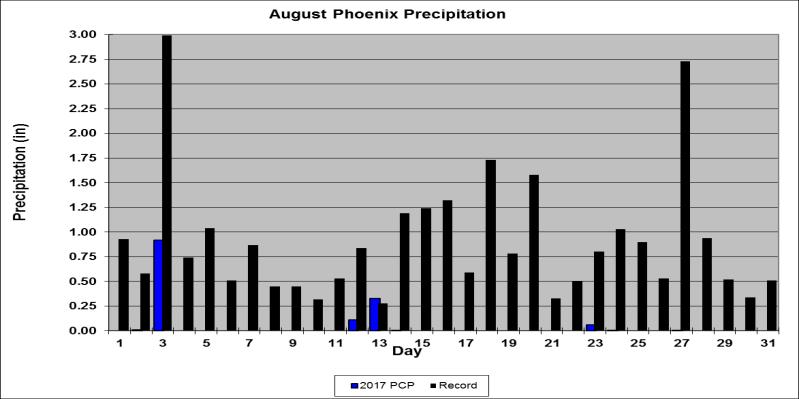
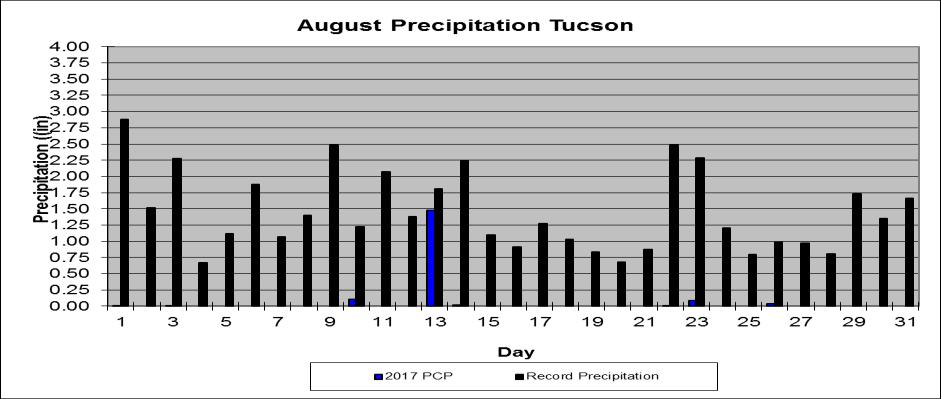
1 August 2017 Temperature and Precipitation Summary Arizona Climate Summary September 2017 Summary of conditions for August 2017 August 1 st 15 th : The monsoon activity that ended July continued into the first week of August before a drying trend began across the state. Moisture was drawn into the state from the southeast. On the 1 st, Safford had 1.37 of rain while Yuma had 0.71, Bisbee had 0.47 and Coronado National Monument had The system moved to the northwest bringing 0.79 to Williams, 0.60 to the Grand Canyon North Rim, 0.69 to the Grand Canyon South Rim, and 0.59 to Prescott on the 2 nd. On the afternoon and evening of the 3 rd, Phoenix Airport had 0.92 while other locations in the valley had as much as 2.28 causing widespread street flooding and extensive damage to the Phoenix Zoo. East Mesa also had over an inch of rain as the activity moved to central Arizona. By the 5 th the center of activity moved back to northern Arizona with Williams receiving 1.12 on the 5 th, and 0.41 on the 6 th and 7 th. Temperatures remained slightly warmer than average this first week, until the 8 th when high pressure moved back over the southern border bringing drier air to Arizona and much higher temperatures to the southwest and central deserts through the 11 th. Rainfall on the 9 th and 10 th was light and fell mostly in southern Arizona, though Flagstaff had 0.14 and Springerville had By the 11 th the high pressure ridge was over western Texas and pumped moisture northward from Mexico into the state, bringing another round of thunderstorms, with the highest rainfall totals in northern and northeastern Arizona. On the 11 th, Bellemont had 0.82, and on the 12 th Springerville had Storms moved across the entire state on the 13 th dropping 2.50 of rain on Castle Hot Springs, just northwest of Phoenix, 1.48 at Tucson, 2.13 at the north rim of the Grand Canyon, 0.78 at Sonora Desert Museum, 1.07 at Bisbee-Douglas, 2.04 at Davis Monthan AFB, 0.46 at Nogales, 2.13 at Eloy, 0.36 at Sky Harbor, and 0.80 at Cottonwood. By the 14 th the high pressure was retreating down into Mexico and a low pressure trough developed across the western state, suppressing the moisture a bit and restricting storms to the higher elevations and the southern counties. On the 14 th Show Low had 0.53 and on the 15 th Coronado National Monument had August 16 th 31 st : On the 16 th, 17 th, and 18 th, the monsoon took a short break. On the 19 th the high pressure had redeveloped over Arizona and began to draw moisture in from the southeast. Bisbee-Douglas had 0.11 of rain on the 19 th and on the 20 th showers were still light but more widespread with 0.30 at Springerville and 0.19 at Flagstaff. By the 21 st more moisture moved in and Williams received 1.20 of rainfall. Seligman had 0.23 and Yuma had 0.83, with 0.28 at Window Rock and 0.59 at the south rim of the Grand Canyon. On the 22 nd the north rim of the Grand Canyon had 0.17, but heavier rain returned on the 23 rd and 24 th with 1.14 at Sonora Desert Museum, and 1.02 at Cottonwood. Drier conditions prevailed on the 25 th and 26 th with only 0.13 at Show Low on the 25 th and 0.03 at Safford on the 26 th. The drier conditions brought higher temperatures to the state with central and western Arizona reaching above 110 o F from the26th through the end of the month. Central Arizona was hit by thunderstorms on the 27 th with Apache Junction receiving Bullhead City got 0.25 on the 27 th. Show Low had 0.44 on the 28 th, with 0.27 at Flagstaff on the 29 th, 0.29 at Williams on the 30 th, and 0.02 at the Grand Canyon south rim on the 31 st. Temperatures remained above 110 o F at the hottest southwest desert locations through the end of the month. Overall this August was fairly typical of the monsoon with mostly wet days statewide, though thunderstorms were quite scattered and localized, and the southwest deserts have had long dry periods between the rain days. In This Issue: Overview of August, graphs of the August daily maximum and minimum temperatures, precipitation, mean daily dew points for Flagstaff, Phoenix, and Tucson; August climate statistics, maps of mean monthly maximum and minimum temperatures, precipitation, dew points, wind speeds for August; and graphs of the mean August temperature and precipitation for the period of record for Tucson, Phoenix, and Flagstaff, graphs of the cumulative precipitation for the calendar year for Flagstaff, Phoenix, and Tucson. Climate calendars for Flagstaff, Phoenix, Tucson, Prescott, Winslow and Yuma, including daily and monthly normals and extremes, for each month of the year, are not yet 1


2 updated through See p.19 of this report for calendar abbreviations. Data are preliminary and are from the National Weather Service Forecast Offices in Flagstaff, Phoenix and Tucson. **Note: The discrepancy between the Statewide Temperature and Precipitation values for Phoenix, Flagstaff and Tucson and the daily values in their graphs are due to the reporting times. Statewide Temperature and Precipitation values are taken at 5pm, while official daily records at the airports are taken from Midnight to Midnight. Dr. Nancy J. Selover, State Climatologist Edited by Nancy J. Selover 2017 Arizona State Climate Office August 2017 Daily Temperature, Precipitation, & Dew Point for Flagstaff, Phoenix, and Tucson 2


3 3
4 4
5 FLAGSTAFF CLIMATE STATISTICS August 2017 This August had no significant ranking for temperature or precipitation. Avg Max Temp (F) 77.8 Normal 78.4 Avg Min Temp (F) 49.6 Normal 50.1 Avg Mean Temp (F) 63.7 Normal 64.2 Departure from Normal (F) Highest Monthly Avg Temp (F) 67.5 in 1944 Lowest Monthly Avg Temp (F) 59.5 in 1968 Highest Temp this month (F): 86 on 27 th Lowest Temp this month (F): 38 on 16 th Record High (F): 93 on 8/02/1902 Record Low (F): 32 on 8/23/1968 No temperature or precipitation records this month: Flagstaff Number of Days of: Minimum Temp 55 o F or higher 3 Minimum Temp 50 o F or lower 19 Maximum Temp 80 o F or higher 13 Maximum Temp 75 o F or lower 7 Heating Degree Days 48 Normal 56 Cooling Degree Days 16 Normal 33 Degree base 65 o F Total August Precipitation 3.29 Normal August Precipitation 3.11 Departure from normal Greatest 24-Hr Precipitation 1.05 on 4 th Total Precipitation Year-to-Date Departure from Normal Total August Snowfall 0.0 Normal 0.0 Record August Snowfall 0.0 Number of Days: Clear 23 Partly Cloudy 8 Cloudy 0 Greatest August Precipitation 8.77 in 1904 Least August Precipitation: 0.26 in 1962 Average Wind Speed Highest Peak Gust 4.2 mph 33 mph from 230 o on 14 th PHOENIX CLIMATE STATISTICS August 2017 This August had no significant ranking for temperature or precipitation. Avg Max Temp(F) Normal Avg Min Temp(F) 82.6 Normal 82.7 Avg Mean Temp (F) 94.0 Normal 93.6 Departure from Normal (F) +0.4 Highest Monthly Avg Temp (F) 98.3 in 2011 Lowest Monthly Avg Temp (F) 84.6 in 1918 Highest Temp this month (F) 111 on 9 th & 27 th Lowest Temp this month (F): 73 on 13 th Record High (F): 117 on 8/14/2015, 8/26/2011 Record Low (F): 58 on 8/20/1917 Temperature or precipitation records this month: 13 th Precip 0.33 set, previous record 0.28 in th HiMin 90 set, previous record 89 in Phoenix Number of Days of: Minimum Temp 80 o F or lower 9 Minimum Temp 90 o F or higher 1 Maximum Temp 100 o F or lower 2 Maximum Temp 110 o F or higher 4 Heating Degree Days 0 Normal 0 Cooling Degree Days 907 Normal 885 Degree base 65 o F Total August Precipitation 1.43 Normal August Precipitation 1.00 Departure from normal Greatest 24-Hr Precipitation 0.92 Total Precipitation Year-to-Date 4.73 Departure from Normal Greatest August Precipitation 5.33 in 1951 Least August Precipitation 0.00 in 1973 and 1975.
6 Number of Days: Clear 13 Partly Cloudy 18 Cloudy 0 Average Wind Speed 6.7 mph Highest Peak Gust 48 mph from 050 o on 3 rd TUCSON CLIMATE STATISTICS August 2017 This August was tied for 8 th warmest with 1995 and had no significant ranking precipitation. Avg Max Temp(F) 99.5 Normal 97.4 Avg Min Temp(F) 75.1 Normal 73.3 Avg Mean Temp(F) 87.3 Normal 85.3 Departure from Normal (F) +2.0 Highest Monthly Avg Temp (F) 90.2 in 1994 Lowest Monthly Avg Temp (F) 80.8 in 1923 Highest Temp this month (F): 106 on 9 th Lowest Temp this month (F): 68 on 13 th, 16 th Record High (F): 112 on 8/1/1993 Record Low (F): 55 on 8/20/1917 Temperature or precipitation records this month: 12 th HiMin 81 tied, first set in th HiMin 81 set, previous record 80 in 2007 Tucson Number of Days of: Minimum Temp 70 o F or lower 2 Minimum Temp 80 o F or higher 2 Maximum Temp 95 o F or lower 3 Maximum Temp 105 o F or higher 1 Heating Degree Days 0 Normal 0 Cooling Degree Days 652 Normal 631 Degree base 65 o F Total August Precipitation 1.74 Normal August Precipitation 2.39 Departure from normal Greatest 24-Hr Precipitation 1.48 on 13 th Total Precipitation Year-to-Date Departure from Normal Greatest August Precipitation 7.93 in 1955 Least August Precipitation: 0.08 in Number of Days: Clear 15 Partly Cloudy 1 Cloudy 0 Average Wind Speed Highest Peak Gust 7.4 mph 44 mph from 130 o on 2 nd Data are from the National Weather Service and the National Climatic Data Center and are preliminary. 6
7 Wind Speeds for August: Day Phoenix Flagstaff Tucson (mph) Avg Max Avg Max Avg Max M M M M M M M M M M M M M Dew Points for August: Daily Average Dew Point ( o F): Day Phx Tuc Flg
8 The 8

9 The minimum temperatures ranged from 25 o F at Sunset Crater to 83 o F at Yuma. The lowest maximum temperature of 71 o F was recorded at Snowslide Canyon, while the highest maximum temperature was 117 o F at Tacna, Ehrenburg, Bullhead City and Havasu. Several locations had no rainfall, while the highest rainfall amounts were 6.04 at Oracle State Park and 5.59 at Hereford 1.1 WSW. The lowest average dew point was 44 o F at Window Rock and Page and the highest was 64 o F at Coolidge. The highest peak wind gust was 53 mph at Paloma. Average wind speeds ranged from 2 mph in Payson to 11 mph at Kingman. 9

10 T August 2017 The highest average minimum temperature was 86 o F at Laughlin-Bullhead City, and the lowest average minimum temperature was 41 o F at Sunset Crater and Sunrise Mountain. The highest average maximum temperature was 111 o F at Havasu and the lowest average maximum temperature was 66 o F at Snowslide Canyon. 10
11 11


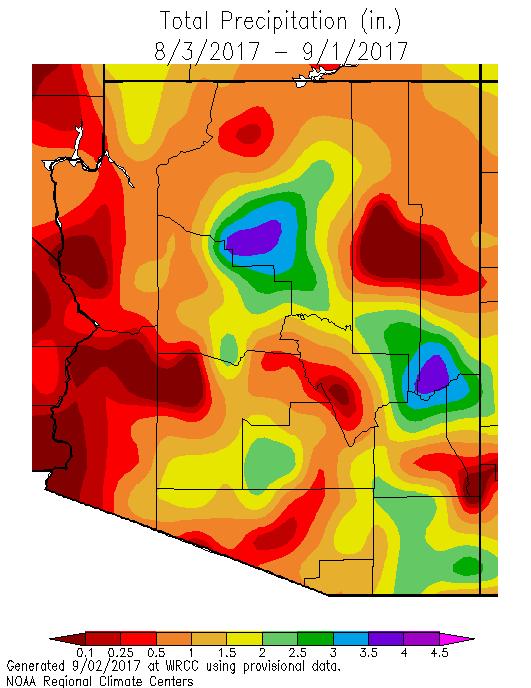
12 August August minimum temperatures were within 2 degrees of normal, though central Gila County was much warmer due to the lack of monsoon activity this month, and the intersection of Gila, Yavapai and Coconino counties was much cooler than normal. Much of Yuma, western La Paz and western Pima counties were 2-4 o F warmer than normal. Daytime temperatures were within 1 o F of normal across much of northern Arizona, with some cooler than normal areas in central Coconino and southern Navajo counties. Southern and west central Arizona were 1-3 o F warmer than normal. Much of the state received less than 70% of normal August precipitation. Central Coconino, southern and eastern Maricopa and western Pinal counties were wetter than normal 12
13 13

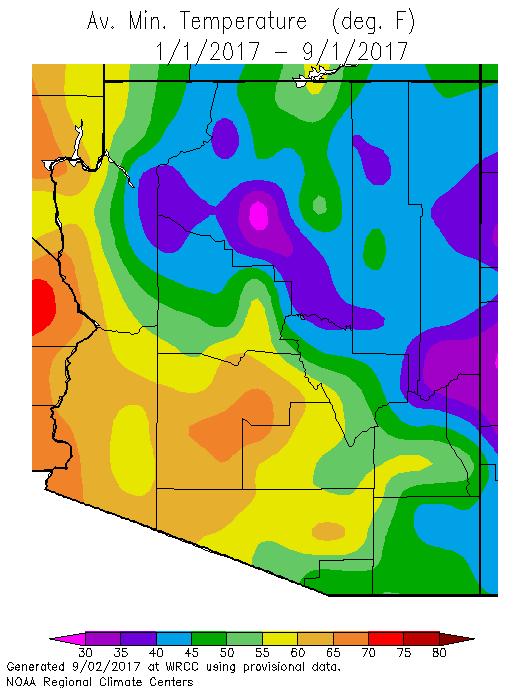
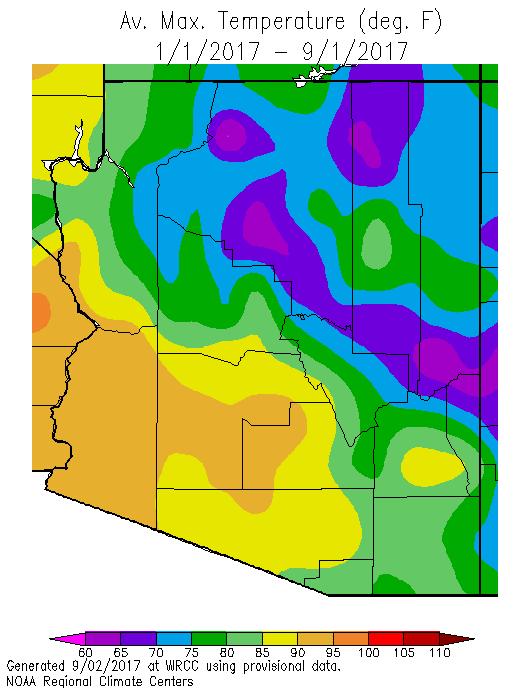
14 Calendar Year 2017 Nighttime temperatures were 0 to 3 o F warmer than average across the state with cooler than normal pockets in La Paz, Cochise, Graham, southern Navajo and western Pima counties. Daytime temperatures were 0 to 4 o F warmer than normal across most of the state with slightly cooler than normal pockets in western Pima, southern Navajo, northwestern Maricopa, and southern Mohave counties. The northern 2/3 of the state has been wetter than normal with the exception of southern Mohave County. There is also a dry pocket in La Paz and Yuma counties and central Navajo County. 14
15 15

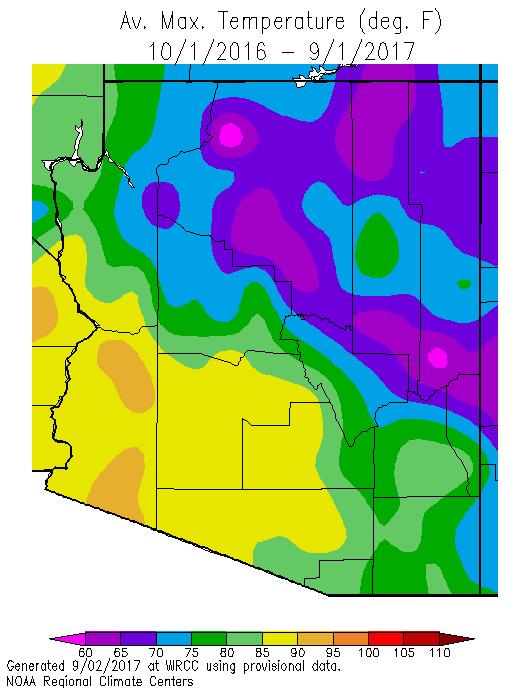
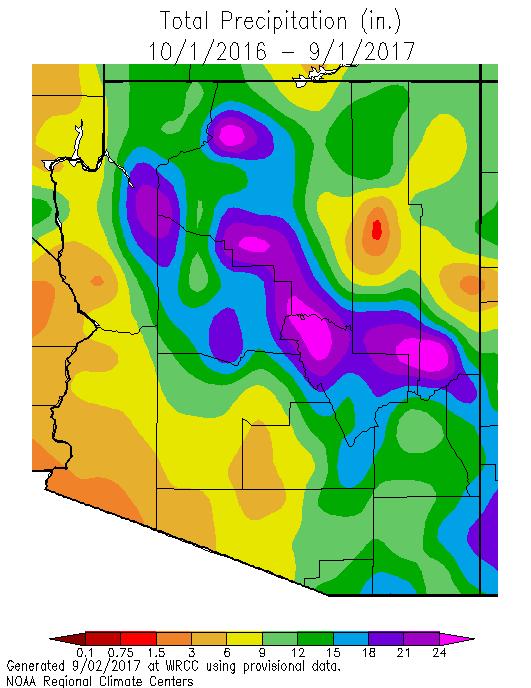
16 2017 Water Year The 2017 Water Year nighttime temperatures have been 0 to 4 o F warmer than average across most of the state. La Paz, southern Graham, northern Cochise, and western Pima counties remain 0 to 2 o F cooler than normal. Daytime temperatures have been 1 to 4 o F warmer than average across the state, and the warmest conditions were found in southern Pima, southern Yavapai and central Navajo counties. The northern 2/3 of Arizona has received over 100% of normal precipitation with a few drier than normal pockets in southern Mohave and central Apache counties. The southern third of the state has been dry, receiving less than 90% of normal precipitation. 16


17 August Mean Temperature Graphs Flagstaff, Phoenix, and Tucson : 17


18 August Mean Precipitation Graphs Flagstaff, Phoenix, and Tucson


19 2017 Cumulative Precipitation Graphs Flagstaff, Phoenix and Tucson: Flagstaff is 3.39 above normal, Tucson is 2.24 above normal, and Phoenix is 0.55 below normal. 19
 LO MAX = Lowest maximum temperature for that day (F) LO MIN = Lowest minimum temperature for that day (F) HI")
20 The downloadable normals and extremes calendars use the following abbreviations: NORM = 30 year ( ) average value (degrees Fahrenheit (F)) OBS = The temperature observation for that day this year AVG = Average daily temperature HI MAX = Highest maximum temperature for that day (F) LO MAX = Lowest maximum temperature for that day (F) LO MIN = Lowest minimum temperature for that day (F) HI MIN = Highest minimum temperature for that day (F) Mx PCP = Maximum precipitation for that day (inches) Mx SNO = Maximum snowfall for that day (inches) 20
Arizona Climate Summary November 2016 Summary of conditions for October 2016
 Arizona Climate Summary November 2016 Summary of conditions for October 2016 October 2016 Temperature and Precipitation Summary October 1 st 16 th : October began with high pressure over Mexico, bringing
Arizona Climate Summary October 2018 Summary of conditions for September 2018
 Arizona Climate Summary October 2018 Summary of conditions for September 2018 September 2018 Temperature and Precipitation Summary September 1 st 17 th : The wet pattern from August continued into September
Arizona Climate Summary
 August 2015 Temperature and Precipitation Summary Arizona Climate Summary September 2015 Summary of conditions for August 2015 August 1 st 16 th : August was a wet month across the state with only 3 days
Arizona Climate Summary September 2018 Summary of conditions for August 2018
 August 2018 Temperature and Precipitation Summary Arizona Climate Summary September 2018 Summary of conditions for August 2018 August 1 st 15 th : August began with high pressure centered over the state
Arizona Climate Summary
 Arizona Climate Summary August 2016 Summary of conditions for July 2016 July 2016 Temperature and Precipitation Summary July 1 st 15 th : As June ended and July began, a shortwave moved through the southwest
Arizona Climate Summary December 2016 Summary of conditions for November 2016
 Arizona Climate Summary December 2016 Summary of conditions for November 2016 November 2016 Temperature and Precipitation Summary November 1 st 16 th : November began with a dry low pressure system moving
Arizona Climate Summary May 2015 Summary of conditions for April 2015
 Arizona Climate Summary May 2015 Summary of conditions for April 2015 April 2015 Temperature and Precipitation Summary April 1 st 16 th : April began with very light showers in Nogales and Coronado National
Arizona Climate Summary January 2017 Summary of conditions for December 2016
 Arizona Climate Summary January 2017 Summary of conditions for December 2016 December 2016 Temperature and Precipitation Summary December 1 st 15 th : Similar to November, December began with a dry trough
Arizona Climate Summary July 2015 Summary of conditions for June 2015
 June 2015 Temperature and Precipitation Summary Arizona Climate Summary July 2015 Summary of conditions for June 2015 June 1 st 14 th : Similar to May, June began with high pressure in the west, and conditions
Arizona Climate Summary November 2018 Summary of conditions for October 2018
 Arizona Climate Summary November 2018 Summary of conditions for October 2018 October 2018 Temperature and Precipitation Summary October 1 st 15 th : The 2018 water year ending September 30 th was exceptionally
Arizona Climate Summary June 2017 Summary of conditions for May 2017
 Arizona Climate Summary June 2017 Summary of conditions for May 2017 May 2017 Temperature and Precipitation Summary May 1 st 16 th : A strong ridge of high pressure developed over the southwest during
Arizona Climate Summary October 2015 Summary of conditions for September 2015
 September 2015 Temperature and Precipitation Summary Arizona Climate Summary October 2015 Summary of conditions for September 2015 September 1 st 18 th : September began with high pressure over southern
Arizona Climate Summary October 2016 Summary of conditions for September 2016
 September 2016 Temperature and Precipitation Summary Arizona Climate Summary October 2016 Summary of conditions for September 2016 September 1 st 14 th : High pressure over the Four Corners brought rainfall
Arizona Climate Summary February 2016 Summary of conditions for January 2016
 January 2016 Temperature and Precipitation Summary Arizona Climate Summary February 2016 Summary of conditions for January 2016 January 1 st 14 th : The new year began with high pressure over the southwest
Arizona Climate Summary
 April 2016 Temperature and Precipitation Summary Arizona Climate Summary May 2016 Summary of conditions for April 2016 April 1 st 15 th : April 1 st saw the tail end of a low pressure system move out of
Arizona Climate Summary February 2018 Summary of conditions for January 2018
 Arizona Climate Summary February 2018 Summary of conditions for January 2018 January 2018 Temperature and Precipitation Summary January 1 st 19 th : The new year began with a ridge of high pressure over
Arizona Climate Summary November 2017 Summary of conditions for October 2017
 Arizona Climate Summary November 2017 Summary of conditions for October 2017 October 2017 Temperature and Precipitation Summary October 1 st 18 th : A low pressure system from the northwestern U.S. moved
Arizona Climate Summary April 2018 Summary of conditions for March 2018
 Arizona Climate Summary April 2018 Summary of conditions for March 2018 March 2018 Temperature and Precipitation Summary March 1 st 16 th : March began with rainfall in southeastern Arizona as the tail
Arizona Climate Summary December 2017 Summary of conditions for November 2017
 November 2017 Temperature and Precipitation Summary Arizona Climate Summary December 2017 Summary of conditions for November 2017 November 1 st 17 th : October ended with a little bit of precipitation
Arizona Climate Summary November 2015 Summary of conditions for October 2015
 October 2015 Temperature and Precipitation Summary Arizona Climate Summary November 2015 Summary of conditions for October 2015 October 1 st 14 th : October began with high pressure over the southwest,
Arizona Climate Summary October 2013
 Arizona Climate Summary October 2013 Summary of conditions for September 2013 September 2013 Temperature and Precipitation Summary September 1 st 16 th : With moist conditions still present throughout
Arizona Climate Summary September 2014 Summary of conditions for August 2014
 Arizona Climate Summary September 2014 Summary of conditions for August 2014 August 2014 Temperature and Precipitation Summary August 1 st 16 th : The first 5 days of August were quite wet with high pressure
Arizona Climate Summary August 2013
 Arizona Climate Summary August 2013 Summary of conditions for July 2013 July 2013 Temperature and Precipitation Summary July 1 st 16 th : To start off the month of July, a high pressure system came in
Arizona Climate Summary
 May 2015 Temperature and Precipitation Summary Arizona Climate Summary June 2015 Summary of conditions for May 2015 May 1 st 14 th : May began with high pressure in the west, and May 1 st was dry statewide,
Arizona Climate Summary June 2013
 Arizona Climate Summary June 2013 Summary of conditions for May 2013 May 2013 Temperature and Precipitation Summary May 1 st 16 th : May began with above normal daily temperatures and breezy conditions
Arizona Climate Summary May 2012
 Arizona Climate Summary May 2012 Summary of conditions for April 2012 April 2012 Temperature and Precipitation Summary April 1 st 16 th : Although April began with another low pressure system sweeping
Arizona Climate Summary May 2018 Summary of conditions for April 2018
 April 2018 Temperature and Precipitation Summary Arizona Climate Summary May 2018 Summary of conditions for April 2018 April 1 st 16 th : April was a very dry month across Arizona. Several low pressure
Arizona Climate Summary
 Arizona Climate Summary April 2014 Summary of conditions for March 2014 March 2014 Temperature and Precipitation Summary March 1 st 16 th : We started off the month of March with a significant precipitation
Arizona Climate Summary February 2012
 Arizona Climate Summary February 2012 Summary of conditions for January 2012 January 2012 Temperature and Precipitation Summary January 1 st 20 th : The New Year has started on a very dry note. The La
Arizona Climate Summary October 2012
 Arizona Climate Summary October 2012 Summary of conditions for September 2012 September 2012 Temperature and Precipitation Summary September 1 st 14 th : September began with an upper level low pressure
Arizona Climate Summary March 2013
 Arizona Climate Summary March 2013 Summary of conditions for February 2013 February 2013 Temperature and Precipitation Summary February 1 st 16 th : February began with a ridge of high pressure over the
Arizona Climate Summary
 Arizona Climate Summary June 2012 Summary of conditions for May 2012 May 2012 Temperature and Precipitation Summary May 1 st 16 th : May began with a surface cold front sweeping across the western states
Arizona Climate Summary
 Arizona Climate Summary March 2014 Summary of conditions for February 2014 February 2014 Temperature and Precipitation Summary February 1 st 16 th : We started off the month of February with some moisture
Arizona Climate Summary April 2013
 Arizona Climate Summary April 2013 Summary of conditions for March 2013 March 2013 Temperature and Precipitation Summary March 1 st 16 th : March began as a ridge of high pressure progressed across the
Arizona Climate Summary May 2013
 Arizona Climate Summary May 2013 Summary of conditions for April 2013 April 2013 Temperature and Precipitation Summary April 1 st 16 th : The first week of April featured a ridge of high pressure over
Arizona Climate Summary November 2013
 Arizona Climate Summary November 2013 Summary of conditions for October 2013 October 2013 Temperature and Precipitation Summary October 1 st 16 th : The month of October started off with fair weather conditions
2012 Growing Season Weather Summary for North Dakota. Adnan Akyüz and Barbara A. Mullins Department of Soil Science October 30, 2012
 2012 Growing Season Weather Summary for North Dakota Adnan Akyüz and Barbara A. Mullins Department of Soil Science October 30, 2012 Introduction The 2012 growing season (the period from April through September)
Monthly Long Range Weather Commentary Issued: July 18, 2014 Steven A. Root, CCM, President/CEO
 Monthly Long Range Weather Commentary Issued: July 18, 2014 Steven A. Root, CCM, President/CEO sroot@weatherbank.com JUNE 2014 REVIEW Climate Highlights The Month in Review The average temperature for
Champaign-Urbana 1998 Annual Weather Summary
 Champaign-Urbana 1998 Annual Weather Summary ILLINOIS STATE WATER SURVEY Audrey Bryan, Weather Observer 2204 Griffith Dr. Champaign, IL 61820 wxobsrvr@sparc.sws.uiuc.edu The development of the El Nìno
Nebraska experienced a wide
 Issue 1 August 2016 CLIMATE UPDATE A MONTHLY SUMMARY FROM THE neclimate.unl.edu August saw reprieve from dryness, cooler temps Overview Nebraska experienced a wide range of conditions across the state
The Weather Wire. Contents: Summer 2018 Outlook. Summer 2018 Outlook Drought Monitor May Summary/Statistics June Preview Rainfall Totals
 The Weather Wire June 2018 Volume 25 Number 6 Contents: Summer 2018 Outlook Drought Monitor May Summary/Statistics June Preview Rainfall Totals Summer 2018 Outlook June 1 st marked the first day of meteorological
Champaign-Urbana 1999 Annual Weather Summary
 Champaign-Urbana 1999 Annual Weather Summary ILLINOIS STATE WATER SURVEY 2204 Griffith Dr. Champaign, IL 61820 wxobsrvr@sws.uiuc.edu Maria Peters, Weather Observer A major snowstorm kicked off the new
The Pennsylvania Observer
 The Pennsylvania Observer August 3, 2015 July 2015 - Pennsylvania Weather Recap By: Arthur Person Although this seventh month of 2015 was fairly normal across Pennsylvania as a whole, the details reveal
Colorado State University, Fort Collins, CO Weather Station Monthly Summary Report
 Colorado State University, Fort Collins, CO Weather Station Monthly Summary Report Month: January Year: 2019 Temperature: Mean T max was 47.2 F which is 3.0 above the 1981-2010 normal for the month. This
January 2006 Climate Summary
 Ashley Brooks (765) 494-6574 Feb 9, 2006 http://www.iclimate.org January 1-3 January 2006 Climate Summary Unseasonably warm conditions welcomed in the New Year with highs in the 40s across the northern
Champaign-Urbana 2001 Annual Weather Summary
 Champaign-Urbana 2001 Annual Weather Summary ILLINOIS STATE WATER SURVEY 2204 Griffith Dr. Champaign, IL 61820 wxobsrvr@sws.uiuc.edu Maria Peters, Weather Observer January: After a cold and snowy December,
The Pennsylvania Observer
 The Pennsylvania Observer The Pennsylvania Observer September 16, 2004 Recap of Pennsylvania's weather from August 6 - September 12, 2004. http://pasc.met.psu.edu/pa_climatologist/nl/archive/20040916/sec1.php
NIDIS Weekly Climate, Water and Drought Assessment Summary. Upper Colorado River Basin July 31, 2012
 NIDIS Weekly Climate, Water and Drought Assessment Summary Upper Colorado River Basin July 31, 2012 Fig. 1: July month-to-date precipitation in inches. Fig. 2: SNOTEL WYTD precipitation percentiles (50%
The Pennsylvania Observer
 The Pennsylvania Observer October 1, 2015 September 2015 - Pennsylvania Weather Recap By: Quinn Lease The month of September will be remembered for its above normal temperatures and dry conditions that
Champaign-Urbana 2000 Annual Weather Summary
 Champaign-Urbana 2000 Annual Weather Summary ILLINOIS STATE WATER SURVEY 2204 Griffith Dr. Champaign, IL 61820 wxobsrvr@sws.uiuc.edu Maria Peters, Weather Observer January: January started on a mild note,
Colorado State University, Fort Collins, CO Weather Station Monthly Summary Report
 Colorado State University, Fort Collins, CO Weather Station Monthly Summary Report Month: December Year: 2017 Temperature: Mean T max was 47.2 F which is 4.4 above the 1981-2010 normal for the month. This
Monthly Long Range Weather Commentary Issued: SEPTEMBER 19, 2016 Steven A. Root, CCM, Chief Analytics Officer, Sr. VP,
 Monthly Long Range Weather Commentary Issued: SEPTEMBER 19, 2016 Steven A. Root, CCM, Chief Analytics Officer, Sr. VP, sroot@weatherbank.com SEPTEMBER 2016 Climate Highlights The Month in Review The contiguous
The Weather Wire. Contents: Wildfires Burning Across Colorado
 The Weather Wire July 2018 Volume 25 Number 7 Contents: Wildfires Burning Across Colorado Drought Monitor June Summary/Statistics July Preview Rainfall Totals Wildfires Burning Across Colorado Following
The Pennsylvania Observer
 The Pennsylvania Observer September 3, 2008 Summer 2008 Weather Summary Written by: Brian Thompson The opening days of June started dry, but a warm front brought a widespread rain a couple of days into
The Pennsylvania Observer
 The Pennsylvania Observer June 2, 2010 May 2010 Pennsylvania Weather Recap This month completed one of the warmest springs on record in Pennsylvania. With about 75% of the days averaging above normal,
Monthly Long Range Weather Commentary Issued: February 15, 2015 Steven A. Root, CCM, President/CEO
 Monthly Long Range Weather Commentary Issued: February 15, 2015 Steven A. Root, CCM, President/CEO sroot@weatherbank.com JANUARY 2015 Climate Highlights The Month in Review During January, the average
Weather and Climate Summary and Forecast Summer 2017
 Weather and Climate Summary and Forecast Summer 2017 Gregory V. Jones Southern Oregon University August 4, 2017 July largely held true to forecast, although it ended with the start of one of the most extreme
2011 Year in Review TORNADOES
 2011 Year in Review The year 2011 had weather events that will be remembered for a long time. Two significant tornado outbreaks in April, widespread damage and power outages from Hurricane Irene in August
New Hampshire State Climate Office Dr. Mary D. Stampone, State Climatologist
 New Hampshire State Climate Office Dr. Mary D. Stampone, State Climatologist University of New Hampshire c/o Department of Geography 73 Main Street Durham, NH 03824 Phone: 603-862-3136 Fax: 603-862-4362
The hydrologic service area (HSA) for this office covers Central Kentucky and South Central Indiana.
 for this office covers Central Kentucky and South Central Indiana.") January 2012 February 13, 2012 An X inside this box indicates that no flooding occurred within this hydrologic service area. January 2012 continued the string of wet months this winter. Rainfall was generally
January 2012 February 13, 2012 An X inside this box indicates that no flooding occurred within this hydrologic service area. January 2012 continued the string of wet months this winter. Rainfall was generally
Investigation of the Arizona Severe Weather Event of August 8 th, 1997
 Investigation of the Arizona Severe Weather Event of August 8 th, 1997 Tim Hollfelder May 10 th, 2006 Abstract Synoptic scale forcings were very weak for these thunderstorms on August 7-8, 1997 over the
National Wildland Significant Fire Potential Outlook
 National Wildland Significant Fire Potential Outlook National Interagency Fire Center Predictive Services Issued: September, 2007 Wildland Fire Outlook September through December 2007 Significant fire
Weather and Climate Summary and Forecast August 2018 Report
 Weather and Climate Summary and Forecast August 2018 Report Gregory V. Jones Linfield College August 5, 2018 Summary: July 2018 will likely go down as one of the top five warmest July s on record for many
CropCast Corn and Soybean Report Kyle Tapley Monday, March 20, 2017
 Accumulated Rainfall (inches) Accumulated GDDs Temperature ( F)/Wind Speed (mph) Precipitation (inches) CropCast Corn and Soybean Report Kyle Tapley Monday, March 20, 2017 Peoria, IL Regional Forecast
May 2016 Volume 23 Number 5
 The Weather Wire May 2016 Volume 23 Number 5 Contents: Winter Summary Current Colorado and West-wide Snow Pack Drought Monitor April Summary/Statistics May Preview Snowfall Totals Winter Summary The Front
Monthly Long Range Weather Commentary Issued: May 15, 2014 Steven A. Root, CCM, President/CEO
 Monthly Long Range Weather Commentary Issued: May 15, 2014 Steven A. Root, CCM, President/CEO sroot@weatherbank.com APRIL 2014 REVIEW Climate Highlights The Month in Review The average temperature for
May 2005 Climate Summary
 Ashley Brooks (765) 494-6574 Jun 7, 2005 http://iclimate.org May 2005 Climate Summary May 1-5 Early May was characterized by an upper-level trough that was in place over Indiana that brought in very cool
Monthly Long Range Weather Commentary Issued: SEPTEMBER 19, 2015 Steven A. Root, CCM, Chief Analytics Officer, Sr. VP, sales
 Monthly Long Range Weather Commentary Issued: SEPTEMBER 19, 2015 Steven A. Root, CCM, Chief Analytics Officer, Sr. VP, sales sroot@weatherbank.com AUGUST 2015 Climate Highlights The Month in Review The
August 2006 Summary. August 1-5
 Ashley Brooks (765) 494-6574 Sep 8, 2006 http://www.iclimate.org August 1-5 August 2006 Summary The heat wave that started during the end of July continued into the beginning parts of August with temperatures
Weather and Climate Summary and Forecast October 2018 Report
 Weather and Climate Summary and Forecast October 2018 Report Gregory V. Jones Linfield College October 4, 2018 Summary: Much of Washington, Oregon, coastal California and the Bay Area and delta region
Arizona Department of Environmental Quality Air Quality Division Air Assessment Section March 17, 2005
 Assessment of Qualification for Treatment Under the Arizona Natural and Exceptional Events Policy for the High Particulates (PM 10 ) Concentration Event in the Buckeye Area on September 18, 2004 Arizona
The Pennsylvania Observer
 The Pennsylvania Observer January 5, 2009 December 2008 Pennsylvania Weather Recap The final month of 2008 was much wetter than average and a bit colder than normal. In spite of this combination, most
Monthly Long Range Weather Commentary Issued: APRIL 25, 2016 Steven A. Root, CCM, Chief Analytics Officer, Sr. VP, sales
 Monthly Long Range Weather Commentary Issued: APRIL 25, 2016 Steven A. Root, CCM, Chief Analytics Officer, Sr. VP, sales sroot@weatherbank.com MARCH 2016 Climate Highlights The Month in Review The March
2018 Year in Review for Central and Southeast Illinois By: Chris Geelhart, Meteorologist National Weather Service, Lincoln IL
 By: Chris Geelhart, Meteorologist National Weather Service, Lincoln IL While 2018 featured some significant out-of-season weather, including below zero temperatures in April and 90-degree highs in early
Colorado State University, Fort Collins, CO Weather Station Monthly Summary Report
 Colorado State University, Fort Collins, CO Weather Station Monthly Summary Report Month: December Year: 2016 Temperature: Mean T max was 39.7 F which is 3.1 below the 1981-2010 normal for the month. This
MIAMI-SOUTH FLORIDA National Weather Service Forecast Office
 MIAMI-SOUTH FLORIDA National Weather Service Forecast Office http://www.weather.gov/miami June 2015 South Florida Weather Summary Dry East, Wet West...Drought Remains SE Florida July 3, 2015: Depending
KANSAS CLIMATE SUMMARY August 2015
 KANSAS CLIMATE SUMMARY August 2015 Cool and Dry August was drier than normal in most of the state. State-wide average precipitation was 2.80 inches or 85 percent of normal. The Northeast division of the
Issued by: National Weather Service San Joaquin Valley - Hanford CA. Issue time: 409 AM PST Wed Jan
 Forecast Information Location: New_Exchequer_Dam Updated: January 16, 2019, 11:45 am NWS Weather Discussion: Issued by: National Weather Service San Joaquin Valley - Hanford CA Issue time: 409 AM PST Wed
Weather and Climate of the Rogue Valley By Gregory V. Jones, Ph.D., Southern Oregon University
 Weather and Climate of the Rogue Valley By Gregory V. Jones, Ph.D., Southern Oregon University The Rogue Valley region is one of many intermountain valley areas along the west coast of the United States.
MIDDAY WEATHER SUMMARY
 MIDDAY WEATHER SUMMARY Weather Headlines TS Cindy will move inland tonight or early tomorrow morning near the Texas/Louisiana border. The latest GFS model run is cooler late in the 6-10 and early in the
PRECIPITATION. Last Week Precipitation:
 2/24/2015 NIDIS Drought and Water Assessment PRECIPITATION The images above use daily precipitation statistics from NWS COOP, CoCoRaHS, and CoAgMet stations. From top to bottom, and left to right: most
July 2007 Climate Summary
 Dan Bowman (765) 494-6574 Sep 3, 2007 http://www.iclimate.org Summary July 2007 Climate Summary The month of July ended as a very unusual month. Many events occurred during the month of July that is not
The Weather Wire. Contents: Hail in Colorado. Hail in Colorado Drought Monitor June Summary/Statistics July Preview Rainfall Totals
 The Weather Wire July 2016 Volume 23 Number 7 Contents: Hail in Colorado Drought Monitor June Summary/Statistics July Preview Rainfall Totals Hail in Colorado Anyone who has lived in Colorado for long
CropCast Corn and Soybean Report Kenny Miller Friday, March 17, 2017
 Accumulated Rainfall (inches) Accumulated GDDs Temperature ( F)/Wind Speed (mph) Precipitation (inches) CropCast Corn and Soybean Report Kenny Miller Friday, March 17, 2017 Peoria, IL Regional Forecast
Weather Conditions during the 1992 Growing Season
 Weather Conditions during the 1992 Growing Season Item Type text; Article Authors Brown, P.; Russell, B. Publisher College of Agriculture, University of Arizona (Tucson, AZ) Journal Cotton: A College of
SOUTHERN CLIMATE MONITOR
 SOUTHERN CLIMATE MONITOR MARCH 2011 VOLUME 1, ISSUE 3 IN THIS ISSUE: Page 2 to 4 Severe Thunderstorm Climatology in the SCIPP Region Page 4 Drought Update Page 5 Southern U.S. Precipitation Summary for
The Pennsylvania Observer
 The Pennsylvania Observer April 2, 2009 March 2009 Pennsylvania Weather Recap Prepared by Curt Harpster For the month of March the saying, In like a lion and out like a lamb really fit the pattern quite
The Pennsylvania Observer
 The Pennsylvania Observer May 31, 2012 May 2012 - Pennsylvania Weather Recap By: Paul Knight The majority of the fifth month had temperatures averaging well above seasonal levels with two distinct hot
Monthly Long Range Weather Commentary Issued: NOVEMBER 16, 2015 Steven A. Root, CCM, Chief Analytics Officer, Sr. VP, sales
 Monthly Long Range Weather Commentary Issued: NOVEMBER 16, 2015 Steven A. Root, CCM, Chief Analytics Officer, Sr. VP, sales sroot@weatherbank.com OCTOBER 2015 Climate Highlights The Month in Review The
Weather and Climate Summary and Forecast November 2017 Report
 Weather and Climate Summary and Forecast November 2017 Report Gregory V. Jones Linfield College November 7, 2017 Summary: October was relatively cool and wet north, while warm and very dry south. Dry conditions
KANSAS CLIMATE SUMMARY January 2018
 KANSAS CLIMATE SUMMARY January 2018 Some welcome moisture After an extended period with little to no moisture, parts of Kansas recorded some significant precipitation. At Tribune, a small snow event on
October 2015 Volume 22 Number 10
 The Weather Wire October 2015 Volume 22 Number 10 Contents: Local Frost/Freeze Information Drought Monitor September Summary/Statistics October Preview Rainfall Totals Local Frost Freeze Information Many
KANSAS CLIMATE SUMMARY May 2018
 KANSAS CLIMATE SUMMARY May 2018 From Cold to Hot May came close to setting the record as the hottest since 1895. The state-wide average temperature for the month was 70.6 o F. This was 7.2 degrees warmer
NIDIS Intermountain West Drought Early Warning System February 12, 2019
 NIDIS Intermountain West Drought Early Warning System February 12, 2019 Precipitation The images above use daily precipitation statistics from NWS COOP, CoCoRaHS, and CoAgMet stations. From top to bottom,
A summary of the heat episodes of June 2017
 A summary of the heat episodes of June 2017 By Richard H. Grumm and Elissa A. Smith National Weather Service State College, PA 1. Overview Over 1800 record high temperatures were set or tied during the
TFS WEATHER BRIEF. Monday, March 25
 TFS WEATHER BRIEF Monday, March 25 Review: The leading edge of cooler and drier air was pushing through Central and East TX this morning. A few lingering thunderstorms were in progress south of I-20 in
The Climate of Texas County
 The Climate of Texas County Texas County is part of the Western High Plains in the north and west and the Southwestern Tablelands in the east. The Western High Plains are characterized by abundant cropland
Climate. Annual Temperature (Last 30 Years) January Temperature. July Temperature. Average Precipitation (Last 30 Years)
 January Temperature. July Temperature. Average Precipitation (Last 30 Years)") Climate Annual Temperature (Last 30 Years) Average Annual High Temp. (F)70, (C)21 Average Annual Low Temp. (F)43, (C)6 January Temperature Average January High Temp. (F)48, (C)9 Average January Low Temp.
Climate Annual Temperature (Last 30 Years) Average Annual High Temp. (F)70, (C)21 Average Annual Low Temp. (F)43, (C)6 January Temperature Average January High Temp. (F)48, (C)9 Average January Low Temp.
The Climate of Murray County
 The Climate of Murray County Murray County is part of the Crosstimbers. This region is a transition between prairies and the mountains of southeastern Oklahoma. Average annual precipitation ranges from
The Pennsylvania Observer
 The Pennsylvania Observer December 2, 2015 November 2015 - Pennsylvania Weather Recap By: Anthny Chiavaroli This November was dry with above average temperatures across the state. Western PA saw some very