Arizona Climate Summary February 2018 Summary of conditions for January 2018
|
|
|
- Gladys Caldwell
- 6 years ago
- Views:
Transcription


1 Arizona Climate Summary February 2018 Summary of conditions for January 2018 January 2018 Temperature and Precipitation Summary January 1 st 19 th : The new year began with a ridge of high pressure over the southwestern U.S. continuing the clear, warm dry conditions we had during late December. Temperatures in the warmer parts of the state were in the upper 70s and lower 80s while the colder locations saw highs in the upper 40s and lower 50s. The high pressure remained in place through the 4 th when a low pressure system began moving down the California coast. The low pressure system reached northern Arizona by the 7 th, dropping light rain at the north and south rims of the Grand Canyon, Canyon de Chelly, Petrified Forest, Springerville, Window Rock, Valle, St. Johns, and Page on the 7 th. The highest amount was 0.10 at the North Rim. This weak system was followed by another stronger low pressure system that crossed Arizona between the 9th and the 12 th. This system had both rain and the first snow of the season. Snowfall on the 10 th totaled 4.7 at Flagstaff Airport, 7.0 at Bellemont, 5.0 at Williams, and 0.2 at the north rim of the Grand Canyon. The storm reached all parts of the state, dropping temperatures to near normal values. During the 4 days, precipitation (liquid water) totals included 1.19 at Flagstaff, 0.24 at Kingman, 0.50 at Grand Canyon Airport, 0.23 at Page, 0.48 at Deer Valley, 0.21 at Sky Harbor, 0.63 at Prescott, 0.13 at Safford, 0.31 at St. Johns, 0.35 at Scottsdale, 0.13 at Sonora Desert Museum, 0.25 at Window Rock, 0.01 at Winslow, 0.17 at Yuma, 0.40 at Alpine, 1.00 at Castle Hot Springs, 0.75 at Carefree, 0.03 at Coronado NM, 0.20 at Cottonwood, 0.30 at East Mesa, 0.65 at Eloy, 0.39 at Apache Junction, 0.42 at Payson, 0.39 at Phantom Ranch, 0.45 at Pinnacle Peak, 0.65 at Seligman, and 0.85 at Show Low. By the 13 th a strong high pressure ridge had returned to the western U.S. and remained in place for a week, forcing some storm systems to the north across the Pacific northwest, Idaho, Montana and Wyoming. January 20 th 31 st : For Arizona, the ridge finally broke down on the 20 th as another cold low pressure system moved down the California coast. For the southwest deserts and warmest parts of the state, temperatures dropped from the mid to upper 70s down into the 60s and upper 50s. In the coldest parts of the state, nighttime temperatures dropped to single digits and negative values. Snow fell across the high elevations of northern and central Arizona from the 20 th through the 22 nd. Snow totals included 9.8 at Flagstaff, 2.1 at Bellemont, 2.5 at Show Low, 2.9 at Payson, 1.5 at Seligman and 3.5 at Williams. Light to moderate rainfall was reported across the entire state with 0.01 at Kingman, 0.03 at Deer Valley, 0.01 at Safford, 0.01 at Scottsdale, 0.02 at Tucson, 0.02 at Winslow, 0.50 at Bisbee, 0.12 at Carefree, 0.02 at East Mesa, 0.12 at Apache Junction, 0.22 at Picacho Peak, 0.18 at Petrified Forest, 0.27 at Show Low, 0.27 at Seligman, and 0.07 at Alpine. This was the last storm of the month for Arizona. By the 24 th, the high pressure ridge had returned and by the 27 th temperatures had risen back into the 80s for the southwest deserts and the 50s and low 60s in the colder locations. The weak La Niña circulation has been quite effective in keeping the southern and central states warm and dry so far this winter. No significant changes are expected for the next few weeks. The warm dry conditions have led to a worsening of drought conditions across California, Arizona, New Mexico, Colorado, Texas, and Oklahoma. In This Issue: Overview of January, graphs of the January daily maximum and minimum temperatures, precipitation, mean daily dew points for Flagstaff, Phoenix, and Tucson; January climate statistics, maps of mean monthly maximum and minimum temperatures, precipitation, dew points, wind speeds for January; short-term drought maps for the beginning and end of January 2018; Long-term Drought Map; and graphs of the mean January temperature and precipitation for the period of record for Tucson, Phoenix, and Flagstaff, graphs of the cumulative precipitation for the calendar year for Flagstaff, Phoenix, and Tucson. Climate calendars for Flagstaff, Phoenix, Tucson, Prescott, Winslow and Yuma, including daily and monthly normals and extremes, for each month of the year, are not yet updated through See p.22 of this report for calendar abbreviations. Data are preliminary and are from the National Weather Service Forecast Offices in Flagstaff, Phoenix and Tucson. Dr. Nancy J. Selover, State Climatologist Edited by Nancy J. Selover 2018 Arizona State Climate Office 1


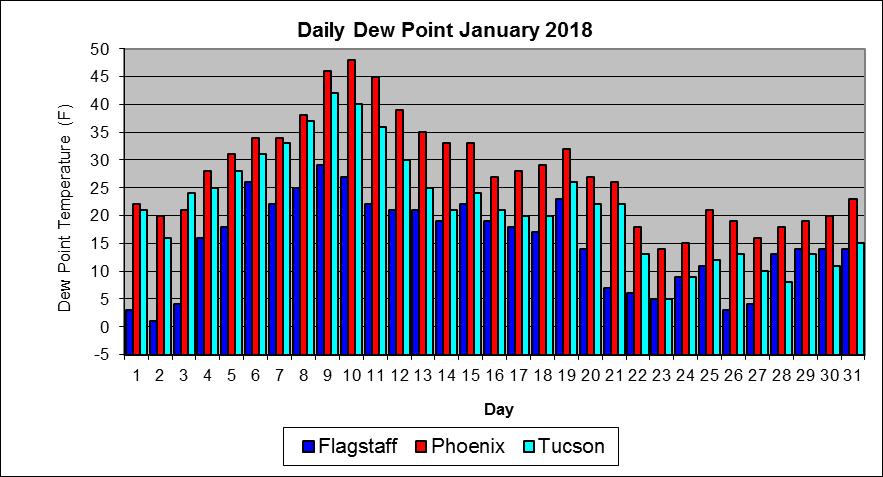
2 **Note: The discrepancy between the Statewide Temperature and Precipitation values for Phoenix, Flagstaff and Tucson and the daily values in their graphs are due to the reporting times. Statewide Temperature and Precipitation values are taken at 5pm, while official daily records at the airports are taken from Midnight to Midnight. January 2018 Daily Temperature, Precipitation, & Dew Point for Flagstaff, Phoenix, and Tucson 2
3 3
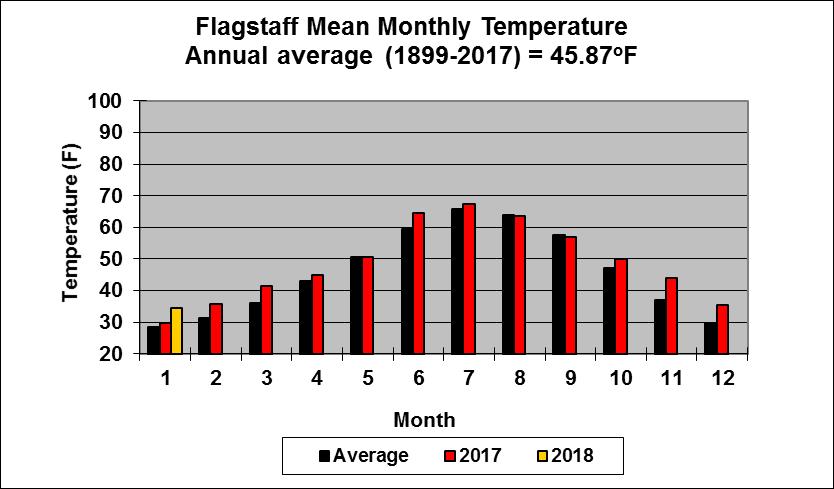
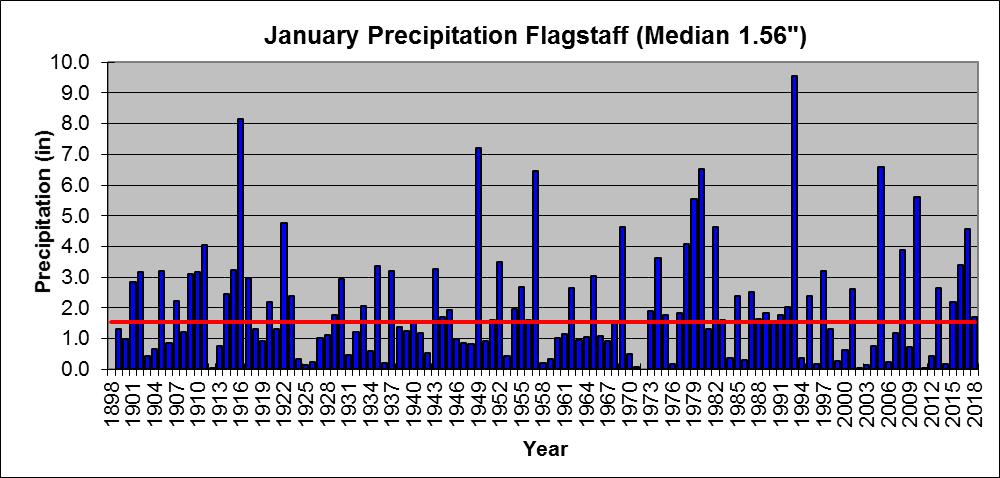
4 FLAGSTAFF CLIMATE STATISTICS January 2018 This January was tied for 6 th warmest with 1900 and had no significant ranking for precipitation. Avg Max Temp(F) 49.6 Normal 42.5 Avg Min Temp(F) 19.3 Normal 17.3 Avg Mean Temp(F) 34.4 Normal 29.9 Departure from Normal (F) +4.5 Highest Monthly Avg Temp (F) 37.1 in 2003 Lowest Monthly Avg Temp (F) 12.7 in 1937 Highest Temp this month (F): 63 on 31 st Lowest Temp this month (F): -2 on 22 nd Record High (F): 66 on 1/30/1971 Record Low (F): -30 on 1/22/1937 Temperature or precipitation records this month: 31 st HiMax 63 tied, first set in 1971 Flagstaff Number of Days of: Minimum Temp 25 o F or higher 4 Minimum Temp 10 o F or lower 5 Maximum Temp 60 o F or higher 9 Maximum Temp 50 o F or lower 15 Heating Degree Days 940 Normal 1088 Cooling Degree Days 0 Normal 0 Degree base 65 o F Total January Precipitation 1.71 Normal January Precipitation 2.05 Departure from normal Greatest 24-Hr Precipitation 1.05 on 9 th Total Precipitation Year-to-Date 1.71 Departure from Normal Total January Snowfall 11.3 Normal 23.2 Record January Snowfall in 1949 Number of Days: Clear 25 Partly Cloudy 5 Cloudy 1 Greatest January Precipitation 9.55 in 1993 Least January Precipitation: 0.00 in 1972 Average Wind Speed Highest Peak Gust 5.9 mph 50 mph from 210 o on 9 th PHOENIX CLIMATE STATISTICS January 2018 This January was the warmest on record and the 15 th driest. Avg Max Temp(F) 73.9 Normal 67.2 Avg Min Temp(F) 48.5 Normal 45.6 Avg Mean Temp (F) 61.2 Normal 56.4 Departure from Normal (F) +4.8 Highest Monthly Avg Temp (F) 61.2 in 2018 Lowest Monthly Avg Temp (F) 46.7 in 1964 Highest Temp this month (F) Lowest Temp this month (F): Record High (F): 88 on 1/19/1971 Record Low (F): 16 on 1/17/ on 25 th 40 on 22 nd and 23 rd 4 Temperature or precipitation records this month: 4 th HiMin 56 set, previous record 54 in th HiMax 83 tied, first set in th HiMax 82 tied, first set in 1935 Phoenix Number of Days of: Minimum Temp 45 o F or lower 6 Minimum Temp 55 o F or higher 2 Maximum Temp 65 o F or lower 5 Maximum Temp 80 o F or higher 5 Heating Degree Days 120 Normal 269 Cooling Degree Days 12 Normal 2 Degree base 65 o F Total January Precipitation 0.21 Normal January Precipitation 0.91 Departure from normal -0.70
5 Greatest 24-Hr Precipitation 0.16 on 9 th Total Precipitation Year-to-Date 0.21 Departure from Normal Greatest January Precipitation 5.22 in 1993 Least January Precipitation 0.00 in 1914, 2006 and 9 other years Number of Days: Clear 8 Partly Cloudy 23 Cloudy 0 Average Wind Speed 5.2 mph Highest Peak Gust 39 mph from 270 o on 20 th TUCSON CLIMATE STATISTICS January 2018 This January was the warmest on record and had no significant ranking for precipitation. Avg Max Temp(F) 73.6 Normal 65.5 Avg Min Temp(F) 44.6 Normal 39.8 Avg Mean Temp(F) 59.1 Normal 52.6 Departure from Normal (F) +6.5 Highest Monthly Avg Temp (F) 59.1 in 2018 Lowest Monthly Avg Temp (F) 41.2 in 1937 Highest Temp this month (F): Lowest Temp this month (F): Record High (F): 88 on 1/04/1927 Record Low (F): 6 on 1/07/ on 30 th 30 on 22 nd and 23 rd Temperature or precipitation records this month: 13 th HiMax 78 tied, first set in th HiMin 52 tied, first set in th HiMin 58 set, previous record 55 in th HiMax 82 tied, first set in 1987 Tucson Number of Days of: Minimum Temp 40 o F or lower 6 Minimum Temp 50 o F or higher 6 Maximum Temp 70 o F or lower 8 Maximum Temp 80 o F or higher 4 Heating Degree Days 180 Normal 383 Cooling Degree Days 0 Normal 0 Degree base 65 o F Total January Precipitation 0.02 Normal January Precipitation 0.94 Departure from normal Greatest 24-Hr Precipitation 0.02 on the 20 th Total Precipitation Year-to-Date 0.02 Departure from Normal Greatest January Precipitation 4.81 in 1993 Least January Precipitation 0.00 in 1972, 1926, 1924, and 9 other years. Number of Days: Clear Partly Cloudy Cloudy Average Wind Speed Highest Peak Gust M M M 7.5 mph 42 mph from 130 o on 29 th Data are from the National Weather Service and the National Climatic Data Center and are preliminary. 5
6 Wind Speeds for January: Day Phoenix Flagstaff Tucson (mph) Avg Max Avg Max Avg Max Dew Points for January: Daily Average Dew Point ( o F): Day Phx Tuc Flg
7 The 7
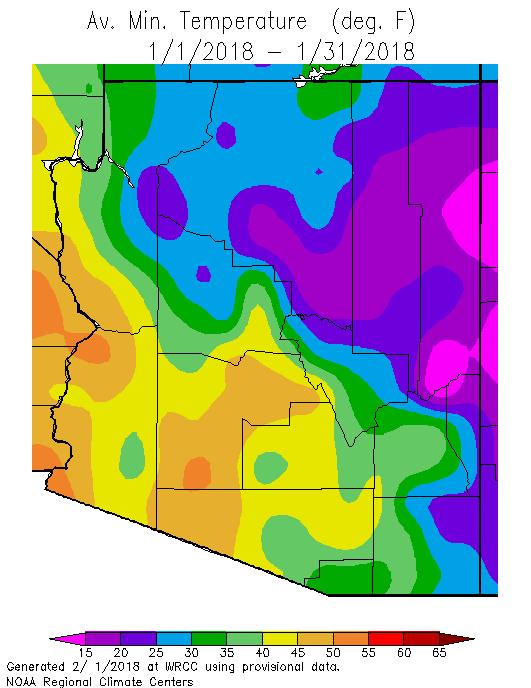
8 January 2018 The minimum temperatures ranged from -13 o F at Fort Valley to 51 o F at Yuma. The lowest maximum temperature of 50 o F was recorded at Bright Angel Ranger Station and the highest was 86 o F at Yuma. The highest rainfall total was 2.53 at Munds Park, south of Flagstaff. The lowest average dew point was 13 o F at Ryan Field and Winslow and the highest was 35 o F at Yuma, Parker and Paloma. The highest peak wind gust was 35 mph at Roll and Mohave. Average wind speeds ranged from 2 mph in Payson and the Phoenix area to 14 mph at Laughlin-Bullhead City Airport. 8

9 T January 2018 The highest average minimum temperature was 60 o F at Yuma, and the lowest average minimum temperature was 11 o F at Sunrise Mountain. The highest average maximum temperature was 79 o F at Organ Pipe Cactus National Monument and the lowest average maximum temperature was 41 o F at Snowslide Canyon. 9
 or worse.")
10 Short term drought maps for January 2 nd on left and January 30 th on right. The warm, dry fall led to increased drought across the state, with all areas of the state in Moderate Drought (D1) or worse. The continued dry conditions in January caused Severe Drought (D2) to expand from eastern Arizona into central and southern Arizona, and Extreme Drought (D3) was introduced in east central and southern Arizona. 10
 and Standardized Precipitation Evaporative Index (SPEI) over the past 24-, 36-, and 48-months.")
11 Long-term drought map for January for Arizona shows hydrologic drought, and is based on both precipitation and evaporation using the Standardized Precipitation Index (SPI) and Standardized Precipitation Evaporative Index (SPEI) over the past 24-, 36-, and 48-months. 11
12 12
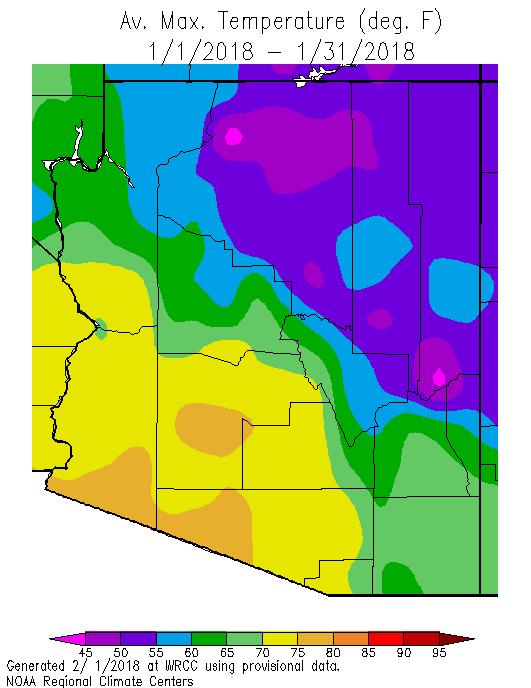
13 January January minimum temperatures in eastern Arizona were generally within 2 o F of average while the western 2/3 of the state was 2 to 6 o F warmer than average. Daytime temperatures were 4 to 10 o F warmer than average across the state. Most of the state received less than 70% of normal January precipitation while southern Arizona and central Navajo County received less than 25% of average. 13
14 14
15 Calendar Year 2018 January minimum temperatures in eastern Arizona were generally within 2 o F of average while the western 2/3 of the state was 2 to 6 o F warmer than average. Daytime temperatures were 4 to 10 o F warmer than average across the state. Most of the state received less than 70% of normal January precipitation while southern Arizona and central Navajo County received less than 25% of average. 15
16 16
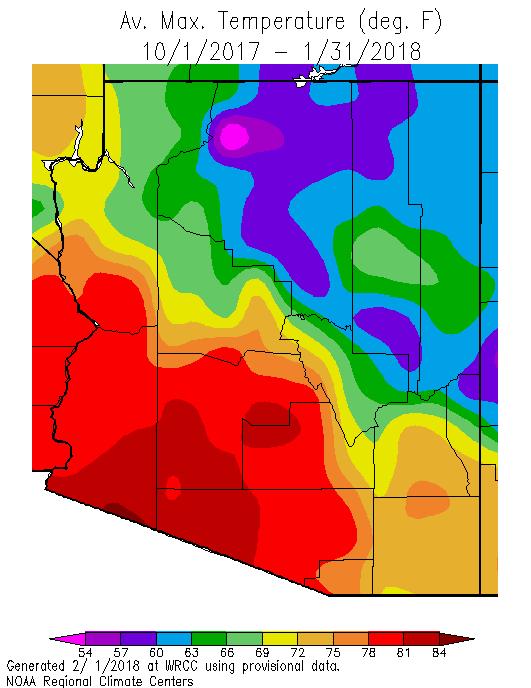
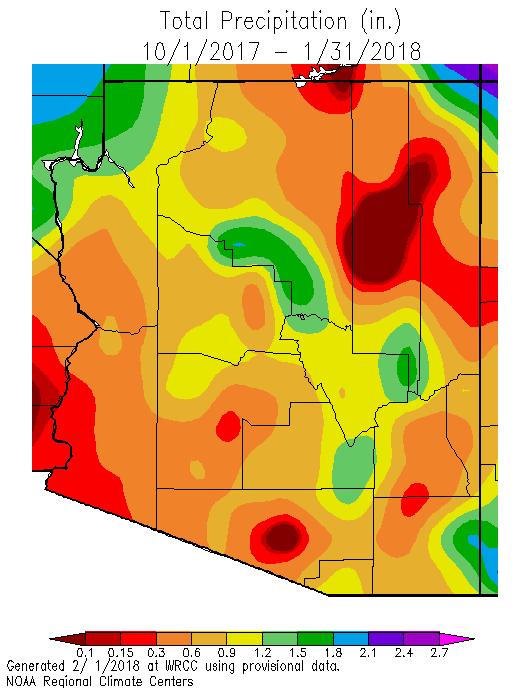
17 s aham, Cochise, La Paz, OPima and 2018 Water Year Water Year 2018 minimum temperatures were 0 to 6 o F warmer than normal across most of the state. La Paz County appears to have been much warmer than normal, but the bullseye may be due to bad data or a station move. Areas of Navajo, Apache and Cochise counties were slightly cooler than normal. Daytime temperatures were 4 to 10 o F warmer than normal across the state. The entire state received less than 50% of normal precipitation since October 1st. 17


18 January Mean Temperature Graphs Flagstaff, Phoenix, and Tucson : 18
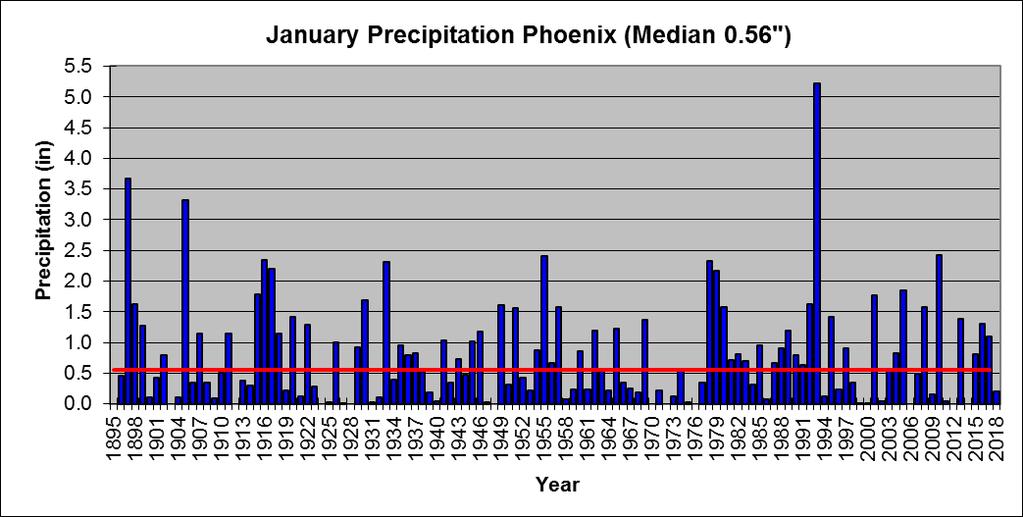
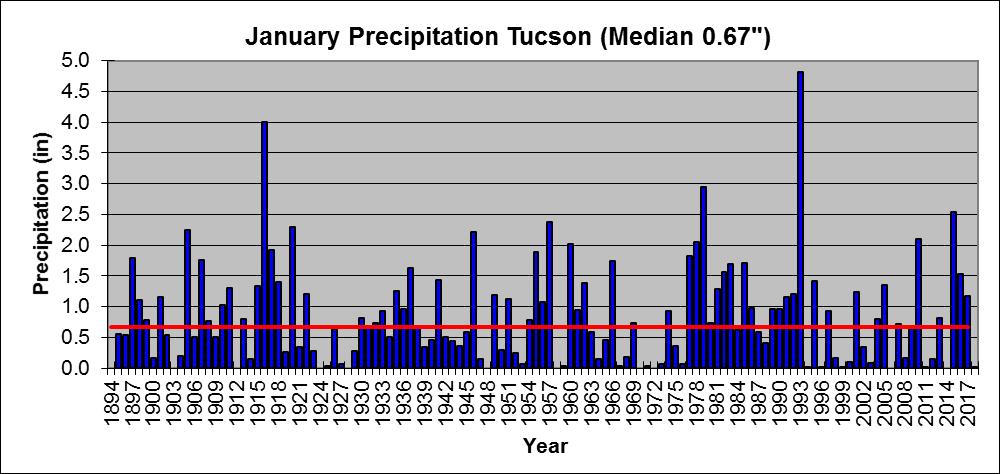
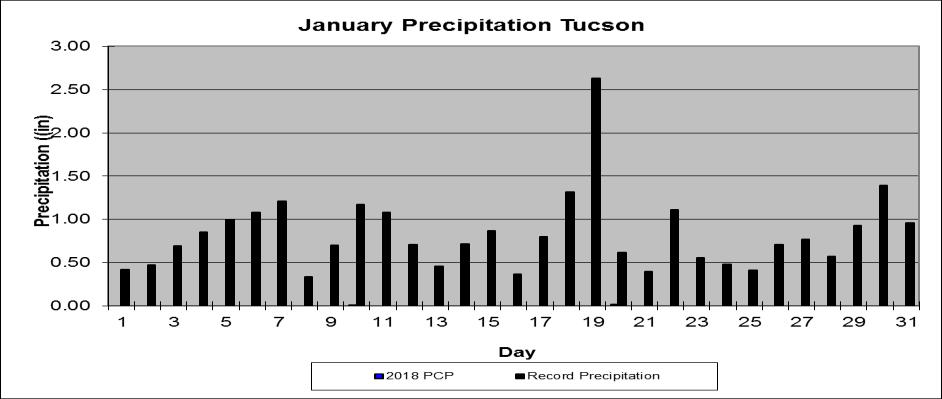
19 January Mean Precipitation Graphs Flagstaff, Phoenix, and Tucson


20 2018 Cumulative Precipitation Graphs Flagstaff, Phoenix and Tucson: Flagstaff is 0.34 below normal, Tucson is 0.92 below normal, and Phoenix is 0.70 below normal. 20
 LO MAX = Lowest maximum temperature for that day (F) LO MIN = Lowest minimum temperature for that day (F) HI")
21 The downloadable normals and extremes calendars use the following abbreviations: NORM = 30 year ( ) average value (degrees Fahrenheit (F)) OBS = The temperature observation for that day this year AVG = Average daily temperature HI MAX = Highest maximum temperature for that day (F) LO MAX = Lowest maximum temperature for that day (F) LO MIN = Lowest minimum temperature for that day (F) HI MIN = Highest minimum temperature for that day (F) Mx PCP = Maximum precipitation for that day (inches) Mx SNO = Maximum snowfall for that day (inches) 21
Arizona Climate Summary April 2018 Summary of conditions for March 2018
 Arizona Climate Summary April 2018 Summary of conditions for March 2018 March 2018 Temperature and Precipitation Summary March 1 st 16 th : March began with rainfall in southeastern Arizona as the tail
Arizona Climate Summary December 2016 Summary of conditions for November 2016
 Arizona Climate Summary December 2016 Summary of conditions for November 2016 November 2016 Temperature and Precipitation Summary November 1 st 16 th : November began with a dry low pressure system moving
Arizona Climate Summary October 2018 Summary of conditions for September 2018
 Arizona Climate Summary October 2018 Summary of conditions for September 2018 September 2018 Temperature and Precipitation Summary September 1 st 17 th : The wet pattern from August continued into September
Arizona Climate Summary November 2018 Summary of conditions for October 2018
 Arizona Climate Summary November 2018 Summary of conditions for October 2018 October 2018 Temperature and Precipitation Summary October 1 st 15 th : The 2018 water year ending September 30 th was exceptionally
Arizona Climate Summary January 2017 Summary of conditions for December 2016
 Arizona Climate Summary January 2017 Summary of conditions for December 2016 December 2016 Temperature and Precipitation Summary December 1 st 15 th : Similar to November, December began with a dry trough
Arizona Climate Summary November 2016 Summary of conditions for October 2016
 Arizona Climate Summary November 2016 Summary of conditions for October 2016 October 2016 Temperature and Precipitation Summary October 1 st 16 th : October began with high pressure over Mexico, bringing
Arizona Climate Summary September 2018 Summary of conditions for August 2018
 August 2018 Temperature and Precipitation Summary Arizona Climate Summary September 2018 Summary of conditions for August 2018 August 1 st 15 th : August began with high pressure centered over the state
Arizona Climate Summary June 2017 Summary of conditions for May 2017
 Arizona Climate Summary June 2017 Summary of conditions for May 2017 May 2017 Temperature and Precipitation Summary May 1 st 16 th : A strong ridge of high pressure developed over the southwest during
Arizona Climate Summary November 2015 Summary of conditions for October 2015
 October 2015 Temperature and Precipitation Summary Arizona Climate Summary November 2015 Summary of conditions for October 2015 October 1 st 14 th : October began with high pressure over the southwest,
Arizona Climate Summary
 April 2016 Temperature and Precipitation Summary Arizona Climate Summary May 2016 Summary of conditions for April 2016 April 1 st 15 th : April 1 st saw the tail end of a low pressure system move out of
Arizona Climate Summary September 2017 Summary of conditions for August 2017
 August 2017 Temperature and Precipitation Summary Arizona Climate Summary September 2017 Summary of conditions for August 2017 August 1 st 15 th : The monsoon activity that ended July continued into the
Arizona Climate Summary December 2017 Summary of conditions for November 2017
 November 2017 Temperature and Precipitation Summary Arizona Climate Summary December 2017 Summary of conditions for November 2017 November 1 st 17 th : October ended with a little bit of precipitation
Arizona Climate Summary
 August 2015 Temperature and Precipitation Summary Arizona Climate Summary September 2015 Summary of conditions for August 2015 August 1 st 16 th : August was a wet month across the state with only 3 days
Arizona Climate Summary
 Arizona Climate Summary August 2016 Summary of conditions for July 2016 July 2016 Temperature and Precipitation Summary July 1 st 15 th : As June ended and July began, a shortwave moved through the southwest
Arizona Climate Summary November 2017 Summary of conditions for October 2017
 Arizona Climate Summary November 2017 Summary of conditions for October 2017 October 2017 Temperature and Precipitation Summary October 1 st 18 th : A low pressure system from the northwestern U.S. moved
Arizona Climate Summary February 2016 Summary of conditions for January 2016
 January 2016 Temperature and Precipitation Summary Arizona Climate Summary February 2016 Summary of conditions for January 2016 January 1 st 14 th : The new year began with high pressure over the southwest
Arizona Climate Summary May 2018 Summary of conditions for April 2018
 April 2018 Temperature and Precipitation Summary Arizona Climate Summary May 2018 Summary of conditions for April 2018 April 1 st 16 th : April was a very dry month across Arizona. Several low pressure
Arizona Climate Summary February 2012
 Arizona Climate Summary February 2012 Summary of conditions for January 2012 January 2012 Temperature and Precipitation Summary January 1 st 20 th : The New Year has started on a very dry note. The La
Arizona Climate Summary October 2016 Summary of conditions for September 2016
 September 2016 Temperature and Precipitation Summary Arizona Climate Summary October 2016 Summary of conditions for September 2016 September 1 st 14 th : High pressure over the Four Corners brought rainfall
Arizona Climate Summary
 May 2015 Temperature and Precipitation Summary Arizona Climate Summary June 2015 Summary of conditions for May 2015 May 1 st 14 th : May began with high pressure in the west, and May 1 st was dry statewide,
Arizona Climate Summary May 2015 Summary of conditions for April 2015
 Arizona Climate Summary May 2015 Summary of conditions for April 2015 April 2015 Temperature and Precipitation Summary April 1 st 16 th : April began with very light showers in Nogales and Coronado National
Arizona Climate Summary July 2015 Summary of conditions for June 2015
 June 2015 Temperature and Precipitation Summary Arizona Climate Summary July 2015 Summary of conditions for June 2015 June 1 st 14 th : Similar to May, June began with high pressure in the west, and conditions
Arizona Climate Summary May 2012
 Arizona Climate Summary May 2012 Summary of conditions for April 2012 April 2012 Temperature and Precipitation Summary April 1 st 16 th : Although April began with another low pressure system sweeping
Arizona Climate Summary October 2015 Summary of conditions for September 2015
 September 2015 Temperature and Precipitation Summary Arizona Climate Summary October 2015 Summary of conditions for September 2015 September 1 st 18 th : September began with high pressure over southern
Arizona Climate Summary March 2013
 Arizona Climate Summary March 2013 Summary of conditions for February 2013 February 2013 Temperature and Precipitation Summary February 1 st 16 th : February began with a ridge of high pressure over the
Arizona Climate Summary October 2013
 Arizona Climate Summary October 2013 Summary of conditions for September 2013 September 2013 Temperature and Precipitation Summary September 1 st 16 th : With moist conditions still present throughout
Arizona Climate Summary June 2013
 Arizona Climate Summary June 2013 Summary of conditions for May 2013 May 2013 Temperature and Precipitation Summary May 1 st 16 th : May began with above normal daily temperatures and breezy conditions
Arizona Climate Summary
 Arizona Climate Summary April 2014 Summary of conditions for March 2014 March 2014 Temperature and Precipitation Summary March 1 st 16 th : We started off the month of March with a significant precipitation
Arizona Climate Summary November 2013
 Arizona Climate Summary November 2013 Summary of conditions for October 2013 October 2013 Temperature and Precipitation Summary October 1 st 16 th : The month of October started off with fair weather conditions
Arizona Climate Summary
 Arizona Climate Summary March 2014 Summary of conditions for February 2014 February 2014 Temperature and Precipitation Summary February 1 st 16 th : We started off the month of February with some moisture
Arizona Climate Summary August 2013
 Arizona Climate Summary August 2013 Summary of conditions for July 2013 July 2013 Temperature and Precipitation Summary July 1 st 16 th : To start off the month of July, a high pressure system came in
Arizona Climate Summary April 2013
 Arizona Climate Summary April 2013 Summary of conditions for March 2013 March 2013 Temperature and Precipitation Summary March 1 st 16 th : March began as a ridge of high pressure progressed across the
Arizona Climate Summary September 2014 Summary of conditions for August 2014
 Arizona Climate Summary September 2014 Summary of conditions for August 2014 August 2014 Temperature and Precipitation Summary August 1 st 16 th : The first 5 days of August were quite wet with high pressure
Arizona Climate Summary May 2013
 Arizona Climate Summary May 2013 Summary of conditions for April 2013 April 2013 Temperature and Precipitation Summary April 1 st 16 th : The first week of April featured a ridge of high pressure over
Arizona Climate Summary
 Arizona Climate Summary June 2012 Summary of conditions for May 2012 May 2012 Temperature and Precipitation Summary May 1 st 16 th : May began with a surface cold front sweeping across the western states
Arizona Climate Summary October 2012
 Arizona Climate Summary October 2012 Summary of conditions for September 2012 September 2012 Temperature and Precipitation Summary September 1 st 14 th : September began with an upper level low pressure
Colorado State University, Fort Collins, CO Weather Station Monthly Summary Report
 Colorado State University, Fort Collins, CO Weather Station Monthly Summary Report Month: December Year: 2017 Temperature: Mean T max was 47.2 F which is 4.4 above the 1981-2010 normal for the month. This
Colorado State University, Fort Collins, CO Weather Station Monthly Summary Report
 Colorado State University, Fort Collins, CO Weather Station Monthly Summary Report Month: January Year: 2019 Temperature: Mean T max was 47.2 F which is 3.0 above the 1981-2010 normal for the month. This
Monthly Long Range Weather Commentary Issued: February 15, 2015 Steven A. Root, CCM, President/CEO
 Monthly Long Range Weather Commentary Issued: February 15, 2015 Steven A. Root, CCM, President/CEO sroot@weatherbank.com JANUARY 2015 Climate Highlights The Month in Review During January, the average
Colorado State University, Fort Collins, CO Weather Station Monthly Summary Report
 Colorado State University, Fort Collins, CO Weather Station Monthly Summary Report Month: February Year: 2017 Webcam catching a hawk watching over the station. Temperature: Mean T max was 54.4 F which
Weather and Climate Summary and Forecast Winter
 Weather and Climate Summary and Forecast Winter 2016-17 Gregory V. Jones Southern Oregon University December 5, 2016 Well after an October that felt more like November, we just finished a November that
Weather and Climate Summary and Forecast February 2018 Report
 Weather and Climate Summary and Forecast February 2018 Report Gregory V. Jones Linfield College February 5, 2018 Summary: For the majority of the month of January the persistent ridge of high pressure
Colorado State University, Fort Collins, CO Weather Station Monthly Summary Report
 Colorado State University, Fort Collins, CO Weather Station Monthly Summary Report Month: December Year: 2016 Temperature: Mean T max was 39.7 F which is 3.1 below the 1981-2010 normal for the month. This
May 2016 Volume 23 Number 5
 The Weather Wire May 2016 Volume 23 Number 5 Contents: Winter Summary Current Colorado and West-wide Snow Pack Drought Monitor April Summary/Statistics May Preview Snowfall Totals Winter Summary The Front
Weather and Climate Summary and Forecast October 2018 Report
 Weather and Climate Summary and Forecast October 2018 Report Gregory V. Jones Linfield College October 4, 2018 Summary: Much of Washington, Oregon, coastal California and the Bay Area and delta region
Weather and Climate Summary and Forecast March 2018 Report
 Weather and Climate Summary and Forecast March 2018 Report Gregory V. Jones Linfield College March 7, 2018 Summary: The ridge pattern that brought drier and warmer conditions from December through most
Monthly Long Range Weather Commentary Issued: APRIL 18, 2017 Steven A. Root, CCM, Chief Analytics Officer, Sr. VP,
 Monthly Long Range Weather Commentary Issued: APRIL 18, 2017 Steven A. Root, CCM, Chief Analytics Officer, Sr. VP, sroot@weatherbank.com MARCH 2017 Climate Highlights The Month in Review The average contiguous
Monthly Long Range Weather Commentary Issued: APRIL 1, 2015 Steven A. Root, CCM, President/CEO
 Monthly Long Range Weather Commentary Issued: APRIL 1, 2015 Steven A. Root, CCM, President/CEO sroot@weatherbank.com FEBRUARY 2015 Climate Highlights The Month in Review The February contiguous U.S. temperature
Champaign-Urbana 2000 Annual Weather Summary
 Champaign-Urbana 2000 Annual Weather Summary ILLINOIS STATE WATER SURVEY 2204 Griffith Dr. Champaign, IL 61820 wxobsrvr@sws.uiuc.edu Maria Peters, Weather Observer January: January started on a mild note,
Monthly Long Range Weather Commentary Issued: NOVEMBER 16, 2015 Steven A. Root, CCM, Chief Analytics Officer, Sr. VP, sales
 Monthly Long Range Weather Commentary Issued: NOVEMBER 16, 2015 Steven A. Root, CCM, Chief Analytics Officer, Sr. VP, sales sroot@weatherbank.com OCTOBER 2015 Climate Highlights The Month in Review The
Weather and Climate Summary and Forecast January 2018 Report
 Weather and Climate Summary and Forecast January 2018 Report Gregory V. Jones Linfield College January 5, 2018 Summary: A persistent ridge of high pressure over the west in December produced strong inversions
Weather and Climate Summary and Forecast Winter
 Weather and Climate Summary and Forecast Winter 2016-17 Gregory V. Jones Southern Oregon University February 7, 2017 What a difference from last year at this time. Temperatures in January and February
October 2015 Volume 22 Number 10
 The Weather Wire October 2015 Volume 22 Number 10 Contents: Local Frost/Freeze Information Drought Monitor September Summary/Statistics October Preview Rainfall Totals Local Frost Freeze Information Many
Weather and Climate Summary and Forecast November 2017 Report
 Weather and Climate Summary and Forecast November 2017 Report Gregory V. Jones Linfield College November 7, 2017 Summary: October was relatively cool and wet north, while warm and very dry south. Dry conditions
Champaign-Urbana 2001 Annual Weather Summary
 Champaign-Urbana 2001 Annual Weather Summary ILLINOIS STATE WATER SURVEY 2204 Griffith Dr. Champaign, IL 61820 wxobsrvr@sws.uiuc.edu Maria Peters, Weather Observer January: After a cold and snowy December,
Monthly Long Range Weather Commentary Issued: July 18, 2014 Steven A. Root, CCM, President/CEO
 Monthly Long Range Weather Commentary Issued: July 18, 2014 Steven A. Root, CCM, President/CEO sroot@weatherbank.com JUNE 2014 REVIEW Climate Highlights The Month in Review The average temperature for
National Wildland Significant Fire Potential Outlook
 National Wildland Significant Fire Potential Outlook National Interagency Fire Center Predictive Services Issued: September, 2007 Wildland Fire Outlook September through December 2007 Significant fire
Weather and Climate Summary and Forecast April 2018 Report
 Weather and Climate Summary and Forecast April 2018 Report Gregory V. Jones Linfield College April 4, 2018 Summary: A near Miracle March played out bringing cooler and wetter conditions to the majority
2011 Year in Review TORNADOES
 2011 Year in Review The year 2011 had weather events that will be remembered for a long time. Two significant tornado outbreaks in April, widespread damage and power outages from Hurricane Irene in August
April 2011 Volume 18 Number 4
 The Weather Wire April 2011 Volume 18 Number 4 Contents: Winter Summary to Date Drought Monitor March Summary/Statistics April Preview Sunrise/Sunset Snow Totals Winter Summary to Date The Front Range
The Pennsylvania Observer
 The Pennsylvania Observer April 2, 2009 March 2009 Pennsylvania Weather Recap Prepared by Curt Harpster For the month of March the saying, In like a lion and out like a lamb really fit the pattern quite
The Weather Wire. Contents: Summer 2018 Outlook. Summer 2018 Outlook Drought Monitor May Summary/Statistics June Preview Rainfall Totals
 The Weather Wire June 2018 Volume 25 Number 6 Contents: Summer 2018 Outlook Drought Monitor May Summary/Statistics June Preview Rainfall Totals Summer 2018 Outlook June 1 st marked the first day of meteorological
Champaign-Urbana 1999 Annual Weather Summary
 Champaign-Urbana 1999 Annual Weather Summary ILLINOIS STATE WATER SURVEY 2204 Griffith Dr. Champaign, IL 61820 wxobsrvr@sws.uiuc.edu Maria Peters, Weather Observer A major snowstorm kicked off the new
Weather and Climate Summary and Forecast Fall/Winter 2016
 Weather and Climate Summary and Forecast Fall/Winter 2016 Gregory V. Jones Southern Oregon University November 5, 2016 After a year where we were seemingly off by a month in terms of temperatures (March
November 2017 Volume 24 Number 11
 The Weather Wire November 2017 Volume 24 Number 11 Contents: Colorado Snow Statistics Drought Monitor October Summary/Statistics November Preview Snowfall Totals Rainfall Totals Colorado Snow Statistics
Weather and Climate Summary and Forecast Summer 2017
 Weather and Climate Summary and Forecast Summer 2017 Gregory V. Jones Southern Oregon University August 4, 2017 July largely held true to forecast, although it ended with the start of one of the most extreme
The Pennsylvania Observer
 The Pennsylvania Observer January 5, 2009 December 2008 Pennsylvania Weather Recap The final month of 2008 was much wetter than average and a bit colder than normal. In spite of this combination, most
The hydrologic service area (HSA) for this office covers Central Kentucky and South Central Indiana.
 for this office covers Central Kentucky and South Central Indiana.") January 2012 February 13, 2012 An X inside this box indicates that no flooding occurred within this hydrologic service area. January 2012 continued the string of wet months this winter. Rainfall was generally
January 2012 February 13, 2012 An X inside this box indicates that no flooding occurred within this hydrologic service area. January 2012 continued the string of wet months this winter. Rainfall was generally
Weather and Climate Summary and Forecast August 2018 Report
 Weather and Climate Summary and Forecast August 2018 Report Gregory V. Jones Linfield College August 5, 2018 Summary: July 2018 will likely go down as one of the top five warmest July s on record for many
Monthly Long Range Weather Commentary Issued: SEPTEMBER 19, 2015 Steven A. Root, CCM, Chief Analytics Officer, Sr. VP, sales
 Monthly Long Range Weather Commentary Issued: SEPTEMBER 19, 2015 Steven A. Root, CCM, Chief Analytics Officer, Sr. VP, sales sroot@weatherbank.com AUGUST 2015 Climate Highlights The Month in Review The
Weather and Climate Summary and Forecast December 2017 Report
 Weather and Climate Summary and Forecast December 2017 Report Gregory V. Jones Linfield College December 5, 2017 Summary: November was relatively cool and wet from central California throughout most of
The Pennsylvania Observer
 The Pennsylvania Observer March 4, 2009 February 2009 Pennsylvania Weather Recap Prepared by Chris Slocum In Punxsutawney, Pa, the world's most famous groundhog, Punxsutawney Phil, spotted his shadow on
Monthly Long Range Weather Commentary Issued: SEPTEMBER 19, 2016 Steven A. Root, CCM, Chief Analytics Officer, Sr. VP,
 Monthly Long Range Weather Commentary Issued: SEPTEMBER 19, 2016 Steven A. Root, CCM, Chief Analytics Officer, Sr. VP, sroot@weatherbank.com SEPTEMBER 2016 Climate Highlights The Month in Review The contiguous
Alaska Statewide Climate Summary December 2018
 Alaska Statewide Climate Summary December 2018 The following report provides an overview of the December 2018 weather. The report is based on preliminary data from selected weather stations throughout
KANSAS CLIMATE SUMMARY January 2018
 KANSAS CLIMATE SUMMARY January 2018 Some welcome moisture After an extended period with little to no moisture, parts of Kansas recorded some significant precipitation. At Tribune, a small snow event on
Monthly Long Range Weather Commentary Issued: May 15, 2014 Steven A. Root, CCM, President/CEO
 Monthly Long Range Weather Commentary Issued: May 15, 2014 Steven A. Root, CCM, President/CEO sroot@weatherbank.com APRIL 2014 REVIEW Climate Highlights The Month in Review The average temperature for
Weather and Climate Summary and Forecast Summer 2016
 Weather and Climate Summary and Forecast Summer 2016 Gregory V. Jones Southern Oregon University June 6, 2016 May 2016 continued the warm trend for portions of the west, while providing some relief for
The Weather Wire. Current Colorado Snowpack. Contents:
 The Weather Wire January 2019 Volume 26 Number 1 Contents: Current Colorado Snowpack Denver Snowfall Since 1999-2000 Denver 2018 Climate Review Drought Monitor December Summary/Statistics January Preview
A summary of the weather year based on data from the Zumwalt weather station
 ZUMWALT PRAIRIE WEATHER 2016 A summary of the weather year based on data from the Zumwalt weather station Figure 1. An unusual summer storm on July 10, 2016 brought the second-largest precipitation day
The following information is provided for your use in describing climate and water supply conditions in the West as of April 1, 2003.
 Natural Resources Conservation Service National Water and Climate Center 101 SW Main Street, Suite 1600 Portland, OR 97204-3224 Date: April 8, 2003 Subject: April 1, 2003 Western Snowpack Conditions and
The Weather Wire. Current Colorado Snowpack. Contents:
 The Weather Wire December 2018 Volume 25 Number 12 Contents: Current Colorado Snowpack Drought Monitor November Summary/Statistics December Preview Snowfall Totals Current Colorado Snowpack Although snowfall
Weather and Climate of the Rogue Valley By Gregory V. Jones, Ph.D., Southern Oregon University
 Weather and Climate of the Rogue Valley By Gregory V. Jones, Ph.D., Southern Oregon University The Rogue Valley region is one of many intermountain valley areas along the west coast of the United States.
NIDIS Drought and Water Assessment
 NIDIS Drought and Water Assessment PRECIPITATION The images above use daily precipitation statistics from NWS COOP, CoCoRaHS, and CoAgMet stations. From top to bottom, and left to right: most recent 7-days
NIDIS Intermountain West Drought Early Warning System December 11, 2018
 NIDIS Drought and Water Assessment NIDIS Intermountain West Drought Early Warning System December 11, 2018 Precipitation The images above use daily precipitation statistics from NWS COOP, CoCoRaHS, and
Climate. Annual Temperature (Last 30 Years) January Temperature. July Temperature. Average Precipitation (Last 30 Years)
 January Temperature. July Temperature. Average Precipitation (Last 30 Years)") Climate Annual Temperature (Last 30 Years) Average Annual High Temp. (F)70, (C)21 Average Annual Low Temp. (F)43, (C)6 January Temperature Average January High Temp. (F)48, (C)9 Average January Low Temp.
Climate Annual Temperature (Last 30 Years) Average Annual High Temp. (F)70, (C)21 Average Annual Low Temp. (F)43, (C)6 January Temperature Average January High Temp. (F)48, (C)9 Average January Low Temp.
PRECIPITATION. Last Week Precipitation:
 2/24/2015 NIDIS Drought and Water Assessment PRECIPITATION The images above use daily precipitation statistics from NWS COOP, CoCoRaHS, and CoAgMet stations. From top to bottom, and left to right: most
Monthly Long Range Weather Commentary Issued: APRIL 25, 2016 Steven A. Root, CCM, Chief Analytics Officer, Sr. VP, sales
 Monthly Long Range Weather Commentary Issued: APRIL 25, 2016 Steven A. Root, CCM, Chief Analytics Officer, Sr. VP, sales sroot@weatherbank.com MARCH 2016 Climate Highlights The Month in Review The March
JEFF JOHNSON S Winter Weather Outlook
 JEFF JOHNSON S 2017-2018 Winter Weather Outlook TABLE OF CONTENTS ABOUT THE AUTHOR Components of the seasonal outlook... 2 ENSO state/ocean temperatures... 3 Sub-seasonal outlooks... 4 Forecast models...
2015: A YEAR IN REVIEW F.S. ANSLOW
 2015: A YEAR IN REVIEW F.S. ANSLOW 1 INTRODUCTION Recently, three of the major centres for global climate monitoring determined with high confidence that 2015 was the warmest year on record, globally.
2012 Growing Season Weather Summary for North Dakota. Adnan Akyüz and Barbara A. Mullins Department of Soil Science October 30, 2012
 2012 Growing Season Weather Summary for North Dakota Adnan Akyüz and Barbara A. Mullins Department of Soil Science October 30, 2012 Introduction The 2012 growing season (the period from April through September)
Champaign-Urbana 1998 Annual Weather Summary
 Champaign-Urbana 1998 Annual Weather Summary ILLINOIS STATE WATER SURVEY Audrey Bryan, Weather Observer 2204 Griffith Dr. Champaign, IL 61820 wxobsrvr@sparc.sws.uiuc.edu The development of the El Nìno
NIDIS Intermountain West Drought Early Warning System January 15, 2019
 NIDIS Drought and Water Assessment NIDIS Intermountain West Drought Early Warning System January 15, 2019 Precipitation The images above use daily precipitation statistics from NWS COOP, CoCoRaHS, and
Weather and Climate Summary and Forecast October 2017 Report
 Weather and Climate Summary and Forecast October 2017 Report Gregory V. Jones Linfield College October 4, 2017 Summary: Typical variability in September temperatures with the onset of fall conditions evident
Weather and Climate Summary and Forecast January 2019 Report
 Weather and Climate Summary and Forecast January 2019 Report Gregory V. Jones Linfield College January 4, 2019 Summary: December was mild and dry over much of the west, while the east was much warmer than
1.Introduction 2.Relocation Information 3.Tourism 4.Population & Demographics 5.Education 6.Employment & Income 7.City Fees & Taxes 8.
 1.Introduction 2.Relocation Information 3.Tourism 4.Population & Demographics 5.Education 6.Employment & Income 7.City Fees & Taxes 8.Recreation & Activities 9.Climate Data 10.Economic Development History
The Pennsylvania Observer
 The Pennsylvania Observer October 1, 2015 September 2015 - Pennsylvania Weather Recap By: Quinn Lease The month of September will be remembered for its above normal temperatures and dry conditions that
KANSAS CLIMATE SUMMARY February 2015
 KANSAS CLIMATE SUMMARY February 2015 Extended Cold Despite some record warm readings at a few locations, February was characterized by colder than normal conditions. This was particularly true during the
Colorado CoCoRaHS. Colorado CoCoRaHS. Because Every Drop Counts! November 2014 Volume 2, Issue 11
 U.S. PRECIPITATION (% OF AVERAGE) LOOKING BACK AT OCTOBER 2014 October was a fairly dry month for much of the nation with the exception of the Pacific Northwest, portions of New England and the Tennessee
Weather and Climate Summary and Forecast March 2019 Report
 Weather and Climate Summary and Forecast March 2019 Report Gregory V. Jones Linfield College March 2, 2019 Summary: Dramatic flip from a mild winter to a top five coldest February on record in many locations
NIDIS Intermountain West Drought Early Warning System October 17, 2017
 NIDIS Drought and Water Assessment NIDIS Intermountain West Drought Early Warning System October 17, 2017 Precipitation The images above use daily precipitation statistics from NWS COOP, CoCoRaHS, and