Arizona Climate Summary October 2012
|
|
|
- Rafe Hamilton
- 6 years ago
- Views:
Transcription


1 Arizona Climate Summary October 2012 Summary of conditions for September 2012 September 2012 Temperature and Precipitation Summary September 1 st 14 th : September began with an upper level low pressure system moving across Utah, generating some showers in the northern half of the state. Temperatures remained in near 110 o F for the first week of the month along the lower Colorado River valley. By the 3 rd, high pressure had returned to the southwest, bringing monsoonal flow and thunderstorms to Arizona, which continued through the 9th. Rainfall totals included 1.00 on the 3 rd in Nogales, 0.62 on the 4 th in Seligman, 1.38 on the 6 th in Nogales, 1.30 on the 7 th in East Mesa, and 1.04 on the 8 th at Coronado National Monument. On the 9 th, another upper level low pressure system moved in the southwest, generating more showers and thunderstorms that lasted through the 14 th. Totals included 0.49 in Grand Canyon National Park on the 10 th, 1.40 on the 11 th at Organ Pipe National Monument and 1.10 at Navajo National Monument, 1.05 at Bisbee on the 12 th and 0.18 at Phoenix Deer Valley on the 13 th. The humidity brought temperatures down 5 to 10 degrees during this time. By the 14 th, the high pressure had move over Nevada, resulting in northerly or northeasterly winds, bringing drier air into the state. As the humidity dropped, we saw our first freezing temperatures in the state on the 14 th, with 31 o F at Alpine. On the 15 th, Fort Valley near Flagstaff had a low of 32 o F. For the Phoenix area, the monsoon ended on the 13 th. September 15 th 30 th : Starting on the 15 th, a strong ridge of high pressure developed off the west coast bringing dry northwesterly or westerly flow. Temperatures began to climb again reaching 5-8 o F above normal over the next week or so. Daytime highs ranged from o F along the lower Colorado River valley including Bullhead City and Yuma. The southwest deserts saw highs reach o F. Northern Arizona and the higher elevations saw temperatures in the 80s and 90s, while the highest elevations had highs in the 70s. Nighttime temperatures finally dropped into the 60s to 70s in most locations. On the 19 th and 21 st, Alpine had nighttime temperatures of 23 o F. On the 24 th a weak upper level low pressure system passed through Utah and brought a few showers to northern Arizona, and Window Rock reported 0.02 on the 25 th. As the system moved off to the northeast, clear skies returned. On the 28 th, the tail end of the low pressure system tapped into some sub-tropical moisture over northern Mexico, and showers and thunderstorms were reported across southeastern Arizona. Nogales, Sierra Vista, Elgin and Bowie all had rainfall, with the highest, 0.23, reported at Bowie. The system cleared out and skies remained clear through the end of the month with temperatures rising again. In This Issue: Overview of September and the monsoon, graphs of the September daily maximum and minimum temperatures, precipitation, mean daily dew points for Flagstaff, Phoenix, and Tucson; September climate statistics, maps of mean monthly maximum and minimum temperatures, precipitation, dew points, wind speeds for September; and graphs of the mean September temperature and precipitation for the period of record for Tucson, Phoenix, and Flagstaff, graphs of the cumulative precipitation for the calendar year for Flagstaff, Phoenix, and Tucson. Climate calendars for Flagstaff, Phoenix, Tucson, Prescott, Winslow and Yuma, including daily and monthly normals and extremes, for each month of the year, can be downloaded directly from the State Climate website. See p. 19 of this report for calendar abbreviations. Data are preliminary and are from the National Weather Service Forecast Offices in Flagstaff, Phoenix and Tucson. **Note: The discrepancy between the Statewide Temperature and Precipitation values for Phoenix, Flagstaff and Tucson and the daily values in their graphs are due to the reporting times. Statewide Temperature and Precipitation values are taken at 5pm, while official daily records at the airports are taken from Midnight to Midnight. State Climate Office Dr. Nancy J. Selover, State Climatologist Tel: Arizona State Climate Office 1 School of Geographical Sciences & Urban Planning Arizona State University Tempe, AZ Edited by Nancy J. Selover & Matt Salerno


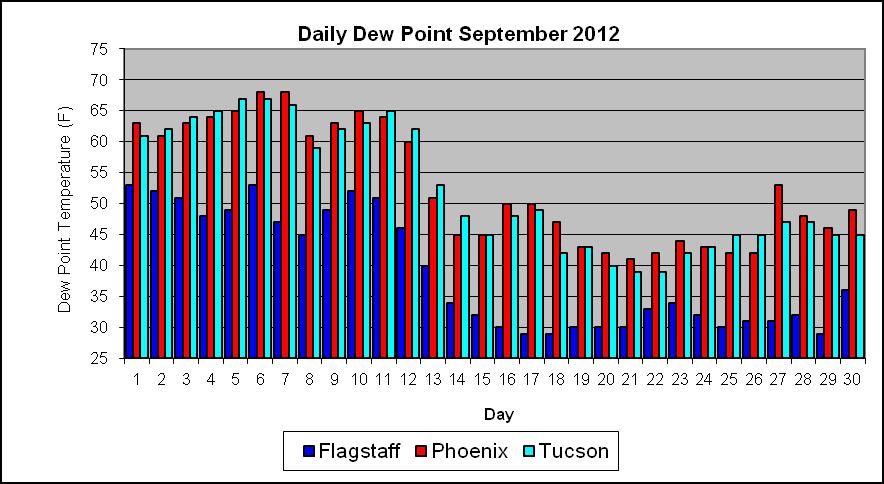
2 September 2012 Daily Temperature, Precipitation, & Dew Point for Flagstaff, Phoenix, and Tucson 2
3 3
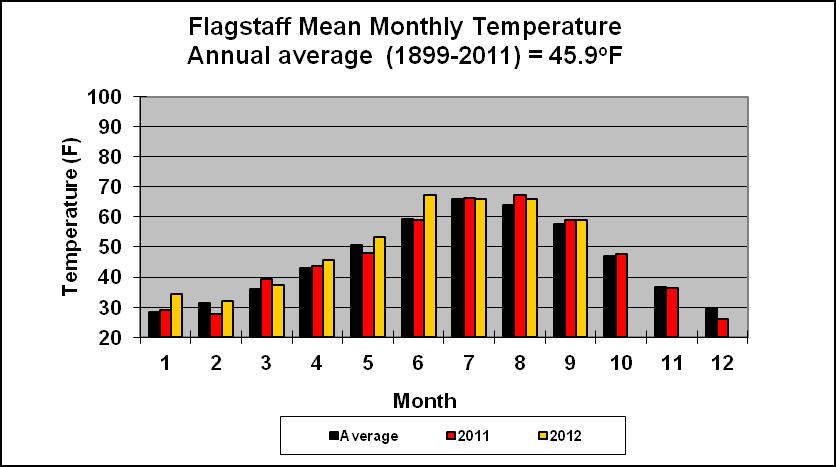
4 FLAGSTAFF CLIMATE STATISTICS September 2012 This September had no significant ranking for temperature was the 17 th driest on record. Avg Max Temp (F) 74.5 Normal 72.9 Avg Min Temp (F) 43.3 Normal 42.0 Avg Mean Temp (F) 58.9 Normal 57.4 Departure from Normal (F) +1.5 Highest Monthly Avg Temp (F) 62.1 in 1947 Lowest Monthly Avg Temp (F) 52.3 in 1912 Highest Temp this month (F): 80 on 6 th Lowest Temp this month (F): 34 on 15 th Record High (F): 91 on 09/03/ /02/ /01/1948 Record Low (F): 20 on 09/22/1912 Temperature or precipitation records this month: 11 th LoMax 59 tied, first set in Maximum Temp 70 o or lower 4 Heating Degree Days 176 Normal 229 Cooling Degree Days 0 Normal 3 Degree base 65 o F Total September Precipitation 0.26 Normal September Precipitation 2.38 Departure from normal Greatest 24-Hr Precipitation 0.19 on 9/10-11 Total Precipitation Year-to-Date Departure from Normal Number of Days: Clear 20 Partly Cloudy 9 Cloudy 1 Greatest September Precipitation 6.75 in 1983 Least September Precipitation 0.00 in 1898, 1955, 1957, 1973, 1992 Flagstaff Number of Days of: Minimum Temp 50 o or higher 8 Minimum Temp 40 o or lower 11 Maximum Temp 80 o or higher 1 Average Wind Speed Highest Peak Gust 4.4 mph 36 mph from 220 o on 24 th PHOENIX CLIMATE STATISTICS September 2012 This September was the 18 th warmest on record and had no significant ranking for precipitation. Avg Max Temp(F) 99.2 Normal 99.8 Avg Min Temp(F) 78.1 Normal 76.9 Avg Mean Temp (F) 88.6 Normal 88.4 Departure from Normal (F) +0.2 Highest Monthly Avg Temp (F) 92.2 in 2001 Lowest Monthly Avg Temp (F) 78.9 in 1912 Highest Temp this month (F): 107 on 2 nd Lowest Temp this month (F): 72 on 7 th, 11 th Record High (F): 116 on 09/01/1950 Record Low (F): 47 on 09/20, 21/ /22/ Temperature or precipitation records this month: 2 nd HiMin 88 tied, first set in th LoMax 85 set, previous record 88, set in 1975 Phoenix Number of Days of: Minimum Temp 75 o or lower 10 Minimum Temp 85 o or higher 4 Maximum Temp 95 o or lower 5 Maximum Temp 105 o or higher 5 Heating Degree Days 0 Normal 0 Cooling Degree Days 719 Normal 700 Degree base 65 o F Total September Precipitation 0.59
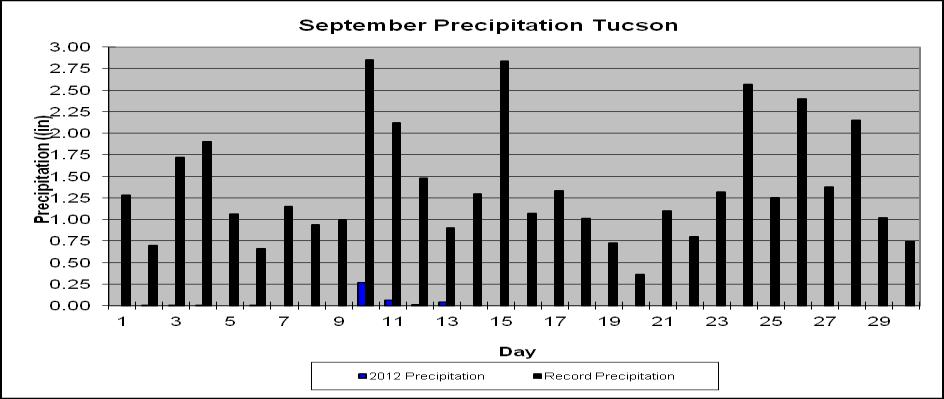
5 Normal September Precipitation 0.64 Departure from normal Greatest 24-Hr Precipitation 0.51 on 9/07 Total Precipitation Year-to-Date 3.36 Departure from Normal Number of Days: Clear 12 Partly Cloudy 16 Cloudy 2 Greatest September Precipitation 5.41 in 1939 Least September Precipitation 0.00 in 1898, 1901, 1910, 1914, 1938, 1945, 1948, 1953, 1955, 1957, 1963, 1968, 1973, 1978, 1988, 2001 Average Wind Speed 6.2 mph Highest Peak Gust 36 mph from 170 o on 10 th TUCSON CLIMATE STATISTICS September 2012 This September was tied for 29 th warmest and had no significant ranking for precipitation Avg Max Temp(F) 94.2 Normal 94.5 Avg Min Temp(F) 69.9 Normal 68.6 Avg Mean Temp(F) 82.1 Normal 81.6 Departure from Normal (F) +0.5 Highest Monthly Avg Temp (F) 84.8 in 2000 Lowest Monthly Avg Temp (F) 76.3 in 1964 Highest Temp this month (F): 103 on 2 nd Lowest Temp this month (F): 63 on 16 th Record High (F): 107 on 09/14/ /11/ /10/1990 Record Low (F): 43 on 09/26/1913 No Temperature or precipitation records this month: Tucson Number of Days of: Minimum Temp 65 o or lower 3 Minimum Temp 75 o or higher 4 Maximum Temp 90 o or lower 6 Maximum Temp 100 o or higher 6 Heating Degree Days 0 Normal 0 Cooling Degree Days 517 Normal 497 Degree base 65 o F Total September Precipitation 0.38 Normal September Precipitation 1.29 Departure from normal Greatest 24-Hr Precipitation 0.29 on 9/10-11 Total Precipitation Year-to-Date 6.70 Departure from Normal Greatest September Precipitation 5.60 in 2011 Least September Precipitation 0.00 in 1894, 1898, 1953, 1957, 1959, 1968 Number of Days: Clear 26 Partly Cloudy 3 Cloudy 1 Average Wind Speed Highest Peak Gust 6.9 mph 59 mph from 040 o on 29 th Data are from the National Weather Service and the National Climatic Data Center and are preliminary. 5
6 Winds for September: Day Phoenix Flagstaff Tucson (mph) Avg Max Avg Max Avg Max Dew Points for September: Daily Average Dew Point ( o F): Day Phx Tuc Flg
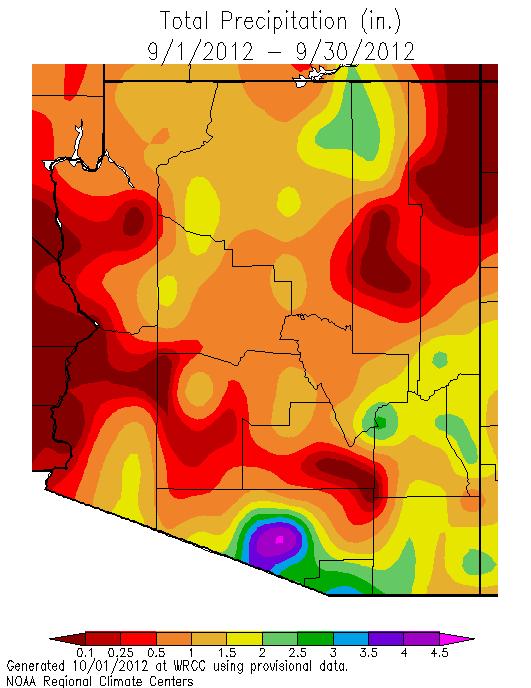
7 September 2012 Temperature, Dew Point, Wind Speed, and Precipitation Maps are based on preliminary data from the National Weather Service, the Arizona Meteorological Network (AZMet), operated by the University of Arizona College of Agriculture Cooperative Extension and the RAWS (Remote Automated Weather Station) network operated by the Bureau of Land Management and Forest Service and the CoCoRaHS (Community Collaborative Rain, Hail and Snow) Network. Average nighttime temperatures ranged from 35 o F at Sunrise Mountain, to 80 o F at Yuma. Average daytime temperatures ranged from 65 o F at Sunrise Mountain in eastern Arizona, to 107 o F at Lake Havasu City. Precipitation values ranged from 0.02 at Lake Havasu in western Arizona to 5.21 in Ajo. The last wave of the monsoon occurred between the 1 st and 15 th of September. During that time temperatures were near normal and thunderstorms were widespread. The second half of the month was dominated by a large ridge of high pressure that allowed temperatures to rise well above normal statewide. Freezing temperatures arrived to the high elevations on the 14 th of September. Very few temperature records were set in September. 7
8 Average monthly dew points ranged from 35 o F at Flagstaff and Window Rock northern Arizona, to 58 o F at Yuma. Average winds were light, with 10 mph as the highest average at Oatman and Guthrie. The highest peak wind gust was 66 mph at Oatman. Peak wind gusts blew in all different directions, which is typical as the high winds are generally attributed to thunderstorm outflows, which have no dominant direction unless the storms are steered by upper level winds. The arrows point to the direction the winds blow from. Most of the high wind gusts came from the southwest. 8
9 9

 in south central Arizona, particularly Pima and western Pinal counties.")

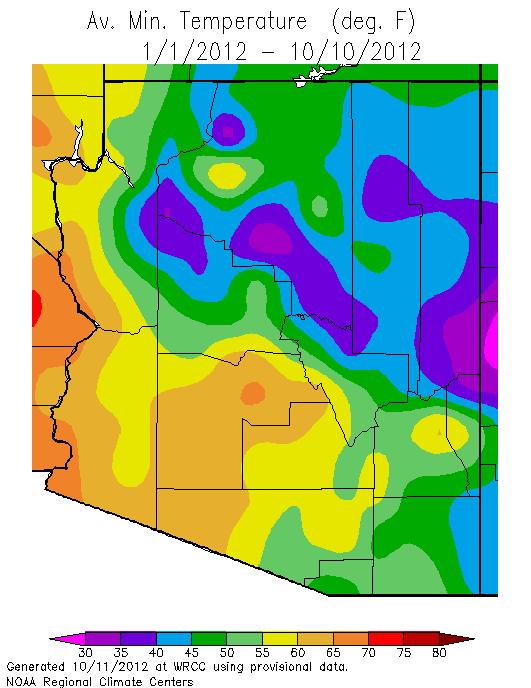
10 September minimum temperatures were as much as 3 o F warmer than normal statewide, with even warmer temperatures along the western border and cooler than normal temperatures along the eastern border. The western border was between 3 and 6 o F warmer than normal. Daytime temperatures were within 1 o F of normal through most of the state, with warmer temperatures along the western and northern borders, and much cooler temperatures (2-4 o F) in south central Arizona, particularly Pima and western Pinal counties. Rainfall was well below normal across a large swath running through the center of the state from the southwest corner to the northeast corner. The northwest corner and some southeastern and southern border counties had much greater than normal rainfall, ranging from over 300% of normal in Yuma County to % of normal in Cochise, Graham, and Mohave counties. The Tucson area had a particularly dry September. 10
11 11


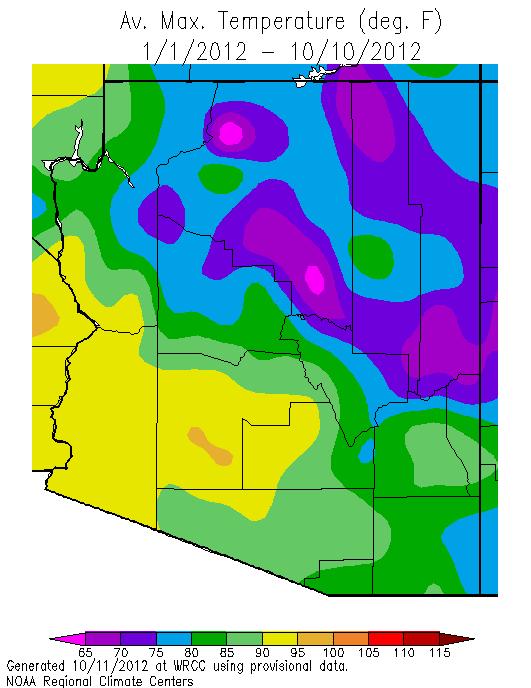
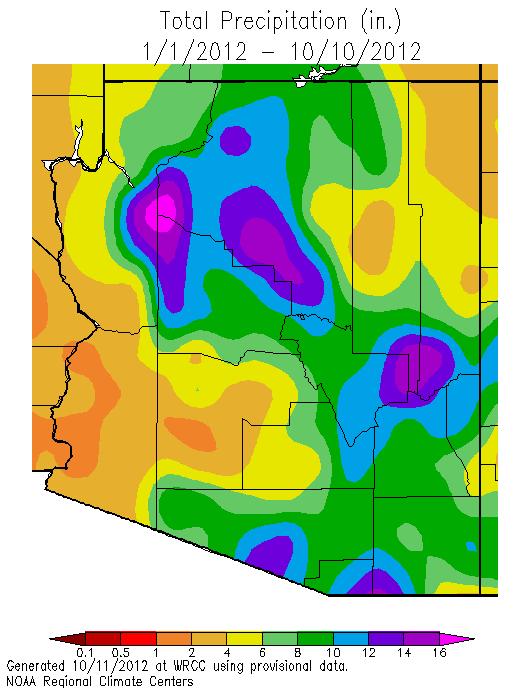
12 Calendar Year 2012 Since January 1 st, nighttime temperatures have been 0 to 2 o F warmer than average statewide. Only Gila County was warmer, at 4-6 o F above normal. Western Pima and parts of Cochise and northeastern Apache County were slightly cooler than normal. The heat has all come in the daytime with the southwest deserts 1-2 o F warmer than normal, and the eastern border counties have been 2-4 o F warmer than normal. Southern Pinal and north central Pima counties were 0-2 o F cooler than normal. Precipitation for the calendar year is less than 70% of average in a slash from the southwestern border to the northeaster border. The winter storms managed to bring rain and snow to the northern third of the state and the monsoon activity brought precipitation to the southern third. Both winter and summer storms were localized, and the deficits from the dry winter were not made up by the spotty summer precipitation. 12
13 13


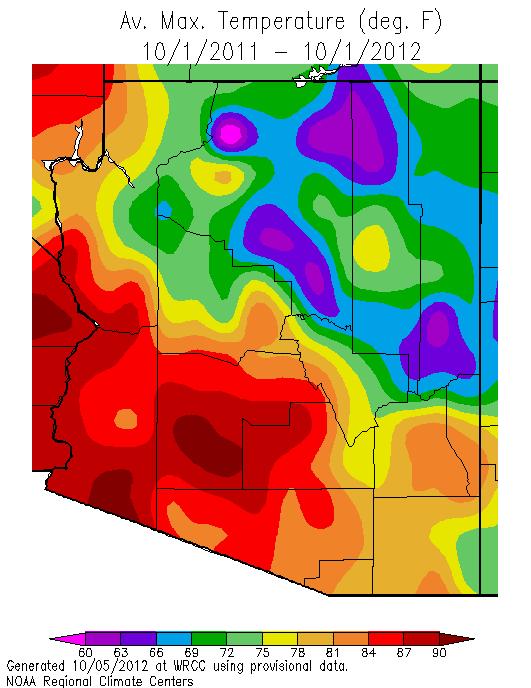
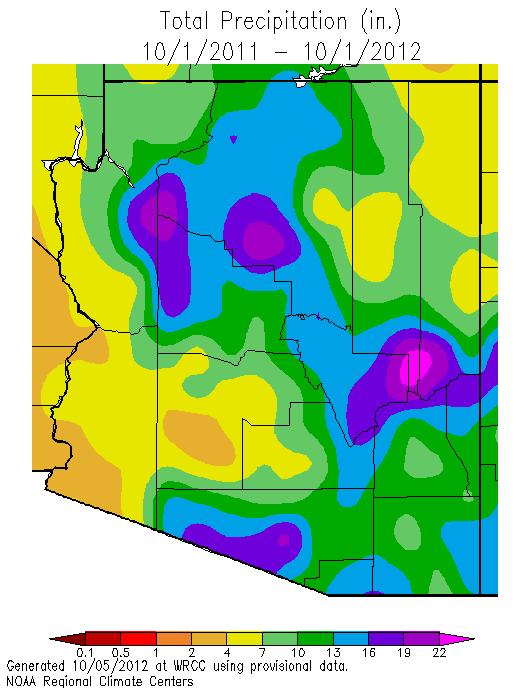
14 2012 Water Year (Since Oct 1, 2011) The water year wrapped up with warmer than normal nighttime temperatures and daytime highs were much cooler than normal in the southern half of the state and warmer than normal in the northern half. This followed the same pattern as the water year nighttime temperatures which were between 0 and 2 o F warmer than normal across most of the state with a few cooler than normal spots in the southwest, and in east central Arizona. Daytime temperatures were also 0-2 o F warmer across most of the state, with the warmest conditions on the Colorado Plateau and along the eastern border. The coldest area was in southern Pinal and western Pima counties, 0-3 o F cooler than normal. Precipitation was well below normal across most of the state with a few important exceptions in western Pima County 150% to over 300% of normal, and central Mohave, western Coconino and northwestern Yavapai counties. This was the second consecutive La Niña winter, which explains much of the precipitation deficit. The current outlook is for a neutral winter which theoretically could have normal precipitation, but the lack of an El Niño or La Niña signal means we don t know whether it will be drier or wetter than normal. 14
15 Temperature (F) Temperature (F) Temperature (F) September Mean Temperature Graphs Flagstaff, Phoenix, and Tucson : Flagstaff Mean September Temperature (Median 58.9 o F) Year Phoenix Mean September Temperature (Median 85.0 o F) Year Tucson Mean SeptemberTemperature (Median 80.7 o F) Year 15
16 Precipitation (in) Precipitation (in) Precipitation (in) September Mean Precipitation Graphs Flagstaff, Phoenix, and Tucson : September Precipitation Flagstaff (Median 1.45") Year September Precipitation Phoenix (Median 0.42") Year September Precipitation Tucson (Median 1.09") Year 16


17 2012 Cumulative Precipitation Graphs Flagstaff, Phoenix and Tucson: Precipitation is well below average in all three cities. 17

18 2012 Monsoon Dew Point Graphs Flagstaff, Phoenix and Tucson: 18
 LO MAX = Lowest maximum temperature for that day (F) LO MIN = Lowest minimum temperature for that day (F) HI")
19 The downloadable normals and extremes calendars use the following abbreviations: NORM = 30 year ( ) average value (degrees Fahrenheit (F)) OBS = The temperature observation for that day this year AVG = Average daily temperature HI MAX = Highest maximum temperature for that day (F) LO MAX = Lowest maximum temperature for that day (F) LO MIN = Lowest minimum temperature for that day (F) HI MIN = Highest minimum temperature for that day (F) Mx PCP = Maximum precipitation for that day (inches) Mx SNO = Maximum snowfall for that day (inches) 19

 and location in the state (Greenlee County).")

20 The Highest temperatures this summer occurred in the lowest elevation desert areas of Arizona along the western border of the state. Stations in Yuma, La Paz, and Mohave counties recorded the most extreme temperatures including 3 locations with maximum above 120 F (Havasu, Bullhead City, Beaver Dam). According to the stations shown, the second highest temperature this summer was recorded in Guthrie. The high in Guthrie was 119 F which seems unusual for the station s elevation (3000+ft) and location in the state (Greenlee County). In most instances, locations that experienced lower max temperatures were higher in elevation. For example, Coconino County had only one station that recorded a high temperature above 110 F. Also, Apache and Navajo counties which contain mostly high elevation desert plains and forests included max temperatures around 100 F besides an anomalous high of 117 F recorded in Heber. Overall, max summer temperatures ranged greatly from 83 F to 121 F statewide.


21 This summer s highest minimum temperatures exceeded 90 F at many locations. Maricopa County experienced many overnight temperatures above 90 F especially in the greater Phoenix area where a few 90 F + overnight temperatures during the summer are common in conjunction with the urban heat island. Stations at the low western desert areas including Yuma, Bullhead City, and Havasu City also recorded low temperatures exceeding 90 F. The station that recorded the highest overnight temperature this summer was located at Quartzite (96 F). It is interesting to note that low temperatures did not exceed 90 F in the lower desert areas of Pima, Santa Cruz, and Cochise counties based off the stations mapped. Tucson, located in Pima County, is the second largest city in the state was not able to reach overnight temperatures exceeding 90 F. Even though Tucson is a large city, the urban heat island and daily maximum temperatrues are not extreme enough to produce 90 F lows. The rest of the state experienced maxium overnight temperatures that were mainly below 80 F.


22 The total summer precipitation ranged greatly across the state from 0.06 just outside of Tucson to near Sierra Vista. The greatest summer precipitation around the Phoenix area mainly occurred in the east valley, especially in Apache Junction and East Mesa with totals over Southern Arizona experienced some of the greatest precipitation totals especially in Pima, Santa Cruz, and Cochise counties. Tucson had many stations that recorded summer rainfall amounts over 5.00 and locations outside of Tucson recorded totals over Northern Arizona also received a decent amount of precipitation this summer especially in Yavapai and Coconino Counties. The Bellemont Forecast Office near Flagstaff received which was the second highest total in the state. Jerome received and stations near Prescott Valley received around 9.00 of precipitation respectively. However, not all locations experienced impressive rainfall totals, and the map depicts variability across the state.
Arizona Climate Summary February 2012
 Arizona Climate Summary February 2012 Summary of conditions for January 2012 January 2012 Temperature and Precipitation Summary January 1 st 20 th : The New Year has started on a very dry note. The La
Arizona Climate Summary May 2012
 Arizona Climate Summary May 2012 Summary of conditions for April 2012 April 2012 Temperature and Precipitation Summary April 1 st 16 th : Although April began with another low pressure system sweeping
Arizona Climate Summary August 2013
 Arizona Climate Summary August 2013 Summary of conditions for July 2013 July 2013 Temperature and Precipitation Summary July 1 st 16 th : To start off the month of July, a high pressure system came in
Arizona Climate Summary April 2013
 Arizona Climate Summary April 2013 Summary of conditions for March 2013 March 2013 Temperature and Precipitation Summary March 1 st 16 th : March began as a ridge of high pressure progressed across the
Arizona Climate Summary October 2016 Summary of conditions for September 2016
 September 2016 Temperature and Precipitation Summary Arizona Climate Summary October 2016 Summary of conditions for September 2016 September 1 st 14 th : High pressure over the Four Corners brought rainfall
Arizona Climate Summary
 Arizona Climate Summary June 2012 Summary of conditions for May 2012 May 2012 Temperature and Precipitation Summary May 1 st 16 th : May began with a surface cold front sweeping across the western states
Arizona Climate Summary June 2017 Summary of conditions for May 2017
 Arizona Climate Summary June 2017 Summary of conditions for May 2017 May 2017 Temperature and Precipitation Summary May 1 st 16 th : A strong ridge of high pressure developed over the southwest during
Arizona Climate Summary October 2013
 Arizona Climate Summary October 2013 Summary of conditions for September 2013 September 2013 Temperature and Precipitation Summary September 1 st 16 th : With moist conditions still present throughout
Arizona Climate Summary
 August 2015 Temperature and Precipitation Summary Arizona Climate Summary September 2015 Summary of conditions for August 2015 August 1 st 16 th : August was a wet month across the state with only 3 days
Arizona Climate Summary March 2013
 Arizona Climate Summary March 2013 Summary of conditions for February 2013 February 2013 Temperature and Precipitation Summary February 1 st 16 th : February began with a ridge of high pressure over the
Arizona Climate Summary May 2013
 Arizona Climate Summary May 2013 Summary of conditions for April 2013 April 2013 Temperature and Precipitation Summary April 1 st 16 th : The first week of April featured a ridge of high pressure over
Arizona Climate Summary December 2016 Summary of conditions for November 2016
 Arizona Climate Summary December 2016 Summary of conditions for November 2016 November 2016 Temperature and Precipitation Summary November 1 st 16 th : November began with a dry low pressure system moving
Arizona Climate Summary May 2015 Summary of conditions for April 2015
 Arizona Climate Summary May 2015 Summary of conditions for April 2015 April 2015 Temperature and Precipitation Summary April 1 st 16 th : April began with very light showers in Nogales and Coronado National
Arizona Climate Summary November 2015 Summary of conditions for October 2015
 October 2015 Temperature and Precipitation Summary Arizona Climate Summary November 2015 Summary of conditions for October 2015 October 1 st 14 th : October began with high pressure over the southwest,
Arizona Climate Summary
 Arizona Climate Summary August 2016 Summary of conditions for July 2016 July 2016 Temperature and Precipitation Summary July 1 st 15 th : As June ended and July began, a shortwave moved through the southwest
Arizona Climate Summary February 2016 Summary of conditions for January 2016
 January 2016 Temperature and Precipitation Summary Arizona Climate Summary February 2016 Summary of conditions for January 2016 January 1 st 14 th : The new year began with high pressure over the southwest
Arizona Climate Summary January 2017 Summary of conditions for December 2016
 Arizona Climate Summary January 2017 Summary of conditions for December 2016 December 2016 Temperature and Precipitation Summary December 1 st 15 th : Similar to November, December began with a dry trough
Arizona Climate Summary September 2017 Summary of conditions for August 2017
 August 2017 Temperature and Precipitation Summary Arizona Climate Summary September 2017 Summary of conditions for August 2017 August 1 st 15 th : The monsoon activity that ended July continued into the
Arizona Climate Summary November 2017 Summary of conditions for October 2017
 Arizona Climate Summary November 2017 Summary of conditions for October 2017 October 2017 Temperature and Precipitation Summary October 1 st 18 th : A low pressure system from the northwestern U.S. moved
Arizona Climate Summary June 2013
 Arizona Climate Summary June 2013 Summary of conditions for May 2013 May 2013 Temperature and Precipitation Summary May 1 st 16 th : May began with above normal daily temperatures and breezy conditions
Arizona Climate Summary
 April 2016 Temperature and Precipitation Summary Arizona Climate Summary May 2016 Summary of conditions for April 2016 April 1 st 15 th : April 1 st saw the tail end of a low pressure system move out of
Arizona Climate Summary October 2018 Summary of conditions for September 2018
 Arizona Climate Summary October 2018 Summary of conditions for September 2018 September 2018 Temperature and Precipitation Summary September 1 st 17 th : The wet pattern from August continued into September
Arizona Climate Summary December 2017 Summary of conditions for November 2017
 November 2017 Temperature and Precipitation Summary Arizona Climate Summary December 2017 Summary of conditions for November 2017 November 1 st 17 th : October ended with a little bit of precipitation
Arizona Climate Summary November 2016 Summary of conditions for October 2016
 Arizona Climate Summary November 2016 Summary of conditions for October 2016 October 2016 Temperature and Precipitation Summary October 1 st 16 th : October began with high pressure over Mexico, bringing
Arizona Climate Summary July 2015 Summary of conditions for June 2015
 June 2015 Temperature and Precipitation Summary Arizona Climate Summary July 2015 Summary of conditions for June 2015 June 1 st 14 th : Similar to May, June began with high pressure in the west, and conditions
Arizona Climate Summary September 2018 Summary of conditions for August 2018
 August 2018 Temperature and Precipitation Summary Arizona Climate Summary September 2018 Summary of conditions for August 2018 August 1 st 15 th : August began with high pressure centered over the state
Arizona Climate Summary
 May 2015 Temperature and Precipitation Summary Arizona Climate Summary June 2015 Summary of conditions for May 2015 May 1 st 14 th : May began with high pressure in the west, and May 1 st was dry statewide,
Arizona Climate Summary November 2018 Summary of conditions for October 2018
 Arizona Climate Summary November 2018 Summary of conditions for October 2018 October 2018 Temperature and Precipitation Summary October 1 st 15 th : The 2018 water year ending September 30 th was exceptionally
Arizona Climate Summary October 2015 Summary of conditions for September 2015
 September 2015 Temperature and Precipitation Summary Arizona Climate Summary October 2015 Summary of conditions for September 2015 September 1 st 18 th : September began with high pressure over southern
Arizona Climate Summary
 Arizona Climate Summary March 2014 Summary of conditions for February 2014 February 2014 Temperature and Precipitation Summary February 1 st 16 th : We started off the month of February with some moisture
Arizona Climate Summary February 2018 Summary of conditions for January 2018
 Arizona Climate Summary February 2018 Summary of conditions for January 2018 January 2018 Temperature and Precipitation Summary January 1 st 19 th : The new year began with a ridge of high pressure over
Arizona Climate Summary April 2018 Summary of conditions for March 2018
 Arizona Climate Summary April 2018 Summary of conditions for March 2018 March 2018 Temperature and Precipitation Summary March 1 st 16 th : March began with rainfall in southeastern Arizona as the tail
Arizona Climate Summary May 2018 Summary of conditions for April 2018
 April 2018 Temperature and Precipitation Summary Arizona Climate Summary May 2018 Summary of conditions for April 2018 April 1 st 16 th : April was a very dry month across Arizona. Several low pressure
Arizona Climate Summary
 Arizona Climate Summary April 2014 Summary of conditions for March 2014 March 2014 Temperature and Precipitation Summary March 1 st 16 th : We started off the month of March with a significant precipitation
Arizona Climate Summary November 2013
 Arizona Climate Summary November 2013 Summary of conditions for October 2013 October 2013 Temperature and Precipitation Summary October 1 st 16 th : The month of October started off with fair weather conditions
Arizona Climate Summary September 2014 Summary of conditions for August 2014
 Arizona Climate Summary September 2014 Summary of conditions for August 2014 August 2014 Temperature and Precipitation Summary August 1 st 16 th : The first 5 days of August were quite wet with high pressure
Monthly Long Range Weather Commentary Issued: February 15, 2015 Steven A. Root, CCM, President/CEO
 Monthly Long Range Weather Commentary Issued: February 15, 2015 Steven A. Root, CCM, President/CEO sroot@weatherbank.com JANUARY 2015 Climate Highlights The Month in Review During January, the average
Weather and Climate Summary and Forecast August 2018 Report
 Weather and Climate Summary and Forecast August 2018 Report Gregory V. Jones Linfield College August 5, 2018 Summary: July 2018 will likely go down as one of the top five warmest July s on record for many
2012 Growing Season Weather Summary for North Dakota. Adnan Akyüz and Barbara A. Mullins Department of Soil Science October 30, 2012
 2012 Growing Season Weather Summary for North Dakota Adnan Akyüz and Barbara A. Mullins Department of Soil Science October 30, 2012 Introduction The 2012 growing season (the period from April through September)
Weather and Climate Summary and Forecast October 2018 Report
 Weather and Climate Summary and Forecast October 2018 Report Gregory V. Jones Linfield College October 4, 2018 Summary: Much of Washington, Oregon, coastal California and the Bay Area and delta region
Colorado State University, Fort Collins, CO Weather Station Monthly Summary Report
 Colorado State University, Fort Collins, CO Weather Station Monthly Summary Report Month: December Year: 2017 Temperature: Mean T max was 47.2 F which is 4.4 above the 1981-2010 normal for the month. This
Office of the Washington State Climatologist
 Office of the Washington State Climatologist May 3, 2013 April Event Summary Average April temperatures were below normal for a majority of the state. Total precipitation was above normal for western and
National Wildland Significant Fire Potential Outlook
 National Wildland Significant Fire Potential Outlook National Interagency Fire Center Predictive Services Issued: September, 2007 Wildland Fire Outlook September through December 2007 Significant fire
Monthly Long Range Weather Commentary Issued: July 18, 2014 Steven A. Root, CCM, President/CEO
 Monthly Long Range Weather Commentary Issued: July 18, 2014 Steven A. Root, CCM, President/CEO sroot@weatherbank.com JUNE 2014 REVIEW Climate Highlights The Month in Review The average temperature for
The Weather Wire. Contents: Summer 2018 Outlook. Summer 2018 Outlook Drought Monitor May Summary/Statistics June Preview Rainfall Totals
 The Weather Wire June 2018 Volume 25 Number 6 Contents: Summer 2018 Outlook Drought Monitor May Summary/Statistics June Preview Rainfall Totals Summer 2018 Outlook June 1 st marked the first day of meteorological
Weather and Climate Summary and Forecast Winter
 Weather and Climate Summary and Forecast Winter 2016-17 Gregory V. Jones Southern Oregon University February 7, 2017 What a difference from last year at this time. Temperatures in January and February
The Pennsylvania Observer
 The Pennsylvania Observer April 2, 2009 March 2009 Pennsylvania Weather Recap Prepared by Curt Harpster For the month of March the saying, In like a lion and out like a lamb really fit the pattern quite
Weather and Climate Summary and Forecast April 2018 Report
 Weather and Climate Summary and Forecast April 2018 Report Gregory V. Jones Linfield College April 4, 2018 Summary: A near Miracle March played out bringing cooler and wetter conditions to the majority
May 2016 Volume 23 Number 5
 The Weather Wire May 2016 Volume 23 Number 5 Contents: Winter Summary Current Colorado and West-wide Snow Pack Drought Monitor April Summary/Statistics May Preview Snowfall Totals Winter Summary The Front
The Pennsylvania Observer
 The Pennsylvania Observer October 1, 2015 September 2015 - Pennsylvania Weather Recap By: Quinn Lease The month of September will be remembered for its above normal temperatures and dry conditions that
Colorado CoCoRaHS. Colorado CoCoRaHS. Because Every Drop Counts! November 2014 Volume 2, Issue 11
 U.S. PRECIPITATION (% OF AVERAGE) LOOKING BACK AT OCTOBER 2014 October was a fairly dry month for much of the nation with the exception of the Pacific Northwest, portions of New England and the Tennessee
The Pennsylvania Observer
 The Pennsylvania Observer January 5, 2016 December 2015 - Pennsylvania Weather Recap By: Arthur Person December is the first of the three coldest months of the year. Sometimes it can be naughty, and sometimes
2011 Year in Review TORNADOES
 2011 Year in Review The year 2011 had weather events that will be remembered for a long time. Two significant tornado outbreaks in April, widespread damage and power outages from Hurricane Irene in August
Weather and Climate Summary and Forecast Winter
 Weather and Climate Summary and Forecast Winter 2016-17 Gregory V. Jones Southern Oregon University December 5, 2016 Well after an October that felt more like November, we just finished a November that
Weather and Climate Summary and Forecast Summer 2017
 Weather and Climate Summary and Forecast Summer 2017 Gregory V. Jones Southern Oregon University August 4, 2017 July largely held true to forecast, although it ended with the start of one of the most extreme
Monthly Long Range Weather Commentary Issued: APRIL 18, 2017 Steven A. Root, CCM, Chief Analytics Officer, Sr. VP,
 Monthly Long Range Weather Commentary Issued: APRIL 18, 2017 Steven A. Root, CCM, Chief Analytics Officer, Sr. VP, sroot@weatherbank.com MARCH 2017 Climate Highlights The Month in Review The average contiguous
Weather and Climate Summary and Forecast Summer 2016
 Weather and Climate Summary and Forecast Summer 2016 Gregory V. Jones Southern Oregon University June 6, 2016 May 2016 continued the warm trend for portions of the west, while providing some relief for
PRECIPITATION. Last Week Precipitation:
 2/24/2015 NIDIS Drought and Water Assessment PRECIPITATION The images above use daily precipitation statistics from NWS COOP, CoCoRaHS, and CoAgMet stations. From top to bottom, and left to right: most
Weather and Climate Summary and Forecast February 2018 Report
 Weather and Climate Summary and Forecast February 2018 Report Gregory V. Jones Linfield College February 5, 2018 Summary: For the majority of the month of January the persistent ridge of high pressure
Champaign-Urbana 1999 Annual Weather Summary
 Champaign-Urbana 1999 Annual Weather Summary ILLINOIS STATE WATER SURVEY 2204 Griffith Dr. Champaign, IL 61820 wxobsrvr@sws.uiuc.edu Maria Peters, Weather Observer A major snowstorm kicked off the new
Monthly Long Range Weather Commentary Issued: SEPTEMBER 19, 2016 Steven A. Root, CCM, Chief Analytics Officer, Sr. VP,
 Monthly Long Range Weather Commentary Issued: SEPTEMBER 19, 2016 Steven A. Root, CCM, Chief Analytics Officer, Sr. VP, sroot@weatherbank.com SEPTEMBER 2016 Climate Highlights The Month in Review The contiguous
Weather and Climate Summary and Forecast November 2017 Report
 Weather and Climate Summary and Forecast November 2017 Report Gregory V. Jones Linfield College November 7, 2017 Summary: October was relatively cool and wet north, while warm and very dry south. Dry conditions
Weather and Climate Summary and Forecast March 2018 Report
 Weather and Climate Summary and Forecast March 2018 Report Gregory V. Jones Linfield College March 7, 2018 Summary: The ridge pattern that brought drier and warmer conditions from December through most
Weather and Climate Summary and Forecast Fall/Winter 2016
 Weather and Climate Summary and Forecast Fall/Winter 2016 Gregory V. Jones Southern Oregon University November 5, 2016 After a year where we were seemingly off by a month in terms of temperatures (March
Colorado State University, Fort Collins, CO Weather Station Monthly Summary Report
 Colorado State University, Fort Collins, CO Weather Station Monthly Summary Report Month: December Year: 2016 Temperature: Mean T max was 39.7 F which is 3.1 below the 1981-2010 normal for the month. This
The Pennsylvania Observer
 The Pennsylvania Observer September 3, 2008 Summer 2008 Weather Summary Written by: Brian Thompson The opening days of June started dry, but a warm front brought a widespread rain a couple of days into
Monthly Long Range Weather Commentary Issued: APRIL 25, 2016 Steven A. Root, CCM, Chief Analytics Officer, Sr. VP, sales
 Monthly Long Range Weather Commentary Issued: APRIL 25, 2016 Steven A. Root, CCM, Chief Analytics Officer, Sr. VP, sales sroot@weatherbank.com MARCH 2016 Climate Highlights The Month in Review The March
NIDIS Intermountain West Drought Early Warning System September 4, 2018
 NIDIS Drought and Water Assessment NIDIS Intermountain West Drought Early Warning System September 4, 2018 Precipitation The images above use daily precipitation statistics from NWS COOP, CoCoRaHS, and
The Pennsylvania Observer
 The Pennsylvania Observer December 2, 2015 November 2015 - Pennsylvania Weather Recap By: Anthny Chiavaroli This November was dry with above average temperatures across the state. Western PA saw some very
Monthly Long Range Weather Commentary Issued: APRIL 1, 2015 Steven A. Root, CCM, President/CEO
 Monthly Long Range Weather Commentary Issued: APRIL 1, 2015 Steven A. Root, CCM, President/CEO sroot@weatherbank.com FEBRUARY 2015 Climate Highlights The Month in Review The February contiguous U.S. temperature
Monthly Long Range Weather Commentary Issued: NOVEMBER 16, 2015 Steven A. Root, CCM, Chief Analytics Officer, Sr. VP, sales
 Monthly Long Range Weather Commentary Issued: NOVEMBER 16, 2015 Steven A. Root, CCM, Chief Analytics Officer, Sr. VP, sales sroot@weatherbank.com OCTOBER 2015 Climate Highlights The Month in Review The
The Weather Wire. Contents: Wildfires Burning Across Colorado
 The Weather Wire July 2018 Volume 25 Number 7 Contents: Wildfires Burning Across Colorado Drought Monitor June Summary/Statistics July Preview Rainfall Totals Wildfires Burning Across Colorado Following
Weather and Climate of the Rogue Valley By Gregory V. Jones, Ph.D., Southern Oregon University
 Weather and Climate of the Rogue Valley By Gregory V. Jones, Ph.D., Southern Oregon University The Rogue Valley region is one of many intermountain valley areas along the west coast of the United States.
Colorado State University, Fort Collins, CO Weather Station Monthly Summary Report
 Colorado State University, Fort Collins, CO Weather Station Monthly Summary Report Month: January Year: 2019 Temperature: Mean T max was 47.2 F which is 3.0 above the 1981-2010 normal for the month. This
October 2015 Volume 22 Number 10
 The Weather Wire October 2015 Volume 22 Number 10 Contents: Local Frost/Freeze Information Drought Monitor September Summary/Statistics October Preview Rainfall Totals Local Frost Freeze Information Many
Weather and Climate Summary and Forecast January 2018 Report
 Weather and Climate Summary and Forecast January 2018 Report Gregory V. Jones Linfield College January 5, 2018 Summary: A persistent ridge of high pressure over the west in December produced strong inversions
Weather History on the Bishop Paiute Reservation
 Weather History on the Bishop Paiute Reservation -211 For additional information contact Toni Richards, Air Quality Specialist 76 873 784 toni.richards@bishoppaiute.org Updated 2//214 3:14 PM Weather History
April 2011 Volume 18 Number 4
 The Weather Wire April 2011 Volume 18 Number 4 Contents: Winter Summary to Date Drought Monitor March Summary/Statistics April Preview Sunrise/Sunset Snow Totals Winter Summary to Date The Front Range
NIDIS Intermountain West Drought Early Warning System October 17, 2017
 NIDIS Drought and Water Assessment NIDIS Intermountain West Drought Early Warning System October 17, 2017 Precipitation The images above use daily precipitation statistics from NWS COOP, CoCoRaHS, and
Drought Update May 11, 2018
 Drought Update May 11, 2018 Current status After a record cold April, May has started with much warmer than normal temperatures. The statewide average temperature for the week ending on May 8th was 65.7
The Pennsylvania Observer
 The Pennsylvania Observer June 2, 2010 May 2010 Pennsylvania Weather Recap This month completed one of the warmest springs on record in Pennsylvania. With about 75% of the days averaging above normal,
NIDIS Drought and Water Assessment
 NIDIS Drought and Water Assessment PRECIPITATION The images above use daily precipitation statistics from NWS COOP, CoCoRaHS, and CoAgMet stations. From top to bottom, and left to right: most recent 7-days
Nebraska experienced a wide
 Issue 1 August 2016 CLIMATE UPDATE A MONTHLY SUMMARY FROM THE neclimate.unl.edu August saw reprieve from dryness, cooler temps Overview Nebraska experienced a wide range of conditions across the state
Weather and Climate Summary and Forecast January 2019 Report
 Weather and Climate Summary and Forecast January 2019 Report Gregory V. Jones Linfield College January 4, 2019 Summary: December was mild and dry over much of the west, while the east was much warmer than
NIDIS Drought and Water Assessment
 7/23/13 1:57 PM PRECIPITATION The images above use daily precipitation statistics from NWS COOP, CoCoRaHS, and CoAgMet stations. From top to bottom, and left to right: most recent 7-days of accumulated
Precipitation. Standardized Precipitation Index. NIDIS Intermountain West Drought Early Warning System September 5, 2017
 9/6/2017 NIDIS Drought and Water Assessment NIDIS Intermountain West Drought Early Warning System September 5, 2017 Precipitation The images above use daily precipitation statistics from NWS COOP, CoCoRaHS,
The Climate of Texas County
 The Climate of Texas County Texas County is part of the Western High Plains in the north and west and the Southwestern Tablelands in the east. The Western High Plains are characterized by abundant cropland
Climate. Annual Temperature (Last 30 Years) January Temperature. July Temperature. Average Precipitation (Last 30 Years)
 January Temperature. July Temperature. Average Precipitation (Last 30 Years)") Climate Annual Temperature (Last 30 Years) Average Annual High Temp. (F)70, (C)21 Average Annual Low Temp. (F)43, (C)6 January Temperature Average January High Temp. (F)48, (C)9 Average January Low Temp.
Climate Annual Temperature (Last 30 Years) Average Annual High Temp. (F)70, (C)21 Average Annual Low Temp. (F)43, (C)6 January Temperature Average January High Temp. (F)48, (C)9 Average January Low Temp.
KANSAS CLIMATE SUMMARY February 2015
 KANSAS CLIMATE SUMMARY February 2015 Extended Cold Despite some record warm readings at a few locations, February was characterized by colder than normal conditions. This was particularly true during the
November 2017 Volume 24 Number 11
 The Weather Wire November 2017 Volume 24 Number 11 Contents: Colorado Snow Statistics Drought Monitor October Summary/Statistics November Preview Snowfall Totals Rainfall Totals Colorado Snow Statistics
The Pennsylvania Observer
 The Pennsylvania Observer August 3, 2015 July 2015 - Pennsylvania Weather Recap By: Arthur Person Although this seventh month of 2015 was fairly normal across Pennsylvania as a whole, the details reveal
NIDIS Intermountain West Drought Early Warning System December 11, 2018
 NIDIS Drought and Water Assessment NIDIS Intermountain West Drought Early Warning System December 11, 2018 Precipitation The images above use daily precipitation statistics from NWS COOP, CoCoRaHS, and
Weather and Climate Summary and Forecast Summer 2016
 Weather and Climate Summary and Forecast Summer 2016 Gregory V. Jones Southern Oregon University August 5, 2016 The month of July saw the continued flip, flop of the western US temperatures. It was warm
The Climate of Murray County
 The Climate of Murray County Murray County is part of the Crosstimbers. This region is a transition between prairies and the mountains of southeastern Oklahoma. Average annual precipitation ranges from
New Hampshire State Climate Office Dr. Mary D. Stampone, State Climatologist
 New Hampshire State Climate Office Dr. Mary D. Stampone, State Climatologist University of New Hampshire c/o Department of Geography 73 Main Street Durham, NH 03824 Phone: 603-862-3136 Fax: 603-862-4362
Champaign-Urbana 2000 Annual Weather Summary
 Champaign-Urbana 2000 Annual Weather Summary ILLINOIS STATE WATER SURVEY 2204 Griffith Dr. Champaign, IL 61820 wxobsrvr@sws.uiuc.edu Maria Peters, Weather Observer January: January started on a mild note,
KANSAS CLIMATE SUMMARY January 2018
 KANSAS CLIMATE SUMMARY January 2018 Some welcome moisture After an extended period with little to no moisture, parts of Kansas recorded some significant precipitation. At Tribune, a small snow event on
NIDIS Intermountain West Drought Early Warning System February 6, 2018
 NIDIS Intermountain West Drought Early Warning System February 6, 2018 Precipitation The images above use daily precipitation statistics from NWS COOP, CoCoRaHS, and CoAgMet stations. From top to bottom,
NIDIS Intermountain West Drought Early Warning System February 12, 2019
 NIDIS Intermountain West Drought Early Warning System February 12, 2019 Precipitation The images above use daily precipitation statistics from NWS COOP, CoCoRaHS, and CoAgMet stations. From top to bottom,
PRECIPITATION. Last Week Precipitation:
 12/3/2014 NIDIS Drought and Water Assessment PRECIPITATION The images above use daily precipitation statistics from NWS COOP, CoCoRaHS, and CoAgMet stations. From top to bottom, and left to right: most