Arizona Climate Summary April 2013
|
|
|
- Gwenda Richardson
- 6 years ago
- Views:
Transcription


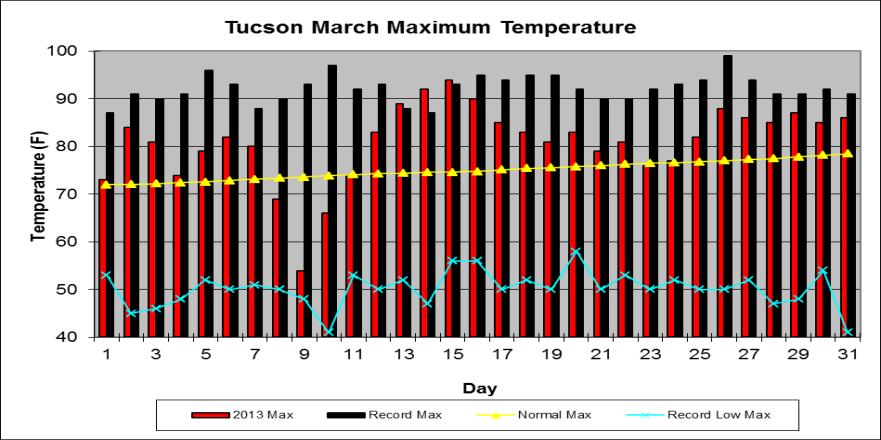
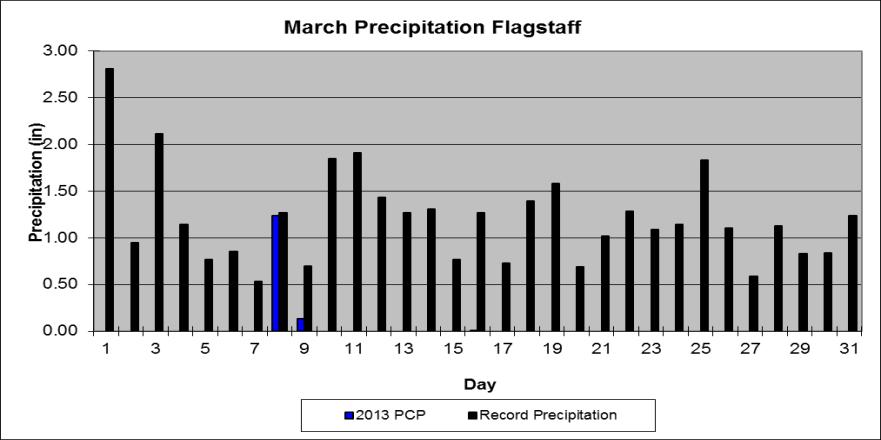
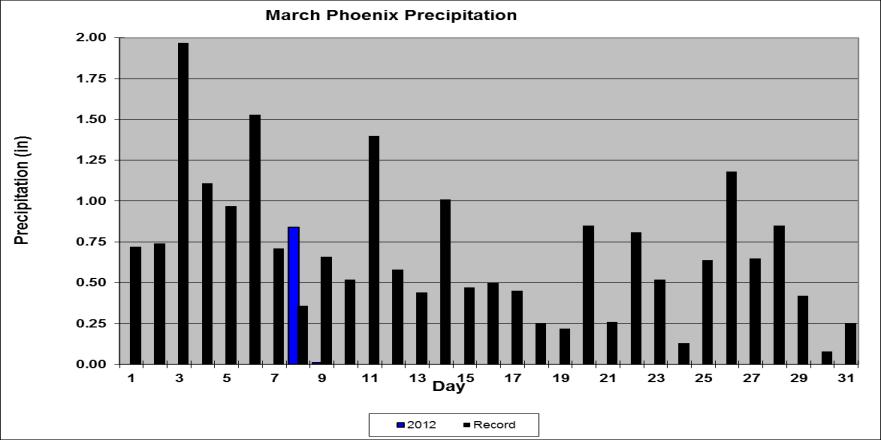
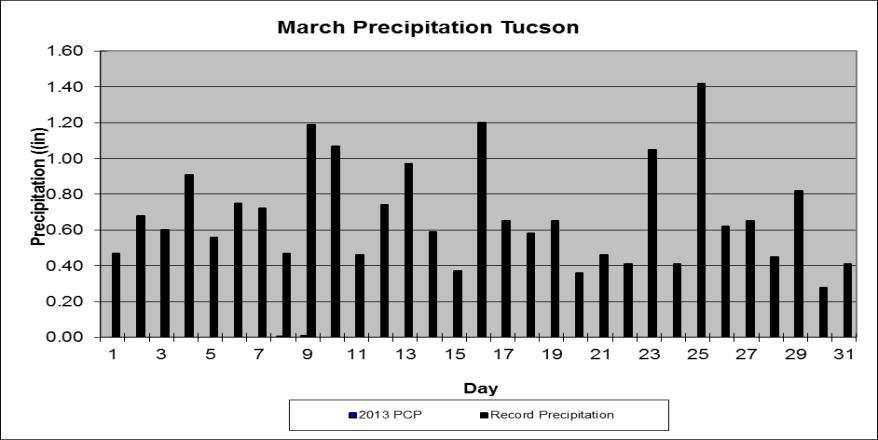
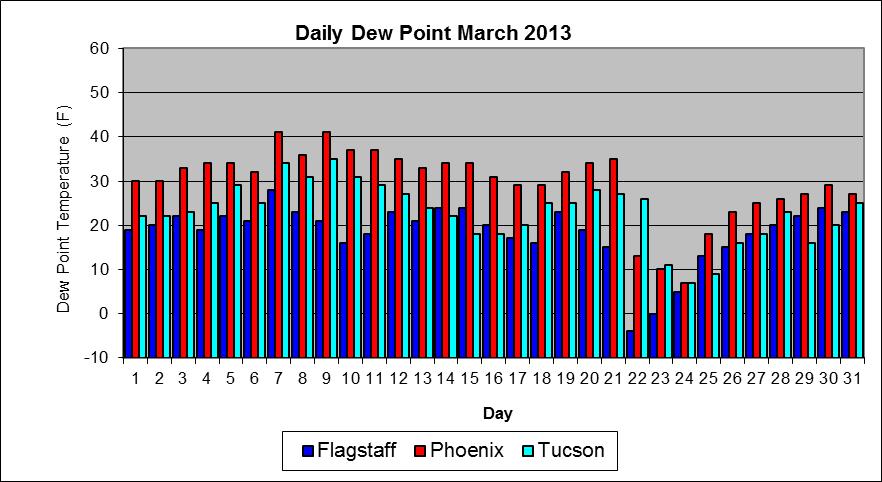
1 Arizona Climate Summary April 2013 Summary of conditions for March 2013 March 2013 Temperature and Precipitation Summary March 1 st 16 th : March began as a ridge of high pressure progressed across the western U.S. The first week of the month included above average daily temperatures including 8 F above normal in Flagstaff on the 2 nd, 6 F above normal in Deer Valley on the 2 nd, and 6 F above normal in Winslow on the 3 rd. By the 8 th, a strong surface low pressure system moved into Arizona brining much cooler temperatures and precipitation to the state. As storms moved through Phoenix, some were strong enough to produce hail up to dime size and winds over 50mph. Precipitation totals on the 8 th included 0.95 in Camp Verde, 0.92 in Casa Grande, 0.69 at Phoenix Sky Harbor, and 0.59 in Sedona. Precipitation continued on the 9 th with the heaviest amounts falling in Carefree (1.50 ), the Grand Canyon North Rim (0.82 ), Page (0.79 ), and Whiteriver (0.49 ). Average temperatures on the 9 th were 13 F below normal in Phoenix, 10 F below normal in Tucson, and 7 F below normal in Yuma. After the storm system advanced eastward, a strong ridge of high pressure developed over the western U.S. Daily temperatures were well above normal statewide from the 13 th -16 th and many new record highs were set during this stretch of days. 4 new record highs were set on the 13 th including 89 F at Tucson AP, 18 record highs were set or tied on the 14 th including 85 F at Douglas AP and 93 F in Bouse, 22 record highs were tied or set on the 15 th including 96.1 F in Gila Bend, and 82 F in Petrified Forest NP, and 9 record highs were set or tied on the 16 th including 88 F in Tombstone and 78 F in Prescott. March 17 th 31 st : No precipitation occurred in Arizona from the 17 th -31 st as stagnant high pressure persisted over the state for many days keeping temperatures elevated above normal. A series of weak surface fronts moved across the north portions of the state from the 18 th -22 nd, however there was not enough vorticity or moisture in place to generate precipitation. By the 22 nd, the ridge of high pressure finally weakened and daily temperatures returned to near normal in the lower desert areas and below normal at higher elevations. Daily temperatures were 4 F below normal in Flagstaff and 11 F below normal in Winslow on the 23 rd -24 th. The cooler temperatures lasted briefly as a ridge of high pressure returned as the dominant feature over the southwest from the 26 th -31 st. Overall this March was one of the warmest and driest on record in many parts of the state, especially Tucson (2 nd warmest and 9 th driest), and Phoenix (4 th warmest). In This Issue: Overview of March, graphs of the March daily maximum and minimum temperatures, precipitation, mean daily dew points for Flagstaff, Phoenix, and Tucson; March climate statistics, maps of mean monthly maximum and minimum temperatures, precipitation, dew points, wind speeds for March; and graphs of the mean March temperature and precipitation for the period of record for Tucson, Phoenix, and Flagstaff, graphs of the cumulative precipitation for the calendar year for Flagstaff, Phoenix, and Tucson. Climate calendars for Flagstaff, Phoenix, Tucson, Prescott, Winslow and Yuma, including daily and monthly normals and extremes, for each month of the year, can be downloaded directly from the State Climate website. See p. 19 of this report for calendar abbreviations. Data are preliminary and are from the National Weather Service Forecast Offices in Flagstaff, Phoenix and Tucson. **Note: The discrepancy between the Statewide Temperature and Precipitation values for Phoenix, Flagstaff and Tucson and the daily values in their graphs are due to the reporting times. Statewide Temperature and Precipitation values are taken at 5pm, while official daily records at the airports are taken from Midnight to Midnight. State Climate Office Dr. Nancy J. Selover, State Climatologist Tel: Arizona State Climate Office 1 School of Geographical Sciences & Urban Planning Arizona State University Tempe, AZ Edited by Nancy J. Selover & Matt Salerno

2 March 2013 Daily Temperature, Precipitation, & Dew Point for Flagstaff, Phoenix, and Tucson 2
3 3
4 FLAGSTAFF CLIMATE STATISTICS March 2013 This March was tied for 16 th warmest on record and had no significant ranking for precipitation. Avg Max Temp (F) 56.3 Normal 50.4 Avg Min Temp (F) 23.7 Normal 23.6 Avg Mean Temp (F) 40.0 Normal 37.0 Departure from Normal (F) +3.0 Highest Monthly Avg Temp (F) 44.9 in 1934 Lowest Monthly Avg Temp (F) 26.8 in 1973 Highest Temp this month (F): 67 on 14 th, 15 th Lowest Temp this month (F): 10 on 11 th Record High (F): 73 on 03/17/ /26/ /04/1966 Record Low (F): -16 on 03/04/1966 Temperature or precipitation records this month: 9 th LoMax 30, first set in 1969 Minimum Temp 20 o F or lower 9 Maximum Temp 60 o F or higher 12 Maximum Temp 40 o F or lower 2 Heating Degree Days 768 Normal 868 Cooling Degree Days 0 Normal 0 Degree base 65 o F Total March Precipitation 1.38 Normal March Precipitation 2.12 Departure from normal Greatest 24-Hr Precipitation 1.27 on 3/8-3/9 Total Precipitation Year-to-Date 4.88 Departure from Normal Number of Days: Clear 26 Partly Cloudy 3 Cloudy 2 Greatest March Precipitation 6.75 in 1970 Least March Precipitation 0.00 in 1972 Flagstaff Number of Days of: Minimum Temp 30 o F or higher 4 Average Wind Speed Highest Peak Gust 6.4 mph 40 mph from 220 o on 3 rd PHOENIX CLIMATE STATISTICS March 2013 This March was the 4 th warmest on record and had no significant ranking for precipitation. Avg Max Temp(F) 82.9 Normal 76.9 Avg Min Temp(F) 56.1 Normal 53.5 Avg Mean Temp (F) 69.5 Normal 65.2 Departure from Normal (F) +4.3 Highest Monthly Avg Temp (F) 72.3 in 2004 Lowest Monthly Avg Temp (F) 54.3 in 1897 Highest Temp this month (F): 95 on 14 th Lowest Temp this month (F): 44 on 9 th, 10 th Record High (F): 100 on 03/26/1988 Record Low (F): 25 on 03/04/ Temperature or precipitation records this month: 8 th Precip 0.84, previous record 0.43 in th HiMax 95 set, previous record 92 in th HiMax 92 tied, first set in th HiMin 62 set, previous record 61 in th HiMin 62 tied, first set in th HiMin 67 tied, first set in 1986 Phoenix Number of Days of: Minimum Temp 50 o F or lower 5 Minimum Temp 60 o F or higher 12 Maximum Temp 80 o F or lower 8 Maximum Temp 90 o F or higher 3 Heating Degree Days 34 Normal 81 Cooling Degree Days 180 Normal 87 Degree base 65 o F
5 Total March Precipitation 0.85 Normal March Precipitation 0.99 Departure from normal Greatest 24-Hr Precipitation 0.84 on 8 th Total Precipitation Year-to-Date 2.55 Departure from Normal Number of Days: Clear 14 Partly Cloudy 14 Cloudy 3 Greatest March Precipitation 4.82 in 1941 Least March Precipitation 0.00 in 1899, 1933, 1940, 1947, 1951, 1955, 1956, 1959, 1971, 1972, 1984, 2008 Average Wind Speed 5.3 mph Highest Peak Gust 41 mph from 280 o on 8 th TUCSON CLIMATE STATISTICS March 2013 This March was the 2 nd warmest and tied for 9 th driest on record. Avg Max Temp(F) 80.9 Normal 74.1 Avg Min Temp(F) 50.5 Normal 46.2 Avg Mean Temp(F) 65.7 Normal 60.1 Departure from Normal (F) +5.6 Highest Monthly Avg Temp (F) 66.6 in 2004 Lowest Monthly Avg Temp (F) 51.5 in 1973 Highest Temp this month (F): 94 on 15 th Lowest Temp this month (F): 33 on 1 st Record High (F): 99 on 03/26/1988 Record Low (F): 20 on 03/04/1965 Temperature or precipitation records this month: 13 th HiMax 89 set, previous record 88 in th HiMax 92 set, previous record 87 in th HiMax 94 set, previous record 93 in 1910 Tucson Number of Days of: Minimum Temp 50 o F or lower 13 Minimum Temp 60 o F or higher 2 Maximum Temp 80 o F or lower 11 Maximum Temp 90 o F or higher 3 Heating Degree Days 61 Normal 179 Cooling Degree Days 91 Normal 29 Degree base 65 o F Total March Precipitation 0.01 Normal March Precipitation 0.73 Departure from normal Greatest 24-Hr Precipitation 0.01 on 03/09 Total Precipitation Year-to-Date 1.61 Departure from Normal Greatest March Precipitation 3.88 in 1905 Least March Precipitation 0.00 in 1895, 1928, 1933, 1935, 1956, 1959, 1971, 1984 Number of Days: Clear 22 Partly Cloudy 2 Cloudy 7 Average Wind Speed Highest Peak Gust 6.7 mph 47 mph from 220 o on 8 th Data are from the National Weather Service and the National Climatic Data Center and are preliminary. 5
6 Winds for March: Day Phoenix Flagstaff Tucson (mph) Avg Max Avg Max Avg Max Dew Points for March: Daily Average Dew Point ( o F): Day Phx Tuc Flg
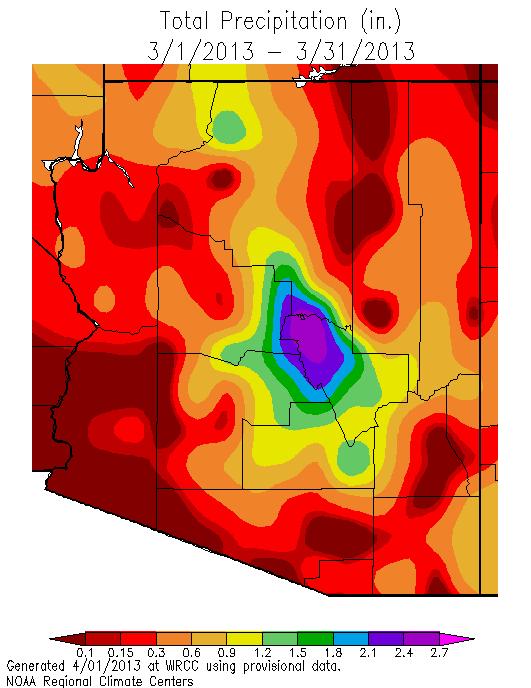
7 March 2013 Temperature, Dew Point, Wind Speed, and Precipitation Maps are based on preliminary data from the National Weather Service, the Arizona Meteorological Network (AZMet), operated by the University of Arizona College of Agriculture Cooperative Extension and the RAWS (Remote Automated Weather Station) network operated by the Bureau of Land Management and Forest Service, and the CoCoRaHS (Community Collaborative Rain, Hail and Snow) Network. Average nighttime temperatures ranged from 19 o F at Sunrise Mountain to 57 o F at Yuma. Average daytime temperatures ranged from 86 o F at Tacna to 48 o F at Sunrise Mountain. Precipitation values ranged from less than an inch at many locations in the southwest to 2.36 at Natural Bridge. 7

8 Average monthly dew points ranged from 15 o F at Window Rock, to 46 o F at Yuma. As in most months, average winds were light, with 12 mph as the highest average at Guthrie. The highest peak wind gust was 44 mph at Harquahala, west of Phoenix. Peak wind gusts blew in all different directions, which is typical as the high winds are generally attributed to thunderstorm outflows, which have no dominant direction. The arrows point to the direction the winds blow from. 8
9 Lowest temperature in March was 0 o F recorded at Sunrise Mountain. The highest daytime temperature of the month was 97 o F recorded at Yuma. 9
10 10


11 March minimum temperatures were above normal everywhere except the northeast corner and along the lower Colorado River. Daytime temperatures were 4 to 8 degrees warmer than normal, in contrast to the extreme cold temperatures in January. Precipitation was near average only in eastern Maricopa, northwestern Gila, western Yavapai and western Pinal counties. Most of the rest of the state received less than 50% of normal precipitation. 11
12 12

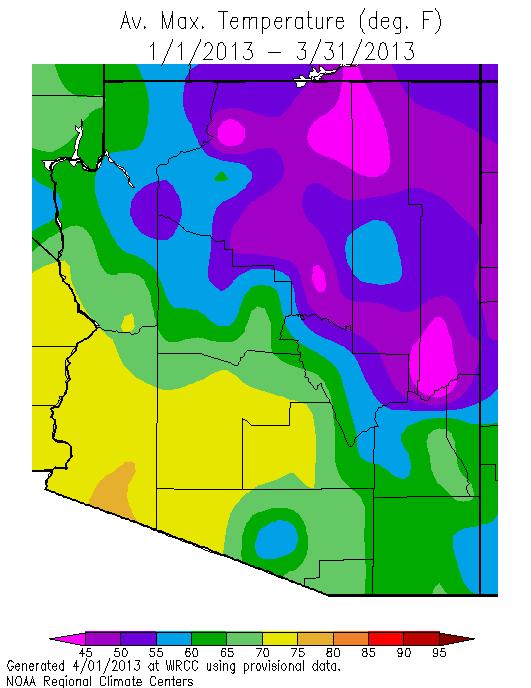
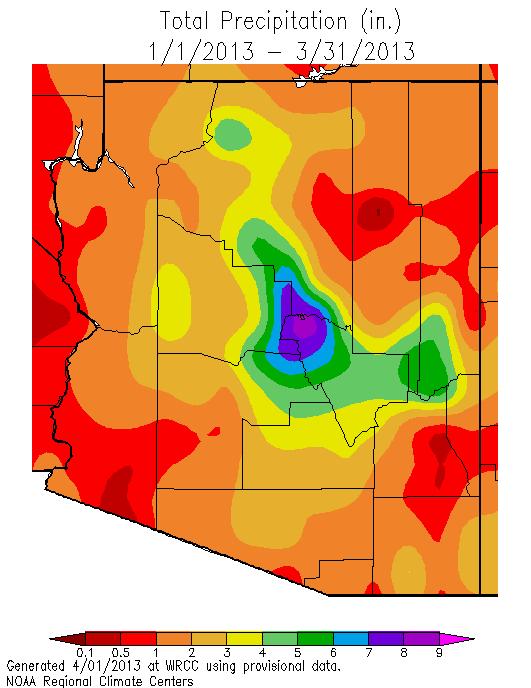
13 Calendar Year 2013 Average nighttime temperatures have been 1 to 5 o F colder than normal, while daytime temperatures have only been 1 to 3 degrees colder than normal. Precipitation is near average in eastern Maricopa and Yavapai counties, and western Gila and Pinal counties. Elsewhere rain and snow have been scarce, less than 70% of normal. 13
14 14


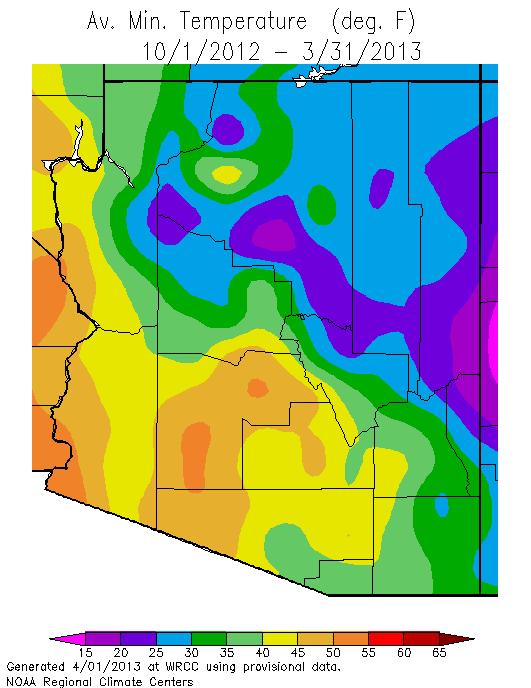
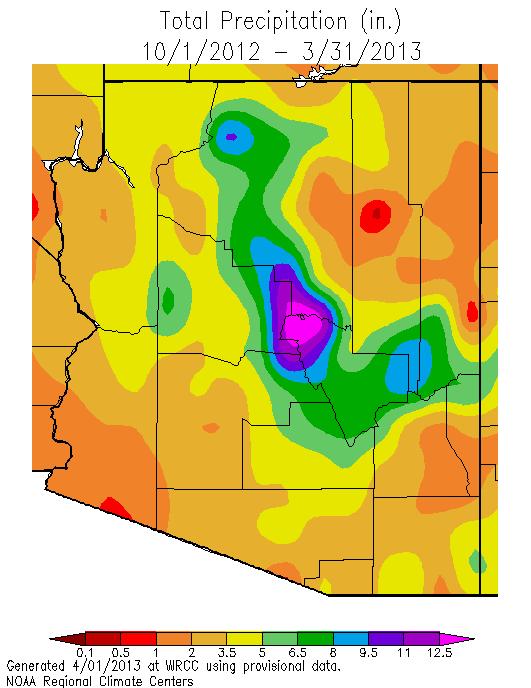
15 2013 Water Year Minimum temperatures have ranged from 4 degrees colder than normal to 2 degrees warmer than normal, with the warmer temperatures across Maricopa and central Mohave counties. Maximum temperatures are generally 0-2 o F warmer than normal, with slightly cooler temperatures in eastern Gila County. Through the end of March, the water year remains much drier than normal, generally less than 70% of average across most of the southern part of the state. The only wet areas continue to be the lower Colorado River valley in Mohave and La Paz counties and northern Gila County. 15
16 Temperature (F) Temperature (F) Temperature (F) March Mean Temperature Graphs Flagstaff, Phoenix, and Tucson : Flagstaff Mean MarchTemperature (Median 36.9F) Year Phoenix Mean March Temperature (Median 62.1 o F) Year Tucson Mean MarchTemperature (Median 58.7 o F) Year 16
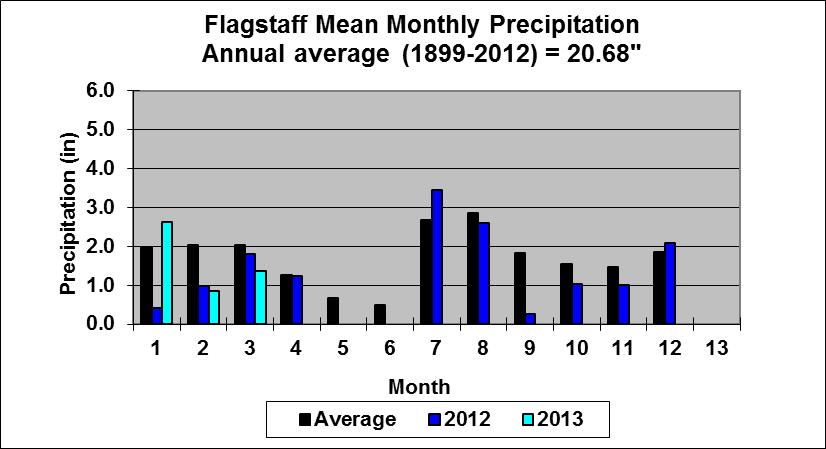
17 Precipitation (in) Precipitation (in) Precipitation (in) March Mean Precipitation Graphs Flagstaff, Phoenix, and Tucson : March Precipitation Flagstaff (Median 1.54") Year March Precipitation Phoenix (Median 0.52") Year March Precipitation Tucson (Median 0.49") Year 17


18 2013 Cumulative Precipitation Graphs Flagstaff, Phoenix and Tucson: Precipitation is well below average statewide. 18
19 The downloadable normals and extremes calendars use the following abbreviations: NORM = 30 year ( ) average value (degrees Fahrenheit (F)) OBS = The temperature observation for that day this year AVG = Average daily temperature HI MAX = Highest maximum temperature for that day (F) LO MAX = Lowest maximum temperature for that day (F) LO MIN = Lowest minimum temperature for that day (F) HI MIN = Highest minimum temperature for that day (F) Mx PCP = Maximum precipitation for that day (inches) Mx SNO = Maximum snowfall for that day (inches) 19
Arizona Climate Summary March 2013
 Arizona Climate Summary March 2013 Summary of conditions for February 2013 February 2013 Temperature and Precipitation Summary February 1 st 16 th : February began with a ridge of high pressure over the
Arizona Climate Summary May 2013
 Arizona Climate Summary May 2013 Summary of conditions for April 2013 April 2013 Temperature and Precipitation Summary April 1 st 16 th : The first week of April featured a ridge of high pressure over
Arizona Climate Summary May 2012
 Arizona Climate Summary May 2012 Summary of conditions for April 2012 April 2012 Temperature and Precipitation Summary April 1 st 16 th : Although April began with another low pressure system sweeping
Arizona Climate Summary June 2013
 Arizona Climate Summary June 2013 Summary of conditions for May 2013 May 2013 Temperature and Precipitation Summary May 1 st 16 th : May began with above normal daily temperatures and breezy conditions
Arizona Climate Summary February 2012
 Arizona Climate Summary February 2012 Summary of conditions for January 2012 January 2012 Temperature and Precipitation Summary January 1 st 20 th : The New Year has started on a very dry note. The La
Arizona Climate Summary October 2013
 Arizona Climate Summary October 2013 Summary of conditions for September 2013 September 2013 Temperature and Precipitation Summary September 1 st 16 th : With moist conditions still present throughout
Arizona Climate Summary
 Arizona Climate Summary June 2012 Summary of conditions for May 2012 May 2012 Temperature and Precipitation Summary May 1 st 16 th : May began with a surface cold front sweeping across the western states
Arizona Climate Summary November 2015 Summary of conditions for October 2015
 October 2015 Temperature and Precipitation Summary Arizona Climate Summary November 2015 Summary of conditions for October 2015 October 1 st 14 th : October began with high pressure over the southwest,
Arizona Climate Summary August 2013
 Arizona Climate Summary August 2013 Summary of conditions for July 2013 July 2013 Temperature and Precipitation Summary July 1 st 16 th : To start off the month of July, a high pressure system came in
Arizona Climate Summary July 2015 Summary of conditions for June 2015
 June 2015 Temperature and Precipitation Summary Arizona Climate Summary July 2015 Summary of conditions for June 2015 June 1 st 14 th : Similar to May, June began with high pressure in the west, and conditions
Arizona Climate Summary
 May 2015 Temperature and Precipitation Summary Arizona Climate Summary June 2015 Summary of conditions for May 2015 May 1 st 14 th : May began with high pressure in the west, and May 1 st was dry statewide,
Arizona Climate Summary
 Arizona Climate Summary April 2014 Summary of conditions for March 2014 March 2014 Temperature and Precipitation Summary March 1 st 16 th : We started off the month of March with a significant precipitation
Arizona Climate Summary January 2017 Summary of conditions for December 2016
 Arizona Climate Summary January 2017 Summary of conditions for December 2016 December 2016 Temperature and Precipitation Summary December 1 st 15 th : Similar to November, December began with a dry trough
Arizona Climate Summary May 2015 Summary of conditions for April 2015
 Arizona Climate Summary May 2015 Summary of conditions for April 2015 April 2015 Temperature and Precipitation Summary April 1 st 16 th : April began with very light showers in Nogales and Coronado National
Arizona Climate Summary
 April 2016 Temperature and Precipitation Summary Arizona Climate Summary May 2016 Summary of conditions for April 2016 April 1 st 15 th : April 1 st saw the tail end of a low pressure system move out of
Arizona Climate Summary
 August 2015 Temperature and Precipitation Summary Arizona Climate Summary September 2015 Summary of conditions for August 2015 August 1 st 16 th : August was a wet month across the state with only 3 days
Arizona Climate Summary
 Arizona Climate Summary March 2014 Summary of conditions for February 2014 February 2014 Temperature and Precipitation Summary February 1 st 16 th : We started off the month of February with some moisture
Arizona Climate Summary November 2013
 Arizona Climate Summary November 2013 Summary of conditions for October 2013 October 2013 Temperature and Precipitation Summary October 1 st 16 th : The month of October started off with fair weather conditions
Arizona Climate Summary November 2017 Summary of conditions for October 2017
 Arizona Climate Summary November 2017 Summary of conditions for October 2017 October 2017 Temperature and Precipitation Summary October 1 st 18 th : A low pressure system from the northwestern U.S. moved
Arizona Climate Summary December 2017 Summary of conditions for November 2017
 November 2017 Temperature and Precipitation Summary Arizona Climate Summary December 2017 Summary of conditions for November 2017 November 1 st 17 th : October ended with a little bit of precipitation
Arizona Climate Summary December 2016 Summary of conditions for November 2016
 Arizona Climate Summary December 2016 Summary of conditions for November 2016 November 2016 Temperature and Precipitation Summary November 1 st 16 th : November began with a dry low pressure system moving
Arizona Climate Summary April 2018 Summary of conditions for March 2018
 Arizona Climate Summary April 2018 Summary of conditions for March 2018 March 2018 Temperature and Precipitation Summary March 1 st 16 th : March began with rainfall in southeastern Arizona as the tail
Arizona Climate Summary November 2016 Summary of conditions for October 2016
 Arizona Climate Summary November 2016 Summary of conditions for October 2016 October 2016 Temperature and Precipitation Summary October 1 st 16 th : October began with high pressure over Mexico, bringing
Arizona Climate Summary November 2018 Summary of conditions for October 2018
 Arizona Climate Summary November 2018 Summary of conditions for October 2018 October 2018 Temperature and Precipitation Summary October 1 st 15 th : The 2018 water year ending September 30 th was exceptionally
Arizona Climate Summary
 Arizona Climate Summary August 2016 Summary of conditions for July 2016 July 2016 Temperature and Precipitation Summary July 1 st 15 th : As June ended and July began, a shortwave moved through the southwest
Arizona Climate Summary June 2017 Summary of conditions for May 2017
 Arizona Climate Summary June 2017 Summary of conditions for May 2017 May 2017 Temperature and Precipitation Summary May 1 st 16 th : A strong ridge of high pressure developed over the southwest during
Arizona Climate Summary September 2017 Summary of conditions for August 2017
 August 2017 Temperature and Precipitation Summary Arizona Climate Summary September 2017 Summary of conditions for August 2017 August 1 st 15 th : The monsoon activity that ended July continued into the
Arizona Climate Summary February 2016 Summary of conditions for January 2016
 January 2016 Temperature and Precipitation Summary Arizona Climate Summary February 2016 Summary of conditions for January 2016 January 1 st 14 th : The new year began with high pressure over the southwest
Arizona Climate Summary October 2015 Summary of conditions for September 2015
 September 2015 Temperature and Precipitation Summary Arizona Climate Summary October 2015 Summary of conditions for September 2015 September 1 st 18 th : September began with high pressure over southern
Arizona Climate Summary October 2012
 Arizona Climate Summary October 2012 Summary of conditions for September 2012 September 2012 Temperature and Precipitation Summary September 1 st 14 th : September began with an upper level low pressure
Arizona Climate Summary February 2018 Summary of conditions for January 2018
 Arizona Climate Summary February 2018 Summary of conditions for January 2018 January 2018 Temperature and Precipitation Summary January 1 st 19 th : The new year began with a ridge of high pressure over
Arizona Climate Summary October 2018 Summary of conditions for September 2018
 Arizona Climate Summary October 2018 Summary of conditions for September 2018 September 2018 Temperature and Precipitation Summary September 1 st 17 th : The wet pattern from August continued into September
Arizona Climate Summary May 2018 Summary of conditions for April 2018
 April 2018 Temperature and Precipitation Summary Arizona Climate Summary May 2018 Summary of conditions for April 2018 April 1 st 16 th : April was a very dry month across Arizona. Several low pressure
Arizona Climate Summary September 2018 Summary of conditions for August 2018
 August 2018 Temperature and Precipitation Summary Arizona Climate Summary September 2018 Summary of conditions for August 2018 August 1 st 15 th : August began with high pressure centered over the state
Arizona Climate Summary October 2016 Summary of conditions for September 2016
 September 2016 Temperature and Precipitation Summary Arizona Climate Summary October 2016 Summary of conditions for September 2016 September 1 st 14 th : High pressure over the Four Corners brought rainfall
Arizona Climate Summary September 2014 Summary of conditions for August 2014
 Arizona Climate Summary September 2014 Summary of conditions for August 2014 August 2014 Temperature and Precipitation Summary August 1 st 16 th : The first 5 days of August were quite wet with high pressure
Colorado State University, Fort Collins, CO Weather Station Monthly Summary Report
 Colorado State University, Fort Collins, CO Weather Station Monthly Summary Report Month: January Year: 2019 Temperature: Mean T max was 47.2 F which is 3.0 above the 1981-2010 normal for the month. This
Colorado State University, Fort Collins, CO Weather Station Monthly Summary Report
 Colorado State University, Fort Collins, CO Weather Station Monthly Summary Report Month: December Year: 2017 Temperature: Mean T max was 47.2 F which is 4.4 above the 1981-2010 normal for the month. This
Colorado State University, Fort Collins, CO Weather Station Monthly Summary Report
 Colorado State University, Fort Collins, CO Weather Station Monthly Summary Report Month: December Year: 2016 Temperature: Mean T max was 39.7 F which is 3.1 below the 1981-2010 normal for the month. This
Champaign-Urbana 1999 Annual Weather Summary
 Champaign-Urbana 1999 Annual Weather Summary ILLINOIS STATE WATER SURVEY 2204 Griffith Dr. Champaign, IL 61820 wxobsrvr@sws.uiuc.edu Maria Peters, Weather Observer A major snowstorm kicked off the new
Champaign-Urbana 2001 Annual Weather Summary
 Champaign-Urbana 2001 Annual Weather Summary ILLINOIS STATE WATER SURVEY 2204 Griffith Dr. Champaign, IL 61820 wxobsrvr@sws.uiuc.edu Maria Peters, Weather Observer January: After a cold and snowy December,
Champaign-Urbana 2000 Annual Weather Summary
 Champaign-Urbana 2000 Annual Weather Summary ILLINOIS STATE WATER SURVEY 2204 Griffith Dr. Champaign, IL 61820 wxobsrvr@sws.uiuc.edu Maria Peters, Weather Observer January: January started on a mild note,
Monthly Long Range Weather Commentary Issued: July 18, 2014 Steven A. Root, CCM, President/CEO
 Monthly Long Range Weather Commentary Issued: July 18, 2014 Steven A. Root, CCM, President/CEO sroot@weatherbank.com JUNE 2014 REVIEW Climate Highlights The Month in Review The average temperature for
The Pennsylvania Observer
 The Pennsylvania Observer April 2, 2009 March 2009 Pennsylvania Weather Recap Prepared by Curt Harpster For the month of March the saying, In like a lion and out like a lamb really fit the pattern quite
KANSAS CLIMATE SUMMARY January 2018
 KANSAS CLIMATE SUMMARY January 2018 Some welcome moisture After an extended period with little to no moisture, parts of Kansas recorded some significant precipitation. At Tribune, a small snow event on
Monthly Long Range Weather Commentary Issued: February 15, 2015 Steven A. Root, CCM, President/CEO
 Monthly Long Range Weather Commentary Issued: February 15, 2015 Steven A. Root, CCM, President/CEO sroot@weatherbank.com JANUARY 2015 Climate Highlights The Month in Review During January, the average
Colorado State University, Fort Collins, CO Weather Station Monthly Summary Report
 Colorado State University, Fort Collins, CO Weather Station Monthly Summary Report Month: February Year: 2017 Webcam catching a hawk watching over the station. Temperature: Mean T max was 54.4 F which
The Weather Wire. Current Colorado Snowpack. Contents:
 The Weather Wire January 2019 Volume 26 Number 1 Contents: Current Colorado Snowpack Denver Snowfall Since 1999-2000 Denver 2018 Climate Review Drought Monitor December Summary/Statistics January Preview
Drought Update May 11, 2018
 Drought Update May 11, 2018 Current status After a record cold April, May has started with much warmer than normal temperatures. The statewide average temperature for the week ending on May 8th was 65.7
Monthly Long Range Weather Commentary Issued: APRIL 25, 2016 Steven A. Root, CCM, Chief Analytics Officer, Sr. VP, sales
 Monthly Long Range Weather Commentary Issued: APRIL 25, 2016 Steven A. Root, CCM, Chief Analytics Officer, Sr. VP, sales sroot@weatherbank.com MARCH 2016 Climate Highlights The Month in Review The March
The Pennsylvania Observer
 The Pennsylvania Observer December 2, 2015 November 2015 - Pennsylvania Weather Recap By: Anthny Chiavaroli This November was dry with above average temperatures across the state. Western PA saw some very
APPENDIX G-7 METEROLOGICAL DATA
 APPENDIX G-7 METEROLOGICAL DATA METEOROLOGICAL DATA FOR AIR AND NOISE SAMPLING DAYS AT MMR Monthly Normals and Extremes for Honolulu International Airport Table G7-1 MMR RAWS Station Hourly Data Tables
2012 Growing Season Weather Summary for North Dakota. Adnan Akyüz and Barbara A. Mullins Department of Soil Science October 30, 2012
 2012 Growing Season Weather Summary for North Dakota Adnan Akyüz and Barbara A. Mullins Department of Soil Science October 30, 2012 Introduction The 2012 growing season (the period from April through September)
May 2016 Volume 23 Number 5
 The Weather Wire May 2016 Volume 23 Number 5 Contents: Winter Summary Current Colorado and West-wide Snow Pack Drought Monitor April Summary/Statistics May Preview Snowfall Totals Winter Summary The Front
Champaign-Urbana 1998 Annual Weather Summary
 Champaign-Urbana 1998 Annual Weather Summary ILLINOIS STATE WATER SURVEY Audrey Bryan, Weather Observer 2204 Griffith Dr. Champaign, IL 61820 wxobsrvr@sparc.sws.uiuc.edu The development of the El Nìno
KANSAS CLIMATE SUMMARY February 2017
 KANSAS CLIMATE SUMMARY February 2017 Warm and dry February was much warmer and drier than normal. The state-wide average temperature was 41.9 o F, which is 7.9 degrees warmer than normal. This places it
October Precipitation Statistics (124 Years) Rank: Figure 2: Historical October precipitation time series for Maryland.
 Rank: Figure 2: Historical October precipitation time series for Maryland.") PRECIPITATION Based on the National Centers for Environmental Information (NCEI), Office of the Maryland State the statewide total October precipitation was 3.88 inches, which was 1.01 inches less than
PRECIPITATION Based on the National Centers for Environmental Information (NCEI), Office of the Maryland State the statewide total October precipitation was 3.88 inches, which was 1.01 inches less than
The Weather Wire. Contents: Summer 2018 Outlook. Summer 2018 Outlook Drought Monitor May Summary/Statistics June Preview Rainfall Totals
 The Weather Wire June 2018 Volume 25 Number 6 Contents: Summer 2018 Outlook Drought Monitor May Summary/Statistics June Preview Rainfall Totals Summer 2018 Outlook June 1 st marked the first day of meteorological
May 2005 Climate Summary
 Ashley Brooks (765) 494-6574 Jun 7, 2005 http://iclimate.org May 2005 Climate Summary May 1-5 Early May was characterized by an upper-level trough that was in place over Indiana that brought in very cool
New Hampshire State Climate Office Dr. Mary D. Stampone, State Climatologist
 New Hampshire State Climate Office Dr. Mary D. Stampone, State Climatologist University of New Hampshire c/o Department of Geography 73 Main Street Durham, NH 03824 Phone: 603-862-3136 Fax: 603-862-4362
The Weather Wire. Contents: Wildfires Burning Across Colorado
 The Weather Wire July 2018 Volume 25 Number 7 Contents: Wildfires Burning Across Colorado Drought Monitor June Summary/Statistics July Preview Rainfall Totals Wildfires Burning Across Colorado Following
NIDIS Intermountain West Drought Early Warning System April 18, 2017
 1 of 11 4/18/2017 3:42 PM Precipitation NIDIS Intermountain West Drought Early Warning System April 18, 2017 The images above use daily precipitation statistics from NWS COOP, CoCoRaHS, and CoAgMet stations.
KANSAS CLIMATE SUMMARY March 2018
 KANSAS CLIMATE SUMMARY March 2018 Another Dry Month The Southwest Division again missed out on most of the precipitation during March. State-wide the average precipitation was 0.97 inches or 41 percent
The Pennsylvania Observer
 The Pennsylvania Observer October 1, 2015 September 2015 - Pennsylvania Weather Recap By: Quinn Lease The month of September will be remembered for its above normal temperatures and dry conditions that
Monthly Long Range Weather Commentary Issued: APRIL 1, 2015 Steven A. Root, CCM, President/CEO
 Monthly Long Range Weather Commentary Issued: APRIL 1, 2015 Steven A. Root, CCM, President/CEO sroot@weatherbank.com FEBRUARY 2015 Climate Highlights The Month in Review The February contiguous U.S. temperature
NIDIS Drought and Water Assessment
 NIDIS Drought and Water Assessment PRECIPITATION The images above use daily precipitation statistics from NWS COOP, CoCoRaHS, and CoAgMet stations. From top to bottom, and left to right: most recent 7-days
Monthly Long Range Weather Commentary Issued: APRIL 18, 2017 Steven A. Root, CCM, Chief Analytics Officer, Sr. VP,
 Monthly Long Range Weather Commentary Issued: APRIL 18, 2017 Steven A. Root, CCM, Chief Analytics Officer, Sr. VP, sroot@weatherbank.com MARCH 2017 Climate Highlights The Month in Review The average contiguous
The Pennsylvania Observer
 The Pennsylvania Observer June 2, 2010 May 2010 Pennsylvania Weather Recap This month completed one of the warmest springs on record in Pennsylvania. With about 75% of the days averaging above normal,
The Weather Wire. Current Colorado Snowpack. Contents:
 The Weather Wire December 2018 Volume 25 Number 12 Contents: Current Colorado Snowpack Drought Monitor November Summary/Statistics December Preview Snowfall Totals Current Colorado Snowpack Although snowfall
Weather and Climate Summary and Forecast January 2018 Report
 Weather and Climate Summary and Forecast January 2018 Report Gregory V. Jones Linfield College January 5, 2018 Summary: A persistent ridge of high pressure over the west in December produced strong inversions
The Pennsylvania Observer
 The Pennsylvania Observer The Pennsylvania Observer September 16, 2004 Recap of Pennsylvania's weather from August 6 - September 12, 2004. http://pasc.met.psu.edu/pa_climatologist/nl/archive/20040916/sec1.php
Investigation of the Arizona Severe Weather Event of August 8 th, 1997
 Investigation of the Arizona Severe Weather Event of August 8 th, 1997 Tim Hollfelder May 10 th, 2006 Abstract Synoptic scale forcings were very weak for these thunderstorms on August 7-8, 1997 over the
Climate. Annual Temperature (Last 30 Years) January Temperature. July Temperature. Average Precipitation (Last 30 Years)
 January Temperature. July Temperature. Average Precipitation (Last 30 Years)") Climate Annual Temperature (Last 30 Years) Average Annual High Temp. (F)70, (C)21 Average Annual Low Temp. (F)43, (C)6 January Temperature Average January High Temp. (F)48, (C)9 Average January Low Temp.
Climate Annual Temperature (Last 30 Years) Average Annual High Temp. (F)70, (C)21 Average Annual Low Temp. (F)43, (C)6 January Temperature Average January High Temp. (F)48, (C)9 Average January Low Temp.
October 2015 Volume 22 Number 10
 The Weather Wire October 2015 Volume 22 Number 10 Contents: Local Frost/Freeze Information Drought Monitor September Summary/Statistics October Preview Rainfall Totals Local Frost Freeze Information Many
KANSAS CLIMATE SUMMARY May 2018
 KANSAS CLIMATE SUMMARY May 2018 From Cold to Hot May came close to setting the record as the hottest since 1895. The state-wide average temperature for the month was 70.6 o F. This was 7.2 degrees warmer
Weather and Climate Summary and Forecast February 2018 Report
 Weather and Climate Summary and Forecast February 2018 Report Gregory V. Jones Linfield College February 5, 2018 Summary: For the majority of the month of January the persistent ridge of high pressure
Chill Hour Assessment for the Yuma Area
 Chill Hour Assessment for the Yuma Area Item Type text; Article Authors Brown, Paul W. Publisher College of Agriculture, University of Arizona (Tucson, AZ) Journal Deciduous Fruit and Nut: A College of
KANSAS CLIMATE SUMMARY February 2015
 KANSAS CLIMATE SUMMARY February 2015 Extended Cold Despite some record warm readings at a few locations, February was characterized by colder than normal conditions. This was particularly true during the
Office of the Washington State Climatologist
 Office of the Washington State Climatologist May 3, 2013 April Event Summary Average April temperatures were below normal for a majority of the state. Total precipitation was above normal for western and
Weather and Climate Summary and Forecast Summer 2016
 Weather and Climate Summary and Forecast Summer 2016 Gregory V. Jones Southern Oregon University June 6, 2016 May 2016 continued the warm trend for portions of the west, while providing some relief for
NIDIS Intermountain West Drought Early Warning System December 11, 2018
 NIDIS Drought and Water Assessment NIDIS Intermountain West Drought Early Warning System December 11, 2018 Precipitation The images above use daily precipitation statistics from NWS COOP, CoCoRaHS, and
KANSAS CLIMATE SUMMARY November 2017
 KANSAS CLIMATE SUMMARY November 2017 Dry The major climate feature for November was the dryness. Statewide average precipitation was just 0.10 inches, which is a 3-way tie for the sixth driest November
Weather and Climate Summary and Forecast October 2018 Report
 Weather and Climate Summary and Forecast October 2018 Report Gregory V. Jones Linfield College October 4, 2018 Summary: Much of Washington, Oregon, coastal California and the Bay Area and delta region
Weather History on the Bishop Paiute Reservation
 Weather History on the Bishop Paiute Reservation -211 For additional information contact Toni Richards, Air Quality Specialist 76 873 784 toni.richards@bishoppaiute.org Updated 2//214 3:14 PM Weather History
NIDIS Intermountain West Drought Early Warning System February 12, 2019
 NIDIS Intermountain West Drought Early Warning System February 12, 2019 Precipitation The images above use daily precipitation statistics from NWS COOP, CoCoRaHS, and CoAgMet stations. From top to bottom,
2011 Year in Review TORNADOES
 2011 Year in Review The year 2011 had weather events that will be remembered for a long time. Two significant tornado outbreaks in April, widespread damage and power outages from Hurricane Irene in August
The Climate of Bryan County
 The Climate of Bryan County Bryan County is part of the Crosstimbers throughout most of the county. The extreme eastern portions of Bryan County are part of the Cypress Swamp and Forest. Average annual
Weather and Climate Summary and Forecast March 2018 Report
 Weather and Climate Summary and Forecast March 2018 Report Gregory V. Jones Linfield College March 7, 2018 Summary: The ridge pattern that brought drier and warmer conditions from December through most
Monthly Long Range Weather Commentary Issued: May 15, 2014 Steven A. Root, CCM, President/CEO
 Monthly Long Range Weather Commentary Issued: May 15, 2014 Steven A. Root, CCM, President/CEO sroot@weatherbank.com APRIL 2014 REVIEW Climate Highlights The Month in Review The average temperature for
KANSAS CLIMATE SUMMARY August 2015
 KANSAS CLIMATE SUMMARY August 2015 Cool and Dry August was drier than normal in most of the state. State-wide average precipitation was 2.80 inches or 85 percent of normal. The Northeast division of the
Weather and Climate of the Rogue Valley By Gregory V. Jones, Ph.D., Southern Oregon University
 Weather and Climate of the Rogue Valley By Gregory V. Jones, Ph.D., Southern Oregon University The Rogue Valley region is one of many intermountain valley areas along the west coast of the United States.
The Pennsylvania Observer
 The Pennsylvania Observer May 31, 2012 May 2012 - Pennsylvania Weather Recap By: Paul Knight The majority of the fifth month had temperatures averaging well above seasonal levels with two distinct hot
Weather and Climate Summary and Forecast Winter
 Weather and Climate Summary and Forecast Winter 2016-17 Gregory V. Jones Southern Oregon University February 7, 2017 What a difference from last year at this time. Temperatures in January and February
September 2018 Volume: 01, No: 9. Office of the Maryland State Climatologist. Department of Atmospheric and Oceanic Science
 Office of the Maryland State Climatologist Department of Atmospheric and Oceanic Science 4254 Stadium Dr, College Park, MD 20742 www.atmos.umd.edu/~climate PRECIPITATION Based on the National Centers for
The Climate of Kiowa County
 The Climate of Kiowa County Kiowa County is part of the Central Great Plains, encompassing some of the best agricultural land in Oklahoma. Average annual precipitation ranges from about 24 inches in northwestern
KANSAS CLIMATE SUMMARY June 2018
 KANSAS CLIMATE SUMMARY June 2018 Continued Heat While the heat wasn t as dramatic as in May, June still came in as the 7 th warmest since 1895. The statewide average for the month was 77.9 o F. This was
The Climate of Payne County
 The Climate of Payne County Payne County is part of the Central Great Plains in the west, encompassing some of the best agricultural land in Oklahoma. Payne County is also part of the Crosstimbers in the
KANSAS CLIMATE SUMMARY June 2017
 KANSAS CLIMATE SUMMARY June 2017 Uneven rainfall The wet May gave way to uneven rainfall in June. The statewide average precipitation was 3.23 inches or 74 percent of normal. The East Central and West
KANSAS CLIMATE SUMMARY October 2016
 KANSAS CLIMATE SUMMARY October 2016 Record warmth Temperatures continued the warmer than normal pattern through much of October. The state-wide average temperature was 60.9 of, or 5.6 degrees warmer than
The Climate of Murray County
 The Climate of Murray County Murray County is part of the Crosstimbers. This region is a transition between prairies and the mountains of southeastern Oklahoma. Average annual precipitation ranges from