Arizona Climate Summary May 2018 Summary of conditions for April 2018
|
|
|
- Sherilyn Horn
- 5 years ago
- Views:
Transcription


1 April 2018 Temperature and Precipitation Summary Arizona Climate Summary May 2018 Summary of conditions for April 2018 April 1 st 16 th : April was a very dry month across Arizona. Several low pressure systems passed north of Arizona during the first week of April, but no precipitation was reported in the state. Temperatures were roughly 10 degrees above normal statewide. Three more low pressure systems crossed Utah and Colorado in the second week of April, and again the precipitation bypassed Arizona. Phoenix had its first 100 o F day of the year on the 10 th. While the precipitation missed the state, the winds from the storms did not. April was quite windy across Arizona, particularly northern Arizona, and when combined with the hot and dry weather, fire danger is extreme across most of the state. Several wildfires are still burning and fire danger will remain very high until the monsoon rainfall begins. The dry conditions also exacerbated the drought, and led to the expansion of Extreme Drought (D3) through Yuma County and the introduction of Exceptional Drought (D4) in Apache and Navajo counties (see P.10). The Navajo Nation declared a drought emergency in April. April 17 th 30 th : By the 17 th another strong low pressure system moved south from the Pacific Northwest into Nevada and Utah, bringing rain and snow to those states, but Arizona only benefitted by some cooler temperatures. On the 19 th, yet another system moved south through California and finally on the 20 th, rain was reported across northern Arizona. Flagstaff had 0.06, Grand Canyon AP had 0.08, Page had 0.09, St. Johns had 0.05, Window Rock had 0.02, Winslow had 0.08, and Bellemont had On the 21 st, St. Johns had another 0.11, Window Rock had 0.02, and Bellemont had 0.19, Petrified Forest had 0.14, and Show Low had During this storm temperatures only dipped slightly on the 20 th as it was a warm storm. High pressure returned and temperatures quickly rebounded to 10 degrees or more above normal. The southwest deserts had temperatures in the upper 90s while the higher elevations reached the lower 70s. Nighttime temperatures were in the lower 60s in the deserts and in the mid 20s at the higher elevations. On the 25 th Castle Hot Springs reached 100 o F, and on the 27 th Eloy and Phoenix reached 100 o F. This was the second day of 100 o F for Phoenix. From the 28 th through the 30 th another system moved across the state with very high winds but the storm stalled no further precipitation fell in the state during April. In This Issue: Overview of April, graphs of the April daily maximum and minimum temperatures, precipitation, mean daily dew points for Flagstaff, Phoenix, and Tucson; April climate statistics, maps of mean monthly maximum and minimum temperatures, precipitation, dew points, wind speeds for April; short-term drought maps for the beginning and end of April 2018; Long-term Drought Map through April; and graphs of the mean April temperature and precipitation for the period of record for Tucson, Phoenix, and Flagstaff, graphs of the cumulative precipitation for the calendar year for Flagstaff, Phoenix, and Tucson. Climate calendars for Flagstaff, Phoenix, Tucson, Prescott, Winslow and Yuma, including daily and monthly normals and extremes, for each month of the year, are not yet updated through See p.21 of this report for calendar abbreviations. Data are preliminary and are from the National Weather Service Forecast Offices in Flagstaff, Phoenix and Tucson. **Note: The discrepancy between the Statewide Temperature and Precipitation values for Phoenix, Flagstaff and Tucson and the daily values in their graphs are due to the reporting times. Statewide Temperature and Precipitation values are taken at 5pm, while official daily records at the airports are taken from Midnight to Midnight. Dr. Nancy J. Selover, State Climatologist Edited by Nancy J. Selover 2018 Arizona State Climate Office 1


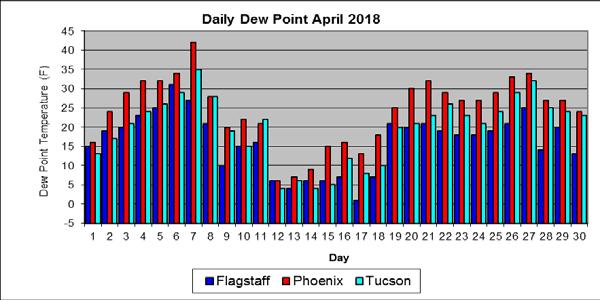
2 April 2018 Daily Temperature, Precipitation, & Dew Point for Flagstaff, Phoenix, and Tucson 2
3 3
4 FLAGSTAFF CLIMATE STATISTICS April 2018 This April was the 6 th warmest on record and tied for 4 th driest with Avg Max Temp(F) 64.4 Normal 58.2 Avg Min Temp(F) 31.3 Normal 28.5 Avg Mean Temp(F) 47.8 Normal 43.3 Departure from Normal (F) +4.5 Highest Monthly Avg Temp (F) 50.4 in 1989 Lowest Monthly Avg Temp (F) 36.2 in 1975 Highest Temp this month (F): 75 on 26 th Lowest Temp this month (F): 21 on 19 th Record High (F): 80 on 4/7/1989, 4/28/1992 Record Low (F): -2 on 4/02/1975 Temperature or precipitation records this month: 8 th HiMin 44 set, previous record 41 in 2007 Flagstaff Number of Days of: Minimum Temp 35 o F or higher 10 Minimum Temp 30 o F or lower 14 Maximum Temp 70 o F or higher 9 Maximum Temp 60 o F or lower 8 Heating Degree Days 509 Normal 649 Cooling Degree Days 0 Normal 0 Degree base 65 o F Total April Precipitation 0.06 Normal April Precipitation 1.15 Departure from normal Greatest 24-Hr Precipitation 0.06 on 20 th Total Precipitation Year-to-Date 5.01 Departure from Normal Total April Snowfall Trace Normal 7.1 Record April Snowfall 58.3 in 1965 Number of Days: Clear 28 Partly Cloudy 2 Cloudy 0 Greatest April Precipitation 5.62 in 1965 Least April Precipitation: 0.00 in 1991 Average Wind Speed Highest Peak Gust 9.8 mph 57 mph from 200 o on 19 th PHOENIX CLIMATE STATISTICS April 2018 This April was the 3rd warmest on record and tied for the driest April with 31 other years. Phoenix still has had only 6 days of rain since January 1 st and only 8 days of rain since Aug 23 rd. Avg Max Temp(F) 90.6 Normal 85.2 Avg Min Temp(F) 64.3 Normal 60.2 Avg Mean Temp (F) 77.4 Normal 72.7 Departure from Normal (F) +4.7 Highest Monthly Avg Temp (F) 80.0 in 1989 Lowest Monthly Avg Temp (F) 62.4 in 1967 Highest Temp this month (F) 100 on 10 th, 27th Lowest Temp this month (F): 54 on 18 th Record High (F): 105 on 4/22/2012, 4/29/1992, 4/20/1989 Record Low (F): 35 on 4/10/ Temperature or precipitation records this month: 6 th HiMin 67 tied, first set in th HiMin 69 tied, first set in th HiMin 74 set, previous record 70 in th HiMax 100 tied, first set in 1989 Phoenix Number of Days of: Minimum Temp 60 o F or lower 8 Minimum Temp 70 o F or higher 4 Maximum Temp 80 o F or lower 3 Maximum Temp 95 o F or higher 9 Heating Degree Days 0 Normal 17 Cooling Degree Days 381 Normal 251 Degree base 65 o F Total April Precipitation 0.00 Normal April Precipitation 0.28
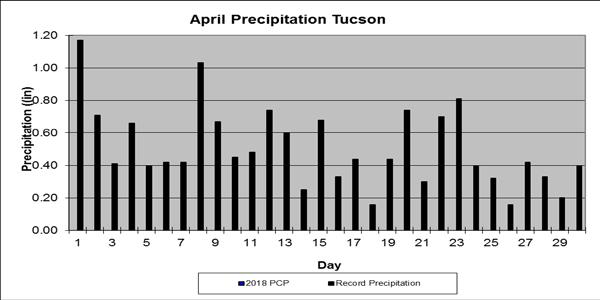
5 Departure from normal Greatest 24-Hr Precipitation 0.00 Total Precipitation Year-to-Date 0.77 Departure from Normal Greatest April Precipitation 3.36 in 1926 Least April Precipitation 0.00 in 2008, 2000 and 30 other years Number of Days: Clear 8 Partly Cloudy 20 Cloudy 2 Average Wind Speed 7.6 mph Highest Peak Gust 44 mph from 270 o on 12 th TUCSON CLIMATE STATISTICS April 2018 This April was the 2nd warmest on record and was tied with 26 other years for the driest April on record. Avg Max Temp(F) 88.4 Normal 82.1 Avg Min Temp(F) 56.8 Normal 52.0 Avg Mean Temp(F) 72.6 Normal 67.0 Departure from Normal (F) +5.6 Highest Monthly Avg Temp (F) 73.8 in 1989 Lowest Monthly Avg Temp (F) 57.8 in 1975 Highest Temp this month (F): Lowest Temp this month (F): 96 on 10 th, 27 th 43 on 14 th Record High (F): 104 on 4/20/1989, 4/21/1989 Record Low (F): 27 on 4/04/1945 Temperature or precipitation records this month: 10 th HiMax 96 tied, set in 1907 and th HiMax 95 tied, set in 1907 and 1988 Tucson Number of Days of: Minimum Temp 50 o F or lower 5 Minimum Temp 60 o F or higher 12 Maximum Temp 80 o F or lower 4 Maximum Temp 95 o F or higher 7 Heating Degree Days 12 Normal 60 Cooling Degree Days 247 Normal 121 Degree base 65 o F Total April Precipitation 0.00 Normal April Precipitation 0.31 Departure from normal Greatest 24-Hr Precipitation 0.00 Total Precipitation Year-to-Date 1.98 Departure from Normal Greatest April Precipitation 3.53 in 1905 Least April Precipitation 0.00 in 1895, 1950, 2002, and 23 other years. Number of Days: Clear 28 Partly Cloudy 0 Cloudy 0 Average Wind Speed Highest Peak Gust 7.9 mph 42 mph from 210 o on 12 th Data are from the National Weather Service and the National Climatic Data Center and are preliminary. 5
6 Wind Speeds for April: Day Phoenix Flagstaff Tucson (mph) Avg Max Avg Max Avg Max Dew Points for April: Daily Average Dew Point ( o F): Day Phx Tuc Flg
7 The 7

8 April 2018 The minimum temperatures ranged from 10 o F at Grand Canyon National Park and Sunset Crater to 59 o F at Litchfield Park. The lowest maximum temperature of 62 o F was recorded at Snowslide Canyon and the highest was 107 o F at Havasu. The highest rainfall totals were 0.70 at Maverick Fork and Wildcat and the lowest was 0.00 at many stations. The lowest average dew point was 11 o F at Window Rock and the highest was 40 o F at Parker. The highest peak wind gust, other than Flagstaff, Phoenix and Tucson was 41 mph at Bonita. Average wind speeds ranged from 2 mph in the Phoenix area to 14 mph at Show Low Airport. 8
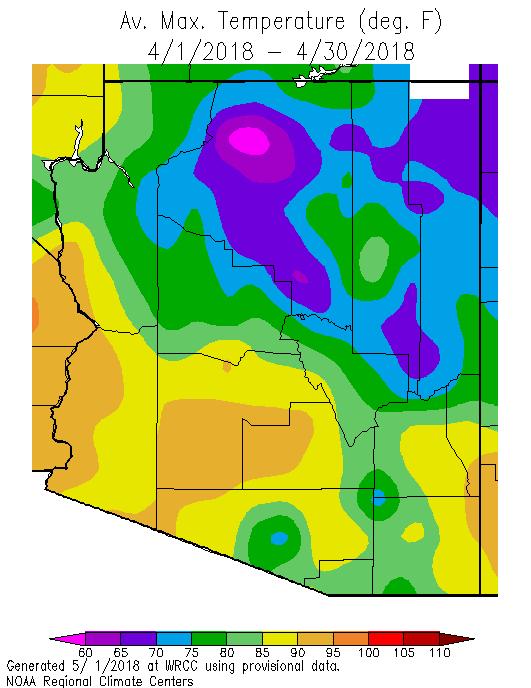
9 T April 2018 The highest average minimum temperature was 66 o F at Falcon Field, and the lowest average minimum temperature was 24 o F at Grand Canyon National Park. The highest average maximum temperature was 94 o F at Yuma, Havasu, Bullhead City and Bartlett Dam and the lowest average maximum temperature was 53 o F at Snowslide Canyon. 9
 expanded through western Pinal and southern Maricopa to the California border through Yuma County. Arizona and expanded across the northeast counties.")
10 Short term drought maps for March 27 th on left and May 1 st on right. The extremely dry April led to an expansion of Severe Drought (D2) through northern Mohave County. Extreme Drought (D3) expanded through western Pinal and southern Maricopa to the California border through Yuma County. Arizona and expanded across the northeast counties. Exceptional Drought (D4) was introduced into Apache and Navajo counties and covers 9.62% of the state. Extreme Drought (D3) increased from 46.5% of the state last month to 50.7% by the end of April. Drought impacts include native vegetation dying in some areas of the state, water hauling for livestock and wildlife, decimated forage, supplementing feed for livestock, culling herds and dry soils leading to increased blowing dust. 10

11 Long-term drought map for April for Arizona shows hydrologic drought, and this month it is based on precipitation and evaporation using the Standardized Precipitation Evaporative Index (SPEI) over the past 24-, 36-, and 48-months. While a few areas are shown as No Drought, these are mostly likely due to a lack of data, as the entire state is experiencing a long-term deficit of precipitation and reduced recharge to aquifers and reservoirs, as well as enhanced evaporation due to the high temperatures. 11
12 12

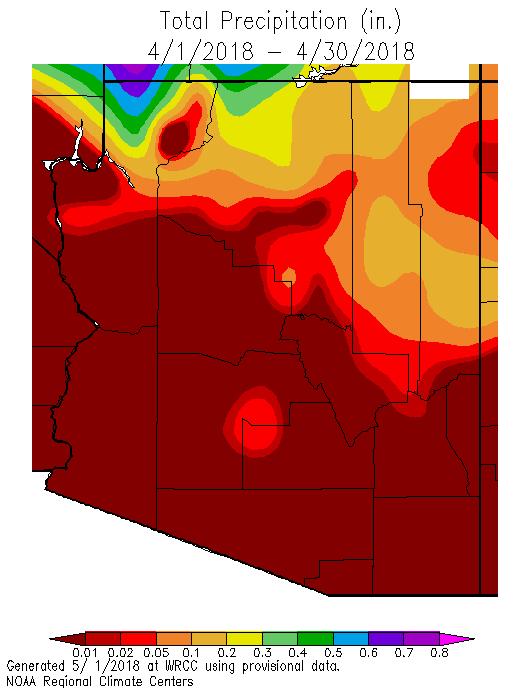
13 April April minimum temperatures were 2 to 6 o F warmer than average across the state with slightly cooler than average temperatures at the border of Gila, Coconino and Yavapai counties. Daytime temperatures were 2 to 8 o F warmer than average across the state. April was much drier than March with virtually the entire state receiving less than 25% of normal precipitation. The lack of winter storms caused both the dry conditions and the warmer than normal temperatures in the state. 13
14 14
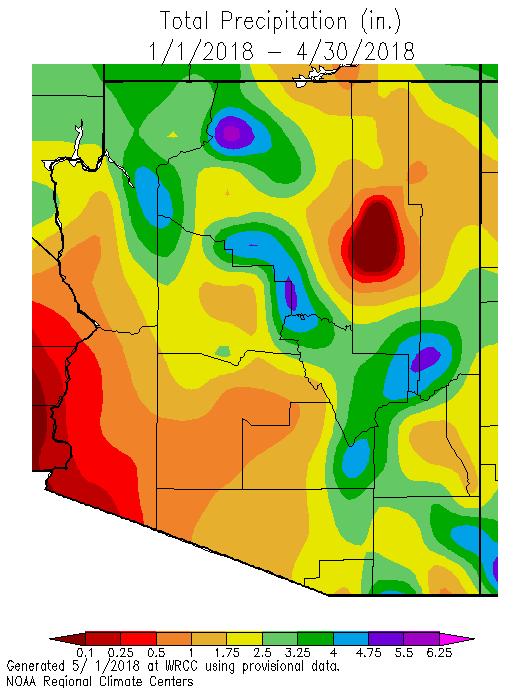
15 Calendar Year 2018 Calendar year minimum temperatures across Arizona were generally within 2 o F of average with warmer conditions in the southwest and much warmer than normal conditions in La Paz County, and cooler than normal conditions in the northeast. Daytime temperatures have been 0 to 6 o F warmer than average statewide. Since January, most of the state has received less than 70% of average precipitation though the southwest third of the state has received less than 50% of average. Southeastern Arizona and southern Apache County received over 100% of average precipitation, primarily from February storms. 15
16 16


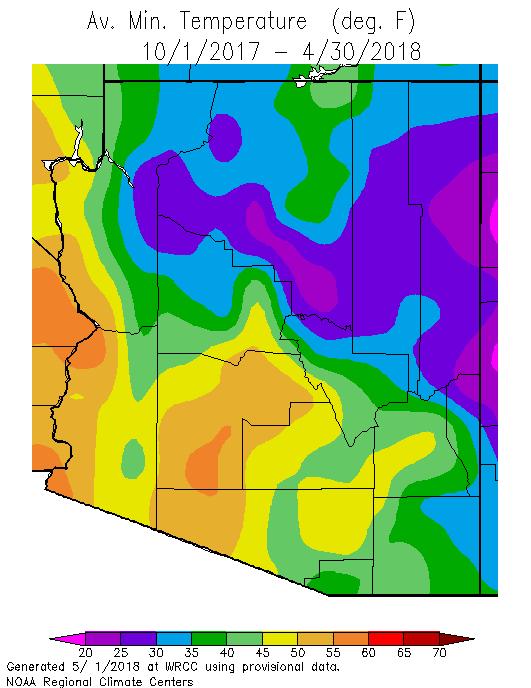
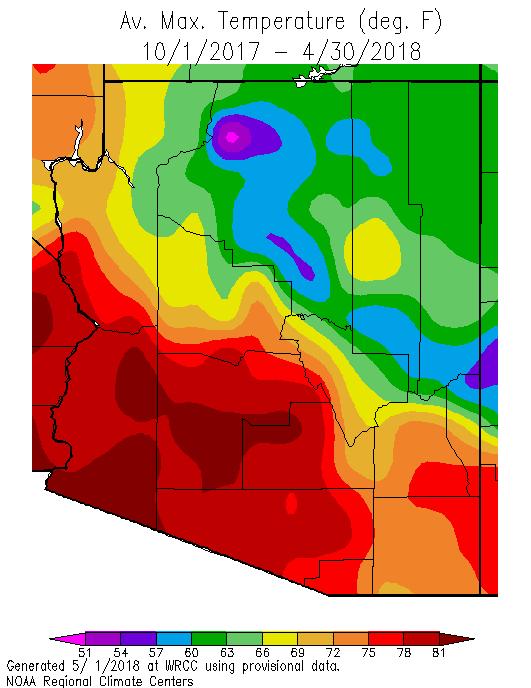
17 s aham, Cochise, La Paz, OPima and 2018 Water Year Water Year 2018 minimum temperatures have ranged from 2 o F cooler than normal to 4 o F warmer than normal across the state. Daytime temperatures have been 2 to 6 o F warmer than normal statewide, with a few pockets that have been 6 to 8 o F warmer than average. The entire state has received less than 50% of normal precipitation since October 1 st in one of our driest winters on record. The southwest, central Arizona, and central Navajo County have received less than 25% of normal precipitation. The run-off into the reservoirs and streams is forecast to be near record low values this year, and the upper Colorado snowpack is also extremely low. 17


18 April Mean Temperature Graphs Flagstaff, Phoenix, and Tucson : 18
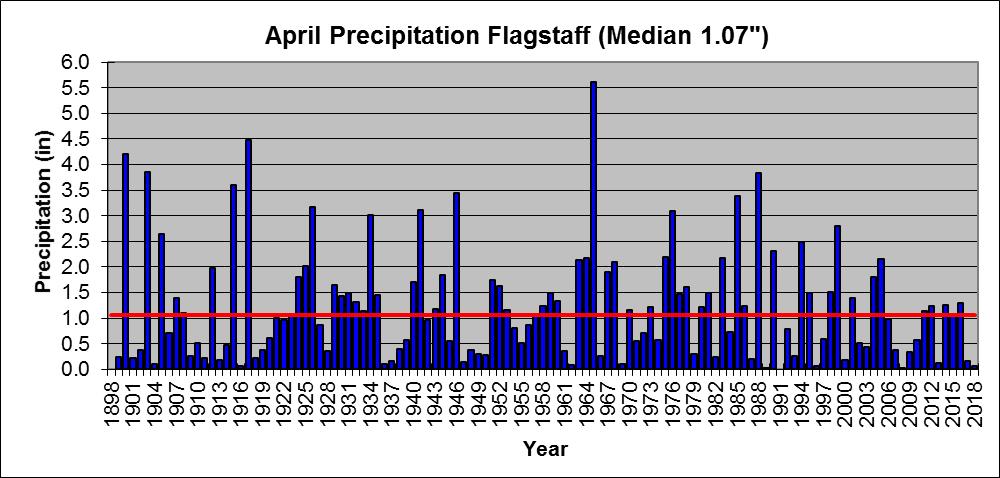
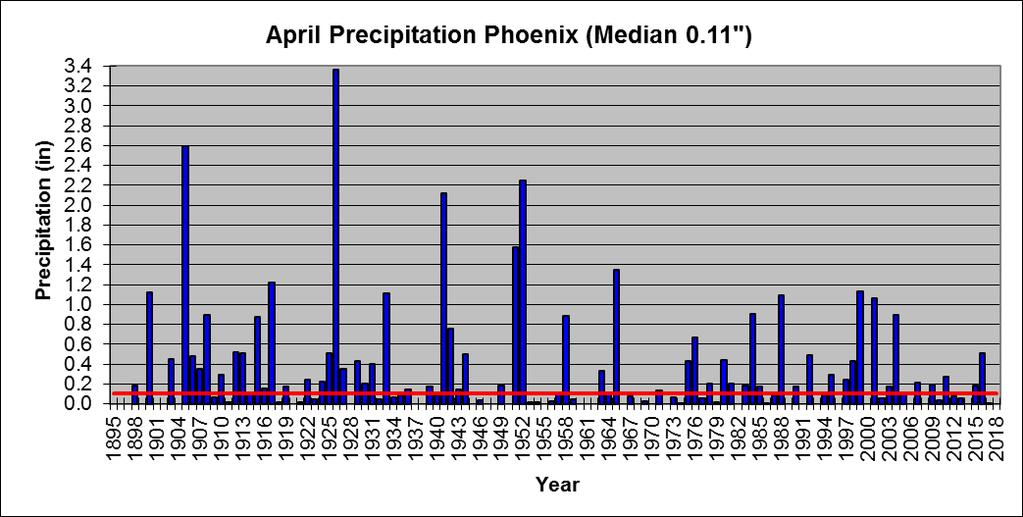
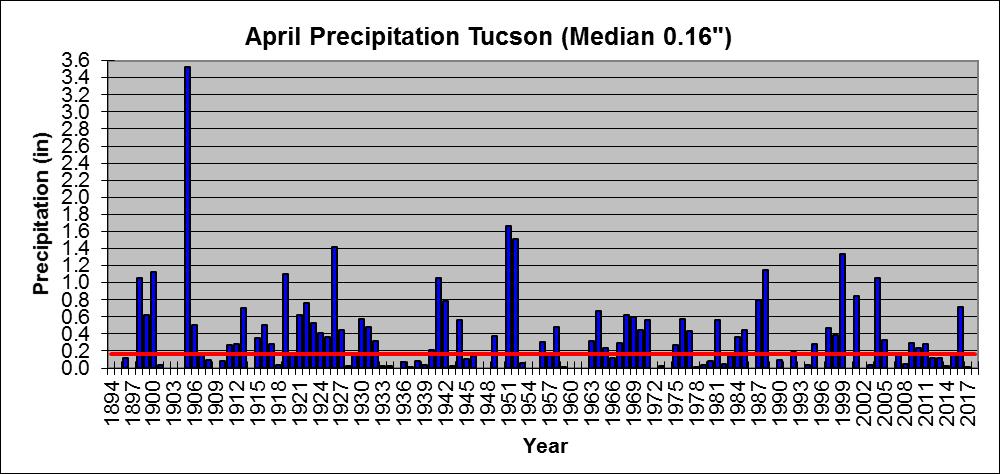
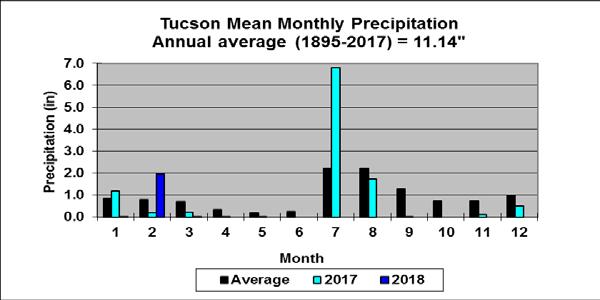
19 April Mean Precipitation Graphs Flagstaff, Phoenix, and Tucson


20 2018 Cumulative Precipitation Graphs Flagstaff, Phoenix and Tucson: Flagstaff is 2.41 below normal, Phoenix is 2.33 below normal, and Tucson is 0.86 below normal. 20
21 The downloadable normals and extremes calendars use the following abbreviations: NORM = 30 year ( ) average value (degrees Fahrenheit (F)) OBS = The temperature observation for that day this year AVG = Average daily temperature HI MAX = Highest maximum temperature for that day (F) LO MAX = Lowest maximum temperature for that day (F) LO MIN = Lowest minimum temperature for that day (F) HI MIN = Highest minimum temperature for that day (F) Mx PCP = Maximum precipitation for that day (inches) Mx SNO = Maximum snowfall for that day (inches) 21
Arizona Climate Summary April 2018 Summary of conditions for March 2018
 Arizona Climate Summary April 2018 Summary of conditions for March 2018 March 2018 Temperature and Precipitation Summary March 1 st 16 th : March began with rainfall in southeastern Arizona as the tail
Arizona Climate Summary November 2017 Summary of conditions for October 2017
 Arizona Climate Summary November 2017 Summary of conditions for October 2017 October 2017 Temperature and Precipitation Summary October 1 st 18 th : A low pressure system from the northwestern U.S. moved
Arizona Climate Summary November 2015 Summary of conditions for October 2015
 October 2015 Temperature and Precipitation Summary Arizona Climate Summary November 2015 Summary of conditions for October 2015 October 1 st 14 th : October began with high pressure over the southwest,
Arizona Climate Summary December 2017 Summary of conditions for November 2017
 November 2017 Temperature and Precipitation Summary Arizona Climate Summary December 2017 Summary of conditions for November 2017 November 1 st 17 th : October ended with a little bit of precipitation
Arizona Climate Summary September 2018 Summary of conditions for August 2018
 August 2018 Temperature and Precipitation Summary Arizona Climate Summary September 2018 Summary of conditions for August 2018 August 1 st 15 th : August began with high pressure centered over the state
Arizona Climate Summary October 2018 Summary of conditions for September 2018
 Arizona Climate Summary October 2018 Summary of conditions for September 2018 September 2018 Temperature and Precipitation Summary September 1 st 17 th : The wet pattern from August continued into September
Arizona Climate Summary February 2018 Summary of conditions for January 2018
 Arizona Climate Summary February 2018 Summary of conditions for January 2018 January 2018 Temperature and Precipitation Summary January 1 st 19 th : The new year began with a ridge of high pressure over
Arizona Climate Summary June 2017 Summary of conditions for May 2017
 Arizona Climate Summary June 2017 Summary of conditions for May 2017 May 2017 Temperature and Precipitation Summary May 1 st 16 th : A strong ridge of high pressure developed over the southwest during
Arizona Climate Summary May 2015 Summary of conditions for April 2015
 Arizona Climate Summary May 2015 Summary of conditions for April 2015 April 2015 Temperature and Precipitation Summary April 1 st 16 th : April began with very light showers in Nogales and Coronado National
Arizona Climate Summary May 2012
 Arizona Climate Summary May 2012 Summary of conditions for April 2012 April 2012 Temperature and Precipitation Summary April 1 st 16 th : Although April began with another low pressure system sweeping
Arizona Climate Summary
 Arizona Climate Summary March 2014 Summary of conditions for February 2014 February 2014 Temperature and Precipitation Summary February 1 st 16 th : We started off the month of February with some moisture
Arizona Climate Summary December 2016 Summary of conditions for November 2016
 Arizona Climate Summary December 2016 Summary of conditions for November 2016 November 2016 Temperature and Precipitation Summary November 1 st 16 th : November began with a dry low pressure system moving
Arizona Climate Summary September 2017 Summary of conditions for August 2017
 August 2017 Temperature and Precipitation Summary Arizona Climate Summary September 2017 Summary of conditions for August 2017 August 1 st 15 th : The monsoon activity that ended July continued into the
Arizona Climate Summary August 2013
 Arizona Climate Summary August 2013 Summary of conditions for July 2013 July 2013 Temperature and Precipitation Summary July 1 st 16 th : To start off the month of July, a high pressure system came in
Arizona Climate Summary October 2013
 Arizona Climate Summary October 2013 Summary of conditions for September 2013 September 2013 Temperature and Precipitation Summary September 1 st 16 th : With moist conditions still present throughout
Arizona Climate Summary January 2017 Summary of conditions for December 2016
 Arizona Climate Summary January 2017 Summary of conditions for December 2016 December 2016 Temperature and Precipitation Summary December 1 st 15 th : Similar to November, December began with a dry trough
Arizona Climate Summary
 May 2015 Temperature and Precipitation Summary Arizona Climate Summary June 2015 Summary of conditions for May 2015 May 1 st 14 th : May began with high pressure in the west, and May 1 st was dry statewide,
Arizona Climate Summary
 Arizona Climate Summary August 2016 Summary of conditions for July 2016 July 2016 Temperature and Precipitation Summary July 1 st 15 th : As June ended and July began, a shortwave moved through the southwest
Arizona Climate Summary
 April 2016 Temperature and Precipitation Summary Arizona Climate Summary May 2016 Summary of conditions for April 2016 April 1 st 15 th : April 1 st saw the tail end of a low pressure system move out of
Arizona Climate Summary July 2015 Summary of conditions for June 2015
 June 2015 Temperature and Precipitation Summary Arizona Climate Summary July 2015 Summary of conditions for June 2015 June 1 st 14 th : Similar to May, June began with high pressure in the west, and conditions
Arizona Climate Summary November 2016 Summary of conditions for October 2016
 Arizona Climate Summary November 2016 Summary of conditions for October 2016 October 2016 Temperature and Precipitation Summary October 1 st 16 th : October began with high pressure over Mexico, bringing
Arizona Climate Summary
 Arizona Climate Summary April 2014 Summary of conditions for March 2014 March 2014 Temperature and Precipitation Summary March 1 st 16 th : We started off the month of March with a significant precipitation
Arizona Climate Summary February 2012
 Arizona Climate Summary February 2012 Summary of conditions for January 2012 January 2012 Temperature and Precipitation Summary January 1 st 20 th : The New Year has started on a very dry note. The La
Arizona Climate Summary
 August 2015 Temperature and Precipitation Summary Arizona Climate Summary September 2015 Summary of conditions for August 2015 August 1 st 16 th : August was a wet month across the state with only 3 days
Arizona Climate Summary February 2016 Summary of conditions for January 2016
 January 2016 Temperature and Precipitation Summary Arizona Climate Summary February 2016 Summary of conditions for January 2016 January 1 st 14 th : The new year began with high pressure over the southwest
Arizona Climate Summary November 2018 Summary of conditions for October 2018
 Arizona Climate Summary November 2018 Summary of conditions for October 2018 October 2018 Temperature and Precipitation Summary October 1 st 15 th : The 2018 water year ending September 30 th was exceptionally
Arizona Climate Summary October 2016 Summary of conditions for September 2016
 September 2016 Temperature and Precipitation Summary Arizona Climate Summary October 2016 Summary of conditions for September 2016 September 1 st 14 th : High pressure over the Four Corners brought rainfall
Arizona Climate Summary June 2013
 Arizona Climate Summary June 2013 Summary of conditions for May 2013 May 2013 Temperature and Precipitation Summary May 1 st 16 th : May began with above normal daily temperatures and breezy conditions
Arizona Climate Summary November 2013
 Arizona Climate Summary November 2013 Summary of conditions for October 2013 October 2013 Temperature and Precipitation Summary October 1 st 16 th : The month of October started off with fair weather conditions
Arizona Climate Summary October 2015 Summary of conditions for September 2015
 September 2015 Temperature and Precipitation Summary Arizona Climate Summary October 2015 Summary of conditions for September 2015 September 1 st 18 th : September began with high pressure over southern
Arizona Climate Summary April 2013
 Arizona Climate Summary April 2013 Summary of conditions for March 2013 March 2013 Temperature and Precipitation Summary March 1 st 16 th : March began as a ridge of high pressure progressed across the
Arizona Climate Summary May 2013
 Arizona Climate Summary May 2013 Summary of conditions for April 2013 April 2013 Temperature and Precipitation Summary April 1 st 16 th : The first week of April featured a ridge of high pressure over
Arizona Climate Summary March 2013
 Arizona Climate Summary March 2013 Summary of conditions for February 2013 February 2013 Temperature and Precipitation Summary February 1 st 16 th : February began with a ridge of high pressure over the
Arizona Climate Summary
 Arizona Climate Summary June 2012 Summary of conditions for May 2012 May 2012 Temperature and Precipitation Summary May 1 st 16 th : May began with a surface cold front sweeping across the western states
Arizona Climate Summary October 2012
 Arizona Climate Summary October 2012 Summary of conditions for September 2012 September 2012 Temperature and Precipitation Summary September 1 st 14 th : September began with an upper level low pressure
Arizona Climate Summary September 2014 Summary of conditions for August 2014
 Arizona Climate Summary September 2014 Summary of conditions for August 2014 August 2014 Temperature and Precipitation Summary August 1 st 16 th : The first 5 days of August were quite wet with high pressure
Colorado State University, Fort Collins, CO Weather Station Monthly Summary Report
 Colorado State University, Fort Collins, CO Weather Station Monthly Summary Report Month: January Year: 2019 Temperature: Mean T max was 47.2 F which is 3.0 above the 1981-2010 normal for the month. This
Monthly Long Range Weather Commentary Issued: February 15, 2015 Steven A. Root, CCM, President/CEO
 Monthly Long Range Weather Commentary Issued: February 15, 2015 Steven A. Root, CCM, President/CEO sroot@weatherbank.com JANUARY 2015 Climate Highlights The Month in Review During January, the average
Colorado State University, Fort Collins, CO Weather Station Monthly Summary Report
 Colorado State University, Fort Collins, CO Weather Station Monthly Summary Report Month: December Year: 2017 Temperature: Mean T max was 47.2 F which is 4.4 above the 1981-2010 normal for the month. This
The following information is provided for your use in describing climate and water supply conditions in the West as of April 1, 2003.
 Natural Resources Conservation Service National Water and Climate Center 101 SW Main Street, Suite 1600 Portland, OR 97204-3224 Date: April 8, 2003 Subject: April 1, 2003 Western Snowpack Conditions and
Monthly Long Range Weather Commentary Issued: APRIL 18, 2017 Steven A. Root, CCM, Chief Analytics Officer, Sr. VP,
 Monthly Long Range Weather Commentary Issued: APRIL 18, 2017 Steven A. Root, CCM, Chief Analytics Officer, Sr. VP, sroot@weatherbank.com MARCH 2017 Climate Highlights The Month in Review The average contiguous
2012 Growing Season Weather Summary for North Dakota. Adnan Akyüz and Barbara A. Mullins Department of Soil Science October 30, 2012
 2012 Growing Season Weather Summary for North Dakota Adnan Akyüz and Barbara A. Mullins Department of Soil Science October 30, 2012 Introduction The 2012 growing season (the period from April through September)
May 2016 Volume 23 Number 5
 The Weather Wire May 2016 Volume 23 Number 5 Contents: Winter Summary Current Colorado and West-wide Snow Pack Drought Monitor April Summary/Statistics May Preview Snowfall Totals Winter Summary The Front
Monthly Long Range Weather Commentary Issued: APRIL 1, 2015 Steven A. Root, CCM, President/CEO
 Monthly Long Range Weather Commentary Issued: APRIL 1, 2015 Steven A. Root, CCM, President/CEO sroot@weatherbank.com FEBRUARY 2015 Climate Highlights The Month in Review The February contiguous U.S. temperature
The Pennsylvania Observer
 The Pennsylvania Observer April 2, 2009 March 2009 Pennsylvania Weather Recap Prepared by Curt Harpster For the month of March the saying, In like a lion and out like a lamb really fit the pattern quite
KANSAS CLIMATE SUMMARY February 2017
 KANSAS CLIMATE SUMMARY February 2017 Warm and dry February was much warmer and drier than normal. The state-wide average temperature was 41.9 o F, which is 7.9 degrees warmer than normal. This places it
National Wildland Significant Fire Potential Outlook
 National Wildland Significant Fire Potential Outlook National Interagency Fire Center Predictive Services Issued: September, 2007 Wildland Fire Outlook September through December 2007 Significant fire
Colorado State University, Fort Collins, CO Weather Station Monthly Summary Report
 Colorado State University, Fort Collins, CO Weather Station Monthly Summary Report Month: December Year: 2016 Temperature: Mean T max was 39.7 F which is 3.1 below the 1981-2010 normal for the month. This
The Weather Wire. Contents: Wildfires Burning Across Colorado
 The Weather Wire July 2018 Volume 25 Number 7 Contents: Wildfires Burning Across Colorado Drought Monitor June Summary/Statistics July Preview Rainfall Totals Wildfires Burning Across Colorado Following
Champaign-Urbana 1999 Annual Weather Summary
 Champaign-Urbana 1999 Annual Weather Summary ILLINOIS STATE WATER SURVEY 2204 Griffith Dr. Champaign, IL 61820 wxobsrvr@sws.uiuc.edu Maria Peters, Weather Observer A major snowstorm kicked off the new
KANSAS CLIMATE SUMMARY January 2018
 KANSAS CLIMATE SUMMARY January 2018 Some welcome moisture After an extended period with little to no moisture, parts of Kansas recorded some significant precipitation. At Tribune, a small snow event on
NATIONAL WEATHER SERVICE
 January 2016 February 9, 2016 This was a dry month across the HSA despite one large and several smaller snowfalls. Most locations ended up 1-2 inches below normal for the month. The driest locations at
NIDIS Drought and Water Assessment
 NIDIS Drought and Water Assessment PRECIPITATION The images above use daily precipitation statistics from NWS COOP, CoCoRaHS, and CoAgMet stations. From top to bottom, and left to right: most recent 7-days
2011 National Seasonal Assessment Workshop for the Eastern, Southern, & Southwest Geographic Areas
 2011 National Seasonal Assessment Workshop for the Eastern, Southern, & Southwest Geographic Areas On January 11-13, 2011, wildland fire, weather, and climate met virtually for the ninth annual National
KANSAS CLIMATE SUMMARY August 2015
 KANSAS CLIMATE SUMMARY August 2015 Cool and Dry August was drier than normal in most of the state. State-wide average precipitation was 2.80 inches or 85 percent of normal. The Northeast division of the
NIDIS Intermountain West Regional Drought Early Warning System February 7, 2017
 NIDIS Drought and Water Assessment NIDIS Intermountain West Regional Drought Early Warning System February 7, 2017 Precipitation The images above use daily precipitation statistics from NWS COOP, CoCoRaHS,
April 2011 Volume 18 Number 4
 The Weather Wire April 2011 Volume 18 Number 4 Contents: Winter Summary to Date Drought Monitor March Summary/Statistics April Preview Sunrise/Sunset Snow Totals Winter Summary to Date The Front Range
NIDIS Intermountain West Drought Early Warning System February 12, 2019
 NIDIS Intermountain West Drought Early Warning System February 12, 2019 Precipitation The images above use daily precipitation statistics from NWS COOP, CoCoRaHS, and CoAgMet stations. From top to bottom,
Monthly Long Range Weather Commentary Issued: SEPTEMBER 19, 2015 Steven A. Root, CCM, Chief Analytics Officer, Sr. VP, sales
 Monthly Long Range Weather Commentary Issued: SEPTEMBER 19, 2015 Steven A. Root, CCM, Chief Analytics Officer, Sr. VP, sales sroot@weatherbank.com AUGUST 2015 Climate Highlights The Month in Review The
January 25, Summary
 January 25, 2013 Summary Precipitation since the December 17, 2012, Drought Update has been slightly below average in parts of central and northern Illinois and above average in southern Illinois. Soil
2011 Year in Review TORNADOES
 2011 Year in Review The year 2011 had weather events that will be remembered for a long time. Two significant tornado outbreaks in April, widespread damage and power outages from Hurricane Irene in August
Champaign-Urbana 2000 Annual Weather Summary
 Champaign-Urbana 2000 Annual Weather Summary ILLINOIS STATE WATER SURVEY 2204 Griffith Dr. Champaign, IL 61820 wxobsrvr@sws.uiuc.edu Maria Peters, Weather Observer January: January started on a mild note,
National Wildland Significant Fire Potential Outlook
 National Wildland Significant Fire Potential Outlook National Interagency Fire Center Predictive Services Issued: April 1, 2008 Next Issue: May 1, 2008 Wildland Fire Outlook April 2008 through July 2008
The hydrologic service area (HSA) for this office covers Central Kentucky and South Central Indiana.
 for this office covers Central Kentucky and South Central Indiana.") January 2012 February 13, 2012 An X inside this box indicates that no flooding occurred within this hydrologic service area. January 2012 continued the string of wet months this winter. Rainfall was generally
January 2012 February 13, 2012 An X inside this box indicates that no flooding occurred within this hydrologic service area. January 2012 continued the string of wet months this winter. Rainfall was generally
Champaign-Urbana 2001 Annual Weather Summary
 Champaign-Urbana 2001 Annual Weather Summary ILLINOIS STATE WATER SURVEY 2204 Griffith Dr. Champaign, IL 61820 wxobsrvr@sws.uiuc.edu Maria Peters, Weather Observer January: After a cold and snowy December,
Monthly Long Range Weather Commentary Issued: NOVEMBER 16, 2015 Steven A. Root, CCM, Chief Analytics Officer, Sr. VP, sales
 Monthly Long Range Weather Commentary Issued: NOVEMBER 16, 2015 Steven A. Root, CCM, Chief Analytics Officer, Sr. VP, sales sroot@weatherbank.com OCTOBER 2015 Climate Highlights The Month in Review The
PRECIPITATION. Last Week Precipitation:
 2/24/2015 NIDIS Drought and Water Assessment PRECIPITATION The images above use daily precipitation statistics from NWS COOP, CoCoRaHS, and CoAgMet stations. From top to bottom, and left to right: most
NIDIS Intermountain West Drought Early Warning System October 30, 2018
 10/30/2018 NIDIS Drought and Water Assessment NIDIS Intermountain West Drought Early Warning System October 30, 2018 Precipitation The images above use daily precipitation statistics from NWS COOP, CoCoRaHS,
October 2015 Volume 22 Number 10
 The Weather Wire October 2015 Volume 22 Number 10 Contents: Local Frost/Freeze Information Drought Monitor September Summary/Statistics October Preview Rainfall Totals Local Frost Freeze Information Many
The Weather Wire. Contents: Summer 2018 Outlook. Summer 2018 Outlook Drought Monitor May Summary/Statistics June Preview Rainfall Totals
 The Weather Wire June 2018 Volume 25 Number 6 Contents: Summer 2018 Outlook Drought Monitor May Summary/Statistics June Preview Rainfall Totals Summer 2018 Outlook June 1 st marked the first day of meteorological
NIDIS Intermountain West Drought Early Warning System September 4, 2018
 NIDIS Drought and Water Assessment NIDIS Intermountain West Drought Early Warning System September 4, 2018 Precipitation The images above use daily precipitation statistics from NWS COOP, CoCoRaHS, and
Monthly Long Range Weather Commentary Issued: APRIL 25, 2016 Steven A. Root, CCM, Chief Analytics Officer, Sr. VP, sales
 Monthly Long Range Weather Commentary Issued: APRIL 25, 2016 Steven A. Root, CCM, Chief Analytics Officer, Sr. VP, sales sroot@weatherbank.com MARCH 2016 Climate Highlights The Month in Review The March
Oregon Water Conditions Report April 17, 2017
 Oregon Water Conditions Report April 17, 2017 Mountain snowpack continues to maintain significant levels for mid-april. By late March, statewide snowpack had declined to 118 percent of normal after starting
Sierra Weather and Climate Update
 Sierra Weather and Climate Update 2014-15 Kelly Redmond Western Regional Climate Center Desert Research Institute Reno Nevada Yosemite Hydroclimate Workshop Yosemite Valley, 2015 October 8-9 Percent of
Current Water Conditions in Massachusetts January 11, 2008
 Current Water Conditions in Massachusetts January 11, 2008 December precipitation was above normal December streamflows were below normal and normal December ground-water levels were below normal and normal
March 1, 2003 Western Snowpack Conditions and Water Supply Forecasts
 Natural Resources Conservation Service National Water and Climate Center 101 SW Main Street, Suite 1600 Portland, OR 97204-3224 Date: March 17, 2003 Subject: March 1, 2003 Western Snowpack Conditions and
NIDIS Intermountain West Drought Early Warning System May 1, 2018
 NIDIS Intermountain West Drought Early Warning System May 1, 2018 Precipitation The images above use daily precipitation statistics from NWS COOP, CoCoRaHS, and CoAgMet stations. From top to bottom, and
January 2011 Calendar Year Runoff Forecast
 January 2011 Calendar Year Runoff Forecast 2010 Runoff Year Calendar Year 2010 was the third highest year of runoff in the Missouri River Basin above Sioux City with 38.8 MAF, behind 1978 and 1997 which
NIDIS Drought and Water Assessment
 7/23/13 1:57 PM PRECIPITATION The images above use daily precipitation statistics from NWS COOP, CoCoRaHS, and CoAgMet stations. From top to bottom, and left to right: most recent 7-days of accumulated
November 2017 Volume 24 Number 11
 The Weather Wire November 2017 Volume 24 Number 11 Contents: Colorado Snow Statistics Drought Monitor October Summary/Statistics November Preview Snowfall Totals Rainfall Totals Colorado Snow Statistics
Weather and Climate Summary and Forecast August 2018 Report
 Weather and Climate Summary and Forecast August 2018 Report Gregory V. Jones Linfield College August 5, 2018 Summary: July 2018 will likely go down as one of the top five warmest July s on record for many
NIDIS Intermountain West Drought Early Warning System October 17, 2017
 NIDIS Drought and Water Assessment NIDIS Intermountain West Drought Early Warning System October 17, 2017 Precipitation The images above use daily precipitation statistics from NWS COOP, CoCoRaHS, and
Colorado State University, Fort Collins, CO Weather Station Monthly Summary Report
 Colorado State University, Fort Collins, CO Weather Station Monthly Summary Report Month: February Year: 2017 Webcam catching a hawk watching over the station. Temperature: Mean T max was 54.4 F which
KANSAS CLIMATE SUMMARY February 2015
 KANSAS CLIMATE SUMMARY February 2015 Extended Cold Despite some record warm readings at a few locations, February was characterized by colder than normal conditions. This was particularly true during the
NIDIS Intermountain West Drought Early Warning System April 18, 2017
 1 of 11 4/18/2017 3:42 PM Precipitation NIDIS Intermountain West Drought Early Warning System April 18, 2017 The images above use daily precipitation statistics from NWS COOP, CoCoRaHS, and CoAgMet stations.
Weather and Climate Summary and Forecast February 2018 Report
 Weather and Climate Summary and Forecast February 2018 Report Gregory V. Jones Linfield College February 5, 2018 Summary: For the majority of the month of January the persistent ridge of high pressure
Weather and Climate Summary and Forecast Winter
 Weather and Climate Summary and Forecast Winter 2016-17 Gregory V. Jones Southern Oregon University December 5, 2016 Well after an October that felt more like November, we just finished a November that
The Climate of Murray County
 The Climate of Murray County Murray County is part of the Crosstimbers. This region is a transition between prairies and the mountains of southeastern Oklahoma. Average annual precipitation ranges from
NIDIS Intermountain West Drought Early Warning System July 18, 2017
 NIDIS Drought and Water Assessment NIDIS Intermountain West Drought Early Warning System July 18, 2017 Precipitation The images above use daily precipitation statistics from NWS COOP, CoCoRaHS, and CoAgMet
Monthly Long Range Weather Commentary Issued: May 15, 2014 Steven A. Root, CCM, President/CEO
 Monthly Long Range Weather Commentary Issued: May 15, 2014 Steven A. Root, CCM, President/CEO sroot@weatherbank.com APRIL 2014 REVIEW Climate Highlights The Month in Review The average temperature for
NIDIS Intermountain West Drought Early Warning System December 11, 2018
 NIDIS Drought and Water Assessment NIDIS Intermountain West Drought Early Warning System December 11, 2018 Precipitation The images above use daily precipitation statistics from NWS COOP, CoCoRaHS, and
North Carolina Climate January 2012
 North Carolina Climate January 2012 Online: http://www.nc-climate.ncsu.edu/office/newsletters North Carolina Climate, the monthly newsletter of the State Climate Office of NC, covers information on experimental
NIDIS Intermountain West Drought Early Warning System November 21, 2017
 NIDIS Drought and Water Assessment NIDIS Intermountain West Drought Early Warning System November 21, 2017 Precipitation The images above use daily precipitation statistics from NWS COOP, CoCoRaHS, and
LOCAL CLIMATOLOGICAL DATA FOR FREEPORT ILLINOIS
 Climatological Summary: LOCAL CLIMATOLOGICAL DATA FOR FREEPORT ILLINOIS 1905-1990 Freeport (Stephenson County) has a temperate continental climate, dominated by maritime tropical air from the Gulf of Mexico
The Weather Wire. Current Colorado Snowpack. Contents:
 The Weather Wire January 2019 Volume 26 Number 1 Contents: Current Colorado Snowpack Denver Snowfall Since 1999-2000 Denver 2018 Climate Review Drought Monitor December Summary/Statistics January Preview
NIDIS Weekly Climate, Water and Drought Assessment Summary. Upper Colorado River Basin
 NIDIS Weekly Climate, Water and Drought Assessment Summary Upper Colorado River Basin August 3, 2010 Precipitation and Snowpack Fig. 1: July precipitation in inches Fig. 2: July precip as percent of average
Monthly Long Range Weather Commentary Issued: July 18, 2014 Steven A. Root, CCM, President/CEO
 Monthly Long Range Weather Commentary Issued: July 18, 2014 Steven A. Root, CCM, President/CEO sroot@weatherbank.com JUNE 2014 REVIEW Climate Highlights The Month in Review The average temperature for
TRINITY COUNTY. Board Item Request Form Phone
 County Contract No. Department Board of Supervisors TRINITY COUNTY 6.01 Board Item Request Form 2014-08-12 Contact Judy Pflueger Phone 623-1217 Requested Agenda Location County Matters Requested Board
Weather and Climate Summary and Forecast October 2018 Report
 Weather and Climate Summary and Forecast October 2018 Report Gregory V. Jones Linfield College October 4, 2018 Summary: Much of Washington, Oregon, coastal California and the Bay Area and delta region
The 21 st Century Colorado River Hot Drought and Implications for the Future
 Coauthor: Jonathan Overpeck The 21 st Century Colorado River Hot Drought and Implications for the Future CRWCD State of the River May 4, 2017 Brad Udall Colorado State University Bradley.udall@colostate.edu