ANALYSIS OF CLIMATIC CHANGES IN THE SAN JUAN MOUNTAIN (SJM) REGION DURING THE 20 TH CENTURY. Imtiaz Rangwala
|
|
|
- Aleesha Carr
- 5 years ago
- Views:
Transcription
1 ANALYSIS OF CLIMATIC CHANGES IN THE SAN JUAN MOUNTAIN (SJM) REGION DURING THE 20 TH CENTURY Imtiaz Rangwala MTNCLIM
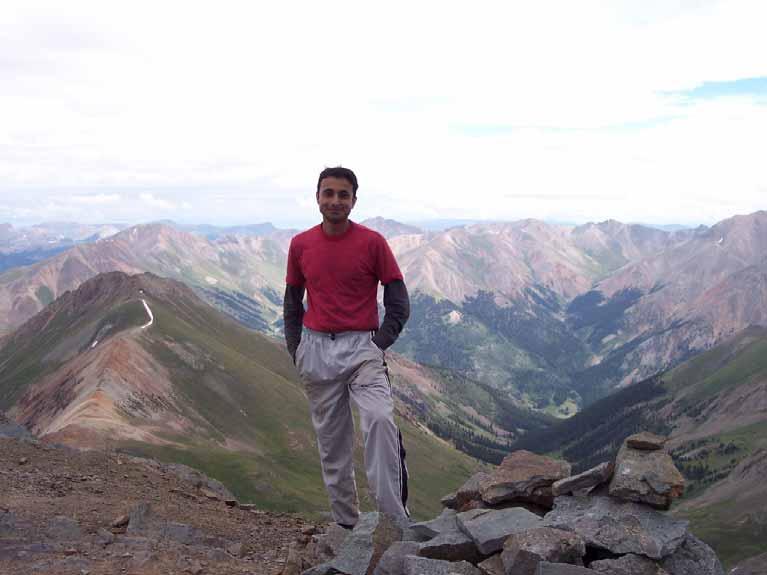
2 Objectives (as proposed) Nature of climate change in the SJM It s relationship to changes in the stream flow in the region To explore the mountains 2
3 3

4 Kendall in the Wind[ow] 4
5 Overview Historical climate records for the SJM region Analysis of these records for the 20 th century - Temperature - Elevation Dependent Warming? (NWS vs SNOTEL) - Precipitation, SWE, Snowdepth Role of the Pacific Climate 5
6 Study Region COLORADO SJM 13 Counties W and N 6
7 Data Mining Monthly Avg. Temperature: NWS: (26), SNOTEL (bigger (23) dataset since 1949) Precipitation: SNOTEL: NWS (22), started SNOTEL early (26) 1980s Snow water equivalent (SWE): SNOTEL (26), Since mid-1940s Snow Course (26) Snow-depth: Snow Course (26) JAN thru JUN Since mid-1940s and refining (esp. SNOTEL data) discarding impossible values filling in missing values 7
8 Temperature 8
9 Possible 2 o C warming between Rapid warming between 1995 and 2005 Both NWS and SNOTEL sites confirm this trend NWS anomalies relative to SNOTEL anomalies relative to NWS vs SNOTEL r =
10 r =
11 SJM warming in context to warming elsewhere 11

12 CO division - 2 Div. 2 12
13 ? r =
14 NASA/GISS 14
15 At SJM: Surface warming twice that of global average Mid century cooling occurred later Late century warming started later too but happened more rapidly r =
16 r =
17 Recent Decades 17
18 Trends based on the 5 o x 5 o gridded GHCN (Global Historical Climatology Network) land surface dataset provided by NCDC, NOAA 18
19 SJM: NWS vs SNOTEL SNOTEL sites 2500 ft higher than NWS sites Warming larger at SNOTEL than NWS except winter Spring and summer: Warming at least 2 times higher at SNOTEL Similar increases in T-max and T-min 19
20 Warming rates for 3 decades (C/decade) Large warming in SNOTEL > NWS Similar increases in Max. T and Min. T during particularly at SNOTEL sites 20
21 Warming rates for 3 decades (C/decade): Seasons : The decade of highest warming? Warming in all seasons at both sites Higher at SNOTEL except winter Very large during spring and summer at SNOTEL 21
22 Conclusions:Temperature The surface temperature in the SJM region may have increased by about 2 o C between Half of this warming happened between ; which is confirmed at both NWS and SNOTEL sites Temperature trends correlate well between NWS and SNOTEL sites More recent trends in warming in the San Juans appear to have started later than most other regions in the U.S. but has been more rapid 22
23 Broad temperature trend in the SJM is to similar to that of the contiguous US for the 20 th century Elevation dependency in local warming higher rates at SNOTEL sites 23
24 Snow 24
25 (Nov-May) Anomalies are normalized 25% decrease during NWS vs SNOTEL r =
26 Snowfall And Snow-depth r = % decrease in snow-depth during
27 Snowfall And SWE 40% decrease in SWE during Decrease in the total annual snow residence time Snowfall vs SWE: r = 0.83 SWE (Snow Course vs SNOTEL): r =
28 Snowfall And Snow-depth Decadal Average Snowdepth following snowfall trend 28
29 Snow-depth: Snow Course Sites Large snowdepth decreases in mid-late spring 29
30 Increase in Spring Melt? 30
31 Pacific climate indicies and the SJM climate 31
32 I-80 32
33 (+) ENSO and (+) PDO More Snowfall and Lower Winter Temperatures in the SJM 33
34 Pre-1975: Relationship exist but weak Post-1975: Breaks down; in fact becomes opposite? 34
35 Conclusions: Snow Rapid decreases in Snowfall (25%), SWE (40%) and Snowdepth (25%) at SNOTEL/Snow Course sites during the period. These decreases in Snowfall cannot be explained by the traditional ENSO/PDO pattern. Large warming in spring and early summer can be related to the decreases in snow amount through the snow-albedo feedback mechanism Large decreases in SWE in spring may reflect in significant changes in the seasonal streamflow in the region. 35
36 Acknowledgements MSI mini-grant program Koren Nydick Jim Miller and Dave Robinson Rutgers Staff and Researchers at MSI People of Silverton DATA Sources 36

37 Thanks!!! 37
38 Is there a relationship? Rapid temperature increases And A rapid snow loss (In recent decades) 38
39 39
40 40
41 41
42 r =
43 r =
44 Monsoon Precipitation No long term trends NWS vs SNOTEL r = 0.91 However, a sharp decrease between
Colorado s 2003 Moisture Outlook
 Colorado s 2003 Moisture Outlook Nolan Doesken and Roger Pielke, Sr. Colorado Climate Center Prepared by Tara Green and Odie Bliss http://climate.atmos.colostate.edu How we got into this drought! Fort
2003 Moisture Outlook
 2003 Moisture Outlook Nolan Doesken and Roger Pielke, Sr. Colorado Climate Center Prepared by Tara Green and Odie Bliss http://climate.atmos.colostate.edu Through 1999 Through 1999 Fort Collins Total Water
Presentation Overview. Southwestern Climate: Past, present and future. Global Energy Balance. What is climate?
 Southwestern Climate: Past, present and future Mike Crimmins Climate Science Extension Specialist Dept. of Soil, Water, & Env. Science & Arizona Cooperative Extension The University of Arizona Presentation
Climate Impacts to Southwest Water Sector. Dr. Dave DuBois New Mexico State Climatologist
 Climate Impacts to Southwest Water Sector Dr. Dave DuBois New Mexico State Climatologist Presented at EPA Extreme Events and Climate Adaptation Planning Workshop June 3, 2015 Water Year Precip. % of Average
INVISIBLE WATER COSTS
 Every Drop Every Counts... Drop Counts... INVISIBLE WATER COSTS Corn - 108.1 gallons per pound How much water it takes to produce... Apple - 18.5 gallons to grow Beef - 1,581 gallons per pound Oats - 122.7
Drought and Future Water for Southern New Mexico
 Drought and Future Water for Southern New Mexico David S. Gutzler University of New Mexico gutzler@unm.edu * The big drought of 2018 * Longer term challenges for water supply * Forecasting streamflow Elephant
Twentieth Century Temperature Trends in Colorado s San Juan Mountains
 Arctic, Antarctic, and Alpine Research, Vol. 42, No. 1, 2010, pp. 89 97 Twentieth Century Temperature Trends in Colorado s San Juan Mountains Imtiaz Rangwala* and James R. Miller{ *Corresponding author:
NIDIS Intermountain West Regional Drought Early Warning System February 7, 2017
 NIDIS Drought and Water Assessment NIDIS Intermountain West Regional Drought Early Warning System February 7, 2017 Precipitation The images above use daily precipitation statistics from NWS COOP, CoCoRaHS,
Quenching the Valley s thirst: The connection between Sierra Nevada snowpack & regional water supply
 Quenching the Valley s thirst: The connection between Sierra Nevada snowpack & regional water supply Roger Bales, UC Merced Snow conditions Snow & climate change Research directions Sierra Nevada snow
J8.4 TRENDS OF U.S. SNOWFALL AND SNOW COVER IN A WARMING WORLD,
 J8.4 TRENDS OF U.S. SNOWFALL AND SNOW COVER IN A WARMING WORLD, 1948-2008 Richard R. Heim Jr. * NOAA National Climatic Data Center, Asheville, North Carolina 1. Introduction The Intergovernmental Panel
Climate Variability. Eric Salathé. Climate Impacts Group & Department of Atmospheric Sciences University of Washington. Thanks to Nathan Mantua
 Climate Variability Eric Salathé Climate Impacts Group & Department of Atmospheric Sciences University of Washington Thanks to Nathan Mantua Northwest Climate: the mean Factors that influence local/regional
Drought in Southeast Colorado
 Drought in Southeast Colorado Nolan Doesken and Roger Pielke, Sr. Colorado Climate Center Prepared by Tara Green and Odie Bliss http://climate.atmos.colostate.edu 1 Historical Perspective on Drought Tourism
NIDIS Intermountain West Drought Early Warning System January 15, 2019
 NIDIS Drought and Water Assessment NIDIS Intermountain West Drought Early Warning System January 15, 2019 Precipitation The images above use daily precipitation statistics from NWS COOP, CoCoRaHS, and
New Climate Divisions for Monitoring and Predicting Climate in the U.S.
 New Climate Divisions for Monitoring and Predicting Climate in the U.S. Klaus Wolter and Dave Allured, University of Colorado at Boulder, CIRES Climate Diagnostics Center, and NOAA-ESRL Physical Sciences
Funding provided by NOAA Sectoral Applications Research Project CLIMATE. Basic Climatology Colorado Climate Center
 Funding provided by NOAA Sectoral Applications Research Project CLIMATE Basic Climatology Colorado Climate Center Remember These? Factor 1: Our Energy Source Factor 2: Revolution & Tilt Factor 3: Rotation!
Seasonal Climate Forecast August October 2013 Verification (Issued: November 17, 2013)
") Seasonal Climate Forecast August October 2013 Verification (Issued: November 17, 2013) Note: This product is published by the Oregon Department of Agriculture (ODA), in cooperation with the Oregon Department
Seasonal Climate Forecast August October 2013 Verification (Issued: November 17, 2013) Note: This product is published by the Oregon Department of Agriculture (ODA), in cooperation with the Oregon Department
8.1 CHANGES IN CHARACTERISTICS OF UNITED STATES SNOWFALL OVER THE LAST HALF OF THE TWENTIETH CENTURY
 8.1 CHANGES IN CHARACTERISTICS OF UNITED STATES SNOWFALL OVER THE LAST HALF OF THE TWENTIETH CENTURY Daria Scott Dept. of Earth and Atmospheric Sciences St. Could State University, St. Cloud, MN Dale Kaiser*
NIDIS Intermountain West Drought Early Warning System February 12, 2019
 NIDIS Intermountain West Drought Early Warning System February 12, 2019 Precipitation The images above use daily precipitation statistics from NWS COOP, CoCoRaHS, and CoAgMet stations. From top to bottom,
Presented by Larry Rundquist Alaska-Pacific River Forecast Center Anchorage, Alaska April 14, 2009
 Presented by Larry Rundquist Alaska-Pacific River Forecast Center Anchorage, Alaska April 14, 2009 Presentation Outline Who we are Breakup characteristics Climate and weather influences 2009 breakup outlook
New England Climate Indicator Maps
 New England Climate Indicator Maps Maps of New England depicting region-wide change in 26 climate indicators for current conditions compared to end of the century for two different global greenhouse gas
Direction and range of change expected in the future
 Direction and range of Air Temperature Over the past 30 years, air Across the greater PNW and temperature has been Columbia Basin, an ensemble increasing an average of forecast from ten of the best 0.13
State of the Climate for the Central Great Plains. Johannes Feddema Department of Geography University of Kansas
 State of the Climate for the Central Great Plains Johannes Feddema Department of Geography University of Kansas Adapting to a Changing Climate on the Central Great Plains Conference Kansas State University,
Climatic and Hydrologic Trends in the Western U.S.: A Review of Recent Peer-Reviewed Research
 Feature Article From Intermountain West Climate Summary, January 2007 Climatic and Hydrologic Trends in the Western U.S.: A Review of Recent Peer-Reviewed Research By Brad Udall, WWA and Gary Bates, NOAA/ESRL/PSD
Coupling Climate to Clouds, Precipitation and Snow
 Coupling Climate to Clouds, Precipitation and Snow Alan K. Betts akbetts@aol.com http://alanbetts.com Co-authors: Ray Desjardins, Devon Worth Agriculture and Agri-Food Canada Shusen Wang and Junhua Li
Oregon Water Conditions Report April 17, 2017
 Oregon Water Conditions Report April 17, 2017 Mountain snowpack continues to maintain significant levels for mid-april. By late March, statewide snowpack had declined to 118 percent of normal after starting
CLIMATE RESILIENCE FOR ALBERTA MUNICIPALITIES CLIMATE PROJECTIONS NORTHERN ALBERTA. Dr. Mel Reasoner Reasoner Environmental Consulting
 CLIMATE RESILIENCE FOR ALBERTA MUNICIPALITIES CLIMATE PROJECTIONS NORTHERN ALBERTA Dr. Mel Reasoner Reasoner Environmental Consulting Probability of occurrence Increase in Mean Temperature & Variance Less
The Colorado Drought of 2002 in Perspective
 The Colorado Drought of 2002 in Perspective Colorado Climate Center Nolan Doesken and Roger Pielke, Sr. Prepared by Tara Green and Odie Bliss http://climate.atmos.colostate.edu Known Characteristics of
Climate Change RMJOC Study Summary
 Climate Change RMJOC Study Summary Erik Pytlak Weather and Streamflow Forecasting Bonneville Power Administration Portland, OR IPCC: International Panel on Climate Change Established by the United Nations
Terrestrial Snow Cover: Properties, Trends, and Feedbacks. Chris Derksen Climate Research Division, ECCC
 Terrestrial Snow Cover: Properties, Trends, and Feedbacks Chris Derksen Climate Research Division, ECCC Outline Three Snow Lectures: 1. Why you should care about snow: Snow and the cryosphere Classes of
National Integrated Drought Information System Southeast US Pilot for Apalachicola- Flint-Chattahoochee River Basin. 22 May 2012
 National Integrated Drought Information System Southeast US Pilot for Apalachicola- Flint-Chattahoochee River Basin 22 May 2012 Outline Welcome Keith Ingram, UF, Southeast Climate Consortium Current drought
An Update on Snowpack Projections for Alaska: Chugach Results. Jeremy Littell, USGS Alaska Climate Science Center
 An Update on Snowpack Projections for Alaska: Chugach Results Jeremy Littell, USGS Alaska Climate Science Center Why snow? That depends. Photo: F. Kovalcheck. h0p://www.fs.usda.gov/detail/chugach/about-
Minnesota s Climatic Conditions, Outlook, and Impacts on Agriculture. Today. 1. The weather and climate of 2017 to date
 Minnesota s Climatic Conditions, Outlook, and Impacts on Agriculture Kenny Blumenfeld, State Climatology Office Crop Insurance Conference, Sep 13, 2017 Today 1. The weather and climate of 2017 to date
El Niño, Climate Change and Water Supply Variability
 El Niño, Climate Change and Water Supply Variability Talk Overview El Niño and California California Climate Variability and Change Water Management in the Face of Change California s topography affects
Trends in Climate Teleconnections and Effects on the Midwest
 Trends in Climate Teleconnections and Effects on the Midwest Don Wuebbles Zachary Zobel Department of Atmospheric Sciences University of Illinois, Urbana November 11, 2015 Date Name of Meeting 1 Arctic
Climatography of the United States No
 Climate Division: AK 5 NWS Call Sign: ANC Month (1) Min (2) Month(1) Extremes Lowest (2) Temperature ( F) Lowest Month(1) Degree s (1) Base Temp 65 Heating Cooling 90 Number of s (3) Jan 22.2 9.3 15.8
NIDIS Intermountain West Drought Early Warning System April 18, 2017
 1 of 11 4/18/2017 3:42 PM Precipitation NIDIS Intermountain West Drought Early Warning System April 18, 2017 The images above use daily precipitation statistics from NWS COOP, CoCoRaHS, and CoAgMet stations.
NIDIS Intermountain West Drought Early Warning System November 21, 2017
 NIDIS Drought and Water Assessment NIDIS Intermountain West Drought Early Warning System November 21, 2017 Precipitation The images above use daily precipitation statistics from NWS COOP, CoCoRaHS, and
NIDIS Intermountain West Drought Early Warning System January 16, 2018
 NIDIS Drought and Water Assessment NIDIS Intermountain West Drought Early Warning System January 16, 2018 Precipitation The images above use daily precipitation statistics from NWS COOP, CoCoRaHS, and
Chapter outline. Reference 12/13/2016
 Chapter 2. observation CC EST 5103 Climate Change Science Rezaul Karim Environmental Science & Technology Jessore University of science & Technology Chapter outline Temperature in the instrumental record
Changing Hydrology under a Changing Climate for a Coastal Plain Watershed
 Changing Hydrology under a Changing Climate for a Coastal Plain Watershed David Bosch USDA-ARS, Tifton, GA Jeff Arnold ARS Temple, TX and Peter Allen Baylor University, TX SEWRU Objectives 1. Project changes
Coupling of Diurnal Climate to Clouds, Land-use and Snow
 Coupling of Diurnal Climate to Clouds, Land-use and Snow Alan K. Betts akbetts@aol.com http://alanbetts.com Co-authors: Ray Desjardins, Devon Worth, Darrel Cerkowniak Agriculture and Agri-Food Canada Shusen
Precipitation. Standardized Precipitation Index. NIDIS Intermountain West Regional Drought Early Warning System January 3, 2017
 1/3/2017 NIDIS Drought and Water Assessment NIDIS Intermountain West Regional Drought Early Warning System January 3, 2017 Precipitation The images above use daily precipitation statistics from NWS COOP,
Montana Drought & Climate
 Montana Drought & Climate MARCH 219 MONITORING AND FORECASTING FOR AGRICULTURE PRODUCERS A SERVICE OF THE MONTANA CLIMATE OFFICE IN THIS ISSUE IN BRIEF PAGE 2 REFERENCE In a Word PAGE 3 REVIEW Winter 219:
Oregon Water Conditions Report May 1, 2017
 Oregon Water Conditions Report May 1, 2017 Mountain snowpack in the higher elevations has continued to increase over the last two weeks. Statewide, most low and mid elevation snow has melted so the basin
Novel Snotel Data Uses: Detecting Change in Snowpack Development Controls, and Remote Basin Snow Depth Modeling
 Novel Snotel Data Uses: Detecting Change in Snowpack Development Controls, and Remote Basin Snow Depth Modeling OVERVIEW Mark Losleben and Tyler Erickson INSTAAR, University of Colorado Mountain Research
Climate Change and Water Supply Research. Drought Response Workshop October 8, 2013
 Climate Change and Water Supply Research Drought Response Workshop October 8, 2013 DWR Photo Oroville Reservoir, 2009 Talk Overview Expectations History Atmospheric Rivers and Water Supply Current Research
Recent Analysis and Improvements of the Statistical Water Supply Forecasts for the Upper Klamath Lake Basin, Oregon and California, USA
 Recent Analysis and Improvements of the Statistical Water Supply Forecasts for the Upper Klamath Lake Basin, Oregon and California, USA Jolyne Lea and David Garen, USDA/NRCS, Adam Kennedy, Portland State
Rainfall Patterns across Puerto Rico: The Rate of Change
 Rainfall Patterns across Puerto Rico: The 1980-2013 Rate of Change Odalys Martínez-Sánchez Lead Forecaster and Climate Team Leader WFO San Juan UPRRP Environmental Sciences PhD Student Introduction Ways
The Texas drought. Kingtse Mo Climate Prediction Center NWS/NCEP/NOAA
 The 2011-2012 Texas drought Kingtse Mo Climate Prediction Center NWS/NCEP/NOAA 1 outline Evolution of the 2011-2012 Texas drought Climatology and historical perspective The 2011 drought Onset Feedback
An ENSO-Neutral Winter
 An ENSO-Neutral Winter This issue of the Blue Water Outlook newsletter is devoted towards my thoughts on the long range outlook for winter. You will see that I take a comprehensive approach to this outlook
Climate Summary for the Northern Rockies Adaptation Partnership
 Climate Summary for the Northern Rockies Adaptation Partnership Compiled by: Linda Joyce 1, Marian Talbert 2, Darrin Sharp 3, John Stevenson 4 and Jeff Morisette 2 1 USFS Rocky Mountain Research Station
Seasonal Outlook through September 2007
 Seasonal Outlook through September 2007 Klaus Wolter (15may) University of Colorado, CIRES & NOAA-ESRL Climate Analysis Branch klaus.wolter@noaa.gov http://www.cdc.noaa.gov/people/klaus.wolter/swcasts/
Let s Talk Climate! Nolan Doesken Colorado Climate Center Colorado State University. Yampatika Seminar February 16, 2011 Steamboat Springs, Colorado
 Let s Talk Climate! Nolan Doesken Colorado Climate Center Colorado State University Yampatika Seminar February 16, 2011 Steamboat Springs, Colorado First -- A short background In 1973 the federal government
Display and analysis of weather data from NCDC using ArcGIS
 Display and analysis of weather data from NCDC using ArcGIS Helen M. Cox Associate Professor Geography Department California State University, Northridge and Stephen Krug Graduate Student Geography Department
Highlights of the 2006 Water Year in Colorado
 Highlights of the 2006 Water Year in Colorado Nolan Doesken, State Climatologist Atmospheric Science Department Colorado State University http://ccc.atmos.colostate.edu Presented to 61 st Annual Meeting
Weather History on the Bishop Paiute Reservation
 Weather History on the Bishop Paiute Reservation -211 For additional information contact Toni Richards, Air Quality Specialist 76 873 784 toni.richards@bishoppaiute.org Updated 2//214 3:14 PM Weather History
Extreme Weather and Climate Change: the big picture Alan K. Betts Atmospheric Research Pittsford, VT NESC, Saratoga, NY
 Extreme Weather and Climate Change: the big picture Alan K. Betts Atmospheric Research Pittsford, VT http://alanbetts.com NESC, Saratoga, NY March 10, 2018 Increases in Extreme Weather Last decade: lack
accumulations. The annual maximum SWE and the rate of snowpack accumulation and
 Exploratory analysis of snowpack in Washington State Nian She and Daniel Basketfield Seattle Public Utilities, Seattle, Washington Abstract. Snow water equivalent (SWE) is used to measure seasonal snowpack
Daria Scott Dept. of Geography University of Delaware, Newark, Delaware
 5.2 VARIABILITY AND TRENDS IN UNITED STA TES SNOWFALL OVER THE LAST HALF CENTURY Daria Scott Dept. of Geography University of Delaware, Newark, Delaware Dale Kaiser* Carbon Dioxide Information Analysis
Colorado weather and climate update: a bit more than halfway through the water year (Or: What s going on with the weather?? )
") Colorado weather and climate update: a bit more than halfway through the water year (Or: What s going on with the weather?? ) Russ S. Schumacher Colorado State Climatologist Director, Colorado Climate
Colorado weather and climate update: a bit more than halfway through the water year (Or: What s going on with the weather?? ) Russ S. Schumacher Colorado State Climatologist Director, Colorado Climate
Climatography of the United States No
 Climate Division: CA 5 NWS Call Sign: Elevation: 6 Feet Lat: 37 Month (1) Min (2) Month(1) Extremes Lowest (2) Temperature ( F) Lowest Month(1) Degree s (1) Base Temp 65 Heating Cooling 1 Number of s (3)
NIDIS Intermountain West Drought Early Warning System November 14, 2017
 NIDIS Intermountain West Drought Early Warning System November 14, 2017 Precipitation The images above use daily precipitation statistics from NWS COOP, CoCoRaHS, and CoAgMet stations. From top to bottom,
Climatography of the United States No
 Climate Division: CA 4 NWS Call Sign: Elevation: 13 Feet Lat: 36 Month (1) Min (2) Month(1) Extremes Lowest (2) Temperature ( F) Lowest Month(1) Degree s (1) Base Temp 65 Heating Cooling 1 Number of s
Climatography of the United States No
 Climate Division: CA 5 NWS Call Sign: Elevation: 1,14 Feet Lat: 36 Month (1) Min (2) Month(1) Extremes Lowest (2) Temperature ( F) Lowest Month(1) Degree s (1) Base Temp 65 Heating Cooling 1 Number of
Climatography of the United States No
 Climate Division: CA 4 NWS Call Sign: Elevation: 2 Feet Lat: 37 Month (1) Min (2) Month(1) Extremes Lowest (2) Temperature ( F) Lowest Month(1) Degree s (1) Base Temp 65 Heating Cooling 1 Number of s (3)
NOAA Snow Map Climate Data Record Generated at Rutgers
 NOAA Snow Map Climate Data Record Generated at Rutgers David A. Robinson Rutgers University Piscataway, NJ Snow Watch 2013 Downsview, Ontario January 29, 2013 December 2012 snow extent departures Motivation
THE ATMOSPHERE IN MOTION
 Funding provided by NOAA Sectoral Applications Research Project THE ATMOSPHERE IN MOTION Basic Climatology Oklahoma Climatological Survey Factor 1: Our Energy Source Hi, I m the Sun! I provide 99.9999+
Midwest and Great Plains Drought and Climate Summary 20 February 2014
 Midwest and Great Plains Drought and Climate Summary 20 February 2014 Wendy Ryan Assistant State Climatologist Colorado Climate Center Colorado State University wendy.ryan@colostate.edu 970-491-8506 General
NIDIS Intermountain West Drought Early Warning System February 6, 2018
 NIDIS Intermountain West Drought Early Warning System February 6, 2018 Precipitation The images above use daily precipitation statistics from NWS COOP, CoCoRaHS, and CoAgMet stations. From top to bottom,
NOAA s Climate Normals. Pre-release Webcast presented by NOAA s National Climatic Data Center June 13, 2011
 NOAA s 1981-2010 Climate Normals Pre-release Webcast presented by NOAA s National Climatic Data Center June 13, 2011 Takeaway Messages Most Normals will be available July 1 via FTP NWS Normals to be loaded
NIDIS Intermountain West Drought Early Warning System December 4, 2018
 12/4/2018 NIDIS Drought and Water Assessment NIDIS Intermountain West Drought Early Warning System December 4, 2018 Precipitation The images above use daily precipitation statistics from NWS COOP, CoCoRaHS,
Webinar and Weekly Summary February 15th, 2011
 Webinar and Weekly Summary February 15th, 2011 -Assessment of current water conditions - Precipitation Forecast - Recommendations for Drought Monitor Upper Colorado Normal Precipitation Upper Colorado
How Patterns Far Away Can Influence Our Weather. Mark Shafer University of Oklahoma Norman, OK
 Teleconnections How Patterns Far Away Can Influence Our Weather Mark Shafer University of Oklahoma Norman, OK Teleconnections Connectedness of large-scale weather patterns across the world If you poke
Precipitation. Standardized Precipitation Index. NIDIS Intermountain West Regional Drought Early Warning System December 6, 2016
 12/9/2016 NIDIS Drought and Water Assessment NIDIS Intermountain West Regional Drought Early Warning System December 6, 2016 Precipitation The images above use daily precipitation statistics from NWS COOP,
Jennifer Francis Institute of Marine and Coastal Sciences Rutgers University In collaboration with Steve Vavrus, U. of Wisconsin
 Jennifer Francis Institute of Marine and Coastal Sciences Rutgers University In collaboration with Steve Vavrus, U. of Wisconsin Arctic Linkages Workshop National Academies of Sciences 12-13 September
CLIMATE RESILIENCE FOR ALBERTA MUNICIPALITIES CLIMATE PROJECTIONS SOUTHERN ALBERTA. Dr. Mel Reasoner Reasoner Environmental Consulting
 CLIMATE RESILIENCE FOR ALBERTA MUNICIPALITIES CLIMATE PROJECTIONS SOUTHERN ALBERTA Dr. Mel Reasoner Reasoner Environmental Consulting Probability of occurrence Increase in Mean Temperature & Variance Less
Climatography of the United States No
 Climate Division: CA 6 NWS Call Sign: LAX Elevation: 1 Feet Lat: 33 Month (1) Min (2) Month(1) Extremes Lowest (2) Temperature ( F) Lowest Month(1) Degree s (1) Base Temp 65 Heating Cooling 1 Number of
Climatography of the United States No
 Climate Division: CA 6 NWS Call Sign: TOA Elevation: 11 Feet Lat: 33 2W Temperature ( F) Month (1) Min (2) Month(1) Extremes Lowest (2) Lowest Month(1) Degree s (1) Base Temp 65 Heating Cooling 1 Number
Climate Change in Colorado: Recent Trends, Future Projections and Impacts An Update to the Executive Summary of the 2014 Report
 Climate Change in Colorado: Recent Trends, Future Projections and Impacts An Update to the Executive Summary of the 2014 Report Jeff Lukas, Western Water Assessment, University of Colorado Boulder - Lukas@colorado.edu
Becky Bolinger Water Availability Task Force November 13, 2018
 Colorado Climate Center WATF Climate Update Becky Bolinger Water Availability Task Force November 13, 2018 COLORADO CLIMATE CENTER Water Year 2018 Colorado s Climate in Review COLORADO CLIMATE CENTER
Sierra Weather and Climate Update
 Sierra Weather and Climate Update 2014-15 Kelly Redmond Western Regional Climate Center Desert Research Institute Reno Nevada Yosemite Hydroclimate Workshop Yosemite Valley, 2015 October 8-9 Percent of
Local Climate Change Impacts for Central Illinois
 Local Climate Change Impacts for Central Illinois Molly Woloszyn Extension Climatologist Midwestern Regional Climate Center & Illinois-Indiana Sea Grant Urbana Sustainability Advisory Commission February
ALMA MEMO : the driest and coldest summer. Ricardo Bustos CBI Project SEP 06
 ALMA MEMO 433 2002: the driest and coldest summer Ricardo Bustos CBI Project E-mail: rbustos@dgf.uchile.cl 2002 SEP 06 Abstract: This memo reports NCEP/NCAR Reanalysis results for the southern hemisphere
TROPICAL-EXTRATROPICAL INTERACTIONS
 Notes of the tutorial lectures for the Natural Sciences part by Alice Grimm Fourth lecture TROPICAL-EXTRATROPICAL INTERACTIONS Anomalous tropical SST Anomalous convection Anomalous latent heat source Anomalous
WRF Historical and PGW Simulations over Alaska
 WRF Historical and PGW Simulations over Alaska Andrew J. Newman 1, Andrew J. Monaghan 2, Martyn P. Clark 1, Kyoko Ikeda 1, Lulin Xue 1, and Jeff R. Arnold 3 GEWEX CPCM Workshop II 1 National Center for
A Review of the 2007 Water Year in Colorado
 A Review of the 2007 Water Year in Colorado Nolan Doesken Colorado Climate Center, CSU Mike Gillespie Snow Survey Division, USDA, NRCS Presented at the 28 th Annual AGU Hydrology Days, March 26, 2008,
APPLICATIONS OF DOWNSCALING: HYDROLOGY AND WATER RESOURCES EXAMPLES
 APPLICATIONS OF DOWNSCALING: HYDROLOGY AND WATER RESOURCES EXAMPLES Dennis P. Lettenmaier Department of Civil and Environmental Engineering For presentation at Workshop on Regional Climate Research NCAR
Climate Variability and Change Past, Present and Future An Overview
 Climate Variability and Change Past, Present and Future An Overview Dr Jim Salinger National Institute of Water and Atmospheric Research Auckland, New Zealand INTERNATIONAL WORKSHOP ON REDUCING VULNERABILITY
CHAPTER 1: INTRODUCTION
 CHAPTER 1: INTRODUCTION There is now unequivocal evidence from direct observations of a warming of the climate system (IPCC, 2007). Despite remaining uncertainties, it is now clear that the upward trend
Climate of Columbus. Aaron Wilson. Byrd Polar & Climate Research Center State Climate Office of Ohio.
 Climate of Columbus Aaron Wilson Byrd Polar & Climate Research Center http://bpcrc.osu.edu/greenteam Overview Historical Climatology Climate Change & Impacts Projected Changes Summary 2 Historical Climatology
Storm and Runoff Calculation Standard Review Snowmelt and Climate Change
 Storm and Runoff Calculation Standard Review Snowmelt and Climate Change Presented by Don Moss, M.Eng., P.Eng. and Jim Hartman, P.Eng. Greenland International Consulting Ltd. Map from Google Maps TOBM
NIDIS Intermountain West Drought Early Warning System December 30, 2018
 1/2/2019 NIDIS Drought and Water Assessment NIDIS Intermountain West Drought Early Warning System December 30, 2018 Precipitation The images above use daily precipitation statistics from NWS COOP, CoCoRaHS,
Climatography of the United States No
 No. 2 1971-2 Asheville, North Carolina 2881 COOP ID: 42713 Climate Division: CA 7 NWS Call Sign: Elevation: -3 Feet Lat: 32 Month (1) Min (2) Month(1) Extremes Lowest (2) Temperature ( F) Lowest Month(1)
Model resolution impact on Precipitation: Comparison to SNOTEL observations
 Model resolution impact on Precipitation: Comparison to SNOTEL observations 5/7/2012 40 proj. updates Sensitivity to model grid resolution: Precipitation from the 8-year Current Climate Simulation Percent
The Northern Hemisphere Sea ice Trends: Regional Features and the Late 1990s Change. Renguang Wu
 The Northern Hemisphere Sea ice Trends: Regional Features and the Late 1990s Change Renguang Wu Institute of Atmospheric Physics, Chinese Academy of Sciences, Beijing World Conference on Climate Change
Climatography of the United States No
 No. 2 1971-2 Asheville, North Carolina 2881 COOP ID: 46175 Climate Division: CA 6 NWS Call Sign: 3L3 Elevation: 1 Feet Lat: 33 Month (1) Min (2) Month(1) Extremes Lowest (2) Temperature ( F) Lowest Month(1)
Hydroclimatic Variability and Change: Issues in the Intermountain West
 Hydroclimatic Variability and Change: Issues in the Intermountain West Kelly Redmond Western Regional Climate Center Desert Research Institute Reno NV Collaborative and Interdisciplinary Climate Change
Northern Rockies Adaptation Partnership: Climate Projections
 Northern Rockies Adaptation Partnership: Climate Projections Contents Observed and Projected Climate for the NRAP Region... 2 Observed and Projected Climate for the NRAP Central Subregion... 8 Observed
NIDIS Intermountain West Drought Early Warning System May 1, 2018
 NIDIS Intermountain West Drought Early Warning System May 1, 2018 Precipitation The images above use daily precipitation statistics from NWS COOP, CoCoRaHS, and CoAgMet stations. From top to bottom, and
Upper Missouri River Basin February 2018 Calendar Year Runoff Forecast February 6, 2018
 Upper Missouri River Basin February 2018 Calendar Year Runoff Forecast February 6, 2018 Calendar Year Runoff Forecast Explanation and Purpose of Forecast U.S. Army Corps of Engineers, Northwestern Division