State of the Climate for the Central Great Plains. Johannes Feddema Department of Geography University of Kansas
|
|
|
- Samson Walton
- 5 years ago
- Views:
Transcription


1 State of the Climate for the Central Great Plains Johannes Feddema Department of Geography University of Kansas Adapting to a Changing Climate on the Central Great Plains Conference Kansas State University, September 6, 2011
2

3 State of Climate? Or weather?
4 Things to think about July marked the 36 th consecutive July and 329 th consecutive month with a global temperature above the 20 th century average. The last below-average temperature July was July 1976 and the last below-average temperature month was February The average temperature for the contiguous U.S. during July was 77.6 F, 3.3 F above the 20 th century average, marking the warmest July and all-time warmest month on record for the nation in a period of record that dates back to The previous warmest July for the nation was July 1936, when the average U.S. temperature was 77.4 F.

5 Setting more US temperature records

6 What happened this summer?

7 US climate Regions

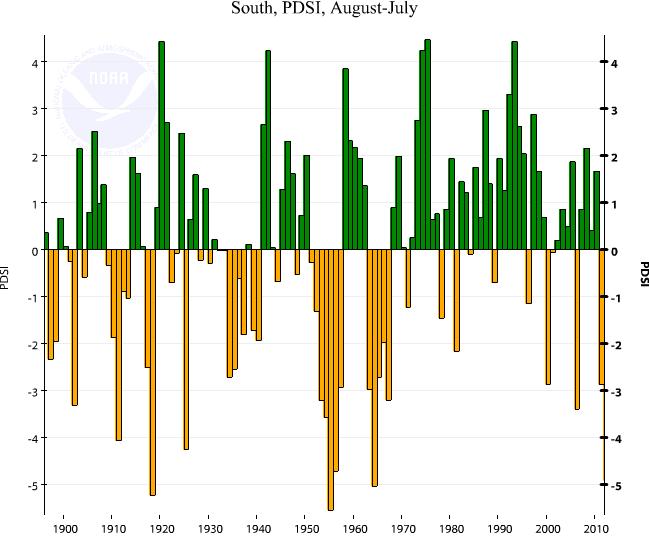
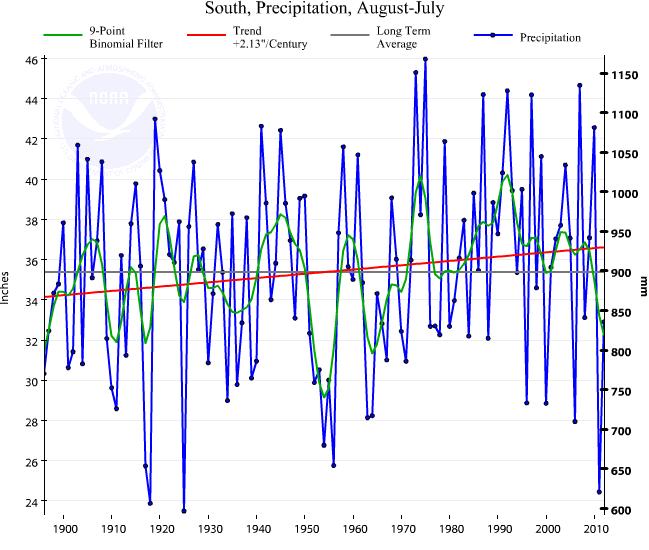
8 South Region Climate Trends August 1895-July 2012 Source: NOAA/NCDC

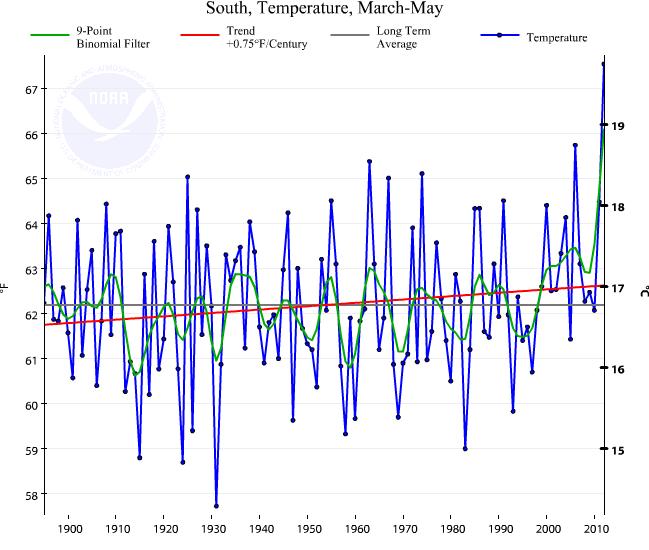
9 South Region: Temperature Seasonal Trends Source: NOAA/NCDC


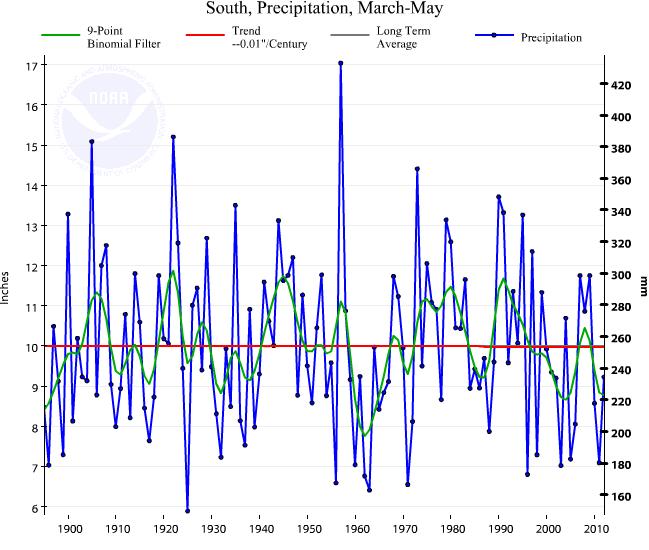
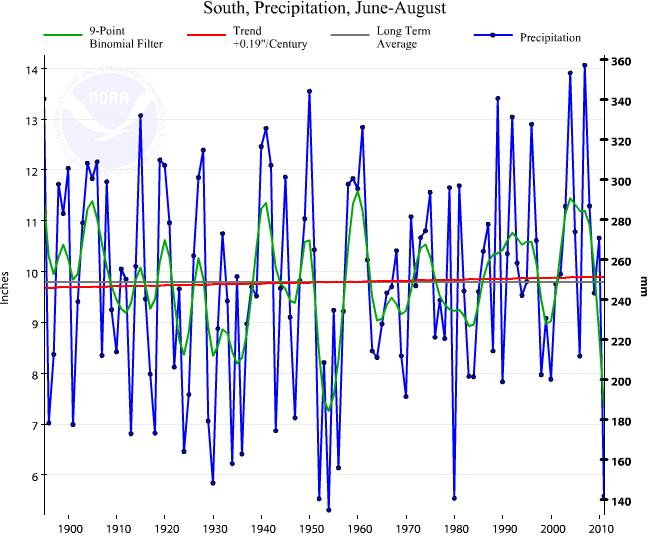
10 South Region: Precipitation Seasonal Trends Source: NOAA/NCDC


11 NWC Region Climate Trends August 1895-July 2012 Source: NOAA/NCDC 06&div=0

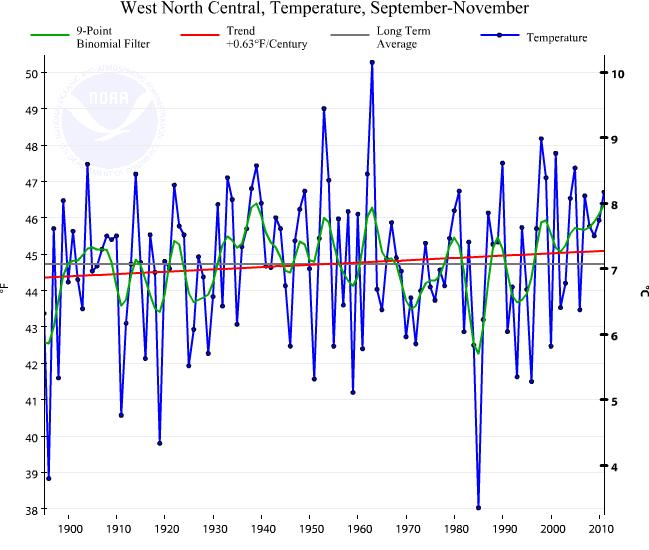
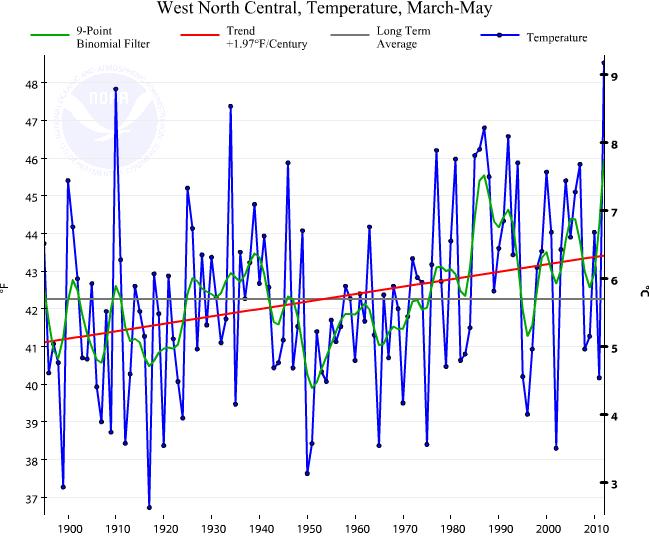
12 NWC Region: Temperature Seasonal Trends Source: NOAA/NCDC

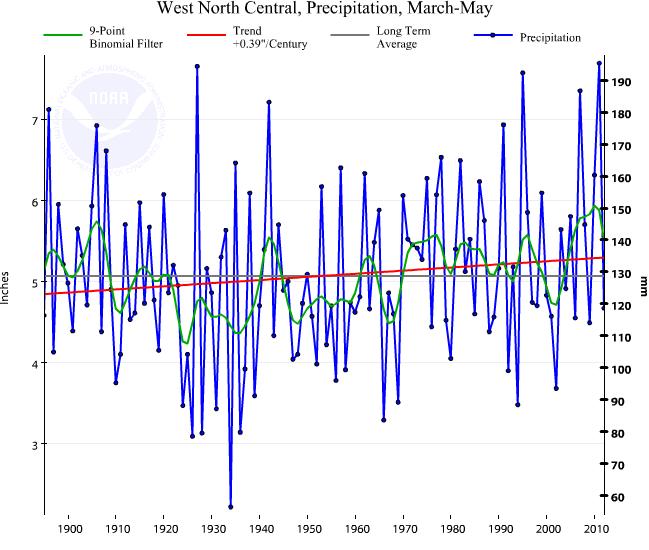
13 NWC Region: Precipitation Seasonal Trends Source: NOAA/NCDC


14 Kansas in the Spring -- Winter Wheat! Source: NOAA/NCDC 4&div=0


15 What About Kansas: Early Summer (May-July) Source: NOAA/NCDC 4&div=0

16 US Outlook for the next 3 months!
17 What about extremes?

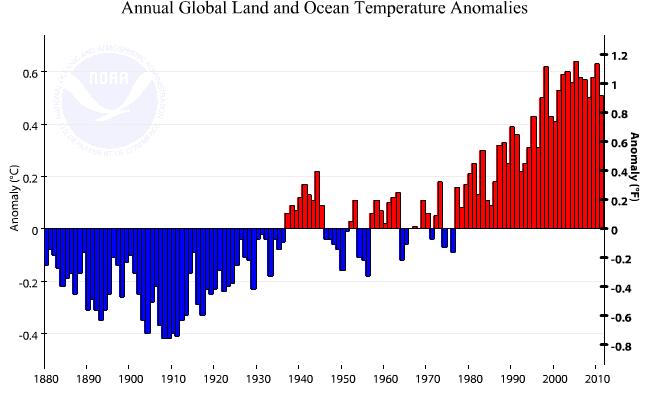
18 How is the current warmth different from the past? Source Source: EPA -- uses coop stations

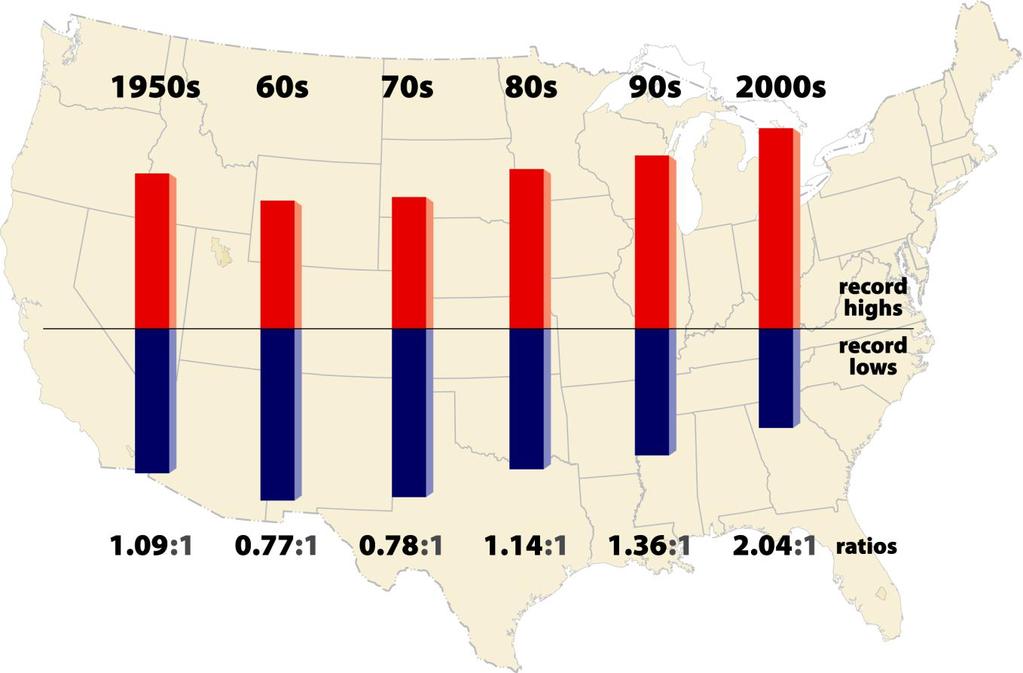
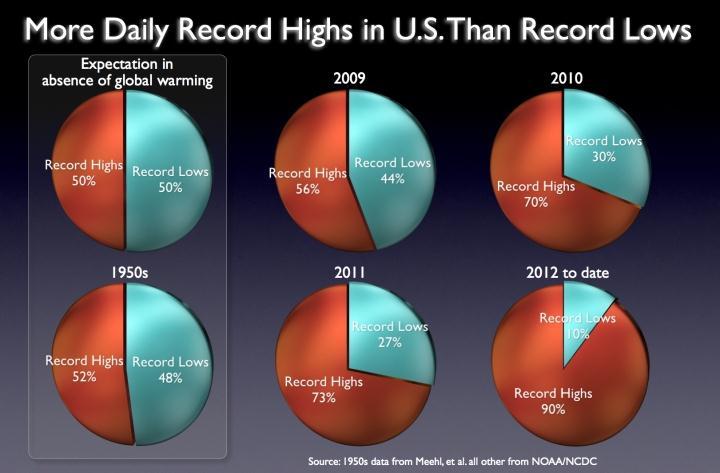
19 Breaking records in the US Sources: Andrew Freeman Climate Central and Capital Climate


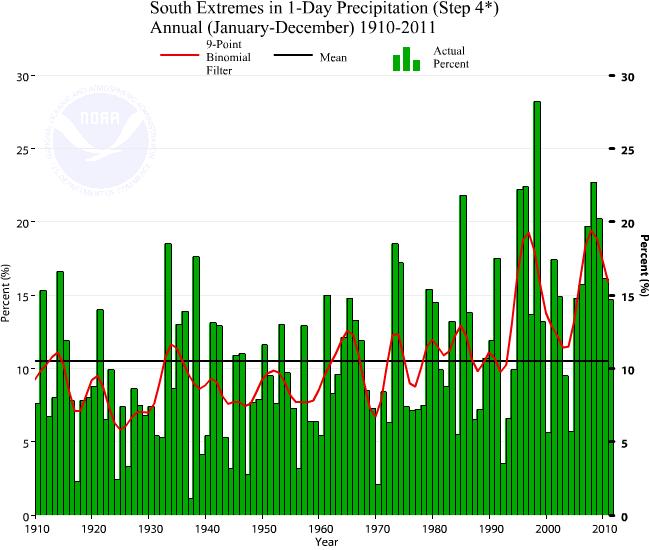
20 Extremes in the South region Tmax Tmin 1 day P PDSI CEI Days w/o P Y axis = percent area affected X axis annual from Source: NOAA/NCDC


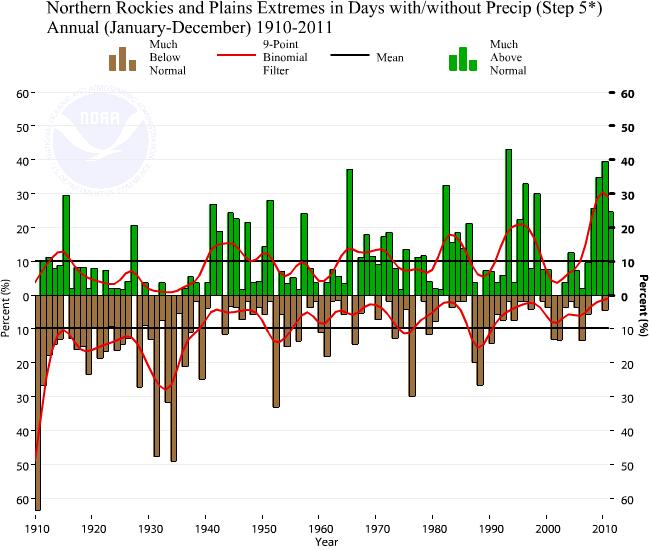
21 Extremes in the NWC region Tmax Tmin 1 day P PDSI Days w/o P CEI Y axis = percent area affected X axis annual from Source: NOAA/NCDC


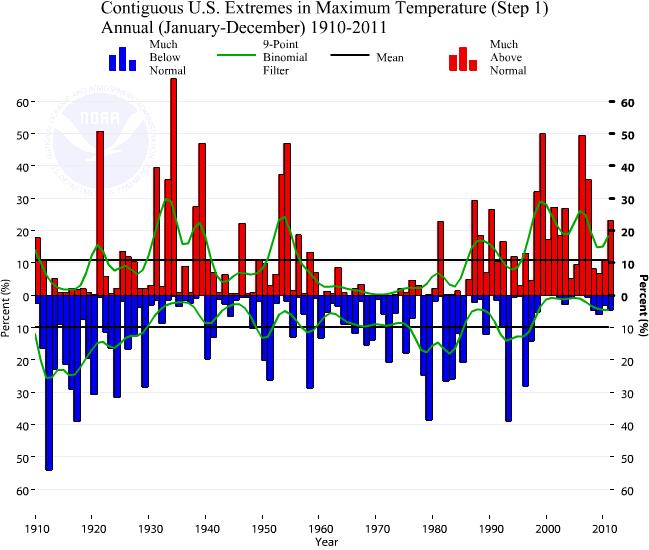
22 Extremes in the Contiguous US Tmax Tmin 1 day P PDSI CEI Days w/o P Y axis = percent area affected X axis annual from Source: NOAA/NCDC

23 Changes by Season trend from 1976 to 2005 Source: NOAA/NCEP
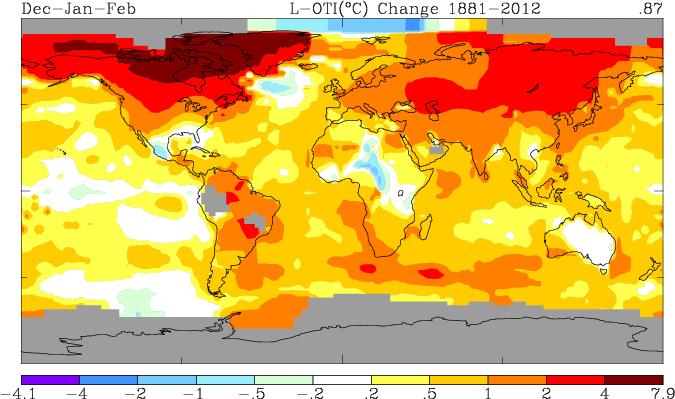
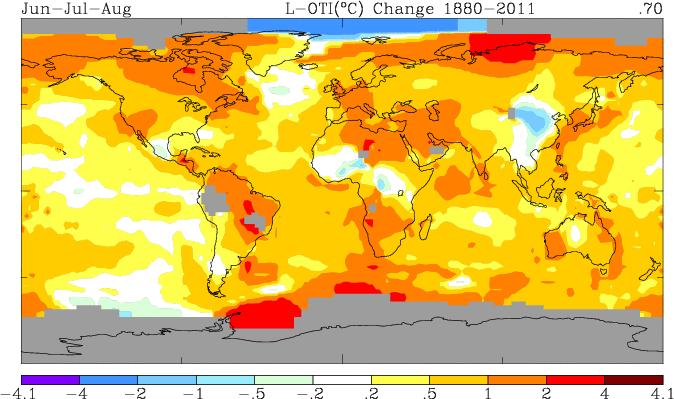
24 What about the global picture?

25 Global temperature change from 1880 to 2011
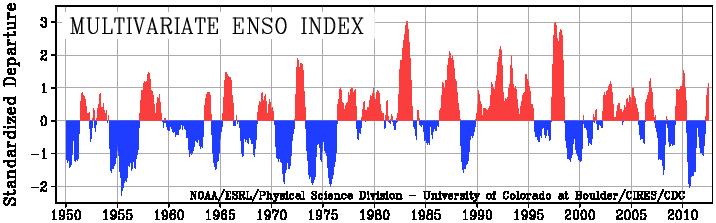
26 Global temperature trends and ENSO

27 ENSO trends Pacific SSTs

28 2012 Global Monthly Temperature Anomalies Source: NOAA/NCDC
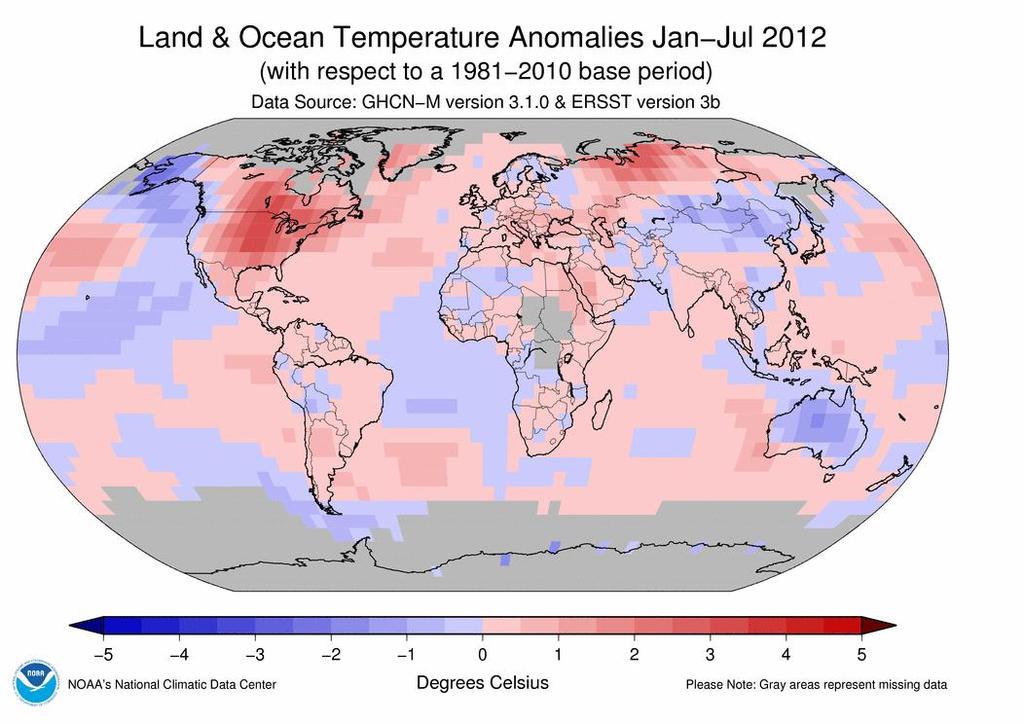
29

30 2012 Global Monthly Precipitation Anomalies Source: NOAA/NCDC

31 Changes in Global Extreme Temperatures Fig. 1. June July August surface temperature anomalies in 1955, 1965, 1975, and the past 6 y relative to the mean. Number on Upper Right is the global mean (average over all area with data).

32 Extremes are not just this year!
, very hot (> 2σ), and extremely hot (> 3σ), with analogous divisions for cold anomalies.")
33 Changes in Global Extreme Temperatures Fig. 5. Area of the world covered by temperature anomalies in the categories defined as hot (> 0.43σ), very hot (> 2σ), and extremely hot (> 3σ), with analogous divisions for cold anomalies. Source: Hansen, Satoa and Ruedyb Perception of climate change PNAS August 6, 2012
 of local temperature anomalies (relative to 1951 1980 mean) divided by local standard deviation (x axis) obtained by counting gridboxes with anomalies")
34 Changes in Global Extreme Temperatures Fig. 4. Frequency of occurrence (y axis) of local temperature anomalies (relative to mean) divided by local standard deviation (x axis) obtained by counting gridboxes with anomalies in each 0.05 interval. Area under each curve is unity. Source: Hansen, Satoa and Ruedyb Perception of climate change PNAS August 6, 2012
35 Global and US 5 warmest years and (through July) tenth through July
, very hot (>2σ), and extremely hot (>3σ). Anomalies are relative to 1951 1980 base period; σ is from 1951 1980 data.")
36 Changes in NH, US and SH Extreme Temperatures Fig. 7. Percent area covered by temperature anomalies in categories defined as hot (>0.43σ), very hot (>2σ), and extremely hot (>3σ). Anomalies are relative to base period; σ is from data. Source: Hansen, Satoa and Ruedyb Perception of climate change PNAS August 6, 2012
37 What are some causes of the patterns we see in the United States?
 Source: http://www.")
38 Observed Warming hole Observed change in surface air temperature between 1930 and Observations are from the NASA GISS Surface Temperature Analysis. (Credit: Image courtesy of Eric Leibensperger) Source:
39 It s the Ocean. Stupid! 700m Heat content Source: NOAA
40 It s the Ocean. Stupid! 2000m Heat content

41 Causes: Changes in Snow Climatology: Change between the last two climate periods Figure 1: Percent difference between the and average annual snowfall totals across the contiguous United States. Both sets of averages are computed from GHCN-Daily using the methods employed for the normals. At each location, the percent difference is calculated as the difference between the and normals, divided by the normal. A positive difference indicates that the snowfall normal is greater than the normal at the same location. Source: WHAT'S NEW FOR SNOW IN NOAA'S U.S. CLIMATE NORMALS? Durre, Squires, Vose, Arguez, Applequist, and Yin. NOAA NESDIS National Climatic Data Center, Asheville, North Carolina
 Minimum")

 Max")
42 Temperature (irrigated control) Minimum Temperature (K) Source: Huber and Mechem Univ of Kansas Average Temperature (K) Max Temperature (K)

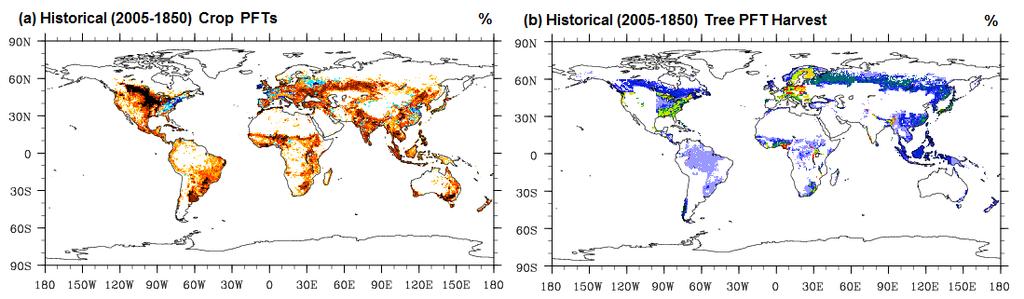
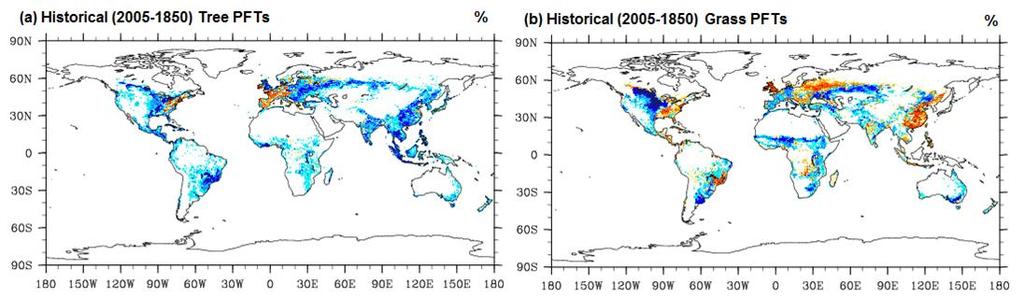
43 Historical Source: Lawrence et al, 2011


44 Historical responses: Fully coupled vs Land cover only Source: Lawrence et al, 2011


45 Historical responses: Fully coupled vs Land cover only Source: Lawrence et al, 2011

46 Arctic Sea Ice Extent 2007 vs 2012 Source: NSIDC
47 Arctic Sea Ice AREA Source: NSIDC
48 Arctic Sea ice THICKNESS Source:
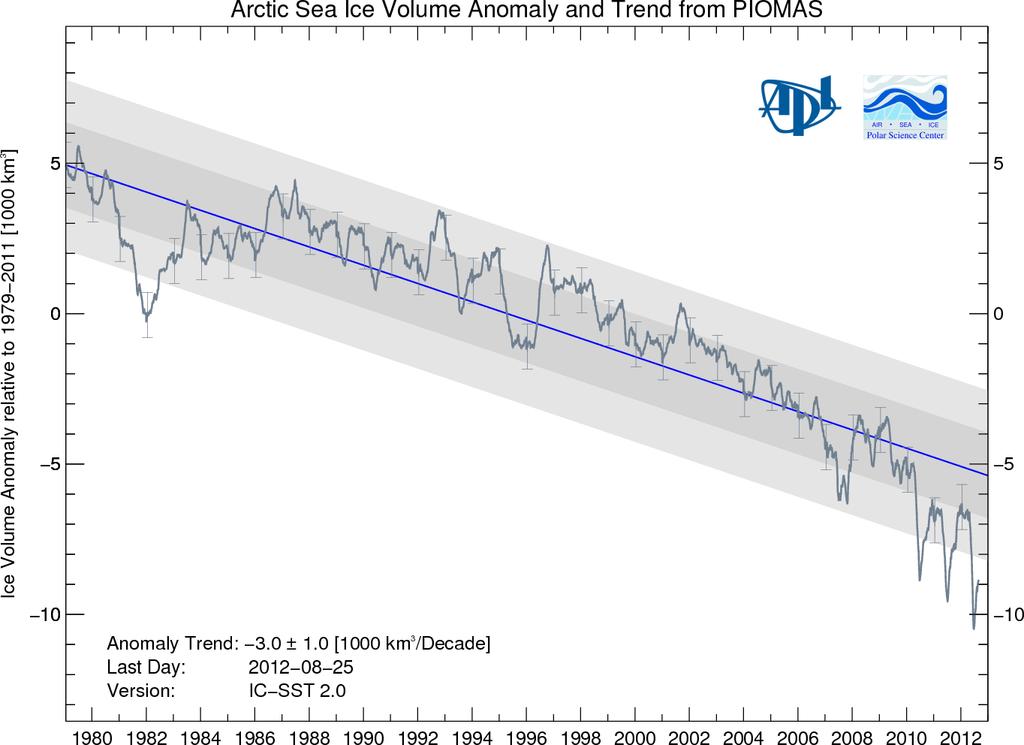
49 Arctic sea ice VOLUME Source:
50 If you are not convinced?


51 Changes in the growing season Length of the growing season in the lower 48 states compared with a long-term average. For each year, the line represents the number of days shorter or longer than average. The trend line was smoothed using an 11-year moving average. Choosing a different long-term average for comparison would not change the shape of the trend Timing of the last spring frost and the first fall frost in the lower 48 states compared with a long-term average. Positive values indicate that the frost occurred later in the year, and negative values indicate that the frost occurred earlier in the year. The trend lines were smoothed using an 11-year moving average. Source: EPA: Kunkel,

52 Plant Hardiness Source: EPA : Arbor Day Foundation


53 US Plant Phenology Modeled trends in lilac and honeysuckle bloom dates across the lower 48 states, using the 1961 to 1990 average as a baseline. Positive values indicate that blooming occurred later in the year, and negative values indicate that blooming occurred earlier. The thicker line was smoothed using a nine-year weighted average. Choosing a different long-term average for comparison would not change the shape of the trend Source: EPA: Schwartz,
.")
54 Changes in Bird Ranges 1966 to 2005 Annual change in latitude of bird center of abundance for 305 widespread bird species in North America from 1966 to Each winter is represented by the year in which it began (for example, winter is shown as 2005). The shaded band shows the likely range of values, based on the number of measurements collected and the precision of the methods used. Source EPA: National Audubon Society,

55 Snow Pack Trends in snow water equivalent in the western United States and part of Canada. Negative trends are shown by red circles and positive trends by blue. Source EPA: Mote,
 and one in the Pacific (Hawaii).")
56 CO2 and Ocean acidity Changes in ocean carbon dioxide levels (measured as a partial pressure) and acidity (measured as ph). The data come from two observation stations in the North Atlantic Ocean (Canary Islands and Bermuda) and one in the Pacific (Hawaii). Dots represent individual measurements, while the lines represent smoothed trends. Source EPA: Bindoff et al,

57 Now what!?
58 Some last thoughts?
59 Implications of 2012?
60 Holcomb?
Observed Climate Variability and Change: Evidence and Issues Related to Uncertainty
 Observed Climate Variability and Change: Evidence and Issues Related to Uncertainty David R. Easterling National Climatic Data Center Asheville, North Carolina Overview Some examples of observed climate
Drought and Climate Extremes Indices for the North American Drought Monitor and North America Climate Extremes Monitoring System. Richard R. Heim Jr.
 Drought and Climate Extremes Indices for the North American Drought Monitor and North America Climate Extremes Monitoring System Richard R. Heim Jr. NOAA/NESDIS/National Climatic Data Center Asheville,
Historical and Projected Future Climatic Trends in the Great Lakes Region
 Historical and Projected Future Climatic Trends in the Great Lakes Region Jeffrey A. Andresen Dept. of Geography, Environment, and Spatial Sciences Michigan State University Flooding along I-696 Warren,
Global Ocean Heat Content (0-700m) Other signs of (global) warming. Global Sea Level Rise. Change in upper ocean temperature ( )
 Other signs of (global) warming. Global Sea Level Rise. Change in upper ocean temperature ( )") Global Ocean Heat Content (0-700m) Change in upper ocean temperature (1955-2003) 0.25C 0.50C Solid lines are three independent estimates (95% confidence interval in grey) IPCC 2007 Fig TS.16 Trends in
Global Ocean Heat Content (0-700m) Change in upper ocean temperature (1955-2003) 0.25C 0.50C Solid lines are three independent estimates (95% confidence interval in grey) IPCC 2007 Fig TS.16 Trends in
J8.4 TRENDS OF U.S. SNOWFALL AND SNOW COVER IN A WARMING WORLD,
 J8.4 TRENDS OF U.S. SNOWFALL AND SNOW COVER IN A WARMING WORLD, 1948-2008 Richard R. Heim Jr. * NOAA National Climatic Data Center, Asheville, North Carolina 1. Introduction The Intergovernmental Panel
2015 Record breaking temperature anomalies
 2015 Record breaking temperature anomalies June 2015 global temperature was the highest in 136 (since 1880) years reaching an average of 0.88 C above the 20 th century average. This is an increase of 0.12
2016 Irrigated Crop Production Update
 2016 Irrigated Crop Production Update Mapping Climate Trends and Weather Extremes Across Alberta for the Period 1950-2010 Stefan W. Kienzle Department of Geography University of Lethbridge, Alberta, Canada
Northwest Outlook October 2016
 Northwest Outlook October 2016 Rainfall Opportunities and Challenges Rainfall over the month of September presented some challenges for the fall harvest while other producers benefitted. Figure 1a shows
ANALYSIS OF CLIMATIC CHANGES IN THE SAN JUAN MOUNTAIN (SJM) REGION DURING THE 20 TH CENTURY. Imtiaz Rangwala
 REGION DURING THE 20 TH CENTURY. Imtiaz Rangwala") ANALYSIS OF CLIMATIC CHANGES IN THE SAN JUAN MOUNTAIN (SJM) REGION DURING THE 20 TH CENTURY Imtiaz Rangwala imtiazr@envsci.rutgers.edu MTNCLIM 2008 1 Objectives (as proposed) Nature of climate change in
ANALYSIS OF CLIMATIC CHANGES IN THE SAN JUAN MOUNTAIN (SJM) REGION DURING THE 20 TH CENTURY Imtiaz Rangwala imtiazr@envsci.rutgers.edu MTNCLIM 2008 1 Objectives (as proposed) Nature of climate change in
2015: A YEAR IN REVIEW F.S. ANSLOW
 2015: A YEAR IN REVIEW F.S. ANSLOW 1 INTRODUCTION Recently, three of the major centres for global climate monitoring determined with high confidence that 2015 was the warmest year on record, globally.
Activity 2.2: Recognizing Change (Observation vs. Inference)
") Activity 2.2: Recognizing Change (Observation vs. Inference) Teacher Notes: Evidence for Climate Change PowerPoint Slide 1 Slide 2 Introduction Image 1 (Namib Desert, Namibia) The sun is on the horizon
Activity 2.2: Recognizing Change (Observation vs. Inference) Teacher Notes: Evidence for Climate Change PowerPoint Slide 1 Slide 2 Introduction Image 1 (Namib Desert, Namibia) The sun is on the horizon
Climate Change 2007: The Physical Science Basis
 Climate Change 2007: The Physical Science Basis Working Group I Contribution to the IPCC Fourth Assessment Report Presented by R.K. Pachauri, IPCC Chair and Bubu Jallow, WG 1 Vice Chair Nairobi, 6 February
An ENSO-Neutral Winter
 An ENSO-Neutral Winter This issue of the Blue Water Outlook newsletter is devoted towards my thoughts on the long range outlook for winter. You will see that I take a comprehensive approach to this outlook
CLIMATE RESILIENCE FOR ALBERTA MUNICIPALITIES CLIMATE PROJECTIONS SOUTHERN ALBERTA. Dr. Mel Reasoner Reasoner Environmental Consulting
 CLIMATE RESILIENCE FOR ALBERTA MUNICIPALITIES CLIMATE PROJECTIONS SOUTHERN ALBERTA Dr. Mel Reasoner Reasoner Environmental Consulting Probability of occurrence Increase in Mean Temperature & Variance Less
CLIMATE RESILIENCE FOR ALBERTA MUNICIPALITIES CLIMATE PROJECTIONS NORTHERN ALBERTA. Dr. Mel Reasoner Reasoner Environmental Consulting
 CLIMATE RESILIENCE FOR ALBERTA MUNICIPALITIES CLIMATE PROJECTIONS NORTHERN ALBERTA Dr. Mel Reasoner Reasoner Environmental Consulting Probability of occurrence Increase in Mean Temperature & Variance Less
Annex I to Target Area Assessments
 Baltic Challenges and Chances for local and regional development generated by Climate Change Annex I to Target Area Assessments Climate Change Support Material (Climate Change Scenarios) SWEDEN September
Deke Arndt, Chief, Climate Monitoring Branch, NOAA s National Climatic Data Center
 Thomas R. Karl, L.H.D., Director, NOAA s National Climatic Data Center, and Chair of the Subcommittee on Global Change Research Peter Thorne, PhD, Senior Scientist, Cooperative Institute for Climate and
Impacts of Climate on the Corn Belt
 Impacts of Climate on the Corn Belt Great Lakes Crop Summit 2015 2015 Evelyn Browning Garriss Conclusions Climate change is not linear. It ebbs and flows. Recent polar volcano eruptions created a cool
Indiana s Climate Trends
 Indiana s Climate Trends A resource for the Indiana Climate Change Impacts Assessment (IN CCIA) FEBRUARY 2018 Suggested citation Widhalm, M., Robeson, S., Hall, B., Baldwin, M., and J. Coleman (2018).
Warm Episode of December 2015:
 Warm Episode of 11-16 December 2015: Record Warmth over Mid-Atlantic Region By Richard H. Grumm National Weather Service State College, PA 1. Overview A strong 500 hpa ridge over the eastern United States
Extreme Weather and Climate Change: the big picture Alan K. Betts Atmospheric Research Pittsford, VT NESC, Saratoga, NY
 Extreme Weather and Climate Change: the big picture Alan K. Betts Atmospheric Research Pittsford, VT http://alanbetts.com NESC, Saratoga, NY March 10, 2018 Increases in Extreme Weather Last decade: lack
Pacific Decadal Oscillation ( PDO ):
:") Time again for my annual Winter Weather Outlook. Here's just a small part of the items I considered this year and how I think they will play out with our winter of 2015-2016. El Nino / La Nina: When looking
Time again for my annual Winter Weather Outlook. Here's just a small part of the items I considered this year and how I think they will play out with our winter of 2015-2016. El Nino / La Nina: When looking
Marche Region Climate Analysis by Danilo Tognetti 1
 Marche Region. 2016 Climate Analysis by Danilo Tognetti 1 With the contribution of eight consecutive high monthly temperature records set from January to August, and the remainder of the months ranking
Polar Portal Season Report 2016
 Polar Portal Season Report 2016 Less ice both on land and at sea This year s report is the fourth since the Polar Portal was launched, and as an introduction, we have chosen to take a look at the trends
RaysWeather.Com Winter Fearless Forecast
 Author: Dr. Ray Russell Founder and President of RaysWeather.Com Date: October 19, 2017 RaysWeather.Com 2018-2019 Winter Fearless Forecast Background Unseasonably warm weather continues this fall no frost
Here s what a weak El Nino usually brings to the nation with temperatures:
 Time again for my annual Winter Weather Outlook. Here's just a small part of the items I considered this year and how I think they will play out with our winter of 2018-2019. El Nino / La Nina: When looking
Special blog on winter 2016/2017 retrospective can be found here -
 March 4, 2019 Special blog on winter 2016/2017 retrospective can be found here - http://www.aer.com/winter2017 Special blog on winter 2015/2016 retrospective can be found here - http://www.aer.com/winter2016
Monthly Long Range Weather Commentary Issued: APRIL 18, 2017 Steven A. Root, CCM, Chief Analytics Officer, Sr. VP,
 Monthly Long Range Weather Commentary Issued: APRIL 18, 2017 Steven A. Root, CCM, Chief Analytics Officer, Sr. VP, sroot@weatherbank.com MARCH 2017 Climate Highlights The Month in Review The average contiguous
Upper Missouri River Basin December 2017 Calendar Year Runoff Forecast December 5, 2017
 Upper Missouri River Basin December 2017 Calendar Year Runoff Forecast December 5, 2017 Calendar Year Runoff Forecast Explanation and Purpose of Forecast U.S. Army Corps of Engineers, Northwestern Division
NIDIS Intermountain West Drought Early Warning System September 4, 2018
 NIDIS Drought and Water Assessment NIDIS Intermountain West Drought Early Warning System September 4, 2018 Precipitation The images above use daily precipitation statistics from NWS COOP, CoCoRaHS, and
PRMS WHITE PAPER 2014 NORTH ATLANTIC HURRICANE SEASON OUTLOOK. June RMS Event Response
 PRMS WHITE PAPER 2014 NORTH ATLANTIC HURRICANE SEASON OUTLOOK June 2014 - RMS Event Response 2014 SEASON OUTLOOK The 2013 North Atlantic hurricane season saw the fewest hurricanes in the Atlantic Basin
The U. S. Winter Outlook
 The 2018-2019 U. S. Winter Outlook Michael Halpert Deputy Director Climate Prediction Center Mike.Halpert@noaa.gov http://www.cpc.ncep.noaa.gov Outline About the Seasonal Outlook Review of 2017-18 U. S.
Figure 1. Carbon dioxide time series in the North Pacific Ocean (
 Evidence #1: Since 1950, Earth s atmosphere and oceans have changed. The amount of carbon released to the atmosphere has risen. Dissolved carbon in the ocean has also risen. More carbon has increased ocean
1 What Is Climate? TAKE A LOOK 2. Explain Why do areas near the equator tend to have high temperatures?
 CHAPTER 17 1 What Is Climate? SECTION Climate BEFORE YOU READ After you read this section, you should be able to answer these questions: What is climate? What factors affect climate? How do climates differ
Climate Change Impact on Air Temperature, Daily Temperature Range, Growing Degree Days, and Spring and Fall Frost Dates In Nebraska
 EXTENSION Know how. Know now. Climate Change Impact on Air Temperature, Daily Temperature Range, Growing Degree Days, and Spring and Fall Frost Dates In Nebraska EC715 Kari E. Skaggs, Research Associate
Extreme Rainfall in the Southeast U.S.
 Extreme Rainfall in the Southeast U.S. David F. Zierden Florida State Climatologist Center for Ocean Atmospheric Prediction Studies The Florida State University March 7, 2016 Causes of Extreme Rainfall
Outline: 1) Extremes were triggered by anomalous synoptic patterns 2) Cloud-Radiation-PWV positive feedback on 2007 low SIE
 Extremes were triggered by anomalous synoptic patterns 2) Cloud-Radiation-PWV positive feedback on 2007 low SIE") Identifying Dynamical Forcing and Cloud-Radiative Feedbacks Critical to the Formation of Extreme Arctic Sea-Ice Extent in the Summers of 2007 and 1996 Xiquan Dong University of North Dakota Outline: 1)
Identifying Dynamical Forcing and Cloud-Radiative Feedbacks Critical to the Formation of Extreme Arctic Sea-Ice Extent in the Summers of 2007 and 1996 Xiquan Dong University of North Dakota Outline: 1)
Chapter outline. Reference 12/13/2016
 Chapter 2. observation CC EST 5103 Climate Change Science Rezaul Karim Environmental Science & Technology Jessore University of science & Technology Chapter outline Temperature in the instrumental record
Jennifer Francis Institute of Marine and Coastal Sciences Rutgers University In collaboration with Steve Vavrus, U. of Wisconsin
 Jennifer Francis Institute of Marine and Coastal Sciences Rutgers University In collaboration with Steve Vavrus, U. of Wisconsin Arctic Linkages Workshop National Academies of Sciences 12-13 September
THE WINTER OF JUST HOW WEIRD WAS IT EXACTLY?
 Courtesy Reuters Buffalo New York THE WINTER OF 2013-2014 JUST HOW WEIRD WAS IT EXACTLY? Eyad Atallah and John Gyakum McGill University Some Headlines Certainly for large portions of southern Canada and
The U. S. Winter Outlook
 The 2017-2018 U. S. Winter Outlook Michael Halpert Deputy Director Climate Prediction Center Mike.Halpert@noaa.gov http://www.cpc.ncep.noaa.gov Outline About the Seasonal Outlook Review of 2016-17 U. S.
Climate Impacts to Southwest Water Sector. Dr. Dave DuBois New Mexico State Climatologist
 Climate Impacts to Southwest Water Sector Dr. Dave DuBois New Mexico State Climatologist Presented at EPA Extreme Events and Climate Adaptation Planning Workshop June 3, 2015 Water Year Precip. % of Average
Atlantic Region s Changing Climate. Dr. Adam Fenech, University of Prince Edward Island Climate Change and Aquaculture Symposium 11 March 2014
 Atlantic Region s Changing Climate Dr. Adam Fenech, University of Prince Edward Island Climate Change and Aquaculture Symposium 11 March 2014 Disclaimer Analysis has not been checked Some analysis uses
Global Climate Change and the Implications for Oklahoma. Gary McManus Associate State Climatologist Oklahoma Climatological Survey
 Global Climate Change and the Implications for Oklahoma Gary McManus Associate State Climatologist Oklahoma Climatological Survey OCS LEGISLATIVE MANDATES Conduct and report on studies of climate and weather
The New Normal or Was It?
 The New Normal or Was It? by Chuck Coffey The recent drought has caused many to reflect upon the past and wonder what is in store for the future. Just a couple of years ago, few agricultural producers
Monitoring and Prediction of Climate Extremes
 Monitoring and Prediction of Climate Extremes Stephen Baxter Meteorologist, Climate Prediction Center NOAA/NWS/NCEP Deicing and Stormwater Management Conference ACI-NA/A4A Arlington, VA May 19, 2017 What
STATE OF THE CLIMATE IN 2017
 STATE OF THE CLIMATE IN 2017 Today s Presenters Jeff Rosenfeld Editor-In-Chief, Bulletin of the American Meteorological Society Boston, MA Deke Arndt Chief, Monitoring Branch, NOAA s National Centers for
Historical and Projected Future Climatic Trends in the Great Lakes Region
 Historical and Projected Future Climatic Trends in the Great Lakes Region Jeffrey A. Andresen Dept. of Geography, Environment, and Spatial Sciences Michigan State University Outline Historical Trends Climatic
Foralps 2nd conference. Assessment of Lombardy's climate in the last century: data analysis, methodologies and indices
 Alessia Marchetti, Angela Sulis Assessment of Lombardy's climate in the last century: data Contents The dataset The daily indices analysis Some preliminary monthly data indices analysis Some key points
Ellen L. Mecray NOAA Regional Climate Services Director, Eastern Region Taunton, MA
 Ellen L. Mecray NOAA Regional Climate Services Director, Eastern Region Taunton, MA Regions of the US National Climate Assessment What we Observe: Climate changes and impacts Increasing temperature Increasingly
1 What Is Climate? TAKE A LOOK 2. Explain Why do areas near the equator tend to have high temperatures?
 CHAPTER 17 1 What Is Climate? SECTION Climate BEFORE YOU READ After you read this section, you should be able to answer these questions: What is climate? What factors affect climate? How do climates differ
NADM, NACEM, and Opportunities for Future Collaboration
 NADM, NACEM, and Opportunities for Future Collaboration Richard R. Heim Jr. NOAA/NESDIS/National Climatic Data Center Asheville, North Carolina, U.S.A. 4th Annual DRI Workshop 26-28 January 2009, Regina,
Presentation Overview. Southwestern Climate: Past, present and future. Global Energy Balance. What is climate?
 Southwestern Climate: Past, present and future Mike Crimmins Climate Science Extension Specialist Dept. of Soil, Water, & Env. Science & Arizona Cooperative Extension The University of Arizona Presentation
Winter. Here s what a weak La Nina usually brings to the nation with tempseraures:
 2017-2018 Winter Time again for my annual Winter Weather Outlook. Here's just a small part of the items I considered this year and how I think they will play out with our winter of 2017-2018. El Nino /
Extreme, transient Moisture Transport in the high-latitude North Atlantic sector and Impacts on Sea-ice concentration:
 AR conference, June 26, 2018 Extreme, transient Moisture Transport in the high-latitude North Atlantic sector and Impacts on Sea-ice concentration: associated Dynamics, including Weather Regimes & RWB
2013 ATLANTIC HURRICANE SEASON OUTLOOK. June RMS Cat Response
 2013 ATLANTIC HURRICANE SEASON OUTLOOK June 2013 - RMS Cat Response Season Outlook At the start of the 2013 Atlantic hurricane season, which officially runs from June 1 to November 30, seasonal forecasts
Sierra Weather and Climate Update
 Sierra Weather and Climate Update 2014-15 Kelly Redmond Western Regional Climate Center Desert Research Institute Reno Nevada Yosemite Hydroclimate Workshop Yosemite Valley, 2015 October 8-9 Percent of
Global Climate Change and the Implications for Oklahoma. Gary McManus Associate State Climatologist Oklahoma Climatological Survey
 Global Climate Change and the Implications for Oklahoma Gary McManus Associate State Climatologist Oklahoma Climatological Survey Our previous stance on global warming Why the anxiety? Extreme Viewpoints!
Seasonal Climate Outlook for South Asia (June to September) Issued in May 2014
 Issued in May 2014") Ministry of Earth Sciences Earth System Science Organization India Meteorological Department WMO Regional Climate Centre (Demonstration Phase) Pune, India Seasonal Climate Outlook for South Asia (June
Ministry of Earth Sciences Earth System Science Organization India Meteorological Department WMO Regional Climate Centre (Demonstration Phase) Pune, India Seasonal Climate Outlook for South Asia (June
Climate Variability and Change Past, Present and Future An Overview
 Climate Variability and Change Past, Present and Future An Overview Dr Jim Salinger National Institute of Water and Atmospheric Research Auckland, New Zealand INTERNATIONAL WORKSHOP ON REDUCING VULNERABILITY
Arctic Climate Change. Glen Lesins Department of Physics and Atmospheric Science Dalhousie University Create Summer School, Alliston, July 2013
 Arctic Climate Change Glen Lesins Department of Physics and Atmospheric Science Dalhousie University Create Summer School, Alliston, July 2013 When was this published? Observational Evidence for Arctic
The Colorado Drought of 2002 in Perspective
 The Colorado Drought of 2002 in Perspective Colorado Climate Center Nolan Doesken and Roger Pielke, Sr. Prepared by Tara Green and Odie Bliss http://climate.atmos.colostate.edu Known Characteristics of
September 2018 Weather Summary West Central Research and Outreach Center Morris, MN
 September 2018 Weather Summary The mean temperature for September was 60.6 F, which is 1.5 F above the average of 59.1 F (1886-2017). The high temperature for the month was 94 F on September 16 th. The
Climate Change in Colorado: Recent Trends, Future Projections and Impacts An Update to the Executive Summary of the 2014 Report
 Climate Change in Colorado: Recent Trends, Future Projections and Impacts An Update to the Executive Summary of the 2014 Report Jeff Lukas, Western Water Assessment, University of Colorado Boulder - Lukas@colorado.edu
Monthly Long Range Weather Commentary Issued: May 15, 2014 Steven A. Root, CCM, President/CEO
 Monthly Long Range Weather Commentary Issued: May 15, 2014 Steven A. Root, CCM, President/CEO sroot@weatherbank.com APRIL 2014 REVIEW Climate Highlights The Month in Review The average temperature for
Lecture 28: Observed Climate Variability and Change
 Lecture 28: Observed Climate Variability and Change 1. Introduction This chapter focuses on 6 questions - Has the climate warmed? Has the climate become wetter? Are the atmosphere/ocean circulations changing?
Weather Outlook 2016: Cycles and Patterns Influencing Our Growing Season
 Weather Outlook 2016: Cycles and Patterns Influencing Our Growing Season Leon F. Osborne Chester Fritz Distinguished Professor of Atmospheric Sciences University of North Dakota Cycle of El Niño Events
Percentage of normal rainfall for April 2018 Departure from average air temperature for April 2018
 New Zealand Climate Update No 227, May 2018 Current climate April 2018 Overall, April 2018 was characterised by lower pressure than normal over and to the southeast of New Zealand. Unlike the first three
Seasonal Outlook through September 2007
 Seasonal Outlook through September 2007 Klaus Wolter (18apr07) University of Colorado, CIRES & NOAA-ESRL Climate Analysis Branch klaus.wolter@noaa.gov http://www.cdc.noaa.gov/people/klaus.wolter/swcasts/
Minnesota s Climatic Conditions, Outlook, and Impacts on Agriculture. Today. 1. The weather and climate of 2017 to date
 Minnesota s Climatic Conditions, Outlook, and Impacts on Agriculture Kenny Blumenfeld, State Climatology Office Crop Insurance Conference, Sep 13, 2017 Today 1. The weather and climate of 2017 to date
MATH 412: Homework # 1 Tim Ahn June 15, 2016
 MATH 412: Homework # 1 Tim Ahn June 15, 2016 Chapter 1 Problem 1 (# 2 & 3) (a) Arctic sea ice extent averaged over January 2011 was 13.55 million square km. This was the lowest January ice extent recorded
US Drought Status. Droughts 1/17/2013. Percent land area affected by Drought across US ( ) Dev Niyogi Associate Professor Dept of Agronomy
 Dev Niyogi Associate Professor Dept of Agronomy") Droughts US Drought Status Dev Niyogi Associate Professor Dept of Agronomy Deptof Earth Atmospheric Planetary Sciences Indiana State Climatologist Purdue University LANDSURFACE.ORG iclimate.org climate@purdue.edu
Droughts US Drought Status Dev Niyogi Associate Professor Dept of Agronomy Deptof Earth Atmospheric Planetary Sciences Indiana State Climatologist Purdue University LANDSURFACE.ORG iclimate.org climate@purdue.edu
 Page 1 of 5 Home research global climate enso effects Research Effects of El Niño on world weather Precipitation Temperature Tropical Cyclones El Niño affects the weather in large parts of the world. The
The 2009 Hurricane Season Overview
 The 2009 Hurricane Season Overview Jae-Kyung Schemm Gerry Bell Climate Prediction Center NOAA/ NWS/ NCEP 1 Overview outline 1. Current status for the Atlantic, Eastern Pacific and Western Pacific basins
MDA WEATHER SERVICES AG WEATHER OUTLOOK. Kyle Tapley-Senior Agricultural Meteorologist May 22, 2014 Chicago, IL
 MDA WEATHER SERVICES AG WEATHER OUTLOOK Kyle Tapley-Senior Agricultural Meteorologist May 22, 2014 Chicago, IL GLOBAL GRAIN NORTH AMERICA 2014 Agenda Spring Recap North America Forecast El Niño Discussion
Climate Change Impacts Water Resources (Drought & Snow) Richard R. Heim Jr.
 Richard R. Heim Jr.") Climate Change Impacts Water Resources (Drought & Snow) Richard R. Heim Jr. NOAA / NESDIS / Climate Monitoring Branch Asheville, North Carolina National Association of Clean Water Agencies Web Seminar,
Climate Change Impacts Water Resources (Drought & Snow) Richard R. Heim Jr. NOAA / NESDIS / Climate Monitoring Branch Asheville, North Carolina National Association of Clean Water Agencies Web Seminar,
Presented by Larry Rundquist Alaska-Pacific River Forecast Center Anchorage, Alaska April 14, 2009
 Presented by Larry Rundquist Alaska-Pacific River Forecast Center Anchorage, Alaska April 14, 2009 Presentation Outline Who we are Breakup characteristics Climate and weather influences 2009 breakup outlook
The importance of long-term Arctic weather station data for setting the research stage for climate change studies
 The importance of long-term Arctic weather station data for setting the research stage for climate change studies Taneil Uttal NOAA/Earth Systems Research Laboratory Boulder, Colorado Things to get out
Earth Science and Climate Change
 Earth Science and Climate Change Dr. Mary L. Cleave February 7, 2007 YOU ARE HERE 3 Land Use Changes Over Time Lingering Doubts on Temperature Trends Have Been Resolved 1st CCSP Synthesis & Assessment
Local Ctimatotogical Data Summary White Hall, Illinois
 SWS Miscellaneous Publication 98-5 STATE OF ILLINOIS DEPARTMENT OF ENERGY AND NATURAL RESOURCES Local Ctimatotogical Data Summary White Hall, Illinois 1901-1990 by Audrey A. Bryan and Wayne Armstrong Illinois
Climate. Annual Temperature (Last 30 Years) January Temperature. July Temperature. Average Precipitation (Last 30 Years)
 January Temperature. July Temperature. Average Precipitation (Last 30 Years)") Climate Annual Temperature (Last 30 Years) Average Annual High Temp. (F)70, (C)21 Average Annual Low Temp. (F)43, (C)6 January Temperature Average January High Temp. (F)48, (C)9 Average January Low Temp.
Climate Annual Temperature (Last 30 Years) Average Annual High Temp. (F)70, (C)21 Average Annual Low Temp. (F)43, (C)6 January Temperature Average January High Temp. (F)48, (C)9 Average January Low Temp.
Climate Change in the Northeast: Past, Present, and Future
 Climate Change in the Northeast: Past, Present, and Future Dr. Cameron Wake Institute for the Study of Earth, Oceans, and Space (EOS) University of New Hampshire 62nd Annual Meeting of the Northeastern
Monthly Long Range Weather Commentary Issued: APRIL 1, 2015 Steven A. Root, CCM, President/CEO
 Monthly Long Range Weather Commentary Issued: APRIL 1, 2015 Steven A. Root, CCM, President/CEO sroot@weatherbank.com FEBRUARY 2015 Climate Highlights The Month in Review The February contiguous U.S. temperature
Changing predictability characteristics of Arctic sea ice in a warming climate
 Changing predictability characteristics of Arctic sea ice in a warming climate Marika Holland 1 Laura Landrum 1, John Mioduszewski 2, Steve Vavrus 2, Muyin Wang 3 1. NCAR, 2. U. Wisconsin-Madison, 3. NOAA
Percentage of normal rainfall for August 2017 Departure from average air temperature for August 2017
 New Zealand Climate Update No 219, August 2017 Current climate August 2017 Overall, mean sea level pressure was lower than normal over and to the west of New Zealand during August while higher than normal
November 2018 Weather Summary West Central Research and Outreach Center Morris, MN
 November 2018 Weather Summary Lower than normal temperatures occurred for the second month. The mean temperature for November was 22.7 F, which is 7.2 F below the average of 29.9 F (1886-2017). This November
Cuba. General Climate. Recent Climate Trends. UNDP Climate Change Country Profiles. Temperature. C. McSweeney 1, M. New 1,2 and G.
 UNDP Climate Change Country Profiles Cuba C. McSweeney 1, M. New 1,2 and G. Lizcano 1 1. School of Geography and Environment, University of Oxford. 2. Tyndall Centre for Climate Change Research http://country-profiles.geog.ox.ac.uk
Monthly Long Range Weather Commentary Issued: SEPTEMBER 19, 2016 Steven A. Root, CCM, Chief Analytics Officer, Sr. VP,
 Monthly Long Range Weather Commentary Issued: SEPTEMBER 19, 2016 Steven A. Root, CCM, Chief Analytics Officer, Sr. VP, sroot@weatherbank.com SEPTEMBER 2016 Climate Highlights The Month in Review The contiguous
2003 Moisture Outlook
 2003 Moisture Outlook Nolan Doesken and Roger Pielke, Sr. Colorado Climate Center Prepared by Tara Green and Odie Bliss http://climate.atmos.colostate.edu Through 1999 Through 1999 Fort Collins Total Water
May Global Warming: Recent Developments and the Outlook for the Pacific Northwest
 Global Warming: Recent Developments and the Outlook for the Pacific Northwest Pat Bartlein Department of Geography University of Oregon (bartlein@uoregon.edu) http://geography.uoregon.edu/envchange/gwhr/
Midwest/Great Plains Climate-Drought Outlook September 20, 2018
 Midwest/Great Plains Climate-Drought Outlook September 20, 2018 Brian Fuchs National Drought Mitigation Center University of Nebraska-Lincoln School of Natural Resources September 20, 2018 General Information
Fire Weather Monitoring and Predictability in the Southeast
 Fire Weather Monitoring and Predictability in the Southeast Corey Davis October 9, 2014 Photo: Pains Bay fire in 2011 (courtesy Donnie Harris, NCFWS) Outline Fire risk monitoring Fire risk climatology
Global Climate Change
 Global Climate Change Overview: Students will learn about global climate change, what causes global warming, and scientific projections about climate change in the near future. Levels V-VI Grades 9-12
Global Warming is Unequivocal: The Evidence from NOAA
 Global Warming is Unequivocal: The Evidence from NOAA Thomas R. Karl Past President, American Meteorological Society Interim Director, NOAA Climate Service Director, NOAA National Climatic Data Center,
TROPICAL-EXTRATROPICAL INTERACTIONS
 Notes of the tutorial lectures for the Natural Sciences part by Alice Grimm Fourth lecture TROPICAL-EXTRATROPICAL INTERACTIONS Anomalous tropical SST Anomalous convection Anomalous latent heat source Anomalous
Fire Weather Drivers, Seasonal Outlook and Climate Change. Steven McGibbony, Severe Weather Manager Victoria Region Friday 9 October 2015
 Fire Weather Drivers, Seasonal Outlook and Climate Change Steven McGibbony, Severe Weather Manager Victoria Region Friday 9 October 2015 Outline Weather and Fire Risk Environmental conditions leading to
Introduction to Climatology. GEOG/ENST 2331: Lecture 1
 Introduction to Climatology GEOG/ENST 2331: Lecture 1 Us Graham Saunders graham.saunders@lakeheadu.ca Jason Freeburn (RC 2004) jtfreebu@lakeheadu.ca Graham Saunders Australian Weather Bureau Environment
IMPACTS OF A WARMING ARCTIC
 The Earth s Greenhouse Effect Most of the heat energy emitted from the surface is absorbed by greenhouse gases which radiate heat back down to warm the lower atmosphere and the surface. Increasing the
Detecting Climate Change through Means and Extremes
 Detecting Climate Change through Means and Extremes New Mexico Supercomputing Challenge Final Report April 6, 2016 Team 55 Los Alamos Middle School Team Member: Lillian Petersen Teacher: Adam Drew Mentor:
WeatherManager Weekly
 Issue 288 July 14, 2016 WeatherManager Weekly Industries We Serve Agriculture Energy/Utilities Construction Transportation Retail Our Weather Protection Products Standard Temperature Products Lowest Daily