Drought and Climate Extremes Indices for the North American Drought Monitor and North America Climate Extremes Monitoring System. Richard R. Heim Jr.
|
|
|
- Dwight Cummings
- 6 years ago
- Views:
Transcription
1 Drought and Climate Extremes Indices for the North American Drought Monitor and North America Climate Extremes Monitoring System Richard R. Heim Jr. NOAA/NESDIS/National Climatic Data Center Asheville, North Carolina, U.S.A. DRI Precipitation and Drought Indices Workshop 30 April 2009, Toronto, Ont., Canada
2 Outline Background of the North American Drought Monitor (NADM) Drought and precipitation indicators that support the NADM Background of the North America Climate Extremes Monitoring (NACEM) System Extremes indices utilized in the NACEM Background and components of the U.S. Climate Extremes Index (CEI) Snow Climatology indicators (if we have time)

3 North American Drought Monitor (NADM) NADM is an operational product issued monthly that provides a general summary of current drought conditions across North America; first issued publicly in Drought conditions in each country determined by specialists in that country. The weekly U.S. Drought Monitor from the week closest to the end of the month is used in the U.S. Participants: U.S. (most of the USDM authors): NOAA (NCDC, CPC) USDA / JAWF NDMC Canada: Agriculture & Agri-food Canada Meteorological Service of Canada Mexico: National Meteorological Service (SMN) NADM is an international partnership, a NOAA example of the implementation of GEOSS of the Americas


4 NADM Continental Drought Indicators Drought conditions in US, MX, CN are determined independently based on different data, indices, & analyses within each country by analysts in each country Drought indices covering entire continent are needed Same indices, same standardizing period ( ), same methodologies This consistency needed for depiction across international boundaries Issues concerning the regional applicability of drought indices (e.g., Palmer Indices, SPI) even definition of drought
![NADM Continental Drought Indicators Palmer Drought Index (PHDI, Z Index, modified PDSI [PMDI or PDI]) Standardized](/docs-images/76/73700679/images/5-1.jpg "Precipitation Index (SPI) (1-, 2-, 3-, 6-, 9-, 12-, 24-month) Percent of Long-Term Average Precipitation (PCTPCP,")
 NADM Objective Blends (under development) http://www.ncdc.noaa.")
5 NADM Continental Drought Indicators Palmer Drought Index (PHDI, Z Index, modified PDSI [PMDI or PDI]) Standardized Precipitation Index (SPI) (1-, 2-, 3-, 6-, 9-, 12-, 24-month) Percent of Long-Term Average Precipitation (PCTPCP, base period) Satellite-based indices Vegetation Health Index (VHI) VegDRI (eventually) Modeled Soil Moisture (CPC Leaky Bucket Model) NADM Objective Blends (under development)
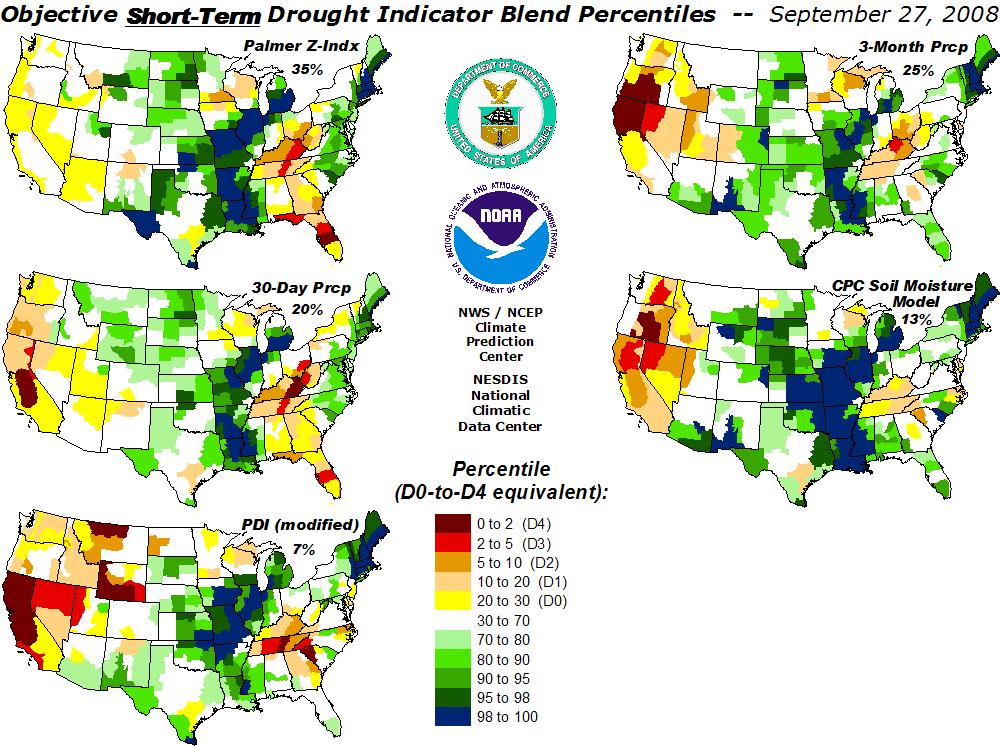
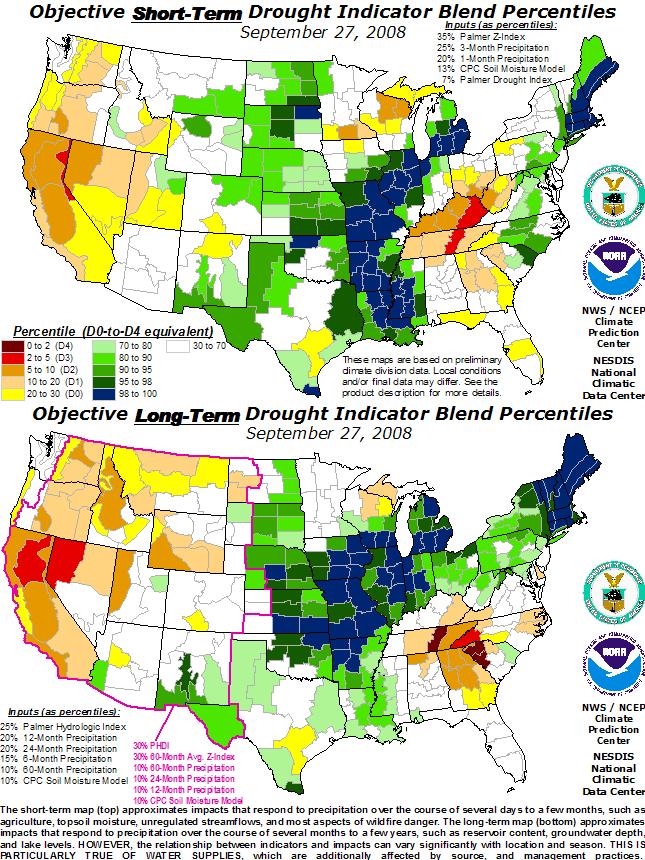
6 USDM & NADM Objective Blends Objective blends integrate multiple indicators into a product update using a percentile ranking method All parameters are first rendered as percentiles with respect to a standard period using a percent rank method The parameters (drought indicators) are then combined using a weighting scheme Short- and Long-Term Blends produced Need serially complete data Operationally produced weekly for USDM using NOAA/CPC s real-time daily and weekly climate division data and NOAA/NCDC s monthly archive of indices for Experimental for NADM; monthly; use gridded temperature, precipitation, & Palmer index fields for North America;

7 USDM Objective Blends
 3-month precipitation (30%)")
 60-month Palmer Z Index (20%) 60-month precipitation (20%) 24-month precipitation (10%)")
8 NADM Objective Blends NADM percentiles based on x0.5-degree gridded data base Short-term blend components: Palmer Z Index (35%) 3-month precipitation (30%) 1-month precipitation (25%) Palmer Drought Index (10%) Long-term blend components: Palmer Hydrological Drought Index (30%) 60-month Palmer Z Index (20%) 60-month precipitation (20%) 24-month precipitation (10%) 12-month precipitation (10%) 6-month precipitation (10%)
9 North America Climate Extremes Monitoring (NACEM) System Purpose: Improve the scientific understanding of observed changes in extreme climate conditions From a set of 27 core climate extremes indices, a subset of 12 are being analyzed at this time Based on work of WMO Expert Team on Climate Change Detection Monitoring and Indices Data Base consists of daily temperature and precipitation data from 1955-present for stations across Canada (210 stations), US (750), and Mexico (300)

10 Products: NACEM Web Page Monthly/seasonal maps of trends and anomalies for North America or the 3 individual countries Stations can be subsetted based on elevation, trend significance, percent of available data Time series graphs of individual station data
11 NACEM Indices Number of Frost Days (Tmin < 0 C) Number of Summer Days (Tmax > 25 C) Number of Icing Days (Tmax < 0 C) Number of Tropical Nights (Tmin > 20 C) Growing Season Length Percentage of Days when Tmax > 90th percentile Percentage of Days when Tmax < 10th percentile Percentage of Days when Tmin > 90th percentile Percentage of Days when Tmin < 10th percentile Greatest 5-day Total Precipitation Simple Precipitation Intensity Index Maximum Length of Dry Spell (Pcp < 1 mm)
12 U.S. Climate Extremes Index (CEI) Integrates several climate components into a standardized national index to monitor & analyze climate extremes in the U.S.. Components: Monthly max & min temperature Daily precipitation Data: Monthly PDSI Landfalling tropical storm & hurricane wind velocity (experimental) USHCN v2 stations (temp & precip) supplemented with TD3200 Climate divisions (monthly PDSI) HURDAT (tropical cyclone wind velocity) Period of record: 1910-present The components are converted to percentiles Upper & lower tenth percentile threshold Percent area of the country with each component exceeding the threshold
: percent area of the U.S.")
13 CEI Components Step 2 (component 2): percent area of the U.S. with minimum temperatures above and below the tenth percentile Percent area above 90 th percentile (warm nights) Percent area below 10 th percentile (cold nights) Total percent area above 90 th percentile & below 10 th percentile


14 Tmax Annual CEI Components Tmin hot days warm nights cool days cold nights hot or cool days warm or cold nights
 & % area with much greater than normal number of")

15 Annual CEI Components * Component 5: % area with much greater than normal number of days with precipitation (top) & % area with much greater than normal number of days without precipitation (bottom) severe wet spell days with precip * severe drought days without precip days with or without precip severe drought or wet spell

: sum of squares of U.S.")
16 Annual CEI Components Component 4: twice the percent of the U.S. with much greater than normal proportion of precipitation derived from extreme (> 90th percentile) 1-day precipitation events (wet days). Component 6 (experimental): sum of squares of U.S. landfalling tropical storm and hurricane wind velocities scaled to the mean of the first 5 indicators.
: With component 6 (tropical storm & hurricane wind")
17 Annual CEI Without component 6 (tropical storm & hurricane wind velocities): With component 6 (tropical storm & hurricane wind velocities):
18 (time check)
19 Thank-You!
20 U.S. Snow Climatology Indices Purpose: Create a snow climatology for Cooperative Network stations to support NOAA National Weather Service operations & FEMA snow disaster declaration activities Period of record daily snowfall & snow depth data were analyzed Daily & monthly climatologies were computed Station History metadata and Quality Control & Inventory (QCI) statistics were compiled to assist the user in evaluation of station quality and for station selection
21 U.S. Snow Climatology Snow Indices Monthly & seasonal total snowfall Daily & multiple-day periods extreme snowfall Number of days (& multi-day periods) with snowfall >= various thresholds Number of consecutive days with snowfall (>= 0.1 in. & >= 1.0 in.) Monthly probability of receiving snowfall Daily probability of receiving snowfall beyond various thresholds Earliest, latest, & median dates with snowfall beyond various thresholds (snow season length) Extreme (1-day, 2-day, 3-day) snowfall corresponding to 4 return periods (10-yr, 25-yr, 50-yr, 100-yr) Median and extreme daily snow cover (snow depth [SD]) Number of days with snow cover (SD beyond various thresholds) Number of consecutive days with snow cover (SD >= 1 in.) Daily probability of having snow depth beyond various thresholds
22 U.S. Snow Climatology Statistics Mean Median Extremes (minimum, maximum, top 10 smallest, top 10 greatest) Quartiles Daily & monthly probabilities Frequencies Number of years with non-missing data
23 Thank-You!
NADM, NACEM, and Opportunities for Future Collaboration
 NADM, NACEM, and Opportunities for Future Collaboration Richard R. Heim Jr. NOAA/NESDIS/National Climatic Data Center Asheville, North Carolina, U.S.A. 4th Annual DRI Workshop 26-28 January 2009, Regina,
From a North American to a Global Drought Monitor Richard R. Heim Jr.
 From a North American to a Global Drought Monitor Richard R. Heim Jr. NOAA/NESDIS/ Asheville, North Carolina, USA GEO-DRI Drought Monitoring Workshop Winnipeg, Manitoba, Canada 10-11 May 2010 NADM History
The North American Drought Monitor - The Canadian Perspective -
 The North American Drought Monitor - The Canadian Perspective - Trevor Hadwen National Agroclimate Information Service AAFC-PFRA, Regina Canmore, Alberta March 16-18, 2008 Background The NADM is a cooperative
UPPLEMENT A COMPARISON OF THE EARLY TWENTY-FIRST CENTURY DROUGHT IN THE UNITED STATES TO THE 1930S AND 1950S DROUGHT EPISODES
 UPPLEMENT A COMPARISON OF THE EARLY TWENTY-FIRST CENTURY DROUGHT IN THE UNITED STATES TO THE 1930S AND 1950S DROUGHT EPISODES Richard R. Heim Jr. This document is a supplement to A Comparison of the Early
CARIWIN Regional Seminar January 14-15, 2010, Georgetown, Guyana
 Creating the North American Drought Monitor Angel (Bennett) McCoy Angel.M.Bennett@noaa.gov NOAA/Climate Prediction Center Camp Springs, Maryland, U.S.A. Doug LeComte NOAA/Climate Prediction Center Richard
High Resolution Indicators for Local Drought Monitoring
 High Resolution Indicators for Local Drought Monitoring REBECCA CUMBIE, STATE CLIMATE OFFICE OF NC, NCSU Monitoring Drought Multiple indicators, multiple sources Local detail important 1 Point-Based Climate-Division
NIDIS Intermountain West Drought Early Warning System October 17, 2017
 NIDIS Drought and Water Assessment NIDIS Intermountain West Drought Early Warning System October 17, 2017 Precipitation The images above use daily precipitation statistics from NWS COOP, CoCoRaHS, and
The United States Drought Monitor How is it Made?
 The United States Drought Monitor How is it Made? Brian Fuchs, Climatologist National Drought Mitigation Center School of Natural Resources University of Nebraska-Lincoln September 14-17, 2009 Bamako,
1.6 TRENDS AND VARIABILITY OF SNOWFALL AND SNOW COVER ACROSS NORTH AMERICA AND EURASIA. PART 2: WHAT THE DATA SAY
 1.6 TRENDS AND VARIABILITY OF SNOWFALL AND SNOW COVER ACROSS NORTH AMERICA AND EURASIA. PART 2: WHAT THE DATA SAY David A. Robinson* Rutgers University, Department of Geography, Piscataway, New Jersey
2016 Irrigated Crop Production Update
 2016 Irrigated Crop Production Update Mapping Climate Trends and Weather Extremes Across Alberta for the Period 1950-2010 Stefan W. Kienzle Department of Geography University of Lethbridge, Alberta, Canada
The History and Making of the U.S. Drought Monitor
 The History and Making of the U.S. Drought Monitor Mike Hayes, Director Mark Svoboda, Climatologist/Monitoring Program Area Leader Kelly Smith, Communications Specialist National Drought Mitigation Center
Richard R. Heim Jr. Michael J. Brewer
 Linking GDIS Data Sets Using the NIDIS Drought Portal Richard R. Heim Jr. Michael J. Brewer NOAA/NESDIS/ Asheville, North Carolina International Global Drought Information System Workshop: Next Steps Caltech
NOAA s Climate Normals. Pre-release Webcast presented by NOAA s National Climatic Data Center June 13, 2011
 NOAA s 1981-2010 Climate Normals Pre-release Webcast presented by NOAA s National Climatic Data Center June 13, 2011 Takeaway Messages Most Normals will be available July 1 via FTP NWS Normals to be loaded
The U.S. Drought Monitor: A Composite Indicator Approach
 The U.S. Drought Monitor: A Composite Indicator Approach Mark Svoboda, Climatologist Monitoring Program Area Leader National Drought Mitigation Center School of Natural Resources University of Nebraska-Lincoln
Drought Criteria. Richard J. Heggen Department of Civil Engineering University of New Mexico, USA Abstract
 Drought Criteria Richard J. Heggen Department of Civil Engineering University of New Mexico, USA rheggen@unm.edu Abstract Rainwater catchment is an anticipatory response to drought. Catchment design requires
NIDIS Intermountain West Drought Early Warning System September 4, 2018
 NIDIS Drought and Water Assessment NIDIS Intermountain West Drought Early Warning System September 4, 2018 Precipitation The images above use daily precipitation statistics from NWS COOP, CoCoRaHS, and
J8.4 TRENDS OF U.S. SNOWFALL AND SNOW COVER IN A WARMING WORLD,
 J8.4 TRENDS OF U.S. SNOWFALL AND SNOW COVER IN A WARMING WORLD, 1948-2008 Richard R. Heim Jr. * NOAA National Climatic Data Center, Asheville, North Carolina 1. Introduction The Intergovernmental Panel
Indices and Indicators for Drought Early Warning
 Indices and Indicators for Drought Early Warning ADRIAN TROTMAN CHIEF, APPLIED METEOROLOGY AND CLIMATOLOGY CARIBBEAN INSTITUTE FOR METEOROLOGY AND HYDROLOGY IN COLLABORATION WITH THE NATIONAL DROUGHT MITIGATION
NIDIS Intermountain West Drought Early Warning System February 12, 2019
 NIDIS Intermountain West Drought Early Warning System February 12, 2019 Precipitation The images above use daily precipitation statistics from NWS COOP, CoCoRaHS, and CoAgMet stations. From top to bottom,
Analysis of real-time prairie drought monitoring and forecasting system. Lei Wen and Charles A. Lin
 Analysis of real-time prairie drought monitoring and forecasting system Lei Wen and Charles A. Lin Back ground information A real-time drought monitoring and seasonal prediction system has been developed
Extremes Events in Climate Change Projections Jana Sillmann
 Extremes Events in Climate Change Projections Jana Sillmann Max Planck Institute for Meteorology International Max Planck Research School on Earth System Modeling Temperature distribution IPCC (2001) Outline
Internationally Coordinated Extremes Indices
 Internationally Coordinated Extremes Indices Thomas C. Peterson National Climatic Data Center/NESDIS/NOAA Asheville, NC USA July 2005 (With help from Albert Klein Tank The Netherlands) In the beginning...
The Impact of Weather Extreme Events on US Agriculture
 The Impact of Weather Extreme Events on US Agriculture Emanuele Massetti Georgia Institute of Technology, FEEM, CESIfo February 21, 2017 University of Georgia Athens, GA Overview Overview of recent work
Funding provided by NOAA Sectoral Applications Research Project MONITORING DROUGHT. Basic Climatology Colorado Climate Center
 Funding provided by NOAA Sectoral Applications Research Project MONITORING DROUGHT Basic Climatology Colorado Climate Center DEFINING DROUGHT First off, just what is drought? Define a tornado Define a
The U.S. Drought Monitor and tools from the National Drought Mitigation Center
 The U.S. Drought Monitor and tools from the National Drought Mitigation Center Brian Fuchs, Climatologist National Drought Mitigation Center School of Natural Resources University of Nebraska-Lincoln Winter
Climate Prediction Center National Centers for Environmental Prediction
 NOAA s Climate Prediction Center Climate Monitoring Tool Wassila M. Thiaw and CPC International Team Climate Prediction Center National Centers for Environmental Prediction CPC International Team Vadlamani
The U.S. Drought Monitor: Parameters, People, Process, Policy
 The U.S. Drought Monitor: Parameters, People, Process, Policy Mark Svoboda, Climatologist Monitoring Program Area Leader National Drought Mitigation Center School of Natural Resources University of Nebraska-Lincoln
Climates of NYS. Definitions. Climate Regions of NYS. Storm Tracks. Climate Controls 10/13/2011. Characteristics of NYS s Climates
 Definitions Climates of NYS Prof. Anthony Grande 2011 Weather and Climate Weather the state of the atmosphere at one point in time. The elements of weather are temperature, air pressure, wind and moisture.
COMPARISON OF DROUGHT INDICES AND SC DROUGHT ALERT PHASES
 COMPARISON OF DROUGHT INDICES AND SC DROUGHT ALERT PHASES Ekaterina Altman 1 AUTHORS : 1 Master of Environmental Resource Management Candidate, Environment and Sustainability Program, University of South
Improving Drought Forecasts: The Next Generation of Seasonal Outlooks
 Improving Drought Forecasts: The Next Generation of Seasonal Outlooks Douglas Le Comte, CPC Douglas.lecomte@noaa.gov Outline Review of how the current Drought Outlooks are made Sample experimental products
Definitions Weather and Climate Climates of NYS Weather Climate 2012 Characteristics of Climate Regions of NYS NYS s Climates 1.
 Definitions Climates of NYS Prof. Anthony Grande 2012 Weather and Climate Weather the state of the atmosphere at one point in time. The elements of weather are temperature, t air pressure, wind and moisture.
Climate Change Impacts Water Resources (Drought & Snow) Richard R. Heim Jr.
 Richard R. Heim Jr.") Climate Change Impacts Water Resources (Drought & Snow) Richard R. Heim Jr. NOAA / NESDIS / Climate Monitoring Branch Asheville, North Carolina National Association of Clean Water Agencies Web Seminar,
Climate Change Impacts Water Resources (Drought & Snow) Richard R. Heim Jr. NOAA / NESDIS / Climate Monitoring Branch Asheville, North Carolina National Association of Clean Water Agencies Web Seminar,
NIDIS Intermountain West Drought Early Warning System December 11, 2018
 NIDIS Drought and Water Assessment NIDIS Intermountain West Drought Early Warning System December 11, 2018 Precipitation The images above use daily precipitation statistics from NWS COOP, CoCoRaHS, and
NIDIS Intermountain West Drought Early Warning System May 23, 2017
 NIDIS Drought and Water Assessment NIDIS Intermountain West Drought Early Warning System May 23, 2017 Precipitation The images above use daily precipitation statistics from NWS COOP, CoCoRaHS, and CoAgMet
The U.S. Drought Monitor: A Composite Indicator Approach
 The U.S. Drought Monitor: A Composite Indicator Approach Mark Svoboda, Climatologist Monitoring Program Area Leader National Drought Mitigation Center University of Nebraska-Lincoln NWS IN Climate Services
Fire Weather Monitoring and Predictability in the Southeast
 Fire Weather Monitoring and Predictability in the Southeast Corey Davis October 9, 2014 Photo: Pains Bay fire in 2011 (courtesy Donnie Harris, NCFWS) Outline Fire risk monitoring Fire risk climatology
State of the Climate for the Central Great Plains. Johannes Feddema Department of Geography University of Kansas
 State of the Climate for the Central Great Plains Johannes Feddema Department of Geography University of Kansas Adapting to a Changing Climate on the Central Great Plains Conference Kansas State University,
Observed Climate Variability and Change: Evidence and Issues Related to Uncertainty
 Observed Climate Variability and Change: Evidence and Issues Related to Uncertainty David R. Easterling National Climatic Data Center Asheville, North Carolina Overview Some examples of observed climate
NIDIS Intermountain West Drought Early Warning System December 30, 2018
 1/2/2019 NIDIS Drought and Water Assessment NIDIS Intermountain West Drought Early Warning System December 30, 2018 Precipitation The images above use daily precipitation statistics from NWS COOP, CoCoRaHS,
Historical Drought Analysis for: East Central Oklahoma, Climate Division 6
 Historical Drought Analysis for: East Central Oklahoma, Climate Division 6 Irenea Lodangco, Rachel Riley & Gina Fujan University of Oklahoma Prepared by the Southern Climate Impacts Planning Program November
NIDIS Intermountain West Regional Drought Early Warning System February 7, 2017
 NIDIS Drought and Water Assessment NIDIS Intermountain West Regional Drought Early Warning System February 7, 2017 Precipitation The images above use daily precipitation statistics from NWS COOP, CoCoRaHS,
NIDIS Intermountain West Drought Early Warning System July 18, 2017
 NIDIS Drought and Water Assessment NIDIS Intermountain West Drought Early Warning System July 18, 2017 Precipitation The images above use daily precipitation statistics from NWS COOP, CoCoRaHS, and CoAgMet
NIDIS Intermountain West Drought Early Warning System January 15, 2019
 NIDIS Drought and Water Assessment NIDIS Intermountain West Drought Early Warning System January 15, 2019 Precipitation The images above use daily precipitation statistics from NWS COOP, CoCoRaHS, and
Local Climatological Data Summary Sparta, Illinois
 SWS Miscellaneous Publication 98-25 STATE OF ILLINOIS DEPARTMENT OF NATURAL RESOURCES Local Climatological Data Summary Sparta, Illinois 1893-1995 Audrey A. Bryan and Wayne Wendland Illinois State Water
Local Ctimatotogical Data Summary White Hall, Illinois
 SWS Miscellaneous Publication 98-5 STATE OF ILLINOIS DEPARTMENT OF ENERGY AND NATURAL RESOURCES Local Ctimatotogical Data Summary White Hall, Illinois 1901-1990 by Audrey A. Bryan and Wayne Armstrong Illinois
NIDIS Intermountain West Drought Early Warning System April 16, 2019
 NIDIS Intermountain West Drought Early Warning System April 16, 2019 Precipitation The images above use daily precipitation statistics from NWS COOP, CoCoRaHS, and CoAgMet stations. From top to bottom,
International Desks: African Training Desk and Projects
 The Climate Prediction Center International Desks: African Training Desk and Projects Wassila M. Thiaw Team Leader Climate Prediction Center National Centers for Environmental Predictions 1 African Desk
Seasonal prediction of extreme events
 Seasonal prediction of extreme events C. Prodhomme, F. Doblas-Reyes MedCOF training, 29 October 2015, Madrid Climate Forecasting Unit Outline: Why focusing on extreme events? Extremeness metric Soil influence
Climate Change Indices By: I Putu Santikayasa
 Climate Change Indices By: I Putu Santikayasa Climate Change and Water Resources CE74.9002 Water Engineering and Management (WEM) School of Engineering and Technology (SET) Asian institute of Technology
Historical Drought Analysis for: Southwest Oklahoma, Climate Division 7
 Historical Drought Analysis for: Southwest Oklahoma, Climate Division 7 Irenea Lodangco, Rachel Riley & Gina Fujan University of Oklahoma Prepared by the Southern Climate Impacts Planning Program November
NIDIS Intermountain West Drought Early Warning System January 16, 2018
 NIDIS Drought and Water Assessment NIDIS Intermountain West Drought Early Warning System January 16, 2018 Precipitation The images above use daily precipitation statistics from NWS COOP, CoCoRaHS, and
Historical Drought Analysis for: Oklahoma Panhandle, Climate Division 8
 Historical Drought Analysis for: Oklahoma Panhandle, Climate Division 8 Irenea Lodangco, Rachel Riley & Gina Fujan University of Oklahoma Prepared by the Southern Climate Impacts Planning Program, November
NIDIS Intermountain West Drought Early Warning System March 26, 2019
 NIDIS Intermountain West Drought Early Warning System March 26, 2019 The images above use daily precipitation statistics from NWS COOP, CoCoRaHS, and CoAgMet stations. From top to bottom, and left to right:
SEPTEMBER 2013 REVIEW
 Monthly Long Range Weather Commentary Issued: October 21, 2013 Steven A. Root, CCM, President/CEO sroot@weatherbank.com SEPTEMBER 2013 REVIEW Climate Highlights The Month in Review The average temperature
NIDIS Intermountain West Drought Early Warning System December 18, 2018
 NIDIS Intermountain West Drought Early Warning System December 18, 2018 Precipitation The images above use daily precipitation statistics from NWS COOP, CoCoRaHS, and CoAgMet stations. From top to bottom,
Monthly probabilistic drought forecasting using the ECMWF Ensemble system
 Monthly probabilistic drought forecasting using the ECMWF Ensemble system Christophe Lavaysse(1) J. Vogt(1), F. Pappenberger(2) and P. Barbosa(1) (1) European Commission (JRC-IES), Ispra Italy (2) ECMWF,
NIDIS Intermountain West Drought Early Warning System November 13, 2018
 NIDIS Intermountain West Drought Early Warning System November 13, 2018 Precipitation The images above use daily precipitation statistics from NWS COOP, CoCoRaHS, and CoAgMet stations. From top to bottom,
NIDIS Intermountain West Drought Early Warning System February 6, 2018
 NIDIS Intermountain West Drought Early Warning System February 6, 2018 Precipitation The images above use daily precipitation statistics from NWS COOP, CoCoRaHS, and CoAgMet stations. From top to bottom,
Understanding Weather and Climate Risk. Matthew Perry Sharing an Uncertain World Conference The Geological Society, 13 July 2017
 Understanding Weather and Climate Risk Matthew Perry Sharing an Uncertain World Conference The Geological Society, 13 July 2017 What is risk in a weather and climate context? Hazard: something with the
Climate Impacts to Southwest Water Sector. Dr. Dave DuBois New Mexico State Climatologist
 Climate Impacts to Southwest Water Sector Dr. Dave DuBois New Mexico State Climatologist Presented at EPA Extreme Events and Climate Adaptation Planning Workshop June 3, 2015 Water Year Precip. % of Average
CoCoRaHS and the Drought Monitor (Help us help you!) Colorado Climate Center
 Colorado Climate Center") CoCoRaHS and the Drought Monitor (Help us help you!) Colorado Climate Center Anybody bring a rain gauge?! A sight for sore eyes The Community Collaborative Rain, Hail, and Snow (CoCoRaHS) networks is a
CoCoRaHS and the Drought Monitor (Help us help you!) Colorado Climate Center Anybody bring a rain gauge?! A sight for sore eyes The Community Collaborative Rain, Hail, and Snow (CoCoRaHS) networks is a
Precipitation. Standardized Precipitation Index. NIDIS Intermountain West Regional Drought Early Warning System December 6, 2016
 12/9/2016 NIDIS Drought and Water Assessment NIDIS Intermountain West Regional Drought Early Warning System December 6, 2016 Precipitation The images above use daily precipitation statistics from NWS COOP,
NIDIS Intermountain West Drought Early Warning System April 18, 2017
 1 of 11 4/18/2017 3:42 PM Precipitation NIDIS Intermountain West Drought Early Warning System April 18, 2017 The images above use daily precipitation statistics from NWS COOP, CoCoRaHS, and CoAgMet stations.
DROUGHT, HEAVY PRECIPITATION AND CLIMATE. Ronald Stewart University of Manitoba
 DROUGHT, HEAVY PRECIPITATION AND CLIMATE Ronald Stewart University of Manitoba 2000-2009 TOP WEATHER STORIES 1.Vanishing Arctic ice in 2007. 2. B.C.'s year of disastrous weather -- fires, floods and freezes
Monthly Long Range Weather Commentary Issued: APRIL 18, 2017 Steven A. Root, CCM, Chief Analytics Officer, Sr. VP,
 Monthly Long Range Weather Commentary Issued: APRIL 18, 2017 Steven A. Root, CCM, Chief Analytics Officer, Sr. VP, sroot@weatherbank.com MARCH 2017 Climate Highlights The Month in Review The average contiguous
Michael B. Ek 1, Youlong Xia 1,2, Jesse Meng 1,2, and Jiarui Dong 1,2
 Michael B. Ek 1, Youlong Xia 1,2, Jesse Meng 1,2, and Jiarui Dong 1,2 1 Land-Hydrology Team Environmental Modeling Center (EMC) National Centers for Environmental Prediction (NCEP) National Weather Service
Regional Drought Decision Support System (RDDSS) Project Update and Product Concepts
 Project Update and Product Concepts") Regional Drought Decision Support System (RDDSS) Project Update and Product Concepts Part of the Red River Basin Decision Information Network (RRBDIN) NEXT-GEN RRBDIN Decision Support for the Red River
Regional Drought Decision Support System (RDDSS) Project Update and Product Concepts Part of the Red River Basin Decision Information Network (RRBDIN) NEXT-GEN RRBDIN Decision Support for the Red River
Precipitation. Standardized Precipitation Index. NIDIS Intermountain West Regional Drought Early Warning System January 3, 2017
 1/3/2017 NIDIS Drought and Water Assessment NIDIS Intermountain West Regional Drought Early Warning System January 3, 2017 Precipitation The images above use daily precipitation statistics from NWS COOP,
Ashraf S. Zakey The Egyptian Meteorological Autority
 Ashraf S. Zakey The Egyptian Meteorological Autority A new inter-regional climate outlook forum for the Mediterranean Region. Development and dissemination of a consensus-based seasonal climate outlook.
The use of VIC soil moisture in drought monitoring and forecasting in Canada and China. Lei Wen 1, Charles A. Lin 1,2, Zhiyong Wu 3, Yufei Zhu 2
 The use of VIC soil moisture in drought monitoring and forecasting in Canada and China Lei Wen 1, Charles A. Lin 1,2, Zhiyong Wu 3, Yufei Zhu 2 1 2 3 VIC prairie/china soil moisture modeling three soil
NWSEO CALLS FOR NATIONAL CLIMATE SERVICE TO BE MADE PART OF THE NATIONAL WEATHER SERVICE
 APRIL 2009 NWSEO CALLS FOR NATIONAL CLIMATE SERVICE TO BE MADE PART OF THE NATIONAL WEATHER SERVICE At its recent winter meeting, the NWSEO National Council decided to urge the Administration and Congress
USDA s Operational GIS & related processes for International Weather & Crop Assessements
 USDA s Operational GIS & related processes for International Weather & Crop Assessements International Workshop on Agromet and GIS Applications for Agricultural Decision Making Jeju, South Korea December
Secular Trends of Precipitation Amount, Frequency, and Intensity in the United States
 Secular Trends of Precipitation Amount, Frequency, and Intensity in the United States Thomas R. Karl and Richard W. Knight NOAA/NESDIS/National Climatic Data Center, Asheville, North Carolina ABSTRACT
Impacts of Changes in Extreme Weather and Climate on Wild Plants and Animals. Camille Parmesan Integrative Biology University of Texas at Austin
 Impacts of Changes in Extreme Weather and Climate on Wild Plants and Animals Camille Parmesan Integrative Biology University of Texas at Austin Species Level: Climate extremes determine species distributions
NIDIS Intermountain West Drought Early Warning System August 8, 2017
 NIDIS Drought and Water Assessment 8/8/17, 4:43 PM NIDIS Intermountain West Drought Early Warning System August 8, 2017 Precipitation The images above use daily precipitation statistics from NWS COOP,
4B.8 ACCESSING GEOGRAPHIC INFORMATION SERVICES AND VISUALIZATION PRODUCTS AT NOAA S NATIONAL CLIMATIC DATA CENTER
 4B.8 ACCESSING GEOGRAPHIC INFORMATION SERVICES AND VISUALIZATION PRODUCTS AT NOAA S NATIONAL CLIMATIC DATA CENTER Rich Baldwin *, Steve Ansari, and Neal Lott NOAA National Climatic Data Center, Asheville,
NIDIS Intermountain West Drought Early Warning System January 22, 2019
 NIDIS Drought and Water Assessment NIDIS Intermountain West Drought Early Warning System January 22, 2019 Precipitation The images above use daily precipitation statistics from NWS COOP, CoCoRaHS, and
Historical Drought Analysis for: Northeast Oklahoma, Climate Division 3
 Historical Drought Analysis for: Northeast Oklahoma, Climate Division 3 Irenea Lodangco, Rachel Riley & Gina Fujan University of Oklahoma Prepared by the Southern Climate Impacts Planning Program November
Chiang Rai Province CC Threat overview AAS1109 Mekong ARCC
 Chiang Rai Province CC Threat overview AAS1109 Mekong ARCC This threat overview relies on projections of future climate change in the Mekong Basin for the period 2045-2069 compared to a baseline of 1980-2005.
The Climate of Bryan County
 The Climate of Bryan County Bryan County is part of the Crosstimbers throughout most of the county. The extreme eastern portions of Bryan County are part of the Cypress Swamp and Forest. Average annual
Appendix 1: UK climate projections
 Appendix 1: UK climate projections The UK Climate Projections 2009 provide the most up-to-date estimates of how the climate may change over the next 100 years. They are an invaluable source of information
Earth s Atmosphere. U.S. and Global Temperature. Drought. Heat Waves. Exosphere. Thermosphere. Mesosphere. Stratosphere. Troposphere. Shuttle.
 Weather and Earth s Atmosphere Exosphere Mesosphere Thermosphere Shuttle Aurora Meteors Stratosphere Weather balloon Troposphere Mount Everest Source: NOAA, 29 1 2 U.S. and Global Temperature Heat Waves
Chapter 12 Monitoring Drought Using the Standardized Precipitation Index
 University of Nebraska - Lincoln DigitalCommons@University of Nebraska - Lincoln Drought Mitigation Center Faculty Publications Drought -- National Drought Mitigation Center 2000 Chapter 12 Monitoring
GIS Tools, Data, & Methods in the Weekly US Drought Monitor
 GIS Tools, Data, & Methods in the Weekly US Drought Monitor International Workshop on Agromet and GIS Applications for Agricultural Decision Making Jeju, South Korea December 5, 2016 Eric Luebehusen USDA/OCE/WAOB
The Climate of Grady County
 The Climate of Grady County Grady County is part of the Central Great Plains, encompassing some of the best agricultural land in Oklahoma. Average annual precipitation ranges from about 33 inches in northern
Operational MRCC Tools Useful and Usable by the National Weather Service
 Operational MRCC Tools Useful and Usable by the National Weather Service Vegetation Impact Program (VIP): Frost / Freeze Project Beth Hall Accumulated Winter Season Severity Index (AWSSI) Steve Hilberg
Climate Prediction Center Research Interests/Needs
 Climate Prediction Center Research Interests/Needs 1 Outline Operational Prediction Branch research needs Operational Monitoring Branch research needs New experimental products at CPC Background on CPC
Climatography of the United States No
 No. 2 1971-2 Asheville, North Carolina 2881 COOP ID: 42713 Climate Division: CA 7 NWS Call Sign: Elevation: -3 Feet Lat: 32 Month (1) Min (2) Month(1) Extremes Lowest (2) Temperature ( F) Lowest Month(1)
Climatography of the United States No
 No. 2 1971-2 Asheville, North Carolina 2881 COOP ID: 46175 Climate Division: CA 6 NWS Call Sign: 3L3 Elevation: 1 Feet Lat: 33 Month (1) Min (2) Month(1) Extremes Lowest (2) Temperature ( F) Lowest Month(1)
NIDIS Intermountain West Drought Early Warning System May 1, 2018
 NIDIS Intermountain West Drought Early Warning System May 1, 2018 Precipitation The images above use daily precipitation statistics from NWS COOP, CoCoRaHS, and CoAgMet stations. From top to bottom, and
MONITORING AND THE RESEARCH ON METEOROLOGICAL DROUGHT IN CROATIA
 MONITORING AND THE RESEARCH ON METEOROLOGICAL DROUGHT IN CROATIA K. Cindrić Kalin, I. Güttler, L. Kalin, D. Mihajlović, T. Stilinović Meteorological and Hydrological Service cindric@cirus.dhz.hr 1 overview
The benefits and developments in ensemble wind forecasting
 The benefits and developments in ensemble wind forecasting Erik Andersson Slide 1 ECMWF European Centre for Medium-Range Weather Forecasts Slide 1 ECMWF s global forecasting system High resolution forecast
Operational Monsoon Monitoring at NCEP
 Operational Monsoon Monitoring at NCEP Wassila M. Thiaw Climate Prediction Center National Centers for Environmental Predictions Operational Monsoon Monitoring at NCEP Wassila M. Thiaw Climate Prediction
Historical Drought Analysis for: Central Oklahoma, Climate Division 5
 Historical Drought Analysis for: Central Oklahoma, Climate Division 5 Irenea Lodangco, Rachel Riley & Gina Fujan University of Oklahoma Prepared by the Southern Climate Impacts Planning Program November
Deke Arndt, Chief, Climate Monitoring Branch, NOAA s National Climatic Data Center
 Thomas R. Karl, L.H.D., Director, NOAA s National Climatic Data Center, and Chair of the Subcommittee on Global Change Research Peter Thorne, PhD, Senior Scientist, Cooperative Institute for Climate and
138 ANALYSIS OF FREEZING RAIN PATTERNS IN THE SOUTH CENTRAL UNITED STATES: Jessica Blunden* STG, Inc., Asheville, North Carolina
 138 ANALYSIS OF FREEZING RAIN PATTERNS IN THE SOUTH CENTRAL UNITED STATES: 1979 2009 Jessica Blunden* STG, Inc., Asheville, North Carolina Derek S. Arndt NOAA National Climatic Data Center, Asheville,
Cape Verde. General Climate. Recent Climate. UNDP Climate Change Country Profiles. Temperature. Precipitation
 UNDP Climate Change Country Profiles C. McSweeney 1, M. New 1,2 and G. Lizcano 1 1. School of Geography and Environment, University of Oxford. 2. Tyndall Centre for Climate Change Research http://country-profiles.geog.ox.ac.uk
Hydroclimatic Variability and Change: Issues in the Intermountain West
 Hydroclimatic Variability and Change: Issues in the Intermountain West Kelly Redmond Western Regional Climate Center Desert Research Institute Reno NV Collaborative and Interdisciplinary Climate Change
LOCAL CLIMATOLOGICAL DATA FOR FREEPORT ILLINOIS
 Climatological Summary: LOCAL CLIMATOLOGICAL DATA FOR FREEPORT ILLINOIS 1905-1990 Freeport (Stephenson County) has a temperate continental climate, dominated by maritime tropical air from the Gulf of Mexico
Extremes analysis: the. ETCCDI twopronged
 Manola Brunet University Rovira i Virgili, Tarragona, Catalonia Extremes analysis: the Title ETCCDI twopronged approach 5 December 2017 Fourth Session of the ETCCDI, Victoria, Feb 2011 The role of the