Climate Change Indices By: I Putu Santikayasa
|
|
|
- Nigel Bailey
- 6 years ago
- Views:
Transcription
1 Climate Change Indices By: I Putu Santikayasa Climate Change and Water Resources CE Water Engineering and Management (WEM) School of Engineering and Technology (SET) Asian institute of Technology (AIT)
2 Introduction A main objective of constructing climate extremes indices is to use for climate change monitoring and detection studies Change in the frequency or severity of extreme climate events would have profound impacts on nature and society Very important to analyze extreme events Need daily data very difficult task
3 Introduction Need to develop, calculate, and analysis a suite of indices so that individuals, countries, and regions can calculate the indices in exactly the same way such that their analyses will fit seamlessly into the global picture Furthermore, need toolkits including software, documentation, and other material to guide the calculation and use of climate change detection indices and climate data homogenization, improvement of global coverage and assessment of indices.
4 Climate Indices Climate indices is used to monitor climate change as and when is happens. The indices based on daily temperature and precipitation as data input Some of them based on thresholds that are relevant on particular application 40 indices was approved 27 indices consider to be core indices
5 Climate Indices ID FD0 Indicator name Frost days Definitions Annual count when TN(daily minimum)<0ºc UNITS Days SU25 ID0 Summer days Ice days Annual count when TX(daily maximum)>25ºc Days Annual count when TX(daily maximum)<0ºc Days TR20 Tropical nights Annual count when TN(daily minimum)>20ºc Days
6 Climate Indices GSL Growing season Length Annual (1st Jan to 31 st Dec in NH, 1 st July to 30 th June in SH) count between first span of at least 6 days with TG>5ºC and first span after July 1 (January 1 in SH) of 6 days with TG<5ºC Days TXx TNx TXn TNn Max Tmax Max Tmin Min Tmax Min Tmin Monthly maximum value of daily maximum temp Monthly maximum value of daily minimum temp Monthly minimum value of daily maximum temp Monthly minimum value of daily minimum temp ºC ºC ºC ºC
7 Climate Indices TN10p Cool nights Percentage of days when TN<10th percentile Days TX10p Cool days Percentage of days when TX<10th percentile Days TN90p Warm nights Percentage of days when TN>90th percentile Days TX90p Warm days Percentage of days when TX>90th percentile Days WSDI Warm spell duration indicator Annual count of days with at least 6 consecutive days when TX>90th percentile Days
8 Climate Indices CSDI Cold spell duration indicator Annual count of days with at least 6 consecutive days when TN<10th percentile Days DTR Diurnal temperature range Monthly mean difference between TX and TN ºC RX1day Max 1-day precipitation amount Monthly maximum 1-day precipitation Mm Rx5day Max 5-day precipitation amount Monthly maximum consecutive 5-day precipitation Mm SDII Simple daily intensity index Annual total precipitation divided by the number of wet days (defined as PRCP>=1.0mm) in the year Mm/d ay
9 Climate Indices R10 Number of heavy precipitation days Annual count of days when PRCP>=10mm Days R20 Number of very heavy precipitation days Annual count of days when PRCP>=20mm Days Rnn Number of days above nn mm Annual count of days when PRCP>=nn mm, nn is user defined threshold Days CDD Consecutive dry days Maximum number of consecutive days with RR<1mm Days CWD Consecutive wet days Maximum number of consecutive days with RR>=1mm Days
10 Climate Indices Very wet days R95p Annual total PRCP when RR>95 th percentile Mm Extremely wet days R99p Annual total PRCP when RR>99 th percentile mm PRCPTOT Annual total wetday precipitation Annual total PRCP in wet days (RR>=1mm) mm
11 Climdex Climdex : Microsoft Excel based program that provides an easy-to-use software package for the calculation of indices of climate extremes for monitoring and detecting climate change Developed by Byron Gleason at the National Climate Data Centre (NCDC) of NOAA, and has been used in CCl/CLIVAR workshops on climate indices since 2001


12 Climdex v.s RClimdex Climdex Ms. Excel platform Running under Window Difficult to fix the bug RClimdex R platform Free Powerfull for statistical analysis Running under window and unix Relatively easy to fix the bug
13 Rclimdex ver. 1.3 Used to calculate climate change indices 27 core indices recommended by the CCl/CLIVAR Expert Team for Climate Change Detection Monitoring and Indices (ETCCDMI) Developed under R 1.84 or higher Limitation: Simple data quality control Not include Data homogenization
14 Please Remember!!: 1. Not all indices are calculated on a monthly basis. 2. Monthly indices are calculated if no more than 3 days are missing in a month, while annual values are calculated if no more than 15 days are missing in a year. 3. No annual value will be calculated if any one month s data are missing. 4. For threshold indices, a threshold is calculated if at least 70% of data are present. 5. For spell duration indicators (marked with a *), a spell can continue into the next year and is counted against the year in which the spell ends e.g. a cold spell (CSDI) in the Northern Hemisphere beginning on 31 st December 2000 and ending on 6 th January 2001 is counted towards the total number of cold spells in 2001

15 Software and user manual :
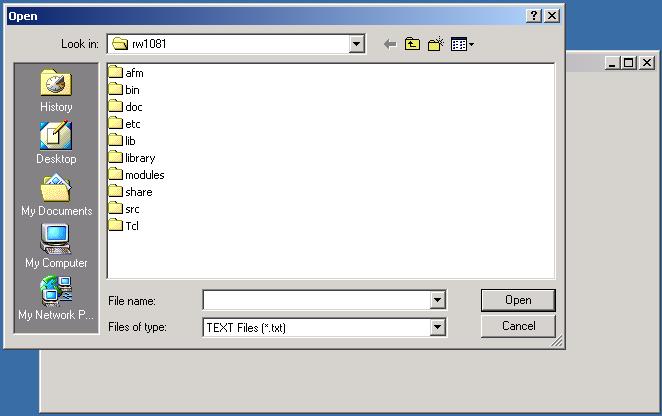
16 How to use RClimdex R software is required to run Rclimdex Connect to R Project website: Download * Install the program *For window user : download window setup For unix user: download proper precompiled binaries (source code may need to be downloaded and compiled)
17 How to use RClimdex Data format: 1. ASCII text file 2. Columns as following sequences: Year, Month, Day, PRCP, TMAX, TMIN. (NOTE: PRCP units = millimeters and Temperature units= degrees Celsius) 3. The format as described above must be space delimited 4. Missing data must be coded as -99.9; data records must be in calendar date order. Missing dates allowed.
18 How to use RClimdex Sample data: Year Day TMax (oc) TMin (oc) Month Precipitation (mm)


19 How to use RClimdex 1. Load RClimdex 2. Load Data->Run QC 3. Indices Calculation
20 Load RClimdex Load Data->Run QC Indices Calculation 1. R consol prompt > Type: source ( rclimdex path ) source("c:\\climateindices\\rclimdex.r") source ( ) 2. File > Source R code
21 Load RClimdex Load Data->Run QC Indices Calculation Prerequisite for indices calculations Replace all missing values (currently coded as ) into an internal format that R recognizes Replace all unreasonable values into NA
22 What will be checked? Daily precipitation amounts less than zero Daily maximum temperature less than daily minimum temperature QC also identifies outliers in daily maximum and minimum temperature The outliers are daily values outside a region defined by the user Unreasonable values are identified automatically but identification of outliers in temperature data requires input from the user
23 Data QC files tempqc.csv unreasonable temperature prcpqc.csv unreasonable precipitation tepstdqc.csv all possible outliers in daily temperature with the dates on which those outliers occur indcal.csv QC d data and will be used for the indices calculation
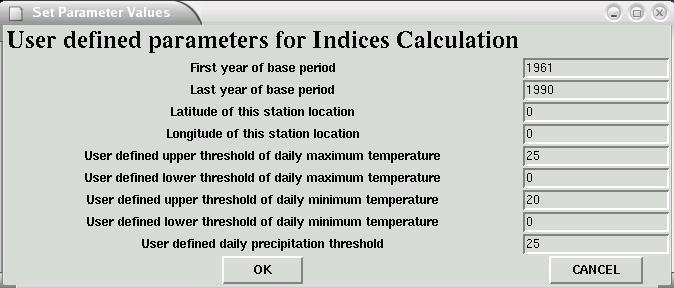
24 Load RClimdex Load Data->Run QC Indices Calculation RClimDex is capable of computing all 27 core indices Parameter input: First and last year of base period for the threshold calculation Station Latitude (SH negative) daily precipitation threshold, P (in mm) Upper and Limit of Day High Upper and Limit of Day Low
25 Load RClimdex Load Data->Run QC Indices Calculation Selection of indices Result will be stored as excel file and jpeg format Jpeg format: trends computed by linear least square (solid line) and locally weighted linear regression (dashed line)
26 Class exercise
27 Case study: Analyze climate change indices by using data from your country Due date: 29 th March 2012 Submitted to Dr. Sangam

28 Thank you Have a nice day
Foralps 2nd conference. Assessment of Lombardy's climate in the last century: data analysis, methodologies and indices
 Alessia Marchetti, Angela Sulis Assessment of Lombardy's climate in the last century: data Contents The dataset The daily indices analysis Some preliminary monthly data indices analysis Some key points
RClimDex (1.0) User Manual. Xuebin Zhang and Feng Yang. Climate Research Branch Environment Canada Downsview, Ontario Canada. September 10, 2004
 User Manual. Xuebin Zhang and Feng Yang. Climate Research Branch Environment Canada Downsview, Ontario Canada. September 10, 2004") RClimDex (1.0) User Manual By Xuebin Zhang and Feng Yang Climate Research Branch Environment Canada Downsview, Ontario Canada September 10, 2004 Acknowledgement The RClimDex is developed and maintained
RClimDex (1.0) User Manual By Xuebin Zhang and Feng Yang Climate Research Branch Environment Canada Downsview, Ontario Canada September 10, 2004 Acknowledgement The RClimDex is developed and maintained
Extremes analysis: the. ETCCDI twopronged
 Manola Brunet University Rovira i Virgili, Tarragona, Catalonia Extremes analysis: the Title ETCCDI twopronged approach 5 December 2017 Fourth Session of the ETCCDI, Victoria, Feb 2011 The role of the
CLIMATE CHANGE DETECTION WITH EXTREME WEATHER FACTORS CONCERNING ALGERIA
 European Scientific Journal June 15 edition vol.11, No.17 ISSN: 1857 7881 (Print) e - ISSN 1857-7431 CLIMATE CHANGE DETECTION WITH EXTREME WEATHER FACTORS CONCERNING ALGERIA L. Benaïchata K. Mederbal Ibn
Indices of Daily Temperature and Precipitation Extremes
 Indices of Daily Temperature and Precipitation Extremes TEMPERATURE INDICES A B C D E F G H I J K L N M O 2 ID or TXice Ice days or days without defrost No. days TX < 0 C Day count; fixed 3 FD or TNFD
2016 Irrigated Crop Production Update
 2016 Irrigated Crop Production Update Mapping Climate Trends and Weather Extremes Across Alberta for the Period 1950-2010 Stefan W. Kienzle Department of Geography University of Lethbridge, Alberta, Canada
Rainfall Pattern Modeling Report
 Rainfall Pattern Modeling Report Submitted to International Centre for Integrated Mountain Development (ICIMOD) Submitted by BUET-Japan Institute of Disaster Prevention and Urban Safety (BUET-JIDPUS);
FUTURE CHANGES IN EXTREME TEMPERATURE INDICES IN CLUJ-NAPOCA, ROMANIA
 FUTURE CHANGES IN EXTREME TEMPERATURE INDICES IN CLUJ-NAPOCA, ROMANIA A.F. CIUPERTEA, A. PITICAR, V. DJURDJEVIC, Adina-Eliza CROITORU, Blanka BARTOK ABSTRACT. Future changes in extreme temperature indices
MAPS OF CURRENTLY USED INDICATORS
 MAPS OF CURRENTLY USED INDICATORS A structured network for integration of climate knowledge into policy and territorial planning DELIVERABLE INFORMATION WP: Activity: WP Leader: Activity leader: Participating
TRENDS AND CHANGE IN CLIMATE OVER THE VOLTA RIVER BASIN
 TRENDS AND CHANGE IN CLIMATE OVER THE VOLTA RIVER BASIN VOLTRES PROJECT WORK PACKAGE 1a: CLIMATE KEY RESULTS E. Obuobie, H.E. Andersen, C. Asante-Sasu, M. Osei-owusu 11/9/217 OBJECTIVES Analyse long term
JOURNAL OF HYDROLOGY AND METEOROLOGY
 JOURNAL OF HYDROLOGY AND METEOROLOGY March 28 Volume 5, Number 1 CHIEF EDITOR Dr. Madan Lall Shrestha Academician Nepal Academy of Science & Technology E-mail: madanls@hotmail.com Reprints: TRENDS IN DAILY
Trends in extreme temperature and precipitation in Muscat, Oman
 Evolving Water Resources Systems: Understanding, Predicting and Managing Water Society Interactions Proceedings of ICWRS214,Bologna, Italy, June 214 (IAHS Publ. 364, 214). 57 Trends in extreme temperature
Internationally Coordinated Extremes Indices
 Internationally Coordinated Extremes Indices Thomas C. Peterson National Climatic Data Center/NESDIS/NOAA Asheville, NC USA July 2005 (With help from Albert Klein Tank The Netherlands) In the beginning...
For more than a decade, the World Meteorological
 Global Land-Based Datasets for Monitoring Climatic Extremes by M.G. Donat, L.V. Alexander, H. Yang, I. Durre, R. Vose, J. Caesar For more than a decade, the World Meteorological Organization (WMO) Commission
Indices for extreme events in projections of anthropogenic climate change
 Climatic Change (2008) 86:83 104 DOI 10.1007/s10584-007-9308-6 Indices for extreme events in projections of anthropogenic climate change J. Sillmann & E. Roeckner Received: 19 July 2006 / Accepted: 23
Decadal Changes of Rainfall and Temperature Extremes over the different Agro Economical Zones (AEZ) of Bangladesh
 of Bangladesh") Decadal Changes of Rainfall and Temperature Extremes over the different Agro Economical Zones (AEZ) of Bangladesh Professor A.K.M. Saiful Islam Md. Alfi Hasan Institute of Water and Flood Management Bangladesh
Decadal Changes of Rainfall and Temperature Extremes over the different Agro Economical Zones (AEZ) of Bangladesh Professor A.K.M. Saiful Islam Md. Alfi Hasan Institute of Water and Flood Management Bangladesh
Drought and Climate Extremes Indices for the North American Drought Monitor and North America Climate Extremes Monitoring System. Richard R. Heim Jr.
 Drought and Climate Extremes Indices for the North American Drought Monitor and North America Climate Extremes Monitoring System Richard R. Heim Jr. NOAA/NESDIS/National Climatic Data Center Asheville,
Extreme Rainfall Indices for Tropical Monsoon Countries in Southeast Asia #
 Civil Engineering Dimension, Vol. 16, No. 2, September 2014, 112-116 ISSN 1410-9530 print / ISSN 1979-570X online CED 2014, 16(2), DOI: 10.9744/CED.16.2.112-116 Extreme Rainfall Indices for Tropical Monsoon
Trends in temperature and rainfall extremes during recent years at different stations of Himachal Pradesh
 Vol. Journal 19, No. of Agrometeorology 1 19 (1) : 51-55 (March 2017) PRASAD et al 51 Trends in temperature and rainfall extremes during recent years at different stations of Himachal Pradesh RAJENDRA
Study of Changes in Climate Parameters at Regional Level: Indian Scenarios
 Study of Changes in Climate Parameters at Regional Level: Indian Scenarios S K Dash Centre for Atmospheric Sciences Indian Institute of Technology Delhi Climate Change and Animal Populations - The golden
NOAA s Climate Normals. Pre-release Webcast presented by NOAA s National Climatic Data Center June 13, 2011
 NOAA s 1981-2010 Climate Normals Pre-release Webcast presented by NOAA s National Climatic Data Center June 13, 2011 Takeaway Messages Most Normals will be available July 1 via FTP NWS Normals to be loaded
Extremes Events in Climate Change Projections Jana Sillmann
 Extremes Events in Climate Change Projections Jana Sillmann Max Planck Institute for Meteorology International Max Planck Research School on Earth System Modeling Temperature distribution IPCC (2001) Outline
Worksheet: The Climate in Numbers and Graphs
 Worksheet: The Climate in Numbers and Graphs Purpose of this activity You will determine the climatic conditions of a city using a graphical tool called a climate chart. It represents the long-term climatic
PREDICTING CHANGE OF FUTURE CLIMATIC EXTREMES OVER BANGLADESH IN HIGH RESOLUTION CLIMATE CHANGE SCENARIOS
 PREDICTING CHANGE OF FUTURE CLIMATIC EXTREMES OVER BANGLADESH IN HIGH RESOLUTION CLIMATE CHANGE SCENARIOS Mohammad Alfi Hasan 1 *, A. K. M. Saiful Islam 2 and Bhaski Bhaskaran 3 1 Institute of Water and
ANNUAL TEMPERATURE AND PRECIPITATION TRENDS IN THE UNITED STATES MATTHEW STOKLOSA THESIS
 ANNUAL TEMPERATURE AND PRECIPITATION TRENDS IN THE UNITED STATES BY MATTHEW STOKLOSA THESIS Submitted in partial fulfillment of the requirements for the degree of Master of Science in Agricultural and
Spatial and Temporal Variations of Extreme Climate Events in Xinjiang, China during
 American Journal of Climate Change, 2016, 5, 360-372 Published Online September 2016 in SciRes. http://www.scirp.org/journal/ajcc http://dx.doi.org/10.4236/ajcc.2016.53027 Spatial and Temporal Variations
UPPLEMENT A COMPARISON OF THE EARLY TWENTY-FIRST CENTURY DROUGHT IN THE UNITED STATES TO THE 1930S AND 1950S DROUGHT EPISODES
 UPPLEMENT A COMPARISON OF THE EARLY TWENTY-FIRST CENTURY DROUGHT IN THE UNITED STATES TO THE 1930S AND 1950S DROUGHT EPISODES Richard R. Heim Jr. This document is a supplement to A Comparison of the Early
Impacts of Changes in Extreme Weather and Climate on Wild Plants and Animals. Camille Parmesan Integrative Biology University of Texas at Austin
 Impacts of Changes in Extreme Weather and Climate on Wild Plants and Animals Camille Parmesan Integrative Biology University of Texas at Austin Species Level: Climate extremes determine species distributions
Zambia. General Climate. Recent Climate Trends. UNDP Climate Change Country Profiles. Temperature. C. McSweeney 1, M. New 1,2 and G.
 UNDP Climate Change Country Profiles Zambia C. McSweeney 1, M. New 1,2 and G. Lizcano 1 1. School of Geography and Environment, University of Oxford. 2. Tyndall Centre for Climate Change Research http://country-profiles.geog.ox.ac.uk
Malawi. General Climate. UNDP Climate Change Country Profiles. C. McSweeney 1, M. New 1,2 and G. Lizcano 1
 UNDP Climate Change Country Profiles Malawi C. McSweeney 1, M. New 1,2 and G. Lizcano 1 1. School of Geography and Environment, University of Oxford. 2. Tyndall Centre for Climate Change Research http://country-profiles.geog.ox.ac.uk
1. Introduction. Volume 6 Issue 9, September Licensed Under Creative Commons Attribution CC BY
 heavier monsoons and that the melting of Himalayan glaciers will cause higher river flows and severe floods. characteristic of Bangladesh. With the exception of the relatively dry western region of Rajshahi,
Mozambique. General Climate. UNDP Climate Change Country Profiles. C. McSweeney 1, M. New 1,2 and G. Lizcano 1
 UNDP Climate Change Country Profiles Mozambique C. McSweeney 1, M. New 1,2 and G. Lizcano 1 1. School of Geography and Environment, University of Oxford. 2.Tyndall Centre for Climate Change Research http://country-profiles.geog.ox.ac.uk
Evidence of trends in daily climate extremes over Southern and West Africa. Submitted to Journal of Geophysical Research - Atmospheres, May 2005
 0 Evidence of trends in daily climate extremes over Southern and West Africa Submitted to Journal of Geophysical Research - Atmospheres, May 00 Mark New *, Bruce Hewitson, David B. Stephenson, Alois Tsiga,
Deliverable: D3.6. Description of the. final version of all gridded data sets of the climatology of the Carpathian Region
 Deliverable D3.6 Description of the final version of all gridded data sets of the climatology of the Carpathian Region Contract number: OJEU 2010/S 110 166082 Deliverable: D3.6 Author: Igor Antolovic,
Suriname. General Climate. Recent Climate Trends. UNDP Climate Change Country Profiles. Temperature. C. McSweeney 1, M. New 1,2 and G.
 UNDP Climate Change Country Profiles Suriname C. McSweeney 1, M. New 1,2 and G. Lizcano 1 1. School of Geography and Environment, University of Oxford. 2. Tyndall Centre for Climate Change Research http://country-profiles.geog.ox.ac.uk
RECENT CLIMATE CHANGE TRENDS
 3RD INTERNATIONAL CONFERENCE ON ECOHYDROLOGY, SOIL AND CLIMATE CHANGE, ECOHCC'14 RECENT CLIMATE CHANGE TRENDS OF EXTREME PRECIPITATION IN THE IBERIAN PENINSULA SOFIA BARTOLOMEU, MARIA JOÃO CARVALHO, MARTINHO
St Lucia. General Climate. Recent Climate Trends. UNDP Climate Change Country Profiles. Temperature. Precipitation
 UNDP Climate Change Country Profiles St Lucia C. McSweeney 1, M. New 1,2 and G. Lizcano 1 1. School of Geography and Environment, University of Oxford. 2. Tyndall Centre for Climate Change Research http://country-profiles.geog.ox.ac.uk
WEATHER AND CLIMATE COMPLETING THE WEATHER OBSERVATION PROJECT CAMERON DOUGLAS CRAIG
 WEATHER AND CLIMATE COMPLETING THE WEATHER OBSERVATION PROJECT CAMERON DOUGLAS CRAIG Introduction The Weather Observation Project is an important component of this course that gets you to look at real
Cuba. General Climate. Recent Climate Trends. UNDP Climate Change Country Profiles. Temperature. C. McSweeney 1, M. New 1,2 and G.
 UNDP Climate Change Country Profiles Cuba C. McSweeney 1, M. New 1,2 and G. Lizcano 1 1. School of Geography and Environment, University of Oxford. 2. Tyndall Centre for Climate Change Research http://country-profiles.geog.ox.ac.uk
National Climate Monitoring Products Fatima Driouech
 National Climate Monitoring Products Fatima Driouech WMO-CCl-OPACE-2 Co-chair (16th intersession) CCl-TECO, Geneva 11-12 April 2017 Climate monitoring : awareness increasing Canada Countries around the
Updated analyses of temperature and precipitation extreme indices since the beginning of the twentieth century: The HadEX2 dataset
 JOURNAL OF GEOPHYSICAL RESEARCH: ATMOSPHERES, VOL. 118, 2098 2118, doi:10.1002/jgrd.50150, 2013 Updated analyses of temperature and precipitation extreme indices since the beginning of the twentieth century:
Temporal and spatial trends in air temperature on the Island of Oahu, Hawaii
 INTERNATIONAL JOURNAL OF CLIMATOLOGY Int. J. Climatol. 33: 2816 2835 (2013) Published online 18 December 2012 in Wiley Online Library (wileyonlinelibrary.com) DOI: 10.1002/joc.3629 Temporal and spatial
NADM, NACEM, and Opportunities for Future Collaboration
 NADM, NACEM, and Opportunities for Future Collaboration Richard R. Heim Jr. NOAA/NESDIS/National Climatic Data Center Asheville, North Carolina, U.S.A. 4th Annual DRI Workshop 26-28 January 2009, Regina,
MONITORING AND THE RESEARCH ON METEOROLOGICAL DROUGHT IN CROATIA
 MONITORING AND THE RESEARCH ON METEOROLOGICAL DROUGHT IN CROATIA K. Cindrić Kalin, I. Güttler, L. Kalin, D. Mihajlović, T. Stilinović Meteorological and Hydrological Service cindric@cirus.dhz.hr 1 overview
Detection and Attribution of Climate Change. ... in Indices of Extremes?
 Detection and Attribution of Climate Change... in Indices of Extremes? Reiner Schnur Max Planck Institute for Meteorology MPI-M Workshop Climate Change Scenarios and Their Use for Impact Studies September
Name Period Date. Analyzing Climographs
 Name Period Date Analyzing Climographs Climographs: It is often helpful to plot two different types of data on the same graph. For example, a climograph is a single graph that charts both the average temperature
Cape Verde. General Climate. Recent Climate. UNDP Climate Change Country Profiles. Temperature. Precipitation
 UNDP Climate Change Country Profiles C. McSweeney 1, M. New 1,2 and G. Lizcano 1 1. School of Geography and Environment, University of Oxford. 2. Tyndall Centre for Climate Change Research http://country-profiles.geog.ox.ac.uk
Changes in Weather and Climate Extremes and Their Causes. Xuebin Zhang (CRD/ASTD) Francis Zwiers (PCIC)
 Francis Zwiers (PCIC)") www.ec.gc.ca Changes in Weather and Climate Extremes and Their Causes Xuebin Zhang (CRD/ASTD) Francis Zwiers (PCIC) Outline What do we mean by climate extremes Changes in extreme temperature and precipitation
www.ec.gc.ca Changes in Weather and Climate Extremes and Their Causes Xuebin Zhang (CRD/ASTD) Francis Zwiers (PCIC) Outline What do we mean by climate extremes Changes in extreme temperature and precipitation
Grenada. General Climate. Recent Climate Trends. UNDP Climate Change Country Profiles. Temperature. Precipitation
 UNDP Climate Change Country Profiles C. McSweeney 1, M. New 1,2 and G. Lizcano 1 1. School of Geography and Environment, University of Oxford. 2. Tyndall Centre for Climate Change Research http://country-profiles.geog.ox.ac.uk
Antigua and Barbuda. General Climate. Recent Climate Trends. UNDP Climate Change Country Profiles. Temperature
 UNDP Climate Change Country Profiles Antigua and Barbuda C. McSweeney 1, M. New 1,2 and G. Lizcano 1 1. School of Geography and Environment, University of Oxford. 2. Tyndall Centre for Climate Change Research
Recent Trends in Northern and Southern Hemispheric Cold and Warm Pockets
 Recent Trends in Northern and Southern Hemispheric Cold and Warm Pockets Abstract: Richard Grumm National Weather Service Office, State College, Pennsylvania and Anne Balogh The Pennsylvania State University
IMPACT OF URBANIZATION ON MEAN TEMPERATURE ANOMALIES AND CLIMATE INDICES IN TURKEY
 IMPACT OF URBANIZATION ON MEAN TEMPERATURE ANOMALIES AND CLIMATE INDICES IN TURKEY Serhat SENSOY 1, Mustafa COŞKUN 1, Ali Ümran KÖMÜŞCÜ 1, Mesut DEMİRCAN 1, Erdoğan BÖLÜK 1 Necla TÜRKOĞLU 2, İhsan ÇİÇEK
Homogenization of monthly and daily temperature and precipitation data in Sweden
 Homogenization of monthly and daily temperature and precipitation data in Sweden Erik Engström and Thomas Carlund Swedish Meteorological and Hydrological Institute EMS 6 September 2017 Digitalization of
Trends in Middle East climate extreme indices from 1950 to 2003
 JOURNAL OF GEOPHYSICAL RESEARCH, VOL. 110,, doi:10.1029/2005jd006181, 2005 Trends in Middle East climate extreme indices from 1950 to 2003 Xuebin Zhang, 1 Enric Aguilar, 2 Serhat Sensoy, 3 Hamlet Melkonyan,
Climate variability and the expected. Croatia
 Climate variability and the expected effects of climate change scenario in Croatia Krešo Pandžić Meteorological and Hydrological Service Croatia National roundtable Adaptation to climate change, Zagreb,
Investigating Factors that Influence Climate
 Investigating Factors that Influence Climate Description In this lesson* students investigate the climate of a particular latitude and longitude in North America by collecting real data from My NASA Data
What makes it difficult to predict extreme climate events in the long time scales?
 What makes it difficult to predict extreme climate events in the long time scales? Monirul Mirza Department of Physical and Environmental Sciences University of Toronto at Scarborough Email: monirul.mirza@utoronto.ca
Analysis of the Extreme Rainfall Indices over Bangladesh
 INTERNATIONAL CLIMATE CHANGE SYMPOSIUM-2015: Impacts of Extreme Atmospheric Events on Geo-surface in a Changing Climate Environmental Technology Section, Industrial technology Institute (ITI) 14th 15th
Local Ctimatotogical Data Summary White Hall, Illinois
 SWS Miscellaneous Publication 98-5 STATE OF ILLINOIS DEPARTMENT OF ENERGY AND NATURAL RESOURCES Local Ctimatotogical Data Summary White Hall, Illinois 1901-1990 by Audrey A. Bryan and Wayne Armstrong Illinois
Climate Extremes in the Canadian Columbia Basin: A Preliminary Assessment
 Climate Extremes in the Canadian Columbia Basin: A Preliminary Assessment 19 August 2013 Trevor Q. Murdock Stephen R. Sobie Climate extremes in the Canadian Columbia Basin Executive Summary... v Citation...
WeatherHawk Weather Station Protocol
 WeatherHawk Weather Station Protocol Purpose To log atmosphere data using a WeatherHawk TM weather station Overview A weather station is setup to measure and record atmospheric measurements at 15 minute
Lab Activity: Climate Variables
 Name: Date: Period: Water and Climate The Physical Setting: Earth Science Lab Activity: Climate Variables INTRODUCTION:! The state of the atmosphere continually changes over time in response to the uneven
Changes in daily extreme temperatures in the extra-carpathians regions of Romania
 INTERNATIONAL JOURNAL OF CLIMATOLOGY Int. J. Climatol. 33: 1987 2001 (2013) Published online 15 August 2012 in Wiley Online Library (wileyonlinelibrary.com) DOI: 10.1002/joc.3567 Changes in daily extreme
WEATHER NORMALIZATION METHODS AND ISSUES. Stuart McMenamin Mark Quan David Simons
 WEATHER NORMALIZATION METHODS AND ISSUES Stuart McMenamin Mark Quan David Simons Itron Forecasting Brown Bag September 17, 2013 Please Remember» Phones are Muted: In order to help this session run smoothly,
Changes of climate extremes in a typical arid zone: Observations and multimodel ensemble projections
 JOURNAL OF GEOPHYSICAL RESEARCH, VOL. 116,, doi:10.1029/2010jd015192, 2011 Changes of climate extremes in a typical arid zone: Observations and multimodel ensemble projections Tao Yang, 1,2 Xiaoyan Wang,
List of Exposure and Dose Metrics
 List of Exposure and Dose Metrics First approved by the TOAR Steering Committee on July 31, 2015, and revised on June 27, 2016 to add two additional metrics. Following is the list of exposure and dose
Weather Conditions during the 1992 Growing Season
 Weather Conditions during the 1992 Growing Season Item Type text; Article Authors Brown, P.; Russell, B. Publisher College of Agriculture, University of Arizona (Tucson, AZ) Journal Cotton: A College of
Supplement of Vegetation greenness and land carbon-flux anomalies associated with climate variations: a focus on the year 2015
 Supplement of Atmos. Chem. Phys., 17, 13903 13919, 2017 https://doi.org/10.5194/acp-17-13903-2017-supplement Author(s) 2017. This work is distributed under the Creative Commons Attribution 3.0 License.
Colorado State University, Fort Collins, CO Weather Station Monthly Summary Report
 Colorado State University, Fort Collins, CO Weather Station Monthly Summary Report Month: December Year: 2016 Temperature: Mean T max was 39.7 F which is 3.1 below the 1981-2010 normal for the month. This
Projection of climate change in Cyprus using a selection of regional climate models
 Projection of climate change in Cyprus using a selection of regional climate models C. Giannakopoulos, G. Lemesios, M. Petrakis, Th. Kopania, N. Roukounakis National Observatory of Athens, Athens, Greece
INFLUENCE OF THE AVERAGING PERIOD IN AIR TEMPERATURE MEASUREMENT
 INFLUENCE OF THE AVERAGING PERIOD IN AIR TEMPERATURE MEASUREMENT Hristomir Branzov 1, Valentina Pencheva 2 1 National Institute of Meteorology and Hydrology, Sofia, Bulgaria, Hristomir.Branzov@meteo.bg
 http://www.wrcc.dri.edu/csc/scenic/ USER GUIDE 2017 Introduction... 2 Overview Data... 3 Overview Analysis Tools... 4 Overview Monitoring Tools... 4 SCENIC structure and layout... 5... 5 Detailed Descriptions
Altiplano Climate. Making Sense of 21st century Scenarios. A. Seth J. Thibeault C. Valdivia
 Altiplano Climate Making Sense of 21st century Scenarios A. Seth J. Thibeault C. Valdivia Overview Coupled Model Intercomparison Project (CMIP3) How do models represent Altiplano climate? What do models
Index Based Analysis of Climate Change Scenarios
 Politecnico di Milano Scuola di Ingegneria Civile, Ambientale e Territoriale Master of Science in Civil, Environmental and Land Management Engineering Index Based Analysis of Climate Change Scenarios Lake
TENDENCY ANALYSIS OF EXTREME CLIMATE INDICES WITH SPECIAL EMPHASIS ON AGRICULTURAL IMPACTS
 TENDENCY ANALYSIS OF EXTREME CLIMATE INDICES WITH SPECIAL EMPHASIS ON AGRICULTURAL IMPACTS R. Pongrácz and J. Bartholy Department of Meteorology, Eötvös Loránd University, Budapest, Hungary, prita@nimbus.elte.hu,
TEMPERATURE AND PRECIPITATION CHANGES IN TÂRGU- MURES (ROMANIA) FROM PERIOD
 FROM PERIOD") TEMPERATURE AND PRECIPITATION CHANGES IN TÂRGU- MURES (ROMANIA) FROM PERIOD 1951-2010 O.RUSZ 1 ABSTRACT. Temperature and precipitation changes in Târgu Mures (Romania) from period 1951-2010. The analysis
TEMPERATURE AND PRECIPITATION CHANGES IN TÂRGU- MURES (ROMANIA) FROM PERIOD 1951-2010 O.RUSZ 1 ABSTRACT. Temperature and precipitation changes in Târgu Mures (Romania) from period 1951-2010. The analysis
Changes in daily climate extremes in China and their connection to the large scale atmospheric circulation during
 Clim Dyn DOI 10.1007/s00382-009-0735-0 Changes in daily climate extremes in China and their connection to the large scale atmospheric circulation during 1961 2003 Qinglong You Shichang Kang Enric Aguilar
Preliminary intercomparison results for NARCCAP, other RCMs, and statistical downscaling over southern Quebec
 Preliminary intercomparison results for NARCCAP, other RCMs, and statistical downscaling over southern Quebec Philippe Gachon Research Scientist Adaptation & Impacts Research Division, Atmospheric Science
Changes in Daily Climate Extremes of Observed Temperature and Precipitation in China
 ATMOSPHERIC AND OCEANIC SCIENCE LETTERS, 2013, VOL. 6, NO. 5, 312 319 Changes in Daily Climate Extremes of Observed Temperature and Precipitation in China WANG Ai-Hui and FU Jian-Jian Nansen-Zhu International
Climate Regions. Combining Climate Graphs and Köppen s Classification
 Lab 15 Climate Regions Combining knowledge of the global patterns behind the major climatic controls, this lab will teach students how to construct climate graphs and then allow them to explore patterns
Climate Variability and Observed Change in Southern Africa
 Climate Variability and Observed Change in Southern Africa A C Kruger Climate Service South African Weather Service Templ ref: PPT-ISO-colour.001 Doc Ref no: CLS-RES-PRES-201302-1 Introduction Climate
Water Information Portal User Guide. Updated July 2014
 Water Information Portal User Guide Updated July 2014 1. ENTER THE WATER INFORMATION PORTAL Launch the Water Information Portal in your internet browser via http://www.bcogc.ca/public-zone/water-information
Investigating Weather with Google Earth Student Guide
 Investigating Weather with Google Earth Student Guide In this activity, you will use Google Earth to explore some factors that affect weather. You will: 1. Determine how different factors affect a location
No pause in the increase of hot temperature extremes
 SUPPLEMENTARY INFORMATION DOI: 10.1038/NCLIMATE2145 No pause in the increase of hot temperature extremes Sonia I. Seneviratne 1, Markus G. Donat 2,3, Brigitte Mueller 4,1, and Lisa V. Alexander 2,3 1 Institute
Evaluation of multi-year drought capabilities of the CESM Large-Ensemble using MODE
 Evaluation of multi-year drought capabilities of the CESM Large-Ensemble using MODE by: Abayomi A. Abatan Iowa State University CESM Societal Dimensions Working Group Meeting NCAR Boulder, CO 28 February
Colorado State University, Fort Collins, CO Weather Station Monthly Summary Report
 Colorado State University, Fort Collins, CO Weather Station Monthly Summary Report Month: December Year: 2017 Temperature: Mean T max was 47.2 F which is 4.4 above the 1981-2010 normal for the month. This
Changes in Mean and Extreme Temperature and Precipitation over the Arid Region of Northwestern China: Observation and Projection
 ADVANCES IN ATMOSPHERIC SCIENCES, VOL. 34, MARCH 2017, 289 305 Original Paper Changes in Mean and Extreme Temperature and Precipitation over the Arid Region of Northwestern China: Observation and Projection
Climate Profile for the Cayman Islands
 Climate Profile for the Cayman Islands Variability, Trends and Projections Prepared by Climate Studies Group, Mona The University of the West Indies For Smith Warner International Ltd June 2014 ACKNOWLEDGEMENT
DOWNSCALING INTERCOMPARISON PROJECT SUMMARY REPORT
 DOWNSCALING INTERCOMPARISON PROJECT SUMMARY REPORT 1 DOWNSCALING INTERCOMPARISON PROJECT Method tests and future climate projections The Pacific Climate Impacts Consortium (PCIC) recently tested a variety
Regional Climate Variability and Change
 Regional Climate Variability and Change Dr. Cedric J. VAN MEERBEECK Climatologist (cmeerbeeck@cimh.edu.bb) Ms. Wazita B. SCOTT Assistant Climate Forecaster (wscott@cimh.edu.bb) http://rcc.cimh.edu.bb 1
LOADS, CUSTOMERS AND REVENUE
 EB-00-0 Exhibit K Tab Schedule Page of 0 0 LOADS, CUSTOMERS AND REVENUE The purpose of this evidence is to present the Company s load, customer and distribution revenue forecast for the test year. The
First-Order Draft Chapter 3 IPCC WG1 Fourth Assessment Report
 0 Figure... Estimates of linear trends in significant wave height (cm decade - ) for the regions along the major ship routes for the global ocean for the period 0 00. Trends are shown only for the locations
Probability distributions of monthly-to-annual mean temperature and precipitation in a changing climate
 Probability distributions of monthly-to-annual mean temperature and precipitation in a changing climate Jouni Räisänen Department of Physics, University of Helsinki Climate probability distribution of
J8.4 TRENDS OF U.S. SNOWFALL AND SNOW COVER IN A WARMING WORLD,
 J8.4 TRENDS OF U.S. SNOWFALL AND SNOW COVER IN A WARMING WORLD, 1948-2008 Richard R. Heim Jr. * NOAA National Climatic Data Center, Asheville, North Carolina 1. Introduction The Intergovernmental Panel
RR#5 - Free Response
 Base your answers to questions 1 through 3 on the data table below and on your knowledge of Earth Science. The table shows the area, in million square kilometers, of the Arctic Ocean covered by ice from
WMO Guidelines on Generating a Defined Set of National Climate Monitoring Products
 WMO Guidelines on Generating a Defined Set of National Climate Monitoring Products 2017 edition WEATHER CLIMATE WATER WMO-No. 1204 WMO Guidelines on Generating a Defined Set of National Climate Monitoring
Global NWP Index documentation
 Global NWP Index documentation The global index is calculated in two ways, against observations, and against model analyses. Observations are sparse in some parts of the world, and using full gridded analyses
The Global Precipitation Climatology Centre (GPCC) Serving the Hydro-Climatology Community
 Serving the Hydro-Climatology Community") The Global Precipitation Climatology Centre (GPCC) Serving the Hydro-Climatology Community Bruno Rudolf, Andreas Becker, Udo Schneider, Anja Meyer-Christoffer, Markus Ziese, Peter Finger Deutscher Wetterdienst
The Global Precipitation Climatology Centre (GPCC) Serving the Hydro-Climatology Community Bruno Rudolf, Andreas Becker, Udo Schneider, Anja Meyer-Christoffer, Markus Ziese, Peter Finger Deutscher Wetterdienst
Trends in Indices of Daily Temperature and Precipitation Extremes in Europe,
 15 OVEMBER 2003 KLEI TAK AD KÖE 3665 Trends in Indices of Daily Temperature and Precipitation Extremes in Europe, 1946 99 A. M. G. KLEI TAK AD G. P. KÖE Royal etherlands Meteorological Institute, De Bilt,
Characteristics of meteorological disasters and their impacts on the agricultural ecosystems in the northwest of China: a case study in Xinjiang
 Wu et al. Geoenvironmental Disasters (2015) 2:3 DOI 10.1186/s40677-015-0015-8 RESEARCH ARTICLE Open Access Characteristics of meteorological disasters and their impacts on the agricultural ecosystems in