NOAA s Climate Normals. Pre-release Webcast presented by NOAA s National Climatic Data Center June 13, 2011
|
|
|
- Brent Lynch
- 5 years ago
- Views:
Transcription


1 NOAA s Climate Normals Pre-release Webcast presented by NOAA s National Climatic Data Center June 13, 2011
2 Takeaway Messages Most Normals will be available July 1 via FTP NWS Normals to be loaded into AWIPS Aug 1 We use daily data much more than last time Temperature Normals are internally consistent Comprehensive suite of precipitation Normals HDD/CDD computed more directly this time Hourly Normals for about 260 stations Pseudonormals for short-record stations On average warmer than
3 Outline Climate Normals Background and Overview What to Expect on July 1, 2011 Variables, access, etc. NWS Release versus the Public Release Temperature Normals including HDD/CDD Precipitation/Snow Normals Pseudonormals and CRN Normals Preliminary Results 3

4 Background: NOAA s Climate Normals Daily, monthly & annual 30 year climate averages Main Parameters Temperature (max, min, mean) Heating & Cooling Degree Days Precipitation and Snowfall Daily, Monthly, Seasonal, and Annual World Meteorological Organization Mandate Countries Calculate new normals every 30 years Past periods: , Next period: WMO Recommendation Countries update normals every 10 years Current period Next scheduled period: U.S. Normals ~8,000 stations
5 Background: NOAA s Climate Normals Daily, monthly & annual 30 year climate averages Main Parameters Temperature (max, min, mean) Heating & Cooling Degree Days Precipitation and Snowfall Daily, Monthly, Seasonal, and Annual World Meteorological Organization Mandate Countries Calculate new normals every 30 years Past periods: , Next period: WMO Recommendation Countries update normals every 10 years Current period Next scheduled period: U.S. Normals ~8,000 stations Normals: Drop 1970s and add
6 Overview: Climate Normals Number of Stations (rounded) Temperature: 7500 Precipitation: 8700 Snowfall: 6400 Snow Depth: 5300 Hourly: 260 Source Data Sets Primary: GHCN-Daily Secondary: ISD-Lite for Hourly Normals Normals Station IDs based on GHCN-Daily IDs
7 What to Expect on July 1 st Daily/monthly/seasonal/annual normals of station-based temperature, precipitation, snowfall, and snow depth Hourly normals for 260 First Order Stations README files, documentation, station lists and metadata Instructions for FTP access will be provided on the new normals webpage:
8 What NOT to Expect on July 1 st Some products will not be available July 1 but should be available by January : Most agricultural normals such as frost/freeze date normals Requires complete daily data or simulations Spatial aggregations of normals such as climate division normals or gridded normals Population-weighted normals such as monthly HDD/CDD Requires new Census data
9 Daily Monthly Seasonal Annual Temperature Normals Released July 1 Tmax, Tmin, Tavg, DTR Heating and Cooling Degree Days Standard Deviations Tmax, Tmin, Tavg, DTR Midnight observing time offsets Heating and Cooling Degree Days Count Normals Standard Deviations Tmax, Tmin, Tavg, DTR Heating and Cooling Degree Days Count Normals Tmax, Tmin, Tavg, DTR Heating and Cooling Degree Days Count Normals
10 Precipitation Snowfall Snow Depth Precipitation Statistics Produced for the Normals Average monthly totals Average month-to-date totals Average year-to-date totals Average number of days per month exceeding various thresholds Freq Daily relative frequencies exceeding various thresholds 25 th, 50 th, and 75 th percentiles of monthly totals Daily 25 th, 50 th, and 75 th percentiles Pctl Average monthly totals Average month-to-date totals Avg Average year-to-date totals Average number of days per month exceeding various thresholds Freq Daily relative frequencies exceeding various thresholds 25 th, 50 th, and 75 th percentiles of monthly totals Daily 25 th, 50 th, and 75 th percentiles Pctl Average number of days per month exceeding various thresholds Daily relative frequency exceeding various thresholds Freq Daily 25 th, 50 th, and 75 th percentiles Pctl Avg
11 Hourly Normals Air Temperature Pressure Dew point Temperature Heat Index Heating Degree Hours Cooling Degree Hours Clouds Winds Wind Chill
12 NWS Deliverable NCDC provides the National Weather Service a special deliverable for loading into AWIPS This will be delivered to NWS July 1 st, but won t be loaded into AWIPS until August 1 st Several hundred stations, mostly ASOS Only a portion of the product portfolio No hourly normals, limited thresholds, etc. For more information on the NWS deliverable, please contact Jim Zdrojewski


13 Computation of Normals Much more than a 30 year average Cooperative Network First-Order Network Weather Stations Standardized Month- Year Sequential Data Normals Calculations -Means -Totals STANDARDIZATION -Time of Observation Correction -Statistical QC -Station History QC -Missing Data Estimation -Standard Deviations Monthly Normals Spline Fit Calculations Daily Normals Many stations change location during the course of 30 years. Data are standardized based on the current location.
14 Computation of Normals Much more than a 30 year average Cooperative Network First-Order Network Weather Stations Standardized Month- Year Sequential Data Normals Calculations -Means -Totals STANDARDIZATION -Time of Observation Correction -Statistical QC -Station History QC -Missing Data Estimation -Standard Deviations Monthly Normals Spline Fit Calculations Daily Normals Many stations change location during the course of 30 years. Data are standardized based on the current location. No Daily Data Used
15 Normals Flowchart of Normals products derived from Temperature data Standardized Monthly Temperature Data Monthly Temperature Normals GHCN-Daily Constrained Harmonic Fit Daily Temperature Normals Monthly, Seasonal, and Annual Degree Day Normals Daily Departures from Normal Daily Degree Day Normals Count Normals e.g. days per month above 90F
16 Normals of Tmax, Tmin, Tavg, DTR We give monthly temperature precedence because of the robust quality control and standardization done at the monthly scale Stations with at least 10 non-missing and non-suspect years per month are retained Missing monthly values are filled based on an index of agreement analysis The 30 values per month are averages and data completeness is tracked as a flag
17 Going from Monthly to Daily Daily temperature normals of tmax, tmin, tavg, and dtr are computed using daily temperature data The annual cycle is captured by Harmonic Analysis (sines and cosines) We use constrained minimization to ensure daily and monthly normals are consistent This passes through the quality control and standardization done at the monthly scale
18 Computation of HDD/CDD No longer using Thom Method or splining Start with daily tavg normals The key is to measure the spread about the daily tavg normals We use a moving window approach to estimate the spread about the daily normal The daily HDD/CDD normals are then the scaled averages of the relevant distributions Monthly, seasonal, and annual HDD/CDD are accumulated from the daily HDD/CDD values
19 Precipitation-related Normals More daily statistics: probabilities and percentiles for precipitation, snowfall, and snow depth Probabilities of measurable amounts and of amounts exceeding various higher thresholds Conditional percentiles: 25th, 50th, and 75th percentiles of nonzero amounts For precipitation and snowfall, month-to-date and year-to-date totals replace daily means. Snowfall and snow depth statistics at several thousand stations compared to several hundred stations in the normals.
20 Pseudonormals and CRN Pseudonormals are estimates of expected normals for short-record stations Based on Sun and Peterson papers from 2005 Linear combination of normals from neighboring stations, using overlapping data records to establish the weighting Station must meet several criteria: Must have at least 2 years of non-missing and non-suspect data values per month Must have reported at least one value in 2010 In addition, there must be sufficient neighbors Includes Climate Reference Network (CRN) stations
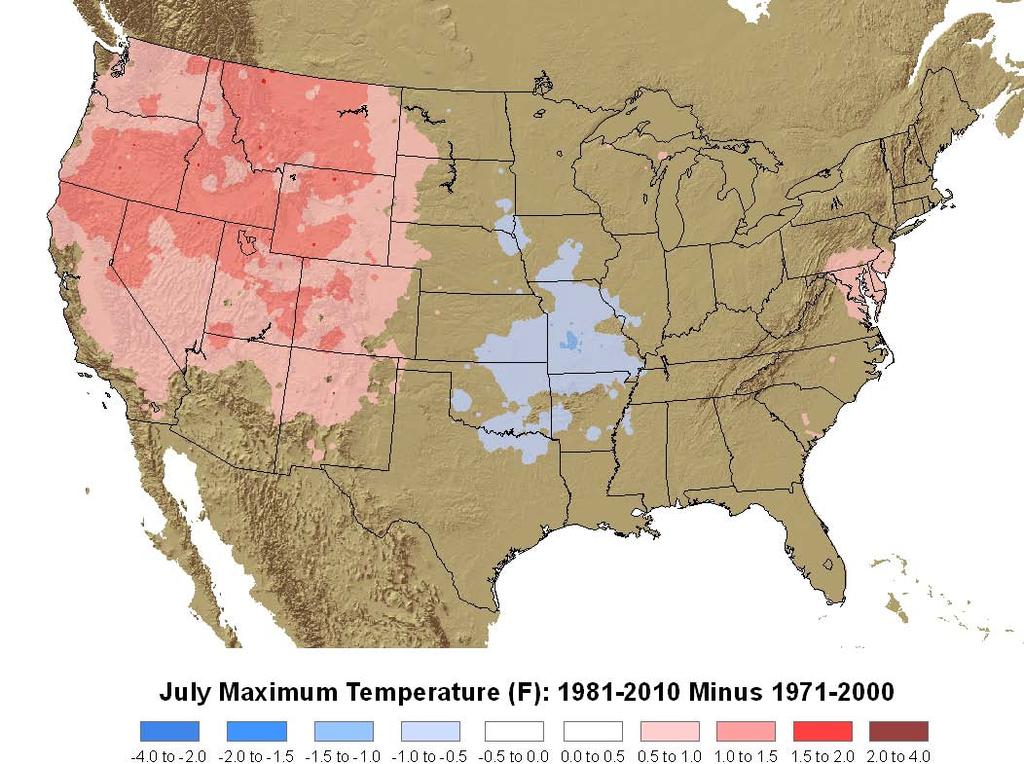
21 Preliminary Results 21
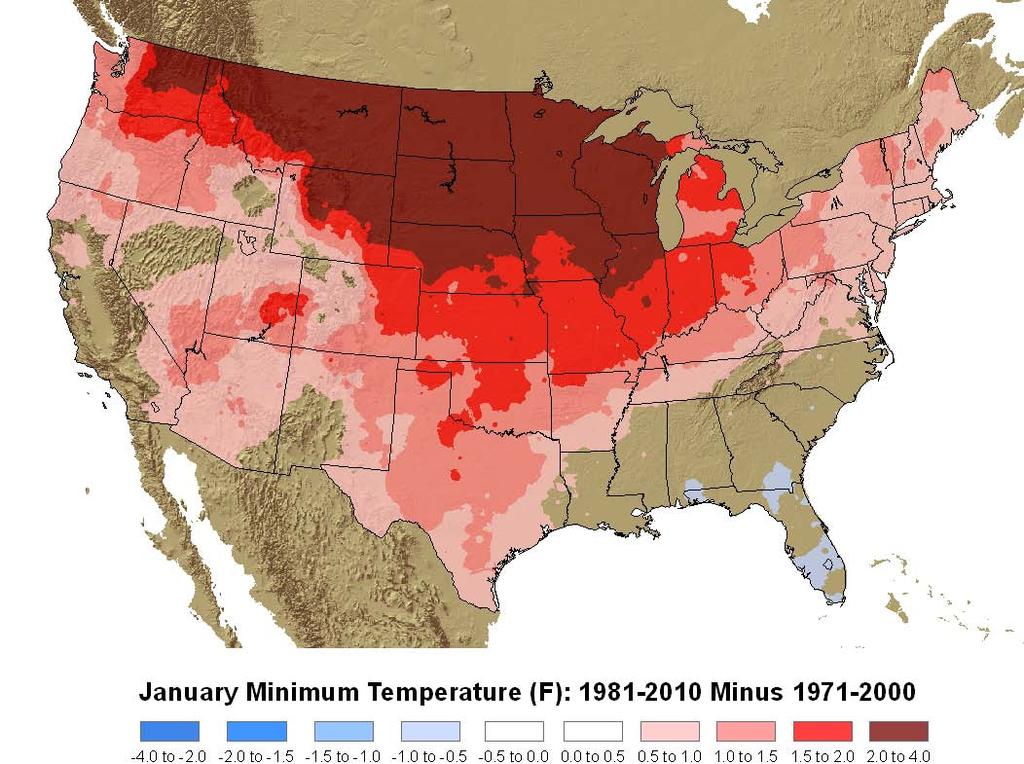
22 Preliminary Results 22
23 Preliminary Results Previous figures are apples-to-apples comparisons Statewide averages of annual normals of tmax and tmin show that the normals are warmer than the for all lower 48 states Apples-to-Oranges comparisons for temperature Different methodology, QC/standardization 5053 stations used last time and this time Tmax: Avg change for all station months is <+0.1F Largest monthly absolute change is +0.9F in January Tmin: Avg change for all station months is +0.6F Every month shows a positive change Largest monthly change is +1.7F in January These data are preliminary and subject to change prior to July
24 Takeaway Messages Most Normals will be available July 1 via FTP NWS Normals to be loaded into AWIPS Aug 1 We use daily data much more than last time Temperature Normals are internally consistent Comprehensive suite of precipitation Normals HDD/CDD computed more directly this time Hourly Normals for about 260 stations Pseudonormals for short-record stations On average warmer than
25 For More Information See our website on the Normals: Website contains FAQs and other information Contact with any other questions about the Normals 25
Drought and Climate Extremes Indices for the North American Drought Monitor and North America Climate Extremes Monitoring System. Richard R. Heim Jr.
 Drought and Climate Extremes Indices for the North American Drought Monitor and North America Climate Extremes Monitoring System Richard R. Heim Jr. NOAA/NESDIS/National Climatic Data Center Asheville,
Climate normals are typically defined as 30-yr
 NOAA S 1981 2010 U.S. CLIMATE NORMALS An Overview by Anthony Arguez, Imke Durre, Scott Applequist, Russell S. Vose, Michael F. Squires, Xungang Yin, Richard R. Heim Jr., and Timothy W. Owen The latest
 http://www.wrcc.dri.edu/csc/scenic/ USER GUIDE 2017 Introduction... 2 Overview Data... 3 Overview Analysis Tools... 4 Overview Monitoring Tools... 4 SCENIC structure and layout... 5... 5 Detailed Descriptions
Climatography of the United States No
 Climate Division: AK 5 NWS Call Sign: ANC Month (1) Min (2) Month(1) Extremes Lowest (2) Temperature ( F) Lowest Month(1) Degree s (1) Base Temp 65 Heating Cooling 90 Number of s (3) Jan 22.2 9.3 15.8
Climate Change Indices By: I Putu Santikayasa
 Climate Change Indices By: I Putu Santikayasa Climate Change and Water Resources CE74.9002 Water Engineering and Management (WEM) School of Engineering and Technology (SET) Asian institute of Technology
Quality Control of the National RAWS Database for FPA Timothy J Brown Beth L Hall
 Quality Control of the National RAWS Database for FPA Timothy J Brown Beth L Hall Desert Research Institute Program for Climate, Ecosystem and Fire Applications May 2005 Project Objectives Run coarse QC
Climatography of the United States No
 No. 2 1971-2 Asheville, North Carolina 2881 COOP ID: 4792 Climate Division: CA 6 NWS Call Sign: Month (1) Min (2) Month(1) Extremes Lowest (2) Temperature ( F) Lowest Month(1) Degree s (1) Base Temp 65
Climatography of the United States No
 No. 2 1971-2 Asheville, North Carolina 2881 COOP ID: 46646 Climate Division: CA 4 NWS Call Sign: 8W Month (1) Min (2) Month(1) Extremes Lowest (2) Temperature ( F) Lowest Month(1) Degree s (1) Base Temp
National Climate Monitoring Products Fatima Driouech
 National Climate Monitoring Products Fatima Driouech WMO-CCl-OPACE-2 Co-chair (16th intersession) CCl-TECO, Geneva 11-12 April 2017 Climate monitoring : awareness increasing Canada Countries around the
Climatography of the United States No
 No. 2 1971-2 Asheville, North Carolina 2881 COOP ID: 43417 Climate Division: CA 4 NWS Call Sign: N Lon: 121 Month (1) Min (2) Month(1) Extremes Lowest (2) Temperature ( F) Lowest Month(1) Degree s (1)
Climatography of the United States No
 Climate Division: CA 7 NWS Call Sign: Month (1) Min (2) Month(1) Extremes Lowest (2) Temperature ( F) Lowest Month(1) Degree s (1) Base Temp 65 Heating Cooling 100 Number of s (3) Jan 54.4 36.9 45.7 77+
Climatography of the United States No
 No. 2 1971-2 Asheville, North Carolina 2881 COOP ID: 4795 Climate Division: CA 6 NWS Call Sign: SBA Month (1) Min (2) Month(1) Extremes Lowest (2) Temperature ( F) Lowest Month(1) Degree s (1) Base Temp
Climatography of the United States No
 Climate Division: CA 4 NWS Call Sign: Month (1) Min (2) Month(1) Extremes Lowest (2) Temperature ( F) Lowest Month(1) Degree s (1) Base Temp 65 Heating Cooling 100 Number of s (3) Jan 61.4 33.1 47.3 82+
Climatography of the United States No
 Climate Division: CA 6 NWS Call Sign: Month (1) Min (2) Month(1) Extremes Lowest (2) Temperature ( F) Lowest Month(1) Degree s (1) Base Temp 65 Heating Cooling 100 Number of s (3) Jan 66.1 38.3 52.2 91
Climatography of the United States No
 Climate Division: CA 2 NWS Call Sign: Month (1) Min (2) Month(1) Extremes Lowest (2) Temperature ( F) Lowest Month(1) Degree s (1) Base Temp 65 Heating Cooling 100 Number of s (3) Jan 53.5 37.6 45.6 78
Climatography of the United States No
 Climate Division: CA 1 NWS Call Sign: Month (1) Min (2) Month(1) Extremes Lowest (2) Temperature ( F) Lowest Month(1) Degree s (1) Base Temp 65 Heating Cooling 100 Number of s (3) Jan 50.2 31.2 40.7 65+
Climatography of the United States No
 Climate Division: CA 4 NWS Call Sign: Month (1) Min (2) Month(1) Extremes Lowest (2) Temperature ( F) Lowest Month(1) Degree s (1) Base Temp 65 Heating Cooling 100 Number of s (3) Jan 61.9 42.0 52.0 89
Climatography of the United States No
 Climate Division: CA 1 NWS Call Sign: Month (1) Min (2) Month(1) Extremes Lowest (2) Temperature ( F) Lowest Month(1) Degree s (1) Base Temp 65 Heating Cooling 1 Number of s (3) Jan 56.2 4.7 48.5 79 1962
Climatography of the United States No
 Climate Division: CA 2 NWS Call Sign: Month (1) Min (2) Month(1) Extremes Lowest (2) Temperature ( F) Lowest Month(1) Degree s (1) Base Temp 65 Heating Cooling 100 Number of s (3) Jan 55.6 38.8 47.2 81
Climatography of the United States No
 Climate Division: CA 1 NWS Call Sign: Month (1) Min (2) Month(1) Extremes Lowest (2) Temperature ( F) Lowest Month(1) Degree s (1) Base Temp 65 Heating Cooling 100 Number of s (3) Jan 52.4 35.4 43.9 69
Climatography of the United States No
 Climate Division: CA 7 NWS Call Sign: Month (1) Min (2) Month(1) Extremes Lowest (2) Temperature ( F) Lowest Month(1) Degree s (1) Base Temp 65 Heating Cooling 100 Number of s (3) 56.0 35.7 45.9 83 1975
Climatography of the United States No
 Climate Division: CA 2 NWS Call Sign: Month (1) Min (2) Month(1) Extremes Lowest (2) Temperature ( F) Lowest Month(1) Degree s (1) Base Temp 65 Heating Cooling 100 Number of s (3) 53.7 32.7 43.2 79 1962
Climatography of the United States No
 Climate Division: CA 2 NWS Call Sign: Month (1) Min (2) Month(1) Extremes Lowest (2) Temperature ( F) Lowest Month(1) Degree s (1) Base Temp 65 Heating Cooling 100 Number of s (3) 53.3 31.8 42.6 74+ 1975
Climatography of the United States No
 Climate Division: CA 7 NWS Call Sign: Month (1) Min (2) Month(1) Extremes Lowest (2) Temperature ( F) Lowest Month(1) Degree s (1) Base Temp 65 Heating Cooling 100 Number of s (3) 70.4 44.2 57.3 95 1971
Climatography of the United States No
 Climate Division: CA 7 NWS Call Sign: Month (1) Min (2) Month(1) Extremes Lowest (2) Temperature ( F) Lowest Month(1) Degree s (1) Base Temp 65 Heating Cooling 1 Number of s (3) 64.8 45.4 55.1 85 1971
Climatography of the United States No
 Climate Division: CA 7 NWS Call Sign: Month (1) Min (2) Month(1) Extremes Lowest (2) Temperature ( F) Lowest Month(1) Degree s (1) Base Temp 65 Heating Cooling 100 Number of s (3) 44.5 29.3 36.9 69 1951
Climatography of the United States No
 Climate Division: CA 6 NWS Call Sign: Month (1) Min (2) Month(1) Extremes Lowest (2) Temperature ( F) Lowest Month(1) Degree s (1) Base Temp 65 Heating Cooling 100 Number of s (3) Jan 51.5 35.0 43.3 80
Climatography of the United States No
 Climate Division: CA 7 NWS Call Sign: Month (1) Min (2) Month(1) Extremes Lowest (2) Temperature ( F) Lowest Month(1) Degree s (1) Base Temp 65 Heating Cooling 100 Number of s (3) 58.8 34.3 46.6 81+ 1948
Climatography of the United States No
 Climate Division: CA 7 NWS Call Sign: Month (1) Min (2) Month(1) Extremes Lowest (2) Temperature ( F) Lowest Month(1) Degree s (1) Base Temp 65 Heating Cooling 1 Number of s (3) 65.5 38.7 52.1 87 1962
Climatography of the United States No
 Climate Division: CA 2 NWS Call Sign: Month (1) Min (2) Month(1) Extremes Lowest (2) Temperature ( F) Lowest Month(1) Degree s (1) Base Temp 65 Heating Cooling 100 Number of s (3) 53.3 37.1 45.2 77 1962
Climatography of the United States No
 Climate Division: CA 6 NWS Call Sign: Month (1) Min (2) Month(1) Extremes Lowest (2) Temperature ( F) Lowest Month(1) Degree s (1) Base Temp 65 Heating Cooling 100 Number of s (3) 68.5 45.7 57.1 90 1971
Climatography of the United States No
 Climate Division: CA 5 NWS Call Sign: Month (1) Min (2) Month(1) Extremes Lowest (2) Temperature ( F) Lowest Month(1) Degree s (1) Base Temp 65 Heating Cooling 100 Number of s (3) 59.3 31.5 45.4 80 1976
Climatography of the United States No
 Climate Division: CA 4 NWS Call Sign: Month (1) Min (2) Month(1) Extremes Lowest (2) Temperature ( F) Lowest Month(1) Degree s (1) Base Temp 65 Heating Cooling 100 Number of s (3) Jan 56.4 43.6 50.0 77
Climatography of the United States No
 Climate Division: CA 4 NWS Call Sign: Month (1) Min (2) Month(1) Extremes Lowest (2) Temperature ( F) Lowest Month(1) Degree s (1) Base Temp 65 Heating Cooling 100 Number of s (3) Jan 49.4 37.5 43.5 73
Climatography of the United States No
 Climate Division: CA 5 NWS Call Sign: Month (1) Min (2) Month(1) Extremes Lowest (2) Temperature ( F) Lowest Month(1) Degree s (1) Base Temp 65 Heating Cooling 100 Number of s (3) Jan 44.8 25.4 35.1 72
Climatography of the United States No
 Climate Division: CA 1 NWS Call Sign: Month (1) Min (2) Month(1) Extremes Lowest (2) Temperature ( F) Lowest Month(1) Degree s (1) Base Temp 65 Heating Cooling 1 Number of s (3) Jan 57.8 39.5 48.7 85 1962
Climatography of the United States No
 Climate Division: CA 6 NWS Call Sign: Month (1) Min (2) Month(1) Extremes Lowest (2) Temperature ( F) Lowest Month(1) Degree s (1) Base Temp 65 Heating Cooling 1 Number of s (3) Jan 67.5 42. 54.8 92 1971
Climatography of the United States No
 Climate Division: CA 4 NWS Call Sign: Month (1) Min (2) Month(1) Extremes Lowest (2) Temperature ( F) Lowest Month(1) Degree s (1) Base Temp 65 Heating Cooling 1 Number of s (3) Jan 58.5 38.8 48.7 79 1962
Climatography of the United States No
 Climate Division: CA 6 NWS Call Sign: Month (1) Min (2) Month(1) Extremes Lowest (2) Temperature ( F) Lowest Month(1) Degree s (1) Base Temp 65 Heating Cooling 100 Number of s (3) Jan 69.4 46.6 58.0 92
Climatography of the United States No
 Climate Division: CA 5 NWS Call Sign: Month (1) Min (2) Month(1) Extremes Lowest (2) Temperature ( F) Lowest Month(1) Degree s (1) Base Temp 65 Heating Cooling 100 Number of s (3) Jan 56.6 36.5 46.6 81
Climatography of the United States No
 Climate Division: CA 1 NWS Call Sign: Month (1) Min (2) Month(1) Extremes Lowest (2) Temperature ( F) Lowest Month(1) Degree s (1) Base Temp 65 Heating Cooling 100 Number of s (3) Jan 57.9 38.9 48.4 85
Climatography of the United States No
 Climate Division: CA 4 NWS Call Sign: Month (1) Min (2) Month(1) Extremes Lowest (2) Temperature ( F) Lowest Month(1) Degree s (1) Base Temp 65 Heating Cooling 100 Number of s (3) Jan 55.6 39.3 47.5 77
Climatography of the United States No
 No. 2 1971-2 Asheville, North Carolina 2881 COOP ID: 42713 Climate Division: CA 7 NWS Call Sign: Elevation: -3 Feet Lat: 32 Month (1) Min (2) Month(1) Extremes Lowest (2) Temperature ( F) Lowest Month(1)
Climatography of the United States No
 No. 2 1971-2 Asheville, North Carolina 2881 COOP ID: 46175 Climate Division: CA 6 NWS Call Sign: 3L3 Elevation: 1 Feet Lat: 33 Month (1) Min (2) Month(1) Extremes Lowest (2) Temperature ( F) Lowest Month(1)
Climatography of the United States No
 Climate Division: SC 7 NWS Call Sign: CHS Month (1) Min (2) Month(1) Extremes Lowest (2) Temperature ( F) Lowest Month(1) Degree s (1) Base Temp 65 Heating Cooling 100 Number of s (3) Jan 58.9 36.9 47.9
Climatography of the United States No
 Climate Division: ND 8 NWS Call Sign: BIS Month (1) Min (2) Month(1) Extremes Lowest (2) Temperature ( F) Lowest Month(1) Degree s (1) Base Temp 65 Heating Cooling 100 Number of s (3) Jan 21.1 -.6 10.2
Climatography of the United States No
 Climate Division: TN 1 NWS Call Sign: Month (1) Min (2) Month(1) Extremes Lowest (2) Temperature ( F) Lowest Month(1) Degree s (1) Base Temp 65 Heating Cooling 100 Number of s (3) Jan 47.6 24.9 36.3 81
Climatography of the United States No
 Climate Division: CA 5 NWS Call Sign: FAT Month (1) Min (2) Month(1) Extremes Lowest (2) Temperature ( F) Lowest Month(1) Degree s (1) Base Temp 65 Heating Cooling 1 Number of s (3) Jan 53.6 38.4 46. 78
SuperPack North America
 SuperPack North America Speedwell SuperPack makes available an unprecedented range of quality historical weather data, and weather data feeds for a single annual fee. SuperPack dramatically simplifies
Climatography of the United States No
 Climate Division: CA 6 NWS Call Sign: 1L2 N Lon: 118 3W Month (1) Min (2) Month(1) Extremes Lowest (2) Temperature ( F) Lowest Month(1) Degree s (1) Base Temp 65 Heating Cooling 1 Number of s (3) Jan 63.7
Climatography of the United States No
 Climate Division: CA 5 NWS Call Sign: BFL Month (1) Min (2) Month(1) Extremes Lowest (2) Temperature ( F) Lowest Month(1) Degree s (1) Base Temp 65 Heating Cooling 1 Number of s (3) Jan 56.3 39.3 47.8
Climatography of the United States No
 Climate Division: TN 3 NWS Call Sign: BNA Month (1) Min (2) Month(1) Extremes Lowest (2) Temperature ( F) Lowest Month(1) Degree s (1) Base Temp 65 Heating Cooling 100 Number of s (3) Jan 45.6 27.9 36.8
Climatography of the United States No
 Climate Division: CA 5 NWS Call Sign: Elevation: 1,14 Feet Lat: 36 Month (1) Min (2) Month(1) Extremes Lowest (2) Temperature ( F) Lowest Month(1) Degree s (1) Base Temp 65 Heating Cooling 1 Number of
Climatography of the United States No
 Climate Division: CA 4 NWS Call Sign: Elevation: 2 Feet Lat: 37 Month (1) Min (2) Month(1) Extremes Lowest (2) Temperature ( F) Lowest Month(1) Degree s (1) Base Temp 65 Heating Cooling 1 Number of s (3)
Climatography of the United States No
 Climate Division: CA 5 NWS Call Sign: Elevation: 6 Feet Lat: 37 Month (1) Min (2) Month(1) Extremes Lowest (2) Temperature ( F) Lowest Month(1) Degree s (1) Base Temp 65 Heating Cooling 1 Number of s (3)
Climatography of the United States No
 Climate Division: CA 4 NWS Call Sign: Elevation: 13 Feet Lat: 36 Month (1) Min (2) Month(1) Extremes Lowest (2) Temperature ( F) Lowest Month(1) Degree s (1) Base Temp 65 Heating Cooling 1 Number of s
Operational MRCC Tools Useful and Usable by the National Weather Service
 Operational MRCC Tools Useful and Usable by the National Weather Service Vegetation Impact Program (VIP): Frost / Freeze Project Beth Hall Accumulated Winter Season Severity Index (AWSSI) Steve Hilberg
Climatography of the United States No
 Climate Division: CA 6 NWS Call Sign: LAX Elevation: 1 Feet Lat: 33 Month (1) Min (2) Month(1) Extremes Lowest (2) Temperature ( F) Lowest Month(1) Degree s (1) Base Temp 65 Heating Cooling 1 Number of
MxVision WeatherSentry Web Services Content Guide
 MxVision WeatherSentry Web Services Content Guide July 2014 DTN 11400 Rupp Drive Minneapolis, MN 55337 00.1.952.890.0609 This document and the software it describes are copyrighted with all rights reserved.
Climatography of the United States No
 Climate Division: CA 6 NWS Call Sign: TOA Elevation: 11 Feet Lat: 33 2W Temperature ( F) Month (1) Min (2) Month(1) Extremes Lowest (2) Lowest Month(1) Degree s (1) Base Temp 65 Heating Cooling 1 Number
Using Independent NCDC Gauges to Analyze Precipitation Values from the OneRain Corporation Algorithm and the National Weather Service Procedure
 Using Independent NCDC Gauges to Analyze Precipitation Values from the OneRain Corporation Algorithm and the National Weather Service Procedure Steven M. Martinaitis iti Henry E. Fuelberg John L. Sullivan
STRUCTURAL ENGINEERS ASSOCIATION OF OREGON
 STRUCTURAL ENGINEERS ASSOCIATION OF OREGON P.O. Box 3285 PORTLAND, OR 97208 503.753.3075 www.seao.org E-mail: jane@seao.org 2010 OREGON SNOW LOAD MAP UPDATE AND INTERIM GUIDELINES FOR SNOW LOAD DETERMINATION
Arizona Climate Summary
 Arizona Climate Summary March 2014 Summary of conditions for February 2014 February 2014 Temperature and Precipitation Summary February 1 st 16 th : We started off the month of February with some moisture
NADM, NACEM, and Opportunities for Future Collaboration
 NADM, NACEM, and Opportunities for Future Collaboration Richard R. Heim Jr. NOAA/NESDIS/National Climatic Data Center Asheville, North Carolina, U.S.A. 4th Annual DRI Workshop 26-28 January 2009, Regina,
1.0 Implications of using daily climatological wind speed prior to 1948
 Supplemental Material 1.0 Implications of using daily climatological wind speed prior to 1948 As detailed in the manuscript, NCEP-NCAR reanalysis wind data were used for the period 1948/01/01-2011/12/31.
Colorado s 2003 Moisture Outlook
 Colorado s 2003 Moisture Outlook Nolan Doesken and Roger Pielke, Sr. Colorado Climate Center Prepared by Tara Green and Odie Bliss http://climate.atmos.colostate.edu How we got into this drought! Fort
Daily and monthly gridded precipitation analyses of the Global Precipitation Climatology Centre (GPCC): Data base and quality-control
: Data base and quality-control") 8th IPWG-Meeting, 03-07 Oct. 2016, Bologna, Italy Daily and monthly gridded precipitation analyses of the Global Precipitation Climatology Centre (GPCC): Data base and quality-control U. Schneider, A.
8th IPWG-Meeting, 03-07 Oct. 2016, Bologna, Italy Daily and monthly gridded precipitation analyses of the Global Precipitation Climatology Centre (GPCC): Data base and quality-control U. Schneider, A.
Jay Lawrimore NOAA National Climatic Data Center 9 October 2013
 Jay Lawrimore NOAA National Climatic Data Center 9 October 2013 Daily data GHCN-Daily as the GSN Archive Monthly data GHCN-Monthly and CLIMAT messages International Surface Temperature Initiative Global
The xmacis Userʼs Guide. Keith L. Eggleston Northeast Regional Climate Center Cornell University Ithaca, NY
 The xmacis Userʼs Guide Keith L. Eggleston Northeast Regional Climate Center Cornell University Ithaca, NY September 22, 2004 Updated September 9, 2008 The xmacis Userʼs Guide The xmacis program consists
Understanding Michigan snowfall. Jim Keysor - NWS Gaylord
 Understanding Michigan snowfall Jim Keysor - NWS Gaylord Presentation Outline Topics Background information on lake effect Radar and lake effect snow Wind direction and lake effect Lake Enhanced snow Elevation
New Climate Divisions for Monitoring and Predicting Climate in the U.S.
 New Climate Divisions for Monitoring and Predicting Climate in the U.S. Klaus Wolter and Dave Allured, University of Colorado at Boulder, CIRES Climate Diagnostics Center, and NOAA-ESRL Physical Sciences
P1.34 MULTISEASONALVALIDATION OF GOES-BASED INSOLATION ESTIMATES. Jason A. Otkin*, Martha C. Anderson*, and John R. Mecikalski #
 P1.34 MULTISEASONALVALIDATION OF GOES-BASED INSOLATION ESTIMATES Jason A. Otkin*, Martha C. Anderson*, and John R. Mecikalski # *Cooperative Institute for Meteorological Satellite Studies, University of
Arizona Climate Summary April 2013
 Arizona Climate Summary April 2013 Summary of conditions for March 2013 March 2013 Temperature and Precipitation Summary March 1 st 16 th : March began as a ridge of high pressure progressed across the
Drought in Southeast Colorado
 Drought in Southeast Colorado Nolan Doesken and Roger Pielke, Sr. Colorado Climate Center Prepared by Tara Green and Odie Bliss http://climate.atmos.colostate.edu 1 Historical Perspective on Drought Tourism
WEATHER NORMALIZATION METHODS AND ISSUES. Stuart McMenamin Mark Quan David Simons
 WEATHER NORMALIZATION METHODS AND ISSUES Stuart McMenamin Mark Quan David Simons Itron Forecasting Brown Bag September 17, 2013 Please Remember» Phones are Muted: In order to help this session run smoothly,
Colorado State University, Fort Collins, CO Weather Station Monthly Summary Report
 Colorado State University, Fort Collins, CO Weather Station Monthly Summary Report Month: December Year: 2016 Temperature: Mean T max was 39.7 F which is 3.1 below the 1981-2010 normal for the month. This
ANALYSIS OF CLIMATIC CHANGES IN THE SAN JUAN MOUNTAIN (SJM) REGION DURING THE 20 TH CENTURY. Imtiaz Rangwala
 REGION DURING THE 20 TH CENTURY. Imtiaz Rangwala") ANALYSIS OF CLIMATIC CHANGES IN THE SAN JUAN MOUNTAIN (SJM) REGION DURING THE 20 TH CENTURY Imtiaz Rangwala imtiazr@envsci.rutgers.edu MTNCLIM 2008 1 Objectives (as proposed) Nature of climate change in
ANALYSIS OF CLIMATIC CHANGES IN THE SAN JUAN MOUNTAIN (SJM) REGION DURING THE 20 TH CENTURY Imtiaz Rangwala imtiazr@envsci.rutgers.edu MTNCLIM 2008 1 Objectives (as proposed) Nature of climate change in
London Heathrow Field Site Metadata
 London Heathrow Field Site Metadata Field Site Information Name: Heathrow src_id (Station ID number): 708 Geographic Area: Greater London Latitude (decimal ): 51.479 Longitude (decimal ): -0.449 OS Grid
Climatography of the United States No
 Month (1) Min (2) Month(1) Extremes Lowest (2) Temperature ( F) Lowest Month(1) Degree s (1) Base Temp 65 Heating Cooling 100 Number of s (3) 42.6 24.2 33.4 79 1950 25 44.2 1974-16 1994 19 18.8 1977 977
Arizona Climate Summary May 2012
 Arizona Climate Summary May 2012 Summary of conditions for April 2012 April 2012 Temperature and Precipitation Summary April 1 st 16 th : Although April began with another low pressure system sweeping
Climate Projections and Energy Security
 NOAA Research Earth System Research Laboratory Physical Sciences Division Climate Projections and Energy Security Andy Hoell and Jim Wilczak Research Meteorologists, Physical Sciences Division 7 June 2016
Climatography of the United States No
 Month (1) Min (2) Month(1) Extremes Lowest (2) Temperature ( F) Lowest Month(1) Degree s (1) Base Temp 65 Heating Cooling 100 Number of s (3) Jan 54.3 40.1 47.2 75 1998 17 53.0 1995 18 1949 11 41.7 1972
Colorado State University, Fort Collins, CO Weather Station Monthly Summary Report
 Colorado State University, Fort Collins, CO Weather Station Monthly Summary Report Month: January Year: 2019 Temperature: Mean T max was 47.2 F which is 3.0 above the 1981-2010 normal for the month. This
Urban Forest Effects-Dry Deposition (UFORE D) Model Enhancements. Satoshi Hirabayashi
 Model Enhancements. Satoshi Hirabayashi") Urban Forest Effects-Dry Deposition (UFORE D) Model Enhancements Satoshi Hirabayashi The Davey Institute, The Davey Tree Expert Company, Syracuse, New York 13210, USA Surface Weather Data NOAA Integrated
Urban Forest Effects-Dry Deposition (UFORE D) Model Enhancements Satoshi Hirabayashi The Davey Institute, The Davey Tree Expert Company, Syracuse, New York 13210, USA Surface Weather Data NOAA Integrated
Climatography of the United States No
 Temperature ( F) Month (1) Min (2) Month(1) Extremes Lowest (2) Lowest Month(1) Degree s (1) Base Temp 65 Heating Cooling 100 Number of s (3) Jan 32.8 21.7 27.3 62 1918 1 35.8 1983-24 1950 29 10.5 1979
Climatography of the United States No
 Month (1) Min (2) Month(1) Extremes Lowest (2) Temperature ( F) Lowest Month(1) Degree s (1) Base Temp 65 Heating Cooling 100 Number of s (3) Jan 63.9 39.3 51.6 86 1976 16 56.6 1986 20 1976 2 47.5 1973
Application and verification of ECMWF products 2008
 Application and verification of ECMWF products 2008 RHMS of Serbia 1. Summary of major highlights ECMWF products are operationally used in Hydrometeorological Service of Serbia from the beginning of 2003.
Arizona Climate Summary May 2013
 Arizona Climate Summary May 2013 Summary of conditions for April 2013 April 2013 Temperature and Precipitation Summary April 1 st 16 th : The first week of April featured a ridge of high pressure over
5.1 THE GEM (GENERATION OF WEATHER ELEMENTS FOR MULTIPLE APPLICATIONS) WEATHER SIMULATION MODEL
 WEATHER SIMULATION MODEL") 5.1 THE GEM (GENERATION OF WEATHER ELEMENTS FOR MULTIPLE APPLICATIONS) WEATHER SIMULATION MODEL Clayton L. Hanson*, Gregory L. Johnson, and W illiam L. Frymire U. S. Department of Agriculture, Agricultural
5.1 THE GEM (GENERATION OF WEATHER ELEMENTS FOR MULTIPLE APPLICATIONS) WEATHER SIMULATION MODEL Clayton L. Hanson*, Gregory L. Johnson, and W illiam L. Frymire U. S. Department of Agriculture, Agricultural
National Climatic Data Center DATA DOCUMENTATION FOR DATA SET 6406 (DSI-6406) ASOS SURFACE 1-MINUTE, PAGE 2 DATA. July 12, 2006
 ASOS SURFACE 1-MINUTE, PAGE 2 DATA. July 12, 2006") DATA DOCUMENTATION FOR DATA SET 6406 (DSI-6406) ASOS SURFACE 1-MINUTE, PAGE 2 DATA July 12, 2006 151 Patton Ave. Asheville, NC 28801-5001 USA Table of Contents Topic Page Number 1. Abstract... 3 2. Element
DATA DOCUMENTATION FOR DATA SET 6406 (DSI-6406) ASOS SURFACE 1-MINUTE, PAGE 2 DATA July 12, 2006 151 Patton Ave. Asheville, NC 28801-5001 USA Table of Contents Topic Page Number 1. Abstract... 3 2. Element
2003 Moisture Outlook
 2003 Moisture Outlook Nolan Doesken and Roger Pielke, Sr. Colorado Climate Center Prepared by Tara Green and Odie Bliss http://climate.atmos.colostate.edu Through 1999 Through 1999 Fort Collins Total Water
Extremes analysis: the. ETCCDI twopronged
 Manola Brunet University Rovira i Virgili, Tarragona, Catalonia Extremes analysis: the Title ETCCDI twopronged approach 5 December 2017 Fourth Session of the ETCCDI, Victoria, Feb 2011 The role of the
NIDIS Intermountain West Regional Drought Early Warning System February 7, 2017
 NIDIS Drought and Water Assessment NIDIS Intermountain West Regional Drought Early Warning System February 7, 2017 Precipitation The images above use daily precipitation statistics from NWS COOP, CoCoRaHS,
J8.4 TRENDS OF U.S. SNOWFALL AND SNOW COVER IN A WARMING WORLD,
 J8.4 TRENDS OF U.S. SNOWFALL AND SNOW COVER IN A WARMING WORLD, 1948-2008 Richard R. Heim Jr. * NOAA National Climatic Data Center, Asheville, North Carolina 1. Introduction The Intergovernmental Panel
Arizona Climate Summary November 2013
 Arizona Climate Summary November 2013 Summary of conditions for October 2013 October 2013 Temperature and Precipitation Summary October 1 st 16 th : The month of October started off with fair weather conditions
Arizona Climate Summary
 Arizona Climate Summary April 2014 Summary of conditions for March 2014 March 2014 Temperature and Precipitation Summary March 1 st 16 th : We started off the month of March with a significant precipitation
Average Weather In March For Fukuoka, Japan
 Average Weather In March For Fukuoka, Japan Location This report describes the typical weather at the Fukuoka Airport (Fukuoka, Japan) weather station over the course of an average March. It is based on
NIDIS Intermountain West Drought Early Warning System April 18, 2017
 1 of 11 4/18/2017 3:42 PM Precipitation NIDIS Intermountain West Drought Early Warning System April 18, 2017 The images above use daily precipitation statistics from NWS COOP, CoCoRaHS, and CoAgMet stations.
Colorado State University, Fort Collins, CO Weather Station Monthly Summary Report
 Colorado State University, Fort Collins, CO Weather Station Monthly Summary Report Month: December Year: 2017 Temperature: Mean T max was 47.2 F which is 4.4 above the 1981-2010 normal for the month. This
Homogenization of the Hellenic cloud amount time series
 Homogenization of the Hellenic cloud amount time series A Argiriou 1, A Mamara 2, E Dimadis 1 1 Laboratory of Atmospheric Physics, 2 Hellenic Meteorological Service October 19, 2017 A Argiriou 1, A Mamara