GIS Tools, Data, & Methods in the Weekly US Drought Monitor
|
|
|
- Jasmin Lindsey
- 5 years ago
- Views:
Transcription
1 GIS Tools, Data, & Methods in the Weekly US Drought Monitor International Workshop on Agromet and GIS Applications for Agricultural Decision Making Jeju, South Korea December 5, 2016 Eric Luebehusen USDA/OCE/WAOB Meteorologist USDM Author
2
3 The US Drought Monitor didn t always look like this

.")
4 May, The very first U.S. Drought Monitor!! It was experimental, and developed partially in response to intensifying dryness in the eastern U.S. The map was created in CorelDRAW (basic drawing software). A trip down memory lane

5 July 7, 1999 (Experimental) Switched map to U.S. only

6 Aug 11, 1999 (Experimental) This week s map was presented to senior-level government officials at a White House Briefing. They liked it so much

7 Aug 18, 1999 (Operational!) The following week, it went operational, making this the first official U.S. Drought Monitor! This might have been the fastest Experimental to Operational product in government history!


8 September 7, 1999 Layout adjusted, still 2 colors

9 September 15, 1999 Final 5-color scheme employed

10 8.2 August, 2003 USDM goes GIS

11 August 12, 2008 My 1 st USDM!
12 2008-Current GIS Wx/Hydro data used to aid Dx depiction
13 2013 National Drought Mitigation Center became central agency for final map production and QC

14 Late 2013 NDMC changed the final map layout
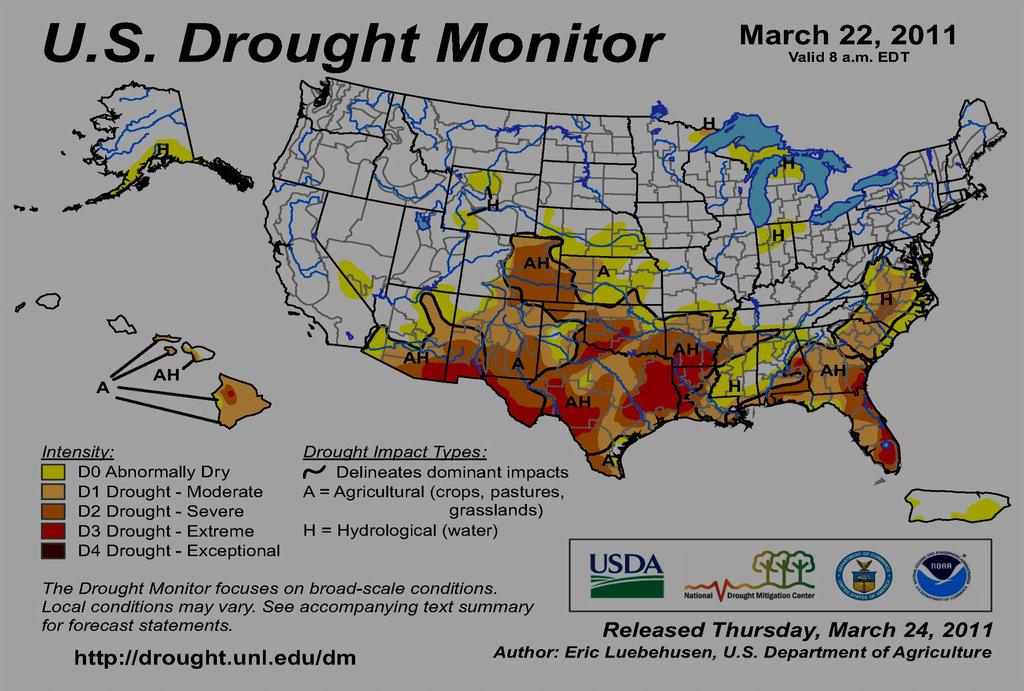
15 And today s US Drought Monitor
16 What makes a drought D1, D2, D3, or D4?

.")

17 Drought Category Color Frequency Pctile D4, Exceptional Drought: once per years 0-2 D3, Extreme Drought: once per years 2-5 D2, Severe Drought: once per years 5-10 D1, Moderate Drought: once per 5-10 years D0, Abnormally Dry: once per 3-5 years The drought categories are associated with historical occurrence/likelihood (percentile ranking). This allows us to quantify the drought with objective drought indicators It is not anecdotal or subjective, like It s really, really dry!! or I don t remember it ever being this dry we have to be D4!!!

18 The drought monitor is created/edited in ArcMap GIS.
19 There are 5 separate drought shapefiles which we edit; they are overlaid on top of each other to give the illusion of one drought map.
20 One big advantage of editing the drought areas in GIS is the wealth of weather and hydrological data also available in GIS format; we can bring the data directly into the Drought Monitor to assist with the final drought depiction.


21 Before GIS, authors had to manually triangulate everything.
 in August, 2003. 8.2")
22 Initially, there was not much change in the USDM when authors switched from Corel Draw to ArcMap (GIS) in August,

23 July 16, 2002 November 1, But now, with new GIS data and methods, drought depiction shows considerable increase in detail. Note the Southeastern U.S. drought, then (before GIS) and now.
24 ools, Data, and Methodology

25 This increased drought depiction detail has been made possible by a wide array of hydrological and meteorological data in GIS, spearheaded by efforts at USDA. Here, my USDM GIS editor project shows the wealth of weather and hydrological GIS data available we currently use.
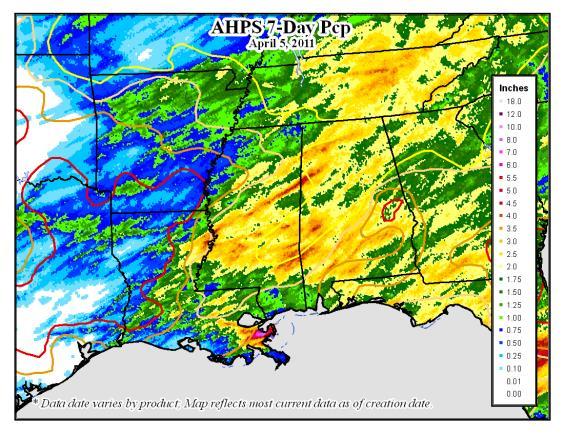
26 The U.S. NWS provides gridded radar-based precipitation data (AHPS -Advanced Hydrologic Prediction Service), which is available for GIS applications. What is shown here is a Geotiff, created in-house. The raw data is in DBF format and takes a considerable amount of time to download & display
27 The raw DBF data looks similar, but is comprised of thousands of individual points. USDM authors were handicapped by this data format.
28 The raw DBF data looks similar, but is comprised of thousands of individual points. USDM authors were handicapped by this data format.
29 The raw DBF data looks similar, but is comprised of thousands of individual points. USDM authors were handicapped by this data format.
30 The raw DBF data looks similar, but is comprised of thousands of individual points. USDM authors were handicapped by this data format.
31 The raw DBF data looks similar, but is comprised of thousands of individual points. USDM authors were handicapped by this data format.
32 The raw DBF data looks similar, but is comprised of thousands of individual points. USDM authors were handicapped by this data format.
33 The raw DBF data looks similar, but is comprised of thousands of individual points. USDM authors were handicapped by this data format.
34 The raw DBF data looks similar, but is comprised of thousands of individual points. USDM authors were handicapped by this data format.
35 The raw DBF data looks similar, but is comprised of thousands of individual points. USDM authors were handicapped by this data format.
36 The raw DBF data looks similar, but is comprised of thousands of individual points. USDM authors were handicapped by this data format.
37 The raw DBF data looks similar, but is comprised of thousands of individual points. USDM authors were handicapped by this data format.
38 The raw DBF data looks similar, but is comprised of thousands of individual points. USDM authors were handicapped by this data format.
39 The raw DBF data looks similar, but is comprised of thousands of individual points. USDM authors were handicapped by this data format.
40 The raw DBF data looks similar, but is comprised of thousands of individual points. USDM authors were handicapped by this data format.

41 The raw DBF data looks similar, but is comprised of thousands of individual points. USDM authors were handicapped by this data format.
42 The raw DBF data looks similar, but is comprised of thousands of individual points. USDM authors were handicapped by this data format.


43 To make the data load and display quickly, we convert it from DBF to Geotiff using Python scripts. This is a 2-step process


44 Wget We use a Windows Scheduler to launch Wget Code, which downloads the raw DBF data from the web to our server. Wget


45 DBF Geotiff Python Using the same Windows Scheduler, we run Python code to convert the DBF data to geotiff. Python
46 Wget The pairing of Wget & Python allows our small group at USDA to download and process thousands of data files daily, and is vital to our operations. Python


47 In the drought GIS application, a fast-loading, easy-to-use GIS precipitation data source in Geotiff format is essential. AHPS gridded radar-based precipitation data ACIS station-based precipitation data

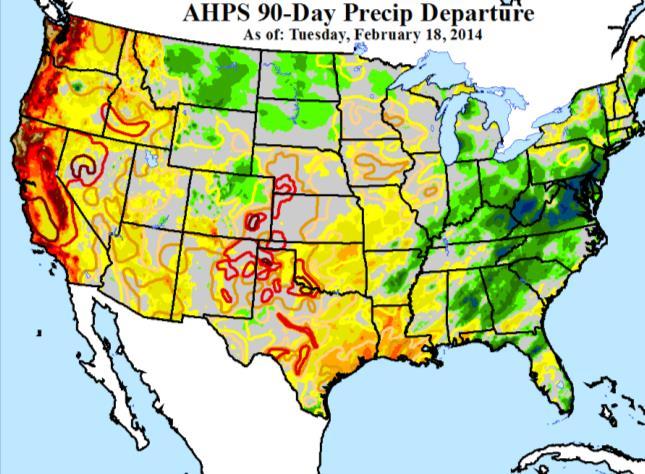
48 The NWS uses gridded PRISM Normals to provide Precipitation Departures as well. AHPS gridded radar-based precipitation data ACIS station-based precipitation data


49 AHPS gridded radar-based precipitation data ACIS station-based precipitation data Another product which gets a great deal of attention and airplay within the drought community is the Percent of Normal Precipitation. All of these precipitation products are available over several time frames.


50 The gridded precipitation product based primarily on radar data provides great detail. But, we still use in-situ measurements to assess drought conditions. AHPS gridded radar-based precipitation data ACIS station-based precipitation data


51 AHPS gridded radar-based precipitation data ACIS station-based precipitation data We bring in station data covering the same parameter and time period to quality control the gridded data and further support our drought depiction.

52 The ACIS station data (ACIS Applied Climate Information System) is essential to our GIS efforts. To get this station data into GIS involves several steps, all of which are now automated AHPS gridded radar-based precipitation data ACIS station-based precipitation data

53 Wget We use Wget to download the raw data files to our server. wget -O Y:\DATA\current_pcpsmry.txt Y:\DroughtMonitor\DATA\STATION-TEXT\current_pcpsmry.txt
")


54 Raw Data (linked & auto-updates) We use Excel to Import the raw data and Convert it for GIS. GIS-ready data (linked to Raw Data )


55 ArcMAP points to the GIS-ready Excel Sheet. Once the Symbology is set, the updated data displays as the Excel Sheet is updated, saved, and closed. The down side to GIS Excel: Only 1 instance of any given Excel data sheet can be open at a time.

56 Percent of normal rainfall data is great but how do we convert this to a drought category?? AHPS gridded radar-based precipitation data ACIS station-based precipitation data


57 This is accomplished thru the Standardized Precipitation Index (SPI). This puts the precipitation into a historical distribution, which is associated with the corresponding percentile and drought category. This data is supplied in Shapefile format and is easy to work with. D0 D1 D2 AHPS gridded radar-based precipitation data ACIS station-based precipitation data D3 D4


58 And like the station data, we also have a gridded SPI to use for our drought work. This data is produced (by NC State, R. Ward, et al) in Geotiff format, making it much easier to work with. AHPS gridded radar-based precipitation data ACIS station-based precipitation data

59 There is also a gridded SPEI, which accounts for temperature and evaporative losses, for our drought work. This data is produced in Geotiff format as well, though we are using it with caution. AHPS gridded radar-based precipitation data ACIS station-based precipitation data


60 Data provided by USGS in shapefile format In-situ data also includes streamflow percentiles from the U.S. Geological Survey. Streamflows are a good early indicator of developing drought and impacts.
 Data converted using")


61 Data provided by USDA/NRCS (csv) and CA Dept of Water Resources (web -> Excel Table) Data converted using Excel and linked to GIS Drought in the western U.S. operates on much longer time scales and having a strong seasonal component. At USDA, we are downloading, converting, and plotting the monthly reservoir data in GIS.


62 Data provided by USDA/NRCS (csv) and linked directly to GIS The western U.S. relies heavily on spring snowmelt for water, so we monitor the snowpack during the course of the cold season.


.")
63 The USDM authors use a large amount of derived data to help with the drought work. Here, the weekly satellitederived Vegetation Health Index is shown, courtesy of Dr. Felix Kogan, et NOAA/NESDIS (geotiff). Data provided weekly by NOAA/NESDIS in geotiff format
.")
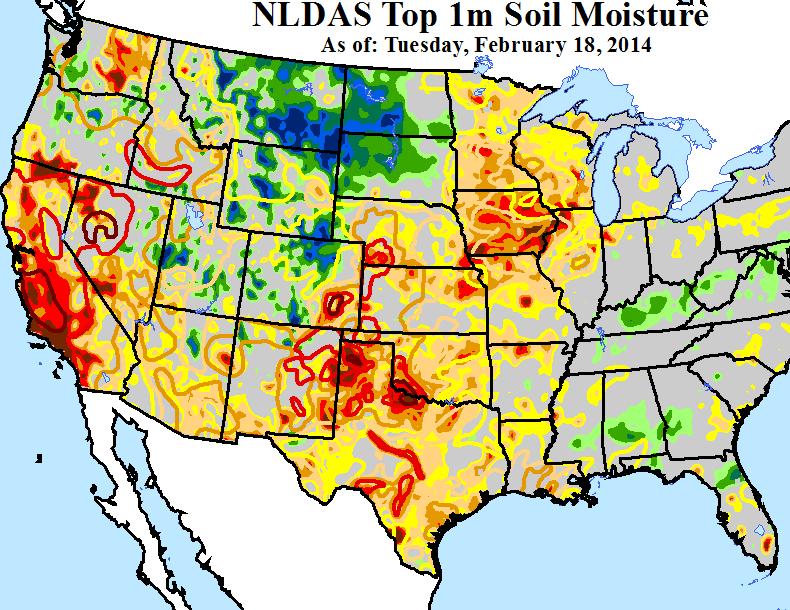
64 We don t have a nation-wide network of uniform soil moisture sensors, so we rely on modeled soil moisture (available as a Geotiff). Data provided daily by NOAA/EMC
. Data provided weekly by NOAA/CDC in ascii format")
65 Other products are coming online for US Drought Monitor authors to evaluate, such as the Evaporative Stress Index (ESI). Data provided weekly by NOAA/CDC in ascii format
66
67 If you ve ever edited shapefiles in GIS, you know it can be a very difficult task. What follows is a very brief sample of how we do it

68 I recently demonstrated on an USDA Webinar the thankless task of editing shapefiles (in super-fast motion!)
69 This is a rapid-fire tour!

70 This is a rapid-fire tour! Each week takes ~ hours of your time when authoring.
71
72 GIS has not just made the map more accurate and detailed, but there are also a host of secondary derived products using the GIS data.

73 At USDA, Harlan Shannon has been producing crops in drought products since Here, wheat areas in drought is shown.
 and by state (bottom")
74 Harlan also extracts the data by date (top left) and by state (bottom right)
75 The ability to extract county-level drought information has also led USDA s Farm Service Agency to use the USDM as a tool for triggering financial aid to producers.


76 This has been a source of much angst and stress for USDM authors. You ll see why on the next slide. Using GIS, FSA determines whether any part of a county is touched by the corresponding trigger (primary counties); adjacent counties are included as a buffer. 8 consecutive weeks 1 week 1 week
77 Nearly $6 billion dollars in payouts since Does not include this year s figures.


78 The National Drought Mitigation Center has likewise taken GIS data and developed web pages for regional-, state-, and county-level data extraction.
79 ools, Data, and Methodology
80 As the data, methodology, expertise, and process have evolved, so has the U.S. Drought Monitor. GIS has been a BIG part of this evolution.
81 It can be a thankless job at times, but a learning experience on many levels. Assessing the drought on a weekly basis involves countless hours of the 11 volunteer authors, hundreds of local and regional experts, and GIS data and software.
82 July 16, 2002 November 1, GIS has made our drought work more detailed and accurate, though the amount of data at times can be too much of a good thing!
83 Eric Luebehusen USDA/OCE/WAOB Meteorologist USDM Author
USDA s Operational GIS & related processes for International Weather & Crop Assessements
 USDA s Operational GIS & related processes for International Weather & Crop Assessements International Workshop on Agromet and GIS Applications for Agricultural Decision Making Jeju, South Korea December
The U.S. Drought Monitor and tools from the National Drought Mitigation Center
 The U.S. Drought Monitor and tools from the National Drought Mitigation Center Brian Fuchs, Climatologist National Drought Mitigation Center School of Natural Resources University of Nebraska-Lincoln Winter
The U.S. Drought Monitor: Parameters, People, Process, Policy
 The U.S. Drought Monitor: Parameters, People, Process, Policy Mark Svoboda, Climatologist Monitoring Program Area Leader National Drought Mitigation Center School of Natural Resources University of Nebraska-Lincoln
The United States Drought Monitor How is it Made?
 The United States Drought Monitor How is it Made? Brian Fuchs, Climatologist National Drought Mitigation Center School of Natural Resources University of Nebraska-Lincoln September 14-17, 2009 Bamako,
NIDIS Intermountain West Drought Early Warning System September 4, 2018
 NIDIS Drought and Water Assessment NIDIS Intermountain West Drought Early Warning System September 4, 2018 Precipitation The images above use daily precipitation statistics from NWS COOP, CoCoRaHS, and
NIDIS Intermountain West Drought Early Warning System January 16, 2018
 NIDIS Drought and Water Assessment NIDIS Intermountain West Drought Early Warning System January 16, 2018 Precipitation The images above use daily precipitation statistics from NWS COOP, CoCoRaHS, and
The History and Making of the U.S. Drought Monitor
 The History and Making of the U.S. Drought Monitor Mike Hayes, Director Mark Svoboda, Climatologist/Monitoring Program Area Leader Kelly Smith, Communications Specialist National Drought Mitigation Center
NIDIS Intermountain West Drought Early Warning System May 23, 2017
 NIDIS Drought and Water Assessment NIDIS Intermountain West Drought Early Warning System May 23, 2017 Precipitation The images above use daily precipitation statistics from NWS COOP, CoCoRaHS, and CoAgMet
The U.S. Drought Monitor: A Composite Indicator Approach
 The U.S. Drought Monitor: A Composite Indicator Approach Mark Svoboda, Climatologist Monitoring Program Area Leader National Drought Mitigation Center School of Natural Resources University of Nebraska-Lincoln
NIDIS Intermountain West Drought Early Warning System November 13, 2018
 NIDIS Intermountain West Drought Early Warning System November 13, 2018 Precipitation The images above use daily precipitation statistics from NWS COOP, CoCoRaHS, and CoAgMet stations. From top to bottom,
NIDIS Intermountain West Drought Early Warning System October 17, 2017
 NIDIS Drought and Water Assessment NIDIS Intermountain West Drought Early Warning System October 17, 2017 Precipitation The images above use daily precipitation statistics from NWS COOP, CoCoRaHS, and
NIDIS Intermountain West Drought Early Warning System December 18, 2018
 NIDIS Intermountain West Drought Early Warning System December 18, 2018 Precipitation The images above use daily precipitation statistics from NWS COOP, CoCoRaHS, and CoAgMet stations. From top to bottom,
NIDIS Intermountain West Drought Early Warning System May 1, 2018
 NIDIS Intermountain West Drought Early Warning System May 1, 2018 Precipitation The images above use daily precipitation statistics from NWS COOP, CoCoRaHS, and CoAgMet stations. From top to bottom, and
NIDIS Intermountain West Drought Early Warning System August 8, 2017
 NIDIS Drought and Water Assessment 8/8/17, 4:43 PM NIDIS Intermountain West Drought Early Warning System August 8, 2017 Precipitation The images above use daily precipitation statistics from NWS COOP,
NIDIS Intermountain West Drought Early Warning System February 12, 2019
 NIDIS Intermountain West Drought Early Warning System February 12, 2019 Precipitation The images above use daily precipitation statistics from NWS COOP, CoCoRaHS, and CoAgMet stations. From top to bottom,
NIDIS Intermountain West Drought Early Warning System December 11, 2018
 NIDIS Drought and Water Assessment NIDIS Intermountain West Drought Early Warning System December 11, 2018 Precipitation The images above use daily precipitation statistics from NWS COOP, CoCoRaHS, and
NIDIS Intermountain West Drought Early Warning System July 18, 2017
 NIDIS Drought and Water Assessment NIDIS Intermountain West Drought Early Warning System July 18, 2017 Precipitation The images above use daily precipitation statistics from NWS COOP, CoCoRaHS, and CoAgMet
NIDIS Intermountain West Drought Early Warning System February 6, 2018
 NIDIS Intermountain West Drought Early Warning System February 6, 2018 Precipitation The images above use daily precipitation statistics from NWS COOP, CoCoRaHS, and CoAgMet stations. From top to bottom,
NIDIS Intermountain West Drought Early Warning System November 14, 2017
 NIDIS Intermountain West Drought Early Warning System November 14, 2017 Precipitation The images above use daily precipitation statistics from NWS COOP, CoCoRaHS, and CoAgMet stations. From top to bottom,
The U.S. Drought Monitor: A Composite Indicator Approach
 The U.S. Drought Monitor: A Composite Indicator Approach Mark Svoboda, Climatologist Monitoring Program Area Leader National Drought Mitigation Center University of Nebraska-Lincoln NWS IN Climate Services
NIDIS Intermountain West Drought Early Warning System April 18, 2017
 1 of 11 4/18/2017 3:42 PM Precipitation NIDIS Intermountain West Drought Early Warning System April 18, 2017 The images above use daily precipitation statistics from NWS COOP, CoCoRaHS, and CoAgMet stations.
NIDIS Intermountain West Drought Early Warning System March 26, 2019
 NIDIS Intermountain West Drought Early Warning System March 26, 2019 The images above use daily precipitation statistics from NWS COOP, CoCoRaHS, and CoAgMet stations. From top to bottom, and left to right:
Current Water Conditions in Massachusetts January 11, 2008
 Current Water Conditions in Massachusetts January 11, 2008 December precipitation was above normal December streamflows were below normal and normal December ground-water levels were below normal and normal
NIDIS Intermountain West Drought Early Warning System January 15, 2019
 NIDIS Drought and Water Assessment NIDIS Intermountain West Drought Early Warning System January 15, 2019 Precipitation The images above use daily precipitation statistics from NWS COOP, CoCoRaHS, and
NIDIS Intermountain West Drought Early Warning System October 30, 2018
 10/30/2018 NIDIS Drought and Water Assessment NIDIS Intermountain West Drought Early Warning System October 30, 2018 Precipitation The images above use daily precipitation statistics from NWS COOP, CoCoRaHS,
National Drought Mitigation Center. Drought Services: Collaborative Efforts Towards Drought Early Warning and Information Systems
 National Drought Mitigation Center Drought Services: Collaborative Efforts Towards Drought Early Warning and Information Systems Mark Svoboda, Climatologist Monitoring Program Area Leader National Drought
NIDIS Intermountain West Drought Early Warning System January 22, 2019
 NIDIS Drought and Water Assessment NIDIS Intermountain West Drought Early Warning System January 22, 2019 Precipitation The images above use daily precipitation statistics from NWS COOP, CoCoRaHS, and
NIDIS Intermountain West Drought Early Warning System December 30, 2018
 1/2/2019 NIDIS Drought and Water Assessment NIDIS Intermountain West Drought Early Warning System December 30, 2018 Precipitation The images above use daily precipitation statistics from NWS COOP, CoCoRaHS,
NIDIS Intermountain West Drought Early Warning System April 16, 2019
 NIDIS Intermountain West Drought Early Warning System April 16, 2019 Precipitation The images above use daily precipitation statistics from NWS COOP, CoCoRaHS, and CoAgMet stations. From top to bottom,
NIDIS Intermountain West Drought Early Warning System November 21, 2017
 NIDIS Drought and Water Assessment NIDIS Intermountain West Drought Early Warning System November 21, 2017 Precipitation The images above use daily precipitation statistics from NWS COOP, CoCoRaHS, and
Using ArcGIS 10 to Estimate the U.S. Population Affected by Drought
 Using ArcGIS 10 to Estimate the U.S. Population Affected by Drought Jeff Nothwehr National Drought Mitigation Center University of Nebraska-Lincoln Overview What is the U.S. Drought Monitor Mapping Process
Precipitation. Standardized Precipitation Index. NIDIS Intermountain West Drought Early Warning System September 5, 2017
 9/6/2017 NIDIS Drought and Water Assessment NIDIS Intermountain West Drought Early Warning System September 5, 2017 Precipitation The images above use daily precipitation statistics from NWS COOP, CoCoRaHS,
NIDIS Intermountain West Regional Drought Early Warning System February 7, 2017
 NIDIS Drought and Water Assessment NIDIS Intermountain West Regional Drought Early Warning System February 7, 2017 Precipitation The images above use daily precipitation statistics from NWS COOP, CoCoRaHS,
Climate Information for Managing Risk. Victor Murphy NWS Southern Region Climate Service Program Mgr. June 12, 2008
 Climate Information for Managing Risk Victor Murphy Climate Service Program Mgr. June 12, 2008 Currently From Fort Worth, TX but climate challenges abound everywhere as does the need to mitigate impacts
NATIONAL HYDROPOWER ASSOCIATION MEETING. December 3, 2008 Birmingham Alabama. Roger McNeil Service Hydrologist NWS Birmingham Alabama
 NATIONAL HYDROPOWER ASSOCIATION MEETING December 3, 2008 Birmingham Alabama Roger McNeil Service Hydrologist NWS Birmingham Alabama There are three commonly described types of Drought: Meteorological drought
Precipitation. Standardized Precipitation Index. NIDIS Intermountain West Regional Drought Early Warning System January 3, 2017
 1/3/2017 NIDIS Drought and Water Assessment NIDIS Intermountain West Regional Drought Early Warning System January 3, 2017 Precipitation The images above use daily precipitation statistics from NWS COOP,
NIDIS Drought and Water Assessment
 NIDIS Drought and Water Assessment PRECIPITATION The images above use daily precipitation statistics from NWS COOP, CoCoRaHS, and CoAgMet stations. From top to bottom, and left to right: most recent 7-days
Drought and Climate Extremes Indices for the North American Drought Monitor and North America Climate Extremes Monitoring System. Richard R. Heim Jr.
 Drought and Climate Extremes Indices for the North American Drought Monitor and North America Climate Extremes Monitoring System Richard R. Heim Jr. NOAA/NESDIS/National Climatic Data Center Asheville,
The North American Drought Monitor - The Canadian Perspective -
 The North American Drought Monitor - The Canadian Perspective - Trevor Hadwen National Agroclimate Information Service AAFC-PFRA, Regina Canmore, Alberta March 16-18, 2008 Background The NADM is a cooperative
Condition Monitoring: A New System for Drought Impacts Reporting through CoCoRaHS
 Condition Monitoring: A New System for Drought Impacts Reporting through CoCoRaHS Amanda Farris Carolinas Integrated Sciences & Assessments (CISA) University of South Carolina WERA 1012 Annual Conference
Water Availability in Alaska: Using and Understanding NOAA s Drought Monitor and Drought Outlook
 Water Availability in Alaska: Using and Understanding NOAA s Drought Monitor and Drought Outlook Douglas Le Comte,, Drought Specialist, NOAA/NWS/Climate Prediction Center June 10, 2008 Water is Important
Precipitation. Standardized Precipitation Index. NIDIS Intermountain West Regional Drought Early Warning System December 6, 2016
 12/9/2016 NIDIS Drought and Water Assessment NIDIS Intermountain West Regional Drought Early Warning System December 6, 2016 Precipitation The images above use daily precipitation statistics from NWS COOP,
NIDIS Intermountain West Drought Early Warning System February 19, 2019
 NIDIS Intermountain West Drought Early Warning System February 19, 2019 Precipitation The images above use daily precipitation statistics from NWS COOP, CoCoRaHS, and CoAgMet stations. From top to bottom,
Funding provided by NOAA Sectoral Applications Research Project MONITORING DROUGHT. Basic Climatology Colorado Climate Center
 Funding provided by NOAA Sectoral Applications Research Project MONITORING DROUGHT Basic Climatology Colorado Climate Center DEFINING DROUGHT First off, just what is drought? Define a tornado Define a
January 25, Summary
 January 25, 2013 Summary Precipitation since the December 17, 2012, Drought Update has been slightly below average in parts of central and northern Illinois and above average in southern Illinois. Soil
Applications/Users for Improved S2S Forecasts
 Applications/Users for Improved S2S Forecasts Nolan Doesken Colorado Climate Center Colorado State University WSWC Precipitation Forecasting Workshop June 7-9, 2016 San Diego, CA First -- A short background
High Resolution Indicators for Local Drought Monitoring
 High Resolution Indicators for Local Drought Monitoring REBECCA CUMBIE, STATE CLIMATE OFFICE OF NC, NCSU Monitoring Drought Multiple indicators, multiple sources Local detail important 1 Point-Based Climate-Division
Historical Drought Analysis for: Oklahoma Panhandle, Climate Division 8
 Historical Drought Analysis for: Oklahoma Panhandle, Climate Division 8 Irenea Lodangco, Rachel Riley & Gina Fujan University of Oklahoma Prepared by the Southern Climate Impacts Planning Program, November
Historical Drought Analysis for: East Central Oklahoma, Climate Division 6
 Historical Drought Analysis for: East Central Oklahoma, Climate Division 6 Irenea Lodangco, Rachel Riley & Gina Fujan University of Oklahoma Prepared by the Southern Climate Impacts Planning Program November
Indices and Indicators for Drought Early Warning
 Indices and Indicators for Drought Early Warning ADRIAN TROTMAN CHIEF, APPLIED METEOROLOGY AND CLIMATOLOGY CARIBBEAN INSTITUTE FOR METEOROLOGY AND HYDROLOGY IN COLLABORATION WITH THE NATIONAL DROUGHT MITIGATION
HIGHLIGHTS. Selected stations in eight parishes received below-normal rainfall in November.
 AGROMET BULLETIN Volume 6. No. 11 November 2018 Weather Summary November 2018 HIGHLIGHTS Selected stations in eight parishes received below-normal rainfall in November. Drier conditions were noticeable
CoCoRaHS and the Drought Monitor (Help us help you!) Colorado Climate Center
 Colorado Climate Center") CoCoRaHS and the Drought Monitor (Help us help you!) Colorado Climate Center Anybody bring a rain gauge?! A sight for sore eyes The Community Collaborative Rain, Hail, and Snow (CoCoRaHS) networks is a
CoCoRaHS and the Drought Monitor (Help us help you!) Colorado Climate Center Anybody bring a rain gauge?! A sight for sore eyes The Community Collaborative Rain, Hail, and Snow (CoCoRaHS) networks is a
NIDIS Intermountain West Drought Early Warning System December 4, 2018
 12/4/2018 NIDIS Drought and Water Assessment NIDIS Intermountain West Drought Early Warning System December 4, 2018 Precipitation The images above use daily precipitation statistics from NWS COOP, CoCoRaHS,
CARIWIN Regional Seminar January 14-15, 2010, Georgetown, Guyana
 Creating the North American Drought Monitor Angel (Bennett) McCoy Angel.M.Bennett@noaa.gov NOAA/Climate Prediction Center Camp Springs, Maryland, U.S.A. Doug LeComte NOAA/Climate Prediction Center Richard
Oregon Water Conditions Report April 17, 2017
 Oregon Water Conditions Report April 17, 2017 Mountain snowpack continues to maintain significant levels for mid-april. By late March, statewide snowpack had declined to 118 percent of normal after starting
NATIONAL WATER RESOURCES OUTLOOK
 NATIONAL WATER RESOURCES OUTLOOK American Meteorological Society Annual Meeting 24 th Hydrology Conference 9.2 James Noel Service Coordination Hydrologist National Weather Service-Ohio River Forecast Center
NIDIS Weekly Climate, Water and Drought Assessment Summary. Upper Colorado River Basin
 NIDIS Weekly Climate, Water and Drought Assessment Summary Upper Colorado River Basin August 3, 2010 Precipitation and Snowpack Fig. 1: July precipitation in inches Fig. 2: July precip as percent of average
HIGHLIGHTS. The majority of stations experienced above-normal rainfall in November.
 AGROMET BULLETIN Volume 5. No. 11 November 2017 HIGHLIGHTS The majority of stations experienced above-normal rainfall in November. Near-normal to above-normal rainfall is forecast for December through
Historical Drought Analysis for: Southwest Oklahoma, Climate Division 7
 Historical Drought Analysis for: Southwest Oklahoma, Climate Division 7 Irenea Lodangco, Rachel Riley & Gina Fujan University of Oklahoma Prepared by the Southern Climate Impacts Planning Program November
Upper Missouri River Basin December 2017 Calendar Year Runoff Forecast December 5, 2017
 Upper Missouri River Basin December 2017 Calendar Year Runoff Forecast December 5, 2017 Calendar Year Runoff Forecast Explanation and Purpose of Forecast U.S. Army Corps of Engineers, Northwestern Division
Improving Drought Forecasts: The Next Generation of Seasonal Outlooks
 Improving Drought Forecasts: The Next Generation of Seasonal Outlooks Douglas Le Comte, CPC Douglas.lecomte@noaa.gov Outline Review of how the current Drought Outlooks are made Sample experimental products
2002 Drought History in Colorado A Brief Summary
 1 2002 Drought History in Colorado A Brief Summary Colorado Climate Center Roger Pielke, Sr, Director and Nolan Doesken, Research Associate Prepared by Odie Bliss & Tara Green http://climate.atmos.colostate.edu
Michael B. Ek 1, Youlong Xia 1,2, Jesse Meng 1,2, and Jiarui Dong 1,2
 Michael B. Ek 1, Youlong Xia 1,2, Jesse Meng 1,2, and Jiarui Dong 1,2 1 Land-Hydrology Team Environmental Modeling Center (EMC) National Centers for Environmental Prediction (NCEP) National Weather Service
Historical Drought Analysis for: Northeast Oklahoma, Climate Division 3
 Historical Drought Analysis for: Northeast Oklahoma, Climate Division 3 Irenea Lodangco, Rachel Riley & Gina Fujan University of Oklahoma Prepared by the Southern Climate Impacts Planning Program November
UNITED STATES AND SOUTH AMERICA OUTLOOK (FULL REPORT) Thursday, December 28, 2017
 Thursday, December 28, 2017") T-storm Weather Summary Despite scattered t-storms Sat.-Sun. in central and northern areas in Argentina, more will likely be needed especially in sunflower areas of the southwest. Some t-storms likely
T-storm Weather Summary Despite scattered t-storms Sat.-Sun. in central and northern areas in Argentina, more will likely be needed especially in sunflower areas of the southwest. Some t-storms likely
Arizona Drought Monitoring Sensitivity and Verification Analyses
 Arizona Drought Monitoring Sensitivity and Verification Analyses A Water Sustainability Institute, Technology and Research Initiative Fund Project Christopher L. Castro, Francina Dominguez, Stephen Bieda
What Can Citizen Scientists Tell Us about Drought?
 What Can Citizen Scientists Tell Us about Drought? Using CoCoRaHS to Improve the Monitoring and Reporting of Drought Impacts Amanda Farris, Kirsten Lackstrom Carolinas Integrated Sciences & Assessments
UNITED STATES AND SOUTH AMERICA OUTLOOK (FULL REPORT) Wednesday, April 18, 2018
 Wednesday, April 18, 2018") T-storm Weather Summary Coolness continues over the next week in much of the central U.S., most likely producing the coldest April since 1907 in the Corn Belt, but followed by seasonable to mild weather
T-storm Weather Summary Coolness continues over the next week in much of the central U.S., most likely producing the coldest April since 1907 in the Corn Belt, but followed by seasonable to mild weather
Water Supply Conditions and Outlook June 4, 2018
 Water Supply Conditions and Outlook June 4, 2018 Flow Forecasting & Operations Planning Water Security Agency Overview Water supply conditions across Saskatchewan are generally good with most reservoir
The Colorado Drought : 2003: A Growing Concern. Roger Pielke, Sr. Colorado Climate Center.
 The Colorado Drought 2001-2003: 2003: A Growing Concern Roger Pielke, Sr. Colorado Climate Center Prepared by Tara Green and Odie Bliss http://climate.atmos.colostate.edu 2 2002 Drought History in Colorado
Wind River Indian Reservation and Surrounding Area Climate and Drought Summary
 Northern Arapaho Tribe Wind River Indian Reservation and Surrounding Area Climate and Drought Summary Spring Events & Summer Outlook 2015 Spring Was Warm And Very Wet Across The Region The spring season
Improving Understanding of Drought Impacts through Citizen Science
 Improving Understanding of Drought Impacts through Citizen Science Amanda Brennan, Janae Davis, Kirstin Dow, Kirsten Lackstrom, Sumi Selvaraj North Carolina Water Resources Research Institute Annual Meeting
Wind River Indian Reservation and Surrounding Area Climate and Drought Summary
 Northern Arapaho Tribe Wind River Indian Reservation and Surrounding Area Climate and Drought Summary Summer Events & Fall Outlook 2015 Summer Was Near, Precipitation Was Highly Variable Across The Region
4) At the end of this presentation we have an operator that will organize the Q & A s.
 At the end of this presentation we have an operator that will organize the Q & A s.") Hello and welcome to the next in a series of Missouri Basin specific climate outlook Webinars 2011-2012. My name is Dennis Todey and I am the State Climatologist for the State of South Dakota. We are taking
Hello and welcome to the next in a series of Missouri Basin specific climate outlook Webinars 2011-2012. My name is Dennis Todey and I am the State Climatologist for the State of South Dakota. We are taking
Arizona Drought Monitoring Sensitivity and Verification Analyses Project Results and Future Directions
 Arizona Drought Monitoring Sensitivity and Verification Analyses Project Results and Future Directions A Water Sustainability Institute, Technology and Research Initiative Fund Project Christopher L. Castro,
NIDIS Intermountain West Drought Early Warning System April 24, 2018
 NIDIS Intermountain West Drought Early Warning System April 24, 2018 Precipitation The images above use daily precipitation statistics from NWS COOP, CoCoRaHS, and CoAgMet stations. From top to bottom,
Midwest and Great Plains Drought and Climate Summary 20 February 2014
 Midwest and Great Plains Drought and Climate Summary 20 February 2014 Wendy Ryan Assistant State Climatologist Colorado Climate Center Colorado State University wendy.ryan@colostate.edu 970-491-8506 General
Central Region Climate Outlook May 15, 2014
 Central Region Climate Outlook May 15, 2014 Dr. Jim Angel State Climatologist IL State Water Survey University of Illinois jimangel@illinois.edu 217-333-0729 Chicago-area flooding General Information Providing
Illinois Drought Update, December 1, 2005 DROUGHT RESPONSE TASK FORCE Illinois State Water Survey, Department of Natural Resources
 Illinois Drought Update, December 1, 2005 DROUGHT RESPONSE TASK FORCE Illinois State Water Survey, Department of Natural Resources For more drought information please go to http://www.sws.uiuc.edu/. SUMMARY.
USGS/EROS Accomplishments and Year 3 Plans. Enhancement of the U.S. Drought Monit Through the Integration of NASA Vegetation Index Imagery
 USGS/EROS Accomplishments and Year 3 Plans Enhancement of the U.S. Drought Monit Through the Integration of NASA Vegetation Index Imagery Jesslyn Brown Team Meeting, Austin, TX, 10/6/09 U.S. Department
AN INSIDE LOOK AT THE U.S. DROUGHT MONITOR
 AN INSIDE LOOK AT THE U.S. DROUGHT MONITOR Great Basin Climate Forum Desert Research Institute Reno, Nevada December 6, 2018 David B. Simeral U.S. Drought Monitor Author Associate Research Scientist -
NADM, NACEM, and Opportunities for Future Collaboration
 NADM, NACEM, and Opportunities for Future Collaboration Richard R. Heim Jr. NOAA/NESDIS/National Climatic Data Center Asheville, North Carolina, U.S.A. 4th Annual DRI Workshop 26-28 January 2009, Regina,
Brian McGurk, P.G. DEQ Office of Water Supply. Contents. Overview of Virginia s Drought Assessment & Response Plan
 Drought Preparedness in Virginia Or, Whatcha Gonna Do When the Well, Creek, River, or Reservoir (Might) Run Dry? Rappahannock-Rapidan Regional Commission Living Lands Workshop November 18, 2014 Brian McGurk,
Historical Drought Analysis for: Central Oklahoma, Climate Division 5
 Historical Drought Analysis for: Central Oklahoma, Climate Division 5 Irenea Lodangco, Rachel Riley & Gina Fujan University of Oklahoma Prepared by the Southern Climate Impacts Planning Program November
NIDIS Weekly Climate, Water and Drought Assessment Summary Upper Colorado River Basin Pilot Project 13 July 2010
 NIDIS Weekly Climate, Water and Drought Assessment Summary Upper Colorado River Basin Pilot Project 13 July 2010 Precipitation and Snowpack Over the past week, precipitation in the Upper Colorado River
UNITED STATES AND SOUTH AMERICA WEATHER ROUNDUP Sunday, December 17, 2017
 T-storm Weather Summary Extreme heat was followed by heavy rain in some key areas of Argentina yesterday. T-storms affect much of the driest Argentina, southern Brazil, and Paraguay through 7 to 10 days,
The National Integrated Drought Information System (NIDIS) Moving the Nation from Reactive to Proactive Drought Risk Management
 Moving the Nation from Reactive to Proactive Drought Risk Management") The National Integrated Drought Information System (NIDIS) Moving the Nation from Reactive to Proactive Drought Risk Management CSG-West Annual Meeting Agriculture & Water Committee Snowbird, UT September
The National Integrated Drought Information System (NIDIS) Moving the Nation from Reactive to Proactive Drought Risk Management CSG-West Annual Meeting Agriculture & Water Committee Snowbird, UT September
Extremes Events in Climate Change Projections Jana Sillmann
 Extremes Events in Climate Change Projections Jana Sillmann Max Planck Institute for Meteorology International Max Planck Research School on Earth System Modeling Temperature distribution IPCC (2001) Outline
November 2018 Weather Summary West Central Research and Outreach Center Morris, MN
 November 2018 Weather Summary Lower than normal temperatures occurred for the second month. The mean temperature for November was 22.7 F, which is 7.2 F below the average of 29.9 F (1886-2017). This November
The Colorado Drought of 2002 in Perspective
 The Colorado Drought of 2002 in Perspective Colorado Climate Center Nolan Doesken and Roger Pielke, Sr. Prepared by Tara Green and Odie Bliss http://climate.atmos.colostate.edu Known Characteristics of
Orange Visualization Tool (OVT) Manual
 Manual") Orange Visualization Tool (OVT) Manual This manual describes the features of the tool and how to use it. 1. Contents of the OVT Once the OVT is open (the first time it may take some seconds), it should
Orange Visualization Tool (OVT) Manual This manual describes the features of the tool and how to use it. 1. Contents of the OVT Once the OVT is open (the first time it may take some seconds), it should
WeatherManager Weekly
 Issue 288 July 14, 2016 WeatherManager Weekly Industries We Serve Agriculture Energy/Utilities Construction Transportation Retail Our Weather Protection Products Standard Temperature Products Lowest Daily
GIS at the Midwestern Regional Climate Center: A peek behind the curtain. Zoe Zaloudek, Geospatial Application Developer
 GIS at the Midwestern Regional Climate Center: A peek behind the curtain Zoe Zaloudek, Geospatial Application Developer CPASW, May 2018 What is the MRCC? GIS-based Maps and Products Regional Mesonet Program
Drought in Southeast Colorado
 Drought in Southeast Colorado Nolan Doesken and Roger Pielke, Sr. Colorado Climate Center Prepared by Tara Green and Odie Bliss http://climate.atmos.colostate.edu 1 Historical Perspective on Drought Tourism
Water Supply Conditions and Outlook October 1, 2018
 Water Supply Conditions and Outlook October 1, 2018 Flow Forecasting & Operations Planning Water Security Agency Overview Water supply conditions across Saskatchewan remain near normal, with most reservoirs
Office of the Washington State Climatologist
 Office of the Washington State Climatologist October 2017 Report and Outlook October 5, 2017 http://www.climate.washington.edu/ September Event Summary Average September temperatures were above normal
2012 Growing Season Weather Summary for North Dakota. Adnan Akyüz and Barbara A. Mullins Department of Soil Science October 30, 2012
 2012 Growing Season Weather Summary for North Dakota Adnan Akyüz and Barbara A. Mullins Department of Soil Science October 30, 2012 Introduction The 2012 growing season (the period from April through September)
-Assessment of current water conditions. - Precipitation Forecast. - Recommendations for Drought Monitor
 2 May 1 st, 2012 -Assessment of current water conditions - Precipitation Forecast - Recommendations for Drought Monitor AHPS Water Year Precipitation as Percentage of Normal 7-day average
Wind River Indian Reservation and Surrounding Area Climate and Drought Summary
 Northern Arapaho Tribe Wind River Indian Reservation and Surrounding Area Climate and Drought Summary Spring Events & Summer Outlook 2016 Wet Spring Leads To Flooding Spring was very wet across most of
History of California Drought
 History of California Drought 1 The Palmer drought index, sometimes called the Palmer drought severity index and often abbreviated PDSI, is a measurement of soil moisture based on recent precipitation