USDA s Operational GIS & related processes for International Weather & Crop Assessements
|
|
|
- Emery Blake
- 5 years ago
- Views:
Transcription

1 USDA s Operational GIS & related processes for International Weather & Crop Assessements International Workshop on Agromet and GIS Applications for Agricultural Decision Making Jeju, South Korea December 6, 2016 Eric Luebehusen USDA/OCE/WAOB Meteorologist
2 At the USDA-WAOB (), our focus is naturally on global weather and crop production.
3 My international AOR stretch from Europe and nrn Africa into Russia, Uzbekistan, and the Middle East.
4 A group of 5 meteorologists at USDA/WAOB covers the globe, including the U.S.

5 Our primary responsibility is to provide support for decisions related to the monthly release of the WASDE.


6 As a supplement to our support of the WASDE, we produce the Weekly Weather & Crop Bulletin in close coordination with NOAA/CPC. This covers the U.S. & international crop areas.
7 We also provide a detailed Weekly Weather Briefing every Thursday for Economists and other USDA staff to apprise them of the current developments. GIS is a big part of all these efforts.

8 USDA/WAOB has 2 USDM authors. USDA/WAOB staff implemented the 2003 USDM conversion to GIS, and since 2008 have spearheaded the ongoing effort to get weather and hydrological GIS data directly into the USDM editing process. This was discussed in greater detail yesterday.

9 Primary Data Source: WMO through NOAA/CPC
10 RegPlot* JAWFProb* Software for Data Management & Analysis *Software developed, updated, and maintained in-house.
11 RegPlot* JAWFProb* A quick look at our Oracle database, the backbone of our GIS work for the WAOB *Software developed, updated, and maintained in-house.
12 * Random sampling of available daily weather data An extensive network of WMO station data is downloaded from the U.S. NWS, Climate Prediction Center and housed at USDA in an Oracle database, accessible through GIS. We can not redistribute this data.
13 * Random sampling of available daily weather data In addition, we are also downloading other sources of in-situ data for our in-house database and GIS applications.
14 In Australia, the WMO station density is particularly poor in major southeastern Wheat areas.
 now downloads and saves data from COOP weather stations; WMO stations number in the hundreds, while")
15 Our Australia analyst (H. Shannon) now downloads and saves data from COOP weather stations; WMO stations number in the hundreds, while COOP stations number in the thousands. These data are added to the Oracle database daily.

16 Monsoon Seasonal Rainfall (% of Normal): June 1 September 23, 2015 Legend District-level rainfall data for India is downloaded for a more detailed analysis of the progress of the summer monsoon (B. Morris).
 are incorporated into the weekly rainfall")

17 Rain Gauge (900+) Supplemental data obtained by NWS-CPC from the Servicio Meteorológico Nacional (Mexico) are incorporated into the weekly rainfall chart created for the Weekly Weather and Crop Bulletin and are provided separately to USDA analysts for their analysis of crop weather impacts. (M. Brusberg) WMO (~70)

")

18 We likewise have discovered and use web-based services (such as OGIMET) to augment our GIS database & QC efforts.


19 Wget Like many of our operations, we schedule Wget to download this data to our database daily. Wget is essential to our operations.

20 10,000+ stations Dates back to GB of data and counting Additional SQL database server for domestic data
21 GIS with WMO Data at USDA OCE/WAOB

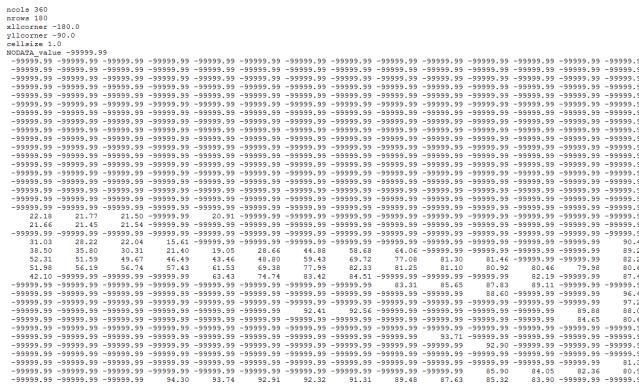
22 Python code runs automatically to interpolate the dbf data into a corresponding Geotiff. Files overwrite daily, weekly, and monthly, so as to not fill up the server. X:\Applications\Operational\AutoWxAnalysis\Current\WMO_Data.shp Python X:\Applications\Operational\AutoWxAnalysis\Current\Precip.tif Python


23 Taking it a step further, Python code is automatically run every day to create a series of pre-set maps for USDA meteorologists international areas of responsibility, covering daily, weekly, and monthly time periods. X:\Applications\Operational\AutoWxAnalysis\Current\Precip.tif Python Python

24 Automated GIS products allow 5 meteorologists at USDA to cover global weather and crop impacts for the. This effort includes weekly weather briefings for USDA staff; most of these maps are automatically produced using GIS and Python code.

25 In addition to the automated maps/products, macros/programs have been written to allow for interactive data extrapolation and interpretation within ArcMap for episodic events.

, and")
26 We augment our in-house WMO station dataset with gridded GIS data from the Global Precipitation Climatology Centre (GPCC), and produce concurrent maps with the WMO data.


27 Y:\GPCC\Monthly\CURRENT\1st-Guess\Current-Pcp.txt The process involves Wget to download ascii data, Python to convert to a geotiff, & Python to create the regional maps. Y:\GPCC\Monthly\CURRENT\1st-Guess\Current-Pcp.tif


28 To fully utilize GIS and the weather data, it is imperative to know where crops are grown; meteorologists at USDA/WAOB have downloaded and processed hundreds of crop production GIS dataset for international areas of responsibility.


29 Crop Calendars in GIS format (courtesy U. Wisc/SAGE) help USDA/WAOB further finetune our analyses by helping us estimate crop stage of development, a critical component to weather and yield/production impacts.
 is")


30 Global 4km VHI data (Geotiff) is downloaded automatically every Friday using Wget. Python code was written to compute the yearto-year change and create the maps which are then dropped onto our server.
 R 2 = 0.")

31 Based on 13 years of data ( ) Vegetation Health Index vs. Wheat Yields South Australia Yield (vs. trend) R 2 = 0.92 VHI data Week 41 (7 day period ending Oct 14) Note Prelim data available Oct 15 Final data available Nov 25 VHI filling Our Australia analyst (H. Shannon) has demonstrated a high degree of success using the VHI data (GIS) for estimating Australia wheat yields.


")

32 Knowing crop stage is vital to crop and weather assessments. Growing Degree Day crop stage estimates are mapped in GIS (top left) or plotted using the planting dates supplied in GIS format (right).

 in conjunction with the mean planting dates")
33 To further illustrate a recent detailed episodic assessment using GIS: Last year s extreme heat in Europe is plotted over the corn production data (below) in conjunction with the mean planting dates (right)


34 Corn planting ~ late April The combination of the following GIS data.. - Corn Areas - Planting Dates - Maximum Temperature with additional data analysis within Excel lets meteorologists at USDA provide timely weather/crop impact assessments. (100.4 F) (100.4 F) Tassel/Silk


.")

35 ftp://ftp.cpc.ncep.noaa.gov/fews/cmorph/tif/ We also download satellite-derived precipitation estimates (CMORPH) from the NWS Climate Prediction Center (geotiff). This data is run through Python code to automatically produce regional maps across the globe.
 developed Python code to create a blended precipitation product using CMORPH")
36 CMORPH Geotiff Python Blended Geotiff WMO Geotiff Our Asia analyst (B. Morris) developed Python code to create a blended precipitation product using CMORPH (satellite) and WMO (station) data.


37 More and more international GIS weather data/imagery is available through WMS, which we also use at USDA/WAOB for our daily operations.


38 In conclusion, a wide array of GIS data sources and approaches are employed at the USDA-WAOB. Automation of GIS data acquisition and processing is key. This allows a staff of 5 to cover global weather and crop impacts in a timely manner to support USDA s monthly market-sensitive report.
39 Eric Luebehusen USDA/OCE/WAOB Meteorologist USDM Author
GIS Tools, Data, & Methods in the Weekly US Drought Monitor
 GIS Tools, Data, & Methods in the Weekly US Drought Monitor International Workshop on Agromet and GIS Applications for Agricultural Decision Making Jeju, South Korea December 5, 2016 Eric Luebehusen USDA/OCE/WAOB
Drought and Climate Extremes Indices for the North American Drought Monitor and North America Climate Extremes Monitoring System. Richard R. Heim Jr.
 Drought and Climate Extremes Indices for the North American Drought Monitor and North America Climate Extremes Monitoring System Richard R. Heim Jr. NOAA/NESDIS/National Climatic Data Center Asheville,
An Overview of USAID / FEWS-NET Activities at CPC
 An Overview of USAID / FEWS-NET Activities at CPC Nick Novella 12, Wassila Thiaw 2, Tom Di Liberto 12, Vadlamani Kumar 12 Nicholas.Novella@noaa.gov 1 Wyle Information Systems, CPC/NCEP/NWS/NOAA 1 Climate
International Desks: African Training Desk and Projects
 The Climate Prediction Center International Desks: African Training Desk and Projects Wassila M. Thiaw Team Leader Climate Prediction Center National Centers for Environmental Predictions 1 African Desk
Jay Lawrimore NOAA National Climatic Data Center 9 October 2013
 Jay Lawrimore NOAA National Climatic Data Center 9 October 2013 Daily data GHCN-Daily as the GSN Archive Monthly data GHCN-Monthly and CLIMAT messages International Surface Temperature Initiative Global
NADM, NACEM, and Opportunities for Future Collaboration
 NADM, NACEM, and Opportunities for Future Collaboration Richard R. Heim Jr. NOAA/NESDIS/National Climatic Data Center Asheville, North Carolina, U.S.A. 4th Annual DRI Workshop 26-28 January 2009, Regina,
COUNTRY REPORT. Jakarta. July, th National Directorate of Meteorology and Geophysics of Timor-Leste (DNMG)
") The Southeastern Asia-Oceania Flash Flood COUNTRY REPORT Jakarta. July, 10-12 th 2017 National Directorate of Meteorology and Geophysics of Timor-Leste (DNMG) Carla Feritas and Crisostimo Lobato Democratic
The Southeastern Asia-Oceania Flash Flood COUNTRY REPORT Jakarta. July, 10-12 th 2017 National Directorate of Meteorology and Geophysics of Timor-Leste (DNMG) Carla Feritas and Crisostimo Lobato Democratic
The North American Drought Monitor - The Canadian Perspective -
 The North American Drought Monitor - The Canadian Perspective - Trevor Hadwen National Agroclimate Information Service AAFC-PFRA, Regina Canmore, Alberta March 16-18, 2008 Background The NADM is a cooperative
Applications of yield monitoring systems and agricultural statistics in agricultural (re)insurance
insurance") Image: used under license from shutterstock.com Applications of yield monitoring systems and agricultural statistics in agricultural (re)insurance 18 October 2018 Ernst Bedacht Agenda Introduction 1. Munich
Image: used under license from shutterstock.com Applications of yield monitoring systems and agricultural statistics in agricultural (re)insurance 18 October 2018 Ernst Bedacht Agenda Introduction 1. Munich
Operational Monsoon Monitoring at NCEP
 Operational Monsoon Monitoring at NCEP Wassila M. Thiaw Climate Prediction Center National Centers for Environmental Predictions Operational Monsoon Monitoring at NCEP Wassila M. Thiaw Climate Prediction
The Global Precipitation Climatology Centre (GPCC) Serving the Hydro-Climatology Community
 Serving the Hydro-Climatology Community") The Global Precipitation Climatology Centre (GPCC) Serving the Hydro-Climatology Community Bruno Rudolf, Andreas Becker, Udo Schneider, Anja Meyer-Christoffer, Markus Ziese, Peter Finger Deutscher Wetterdienst
The Global Precipitation Climatology Centre (GPCC) Serving the Hydro-Climatology Community Bruno Rudolf, Andreas Becker, Udo Schneider, Anja Meyer-Christoffer, Markus Ziese, Peter Finger Deutscher Wetterdienst
Climate Prediction Center National Centers for Environmental Prediction
 NOAA s Climate Prediction Center Climate Monitoring Tool Wassila M. Thiaw and CPC International Team Climate Prediction Center National Centers for Environmental Prediction CPC International Team Vadlamani
The GeoCLIM software for gridding & analyzing precipitation & temperature. Tamuka Magadzire, FEWS NET Regional Scientist for Southern Africa
 The GeoCLIM software for gridding & analyzing precipitation & temperature Tamuka Magadzire, FEWS NET Regional Scientist for Southern Africa Outline What is GeoCLIM GeoCLIM Development Team GeoCLIM: objectives
Gridding of precipitation and air temperature observations in Belgium. Michel Journée Royal Meteorological Institute of Belgium (RMI)
") Gridding of precipitation and air temperature observations in Belgium Michel Journée Royal Meteorological Institute of Belgium (RMI) Gridding of meteorological data A variety of hydrologic, ecological,
Gridding of precipitation and air temperature observations in Belgium Michel Journée Royal Meteorological Institute of Belgium (RMI) Gridding of meteorological data A variety of hydrologic, ecological,
Table of Contents. Page
 Eighteen Years (1990 2007) of Climatological Data on NMSU s Corona Range and Livestock Research Center Research Report 761 L. Allen Torell, Kirk C. McDaniel, Shad Cox, Suman Majumdar 1 Agricultural Experiment
Country Presentation-Nepal
 Country Presentation-Nepal Mt.Everest, Shiva Pd. Nepal, DHM South Asia Drought Monitor Workshop Dhaka Bangladesh 2 th April 215 Overview Brief Climatology Climate activities- DHM PPCR (Pilot Program for
Analyzing and Visualizing Precipitation and Soil Moisture in ArcGIS
 Analyzing and Visualizing Precipitation and Soil Moisture in ArcGIS Wenli Yang, Pham Long, Peisheng Zhao, Steve Kempler, and Jennifer Wei * NASA Goddard Earth Science Data and Information Services Center
Web GIS Based Disaster Portal Project ESRI INDIA
 Web GIS Based Disaster Portal Project ESRI INDIA Contents Requirements Overview Product Technology Used KSNDMC Application Architecture Tool Developed Benefits for the End User Problems faced during implementation
The United States Drought Monitor How is it Made?
 The United States Drought Monitor How is it Made? Brian Fuchs, Climatologist National Drought Mitigation Center School of Natural Resources University of Nebraska-Lincoln September 14-17, 2009 Bamako,
CropCast Corn and Soybean Report Kenny Miller Tuesday, March 14, 2017
 Accumulated Rainfall (inches) Accumulated GDDs Temperature ( F)/Wind Speed (mph) Precipitation (inches) CropCast Corn and Soybean Report Kenny Miller Tuesday, March 14, 2017 Peoria, IL Regional Forecast
CropCast Corn and Soybean Report Kenny Miller Friday, March 17, 2017
 Accumulated Rainfall (inches) Accumulated GDDs Temperature ( F)/Wind Speed (mph) Precipitation (inches) CropCast Corn and Soybean Report Kenny Miller Friday, March 17, 2017 Peoria, IL Regional Forecast
Changing Hydrology under a Changing Climate for a Coastal Plain Watershed
 Changing Hydrology under a Changing Climate for a Coastal Plain Watershed David Bosch USDA-ARS, Tifton, GA Jeff Arnold ARS Temple, TX and Peter Allen Baylor University, TX SEWRU Objectives 1. Project changes
Using Of Gis Software For Mapping The Climatic Data Obtaining By Internet Network
 Using Of Gis Software For Mapping The Climatic Data Obtaining By Internet Network Sabah Hussein Ali Remote Sensing Center, University of Mosul Keyword: Precipitation, GIS, Kriging interpolation, GPCC,
A High Resolution Daily Gridded Rainfall Data Set ( ) for Mesoscale Meteorological Studies
 for Mesoscale Meteorological Studies") National Climate Centre Research Report No: 9/2008 A High Resolution Daily Gridded Rainfall Data Set (1971-2005) for Mesoscale Meteorological Studies M. Rajeevan and Jyoti Bhate National Climate Centre
National Climate Centre Research Report No: 9/2008 A High Resolution Daily Gridded Rainfall Data Set (1971-2005) for Mesoscale Meteorological Studies M. Rajeevan and Jyoti Bhate National Climate Centre
Northern Hemisphere Weather Outlook for Spring and Summer
 Northern Hemisphere Weather Outlook for Spring and Summer USDA Agricultural Outlook Forum February 24, 2012 Eric Luebehusen Meteorologist eluebehusen@oce.usda.gov 202-720-3361 A Few Quick Notes about Forecasting.
CropCast Corn and Soybean Report Kyle Tapley Monday, March 20, 2017
 Accumulated Rainfall (inches) Accumulated GDDs Temperature ( F)/Wind Speed (mph) Precipitation (inches) CropCast Corn and Soybean Report Kyle Tapley Monday, March 20, 2017 Peoria, IL Regional Forecast
Michael B. Ek 1, Youlong Xia 1,2, Jesse Meng 1,2, and Jiarui Dong 1,2
 Michael B. Ek 1, Youlong Xia 1,2, Jesse Meng 1,2, and Jiarui Dong 1,2 1 Land-Hydrology Team Environmental Modeling Center (EMC) National Centers for Environmental Prediction (NCEP) National Weather Service
NWSEO CALLS FOR NATIONAL CLIMATE SERVICE TO BE MADE PART OF THE NATIONAL WEATHER SERVICE
 APRIL 2009 NWSEO CALLS FOR NATIONAL CLIMATE SERVICE TO BE MADE PART OF THE NATIONAL WEATHER SERVICE At its recent winter meeting, the NWSEO National Council decided to urge the Administration and Congress
What Can Citizen Scientists Tell Us about Drought?
 What Can Citizen Scientists Tell Us about Drought? Using CoCoRaHS to Improve the Monitoring and Reporting of Drought Impacts Amanda Farris, Kirsten Lackstrom Carolinas Integrated Sciences & Assessments
Tokyo Climate Center Website (TCC website) and its products -For monitoring the world climate and ocean-
 and its products -For monitoring the world climate and ocean-") Tokyo, 14 November 2016, TCC Training Seminar Tokyo Climate Center Website (TCC website) and its products -For monitoring the world climate and ocean- Yasushi MOCHIZUKI Tokyo Climate Center Japan Meteorological
Tokyo, 14 November 2016, TCC Training Seminar Tokyo Climate Center Website (TCC website) and its products -For monitoring the world climate and ocean- Yasushi MOCHIZUKI Tokyo Climate Center Japan Meteorological
ANALYSIS OF FLOODS AND DROUGHTS IN THE BAGO RIVER BASIN, MYANMAR, UNDER CLIMATE CHANGE
 ANALYSIS OF FLOODS AND DROUGHTS IN THE BAGO RIVER BASIN, MYANMAR, UNDER CLIMATE CHANGE Myo Myat Thu* MEE15631 ABSTRACT 1 Supervisor: Dr. Maskym Gusyev** Dr. Akira Hasegawa** This study investigates floods
Climate Information for Managing Risk. Victor Murphy NWS Southern Region Climate Service Program Mgr. June 12, 2008
 Climate Information for Managing Risk Victor Murphy Climate Service Program Mgr. June 12, 2008 Currently From Fort Worth, TX but climate challenges abound everywhere as does the need to mitigate impacts
National Weather Service Flood Forecast Needs: Improved Rainfall Estimates
 National Weather Service Flood Forecast Needs: Improved Rainfall Estimates Weather Forecast Offices Cleveland and Northern Indiana Ohio River Forecast Center Presenter: Sarah Jamison, Service Hydrologist
FAS/OGA/IPAD Introduction & Geospatial Data Applied to Global Agriculture Monitoring
 FAS/OGA/IPAD Introduction & Geospatial Data Applied to Global Agriculture Monitoring March 31, 2010 USDA Foreign Agricultural Service (FAS) Office of Global Analysis (OGA) International Production Assessment
CropCast Corn and Soybean Report Kenny Miller Monday, March 13, 2017
 Accumulated Rainfall (inches) Accumulated GDDs Temperature ( F)/Wind Speed (mph) Precipitation (inches) CropCast Corn and Soybean Report Kenny Miller Monday, March 13, 2017 Peoria, IL Regional Forecast
Weather Trends & Climate Normals
 26-28 April 2017 15th Itron Energy Forecasting Conference Presenter: Kristin Larson, Ph. D. Data Scientist Kristin.Larson@stormgeo.com Weather Trends & Climate Normals Our Resources Decision Support for
Using the EartH2Observe data portal to analyse drought indicators. Lesson 4: Using Python Notebook to access and process data
 Using the EartH2Observe data portal to analyse drought indicators Lesson 4: Using Python Notebook to access and process data Preface In this fourth lesson you will again work with the Water Cycle Integrator
UNITED STATES AND SOUTH AMERICA OUTLOOK (FULL REPORT) Thursday, December 28, 2017
 Thursday, December 28, 2017") T-storm Weather Summary Despite scattered t-storms Sat.-Sun. in central and northern areas in Argentina, more will likely be needed especially in sunflower areas of the southwest. Some t-storms likely
T-storm Weather Summary Despite scattered t-storms Sat.-Sun. in central and northern areas in Argentina, more will likely be needed especially in sunflower areas of the southwest. Some t-storms likely
SOUTHEAST ASIAN SUBSEASONAL TO SEASONAL (SEA S2S) PROJECT
 PROJECT") SOUTHEAST ASIAN SUBSEASONAL TO SEASONAL (SEA S2S) PROJECT CONCEPT NOTE FOR SEA S2S FIRST WORKSHOP Feb 27 3 Mar 2017 CENTRE FOR CLIMATE RESEARCH SINGAPORE (CCRS) METEOROLOGICAL SERVICE SINGAPORE (MSS) Background
SOUTHEAST ASIAN SUBSEASONAL TO SEASONAL (SEA S2S) PROJECT CONCEPT NOTE FOR SEA S2S FIRST WORKSHOP Feb 27 3 Mar 2017 CENTRE FOR CLIMATE RESEARCH SINGAPORE (CCRS) METEOROLOGICAL SERVICE SINGAPORE (MSS) Background
SuperPack North America
 SuperPack North America Speedwell SuperPack makes available an unprecedented range of quality historical weather data, and weather data feeds for a single annual fee. SuperPack dramatically simplifies
Speedwell Weather. Topics: Setting up a weather desk (a shopping list)
") Speedwell Weather Topics: Setting up a weather desk (a shopping list) As Presented to the Weather Risk Management Association, Dusseldorf September 2011 RWE Trading Floor (Europe's largest energy trading
Speedwell Weather Topics: Setting up a weather desk (a shopping list) As Presented to the Weather Risk Management Association, Dusseldorf September 2011 RWE Trading Floor (Europe's largest energy trading
Kevin Smith Senior Climatologist. Australian Bureau of Meteorology.
 GCOS Region V Lead Centre Kevin Smith Senior Climatologist Australian Bureau of Meteorology k.c.smith@bom.gov.au GCOS_Lead_Centre_RAV@bom.gov.au http://www.bom.gov.au BACKGROUND & INTRODUCTION RA V observational
Integrated Electricity Demand and Price Forecasting
 Integrated Electricity Demand and Price Forecasting Create and Evaluate Forecasting Models The many interrelated factors which influence demand for electricity cannot be directly modeled by closed-form
Imke Durre * and Matthew J. Menne NOAA National Climatic Data Center, Asheville, North Carolina 2. METHODS
 9.7 RADAR-TO-GAUGE COMPARISON OF PRECIPITATION TOTALS: IMPLICATIONS FOR QUALITY CONTROL Imke Durre * and Matthew J. Menne NOAA National Climatic Data Center, Asheville, North Carolina 1. INTRODUCTION Comparisons
UNITED STATES AND SOUTH AMERICA WEATHER ROUNDUP Sunday, December 17, 2017
 T-storm Weather Summary Extreme heat was followed by heavy rain in some key areas of Argentina yesterday. T-storms affect much of the driest Argentina, southern Brazil, and Paraguay through 7 to 10 days,
Data Availability through the Global Precipitation Climatology Centre (GPCC) suitable for wet deposition assessment
 suitable for wet deposition assessment") Data Availability through the Global Precipitation Climatology Centre (GPCC) suitable for wet deposition assessment Presentation to the GAW Workshop on Measurement-Model Fusion for Global Total Atmospheric
Data Availability through the Global Precipitation Climatology Centre (GPCC) suitable for wet deposition assessment Presentation to the GAW Workshop on Measurement-Model Fusion for Global Total Atmospheric
Application and verification of the ECMWF products Report 2007
 Application and verification of the ECMWF products Report 2007 National Meteorological Administration Romania 1. Summary of major highlights The medium range forecast activity within the National Meteorological
Climate Variables for Energy: WP2
 Climate Variables for Energy: WP2 Phil Jones CRU, UEA, Norwich, UK Within ECEM, WP2 provides climate data for numerous variables to feed into WP3, where ESCIIs will be used to produce energy-relevant series
INDIAN OCEAN STATE February 14, 2018 MJO INDEX
 Digana Village,Sri Lanka/ Male,Maldives/ New York, USA Phone: (+94) 81-2376746 (SL), (+960) 77880(MV) Web: http://www.tropicalclimate.org/maldives Blog: http://fectmv.blogspot.com E-mail: fectmv@gmail.com
Chapter-1 Introduction
 Modeling of rainfall variability and drought assessment in Sabarmati basin, Gujarat, India Chapter-1 Introduction 1.1 General Many researchers had studied variability of rainfall at spatial as well as
Improving Reservoir Management Using the Storm Precipitation Analysis System (SPAS) and NEXRAD Weather Radar
 and NEXRAD Weather Radar") Improving Reservoir Management Using the Storm Precipitation Analysis System (SPAS) and NEXRAD Weather Radar Bill D. Kappel, Applied Weather Associates, LLC, Monument, CO Edward M. Tomlinson, Ph.D., Applied
Improving Reservoir Management Using the Storm Precipitation Analysis System (SPAS) and NEXRAD Weather Radar Bill D. Kappel, Applied Weather Associates, LLC, Monument, CO Edward M. Tomlinson, Ph.D., Applied
VALIDATION OF SPATIAL INTERPOLATION TECHNIQUES IN GIS
 VALIDATION OF SPATIAL INTERPOLATION TECHNIQUES IN GIS V.P.I.S. Wijeratne and L.Manawadu University of Colombo (UOC), Kumarathunga Munidasa Mawatha, Colombo 03, wijeratnesandamali@yahoo.com and lasan@geo.cmb.ac.lk
Drought forecasting methods Blaz Kurnik DESERT Action JRC
 Ljubljana on 24 September 2009 1 st DMCSEE JRC Workshop on Drought Monitoring 1 Drought forecasting methods Blaz Kurnik DESERT Action JRC Motivations for drought forecasting Ljubljana on 24 September 2009
Richard R. Heim Jr. Michael J. Brewer
 Linking GDIS Data Sets Using the NIDIS Drought Portal Richard R. Heim Jr. Michael J. Brewer NOAA/NESDIS/ Asheville, North Carolina International Global Drought Information System Workshop: Next Steps Caltech
From a North American to a Global Drought Monitor Richard R. Heim Jr.
 From a North American to a Global Drought Monitor Richard R. Heim Jr. NOAA/NESDIS/ Asheville, North Carolina, USA GEO-DRI Drought Monitoring Workshop Winnipeg, Manitoba, Canada 10-11 May 2010 NADM History
AUTOMATED ONLINE ECOLOGICAL MODELING AND EVALUATION FOR EVERGLADES MANAGEMENT AND RESTORATION
 AUTOMATED ONLINE ECOLOGICAL MODELING AND EVALUATION FOR EVERGLADES MANAGEMENT AND RESTORATION Leonard Pearlstine 1 Suresh Goldconda 2 Kevin Suir 3 Alicia LoGalbo 1 Craig Conzelmann 3 Janice Parsons 1 1
CGMS-45-WMO-WP-05 Monitoring Extreme Weather and Climate from Space. World Meteorological Organization (WMO) Space Programme
 Space Programme") CGMS-45-WMO-WP-05 Monitoring Extreme Weather and Climate from Space World Meteorological Organization (WMO) Space Programme Introduction UNOSAT Report Satellite Detected Waters over Xieng Ngneun District,
CGMS-45-WMO-WP-05 Monitoring Extreme Weather and Climate from Space World Meteorological Organization (WMO) Space Programme Introduction UNOSAT Report Satellite Detected Waters over Xieng Ngneun District,
High Resolution Indicators for Local Drought Monitoring
 High Resolution Indicators for Local Drought Monitoring REBECCA CUMBIE, STATE CLIMATE OFFICE OF NC, NCSU Monitoring Drought Multiple indicators, multiple sources Local detail important 1 Point-Based Climate-Division
TAMSAT: LONG-TERM RAINFALL MONITORING ACROSS AFRICA
 TAMSAT: LONG-TERM RAINFALL MONITORING ACROSS AFRICA Ross Maidment, Emily Black, Matthew Young and Dagmawi Asfaw TAMSAT, University of Reading Helen Greatrex IRI, Columbia University 13 th EUMETSAT User
Application and verification of ECMWF products 2012
 Application and verification of ECMWF products 2012 Met Eireann, Glasnevin Hill, Dublin 9, Ireland. J.Hamilton 1. Summary of major highlights The verification of ECMWF products has continued as in previous
AN INTERNATIONAL SOLAR IRRADIANCE DATA INGEST SYSTEM FOR FORECASTING SOLAR POWER AND AGRICULTURAL CROP YIELDS
 AN INTERNATIONAL SOLAR IRRADIANCE DATA INGEST SYSTEM FOR FORECASTING SOLAR POWER AND AGRICULTURAL CROP YIELDS James Hall JHTech PO Box 877 Divide, CO 80814 Email: jameshall@jhtech.com Jeffrey Hall JHTech
Wheat Outlook July 24, 2017 Volume 26, Number 44
 Today s Newsletter Market Situation Crop Progress 1 Weather 1 Grain Use 5 Market Situation Crop Progress. The U.S. spring wheat crop condition index this week is down only one point to 277 with 96% of
Orange Visualization Tool (OVT) Manual
 Manual") Orange Visualization Tool (OVT) Manual This manual describes the features of the tool and how to use it. 1. Contents of the OVT Once the OVT is open (the first time it may take some seconds), it should
Orange Visualization Tool (OVT) Manual This manual describes the features of the tool and how to use it. 1. Contents of the OVT Once the OVT is open (the first time it may take some seconds), it should
Improving Drought Forecasts: The Next Generation of Seasonal Outlooks
 Improving Drought Forecasts: The Next Generation of Seasonal Outlooks Douglas Le Comte, CPC Douglas.lecomte@noaa.gov Outline Review of how the current Drought Outlooks are made Sample experimental products
Shuhei Maeda Climate Prediction Division Global Environment and Marine Department Japan Meteorological Agency
 Eighth Session of the Forum on Regional Climate Monitoring, Assessment and Prediction for Asia (FOCRAII) 5-7 April 2012, Beijing, China Shuhei Maeda Climate Prediction Division Global Environment and Marine
Weather and Climate Risks and Effects on Agriculture
 Weather and Climate Risks and Effects on Agriculture Dr. Eric Snodgrass Official Journal of the Fluid Fertilizer Foundation Vol. 26, No. 2, Issue #100 DOWNLOAD Summary: So, what do we need to watch for?
Indian National (Weather) SATellites for Agrometeorological Applications
 SATellites for Agrometeorological Applications") Indian National (Weather) SATellites for Agrometeorological Applications Bimal K. Bhattacharya Agriculture-Terrestrial Biosphere- Hydrology Group Space Applications Centre (ISRO) Ahmedabad 380015, India
Indian National (Weather) SATellites for Agrometeorological Applications Bimal K. Bhattacharya Agriculture-Terrestrial Biosphere- Hydrology Group Space Applications Centre (ISRO) Ahmedabad 380015, India
Application of Satellite Data for Flood Forecasting and Early Warning in the Mekong River Basin in South-east Asia
 MEKONG RIVER COMMISSION Vientiane, Lao PDR Application of Satellite Data for Flood Forecasting and Early Warning in the Mekong River Basin in South-east Asia 4 th World Water Forum March 2006 Mexico City,
Hydrologic Modelling of the Upper Malaprabha Catchment using ArcView SWAT
 Hydrologic Modelling of the Upper Malaprabha Catchment using ArcView SWAT Technical briefs are short summaries of the models used in the project aimed at nontechnical readers. The aim of the PES India
GIS at the Midwestern Regional Climate Center: A peek behind the curtain. Zoe Zaloudek, Geospatial Application Developer
 GIS at the Midwestern Regional Climate Center: A peek behind the curtain Zoe Zaloudek, Geospatial Application Developer CPASW, May 2018 What is the MRCC? GIS-based Maps and Products Regional Mesonet Program
Intraseasonal Characteristics of Rainfall for Eastern Africa Community (EAC) Hotspots: Onset and Cessation dates. In support of;
 Hotspots: Onset and Cessation dates. In support of;") Intraseasonal Characteristics of Rainfall for Eastern Africa Community (EAC) Hotspots: Onset and Cessation dates In support of; Planning for Resilience in East Africa through Policy, Adaptation, Research
Intraseasonal Characteristics of Rainfall for Eastern Africa Community (EAC) Hotspots: Onset and Cessation dates In support of; Planning for Resilience in East Africa through Policy, Adaptation, Research
Condition Monitoring: A New System for Drought Impacts Reporting through CoCoRaHS
 Condition Monitoring: A New System for Drought Impacts Reporting through CoCoRaHS Amanda Farris Carolinas Integrated Sciences & Assessments (CISA) University of South Carolina WERA 1012 Annual Conference
Assessment of ERA-20C reanalysis monthly precipitation totals on the basis of GPCC in-situ measurements
 Assessment of ERA-20C reanalysis monthly precipitation totals on the basis of GPCC in-situ measurements Elke Rustemeier, Markus Ziese, Andreas Becker, Anja Meyer-Christoffer, Udo Schneider, and Peter Finger
ANNUAL CLIMATE REPORT 2016 SRI LANKA
 ANNUAL CLIMATE REPORT 2016 SRI LANKA Foundation for Environment, Climate and Technology C/o Mahaweli Authority of Sri Lanka, Digana Village, Rajawella, Kandy, KY 20180, Sri Lanka Citation Lokuhetti, R.,
Global Satellite Products & Services for Agricultural and Vegetation Health
 Global Satellite Products & Services for Agricultural and Vegetation Health Presented at the WMO Expert Meeting on National Early Warning System for Agricultural Weather Management George Mason University
September 2018 Weather Summary West Central Research and Outreach Center Morris, MN
 September 2018 Weather Summary The mean temperature for September was 60.6 F, which is 1.5 F above the average of 59.1 F (1886-2017). The high temperature for the month was 94 F on September 16 th. The
Atmospheric circulation analysis for seasonal forecasting
 Training Seminar on Application of Seasonal Forecast GPV Data to Seasonal Forecast Products 18 21 January 2011 Tokyo, Japan Atmospheric circulation analysis for seasonal forecasting Shotaro Tanaka Climate
Ganbat.B, Agro meteorology Section
 NATIONAL AGENCY FOR METEOROLOGY, HYDROLOGY AND ENVIRONMENT MONITORING OF MONGOLIA Ganbat.B, Agro meteorology Section OF INSTITUTE OF METEOROLOGY AND HYDROLOGY 2009 YEAR Location Climate Northern Asia,
Application of remote sensing for agricultural disasters
 Application of remote sensing for agricultural disasters Bingfang Wu, Sheng Chang Institute of Remote Sensing and Digital Earth (RADI) Chinese Academy of Sciences (CAS) wubf@radi.ac.cn, changsheng@radi.ac.cn
Regional Flash Flood Guidance and Early Warning System
 WMO Training for Trainers Workshop on Integrated approach to flash flood and flood risk management 24-28 October 2010 Kathmandu, Nepal Regional Flash Flood Guidance and Early Warning System Dr. W. E. Grabs
An Online Platform for Sustainable Water Management for Ontario Sod Producers
 An Online Platform for Sustainable Water Management for Ontario Sod Producers 2014 Season Update Kyle McFadden January 30, 2015 Overview In 2014, 26 weather stations in four configurations were installed
Seasonal Climate Watch September 2018 to January 2019
 Seasonal Climate Watch September 2018 to January 2019 Date issued: Aug 31, 2018 1. Overview The El Niño-Southern Oscillation (ENSO) is still in a neutral phase and is still expected to rise towards an
AGRICULTURAL WATER RESOURCES DECISION SUPPORT SYSTEM AND EVAPOTRANSPIRATION TOOLBOX. L. Albert Brower, Curtis L. Hartzell, and Steffen P.
 AGRICULTURAL WATER RESOURCES DECISION SUPPORT SYSTEM AND EVAPOTRANSPIRATION TOOLBOX L. Albert Brower, Curtis L. Hartzell, and Steffen P. Meyer 1 ABSTRACT: There is a critical need for improvement in calculating
Update on Seasonal Conditions & Summer Weather Outlook
 Update on Seasonal Conditions & Summer Weather Outlook Andy Bryant National Weather Service Portland, Oregon June 6, 2018 Overview Quick review of winter and spring conditions Seasonal water supply forecasts
2012 Growing Season Weather Summary for North Dakota. Adnan Akyüz and Barbara A. Mullins Department of Soil Science October 30, 2012
 2012 Growing Season Weather Summary for North Dakota Adnan Akyüz and Barbara A. Mullins Department of Soil Science October 30, 2012 Introduction The 2012 growing season (the period from April through September)
NIDIS Intermountain West Drought Early Warning System September 4, 2018
 NIDIS Drought and Water Assessment NIDIS Intermountain West Drought Early Warning System September 4, 2018 Precipitation The images above use daily precipitation statistics from NWS COOP, CoCoRaHS, and
A Report on a Statistical Model to Forecast Seasonal Inflows to Cowichan Lake
 A Report on a Statistical Model to Forecast Seasonal Inflows to Cowichan Lake Prepared by: Allan Chapman, MSc, PGeo Hydrologist, Chapman Geoscience Ltd., and Former Head, BC River Forecast Centre Victoria
Among various open-source GIS programs, QGIS can be the best suitable option which can be used across partners for reasons outlined below.
 Comparison of Geographic Information Systems (GIS) software As of January 2018, WHO has reached an agreement with ESRI (an international supplier of GIS software) for an unlimited use of ArcGIS Desktop
June Current Situation and Outlook
 June 2018 Current Situation and Outlook Sea surface temperatures in the east-central tropical Pacific as well as most of the overlying atmospheric indicators suggest that ENSO-neutral conditions are prevailing;
South Asian Climate Outlook Forum (SASCOF-12)
") Twelfth Session of South Asian Climate Outlook Forum (SASCOF-12) Pune, India, 19-20 April 2018 Consensus Statement Summary Normal rainfall is most likely during the 2018 southwest monsoon season (June
Twelfth Session of South Asian Climate Outlook Forum (SASCOF-12) Pune, India, 19-20 April 2018 Consensus Statement Summary Normal rainfall is most likely during the 2018 southwest monsoon season (June
ArcGIS Enterprise: What s New. Philip Heede Shannon Kalisky Melanie Summers Shreyas Shinde
 ArcGIS Enterprise: What s New Philip Heede Shannon Kalisky Melanie Summers Shreyas Shinde ArcGIS Enterprise is the new name for ArcGIS for Server ArcGIS Enterprise Software Components ArcGIS Server Portal
Meteorological information
 Meteorological Meteorological information information for for locust locust monitoring monitoring & & control control locusts locusts & & systems systems meteorological meteorological data data solutions
Mingyue Chen 1)* Pingping Xie 2) John E. Janowiak 2) Vernon E. Kousky 2) 1) RS Information Systems, INC. 2) Climate Prediction Center/NCEP/NOAA
* Pingping Xie 2) John E. Janowiak 2) Vernon E. Kousky 2) 1) RS Information Systems, INC. 2) Climate Prediction Center/NCEP/NOAA") J3.9 Orographic Enhancements in Precipitation: Construction of a Global Monthly Precipitation Climatology from Gauge Observations and Satellite Estimates Mingyue Chen 1)* Pingping Xie 2) John E. Janowiak
J3.9 Orographic Enhancements in Precipitation: Construction of a Global Monthly Precipitation Climatology from Gauge Observations and Satellite Estimates Mingyue Chen 1)* Pingping Xie 2) John E. Janowiak
Regional Precipitation and ET Patterns: Impacts on Agricultural Water Management
 Regional Precipitation and ET Patterns: Impacts on Agricultural Water Management Christopher H. Hay, PhD, PE Ag. and Biosystems Engineering South Dakota State University 23 November 2010 Photo: USDA-ARS
UNITED STATES AND SOUTH AMERICA OUTLOOK (FULL REPORT) Wednesday, April 18, 2018
 Wednesday, April 18, 2018") T-storm Weather Summary Coolness continues over the next week in much of the central U.S., most likely producing the coldest April since 1907 in the Corn Belt, but followed by seasonable to mild weather
T-storm Weather Summary Coolness continues over the next week in much of the central U.S., most likely producing the coldest April since 1907 in the Corn Belt, but followed by seasonable to mild weather
Spatial Climate Datasets and Tools for Improved Agricultural Risk Management in a Changing Climate. Christopher Daly & David Hannaway
 Agricultural Outlook Forum Presented: February 23-24, 2012 U.S. Department of Agriculture Spatial Climate Datasets and Tools for Improved Agricultural Risk Management in a Changing Climate Christopher
NIDIS Intermountain West Drought Early Warning System October 17, 2017
 NIDIS Drought and Water Assessment NIDIS Intermountain West Drought Early Warning System October 17, 2017 Precipitation The images above use daily precipitation statistics from NWS COOP, CoCoRaHS, and
IMPACT OF CLIMATE CHANGE OVER THE ARABIAN PENINSULA
 IMPACT OF CLIMATE CHANGE OVER THE ARABIAN PENINSULA By: Talal Alharbi June, 29 2017 1 Motivation: In arid and semi-arid regions of the world the demand for fresh water resources is increasing due to: increasing
4) At the end of this presentation we have an operator that will organize the Q & A s.
 At the end of this presentation we have an operator that will organize the Q & A s.") Hello and welcome to the next in a series of Missouri Basin specific climate outlook Webinars 2011-2012. My name is Dennis Todey and I am the State Climatologist for the State of South Dakota. We are taking
Hello and welcome to the next in a series of Missouri Basin specific climate outlook Webinars 2011-2012. My name is Dennis Todey and I am the State Climatologist for the State of South Dakota. We are taking
U.S. CORN AND SOYBEAN YIELDS AND YIELD FORECASTING
 U.S. CORN AND SOYBEAN YIELDS AND YIELD FORECASTING A White Paper by Darrel Good, Scott Irwin, and Mike Tannura January 2011 Why Is It Important to Forecast U.S. Corn and Soybean Yields? The price level