Weather Trends & Climate Normals
|
|
|
- Darren Johnson
- 6 years ago
- Views:
Transcription

1 26-28 April th Itron Energy Forecasting Conference Presenter: Kristin Larson, Ph. D. Data Scientist Weather Trends & Climate Normals


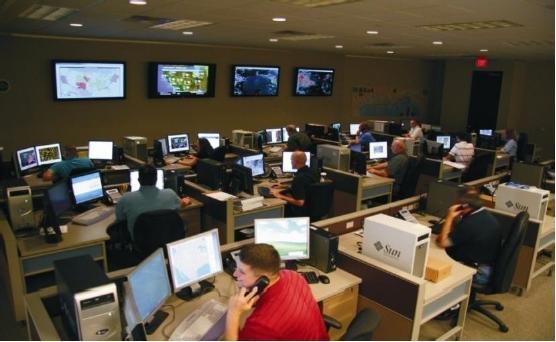
2 Our Resources Decision Support for Weather Sensitive Operations 2


3 Our Experience 3


4 YOUR 24/7 Wx Department FORESIGHT: Proprietary long range weather forecasting solutions for energy markets THREAT ID: Early identification of potential severe weather grid disruption for load shedding PRECISION FORECAST DATA: Increase base load certainty with precise hourly point forecasts for LFEs NENA ANALYTICS: Coal & dry freight fundamentals influencing supply, demand, freight cost and arbitrage opportunities DEEP STORM: Predictive & Prescriptive machine learning algorithms for utilities 4

5 Machine Learning DeepStorm Uncover unknown patterns in your data through machine learning. Create predictive algorithms to drive improved business decisions for competitive differentiation. 5

 will use 10 to 20 variables to train the model and is restricted to linear relantionships.")
6 Weather forecasting petabytes of data Advances in algorithms and GPU hardware has enabled deep neural networks to beat competing algorithms by large margins in fields like speech recognition and object detection in images. These same deep neural networks are used in StormGeo to discover complex structures in vast weather datasets and and relate them to business-impacting phenomena. A traditional statistical approach (like MOS) will use 10 to 20 variables to train the model and is restricted to linear relantionships. A deep neural network can include 1,000,000 variables in 3 dimensions and is not restricted to linear relationships. 6


7 ForeSight: Long Range Forecasting ForeSight day outlook updated 3x per week Service includes: Forecast of temperature and precipitation anomalies across the globe On-demand video updates by our senior scientists 3x per week Live access to expert meteorologists via phone, , and web conference Access to information through StormGeo's unique customer portal ForeSight 90 This quarterly outlook provides a long-range forecast in a 90-day format. StormGeo uses thorough global teleconnections and in-house developed forecast indices to provide market intelligence for expected weather conditions for the next 90 days. ForeSight Seasonal Whether its hurricanes, snow storms, severe weather, or other seasonally focused sensitivities - our meteorologists are able to provide long-range weather forecasting to help you prepare for and make decisions now that will affect the future. 7
 are compared to the currently-assessed risk to a particular basin.")
8 ForeSight: Long Range Forecasting Tropical Cyclone (TC) Risk Assessment A detailed examination and discussion of near-term and long-range weather parameters/models with respect to the potential tropical cyclone risk in a particular basin. Analog seasons (seasons with a similar weather pattern and ocean temperature setup) are compared to the currently-assessed risk to a particular basin. The assessment has 3 main parts: Short-Term: 7-14 days Medium-Range: days Long-Range: Seasonal outlook 8

9 ForeSight: Long Range Forecasting Hosted long range forecast weather portal at StormGeo.com 9

10 Nena Analysis A leading analysis house delivering energy market insights Coal Market Analysis We cover the global coal market. Web-based platform with daily coal market comment from our analysts, a directional price forecast for API2 and data access for your own use Weekly reports Monthly reports Request a free trial Get full access to StormGeo s analysis for one week free of charge. Follow the market closely with Nena s price forecasts and market updates throughout the day via Nena s website and in reports issued by . A web meeting with an analyst is included in the free trial. Ken.Carrier@StormGeo.com Nena Coal Weekly report offers short term directional coal price forecasts for API2, API4 and API8, while Nena Coal Monthly presents scenario-based price forecasts for API2 (CIF ARA) front month and next four quarters. We calculate the coal power output for major countries and the coal-to-gas switching price. We assess the Global Arbitrage Coal Matrix in order to depict trade flow opportunities and trends. 10
11 Climate Normals Supplemental Climate Normals available from: Download before the talk with internet access for your locations 11
12 Load Changes Predicting the Response of Electricity Load to Climate Change Patrick Sullivan, Jesse Colman, and Eric Kalendra National Renewable Energy Laboratory #
13 Load Changes Temperature sensitivity to load using (Platts, FERC form 714) Baseline Electricity demand based on the U.S. EIA Annual Energy Outlook (degree days at averages) Temperature changes from MIT s Integrated Earth System Model (scenario RCP4.56, radiative forcing stabilizes at 4.5 W/m 2 in 2100) 13


14 Load Changes Annual Load change in 2050 compared to baseline Summer increases and winter decreases 14


15 Load Changes Summer Load Increase in 2050 compared to baseline 15

16 Weather Trends Change in Heating Degree Days 16

17 Weather Trends Change in Cooling Degree Days 17
18 Climate Normals Defined by World Meteorological Agency, a "normal" of a particular variable (e.g., temperature) is defined as the 30-year average. For example, the minimum temperature normal in January for a station in Chicago, Illinois, would be computed by taking the average of the 30 January values of monthly averaged minimum temperatures from 1981 to Each of the 30 monthly values was in turn derived from averaging the daily observations of minimum temperature for the station. In practice, however, much more goes into NCEI's Climate Normals product than simple 30-year averages. Procedures are put in place to deal with missing and suspect data values. In addition, Climate Normals include quantities other than averages such as degree days, probabilities, standard deviations, etc. Climate Normals are a large suite of data products that provide users with many tools to understand typical climate conditions for thousands of locations across the United States. 18
19 Climate Normals 30 year average updated every 10 years by NCEI Compared to the previous Climate Normals, the new Climate Normals includes the decade of the 2000s and loses the decade of the 1970s. As the 2000s were warmer than the 1970s, this has had a warming influence on the Climate Normals. Comparing these decades using our best dataset for climate change analysis, the USHCN, we find that the decade of the 2000s was about 1.5 F warmer than the 1970s. For maximum, minimum, and mean temperature the difference, respectively, was 1.37 F, 1.55 F, and 1.46 F. As the Climate Normals are an average of three decades, this warmed the new Climate Normals by approximately 0.5 F. The difference between these values and the actual difference between the reported Normals and the new Normals are caused by station moves, changes in observing practices or instruments, etc. 19
20 Climate Normals Supplemental Climate Normals available from: 20
21 NOAA s Climate Normals: Monthly Temperature Normals various definitions of normal climate Denver-Stapleton, CO GHCN-ID: USW Latitude: N Longitude: W Elevation: m Maximum Temperature ( F) Jan Feb Mar Apr May Jun Jul Aug Sep Oct Nov Dec Ann Normal Normal Normal Normal Normal Optimal Climate Normal Hinge Fit Normal Minimum Temperature ( F) Jan Feb Mar Apr May Jun Jul Aug Sep Oct Nov Dec Ann Normal Normal Normal Normal Normal Optimal Climate Normal Hinge Fit Normal For Further Reading: Arguez, A., R. S. Vose, and J. Dissen, 2013: Alternative Climate Normals: Impacts to the Energy Industry. Bulletin of the American Meteorological Society, 94, Arguez, A., and R. S. Vose, 2011: The Definition of the Standard WMO Climate Normal: The Key to Deriving Alternative Climate Normals. Bulletin of the American Meteorological Society, 92,
22 Normal , the most recent 5 years in the period of record Normal , the most recent 15 years in Normal 30-yr , the most recent 30 years in This is the traditional way that NOAA has computed Climate Normals. 5-yr 15-yr Optimal Climate Normal An average of the most recent N years in the period of record. A formula based on time series features, such as long-term trends, determines the value of N. A smaller (larger) value of N typically implies a stronger (weaker) trend in the time series. Included it in the average for that pre-determined number of years. The value was a candidate (it could have been used), but it wasn't ultimately used. Not sure about this description Normal , the most recent 10 years in Normal , the most recent 20 years in N Hinge Fit Normal 10-yr 20-yr A normal calculated using a statistical fit (black line segments) through the data points. Prior to the hinge point, the fit must be flat. Thereafter, the fit can be increasing, decreasing, or flat. The hinge fit normal (black dot) is defined as the value of the fit through the most recent year in the period of record (i.e., 2010). Frequently asked questions 1.What are climate normals? Traditionally, NOAA defines a climate "normal" as a 30-year average. For example, we compute the January temperature normal for a station by averaging the 30 January values of monthly temperatures from 1981 to Climate Normals are used to determine the rates a power company can charge its customers, where and when to schedule an outdoor wedding, and countless other applications. 2. Why do you provide seven different normals instead of one? Is it because of global warming? Many users of NOAA s Climate Normals products have expressed concerns about using a 30-year average in an era of observed climate change (see the For Further Reading section on the previous page). In fact, some of our users have begun calculating their own 10-year averages, for example. NOAA provides these additional computations to help users make better-informed decision. NOAA also recognizes that alternative ways of defining normal may work better than the 30-year average given observed global warming. Note: The values plotted in the schematics, as well as the depicted size of N in the Optimal Climate Normals schematic, are for illustrative purposes only, and do not reflect actual climate data. Page 2 of 2
23 Normal , the most recent 5 years in the period of record Normal Normal , the most recent 10 years in Normal , the most recent 15 years in Normal , the most recent 20 years in 30-yr , the most An average of the most recent N in the period of record. A formula based recent 30on time years series features, in the period of such as long-term trends, record. This is the traditional way that determines the value of N. A smaller (larger) value of N typically implies a stronger (weaker) trend in the time series. NOAA has computed Climate Normals.

24 Normal , the most recent 20 years in the period of record. 20-yr
25 Normal , the most recent 15 years in the period of record. 15-yr
26 Normal , the most recent 10 years in the period of record. 10-yr

27 Normal , the most recent 5 years in the period of record. 5-yr
28 Normal Normal , the most recent 5 years in the period of record. 5-yr , the most recent 10 years in 10-yr Normal , the most recent 15 years in 15-yr Normal , the most recent 20 years in 20-yr
29 Weather Trends Estimation and Extrapolation of Climate Normals and Climatic Trends Robert E. Livezey, Konstantin Y. Vinnikov, Marina M. Timofeyeva, Richard Tinker and Huug M. van den Dool Climate Prediction Center JOURNAL OF APPLIED METEOROLOGY AND CLIMATOLOGY, Nov
30 Normal , the most recent 5 years in the period of record Normal Optimal An average Climate over Normal , the most recent 10 years in Normal , the most recent 15 years in Normal , the most recent 20 years in N An average of the most recent N years in A formula based on time series An average of the most features, such as long-term recent N years in the period of record. A formula based on time series features, trends, such as long-term determines trends, the value of determines the value of N. A smaller (larger) value of N N. typically A smaller implies a stronger (larger) value of N (weaker) trend in the time typically implies a stronger series. (weaker) trend in the time series.
31 Normal , the most recent 5 years in the period of record Normal Hinge Fit Normal , the most recent 10 years in Normal , the most recent 15 years in Normal , the most recent 20 years in A normal calculated using a statistical fit (black line segments) through the data points. Prior to the hinge point, the fit must be flat. Thereafter, the fit can be increasing, decreasing, or flat. The hinge fit normal (black dot) is defined as the value of the fit through the most recent year in the period of record (i.e., 2010).

32 Normal , the most recent 5 years in the period of record Normal , the most recent 10 years in Normal , the most recent 15 years in Normal , the most recent 20 years in An average of the most recent N years in the period of record. A formula based on time series features, such as long-term trends, determines the value of N. A smaller (larger) value of N typically implies a stronger (weaker) trend in the time series.
33 Climate Normals NCEI engaging users for additional products. Working on ENSO (El Nino Southern Oscillation) normals. Send suggestions to: Anthony Arguez, Ph.D. Physical Scientist NOAA's National Centers for Environmental Information (NCEI)
34 Kristin Larson, Ph. D. Data Scientist Ken Carrier Industry Manager N. Featherwood, Suite 140 Houston, TX Ken Mobile (832) Thank you! 34 34
Atmospheric circulation analysis for seasonal forecasting
 Training Seminar on Application of Seasonal Forecast GPV Data to Seasonal Forecast Products 18 21 January 2011 Tokyo, Japan Atmospheric circulation analysis for seasonal forecasting Shotaro Tanaka Climate
Colorado s 2003 Moisture Outlook
 Colorado s 2003 Moisture Outlook Nolan Doesken and Roger Pielke, Sr. Colorado Climate Center Prepared by Tara Green and Odie Bliss http://climate.atmos.colostate.edu How we got into this drought! Fort
2003 Moisture Outlook
 2003 Moisture Outlook Nolan Doesken and Roger Pielke, Sr. Colorado Climate Center Prepared by Tara Green and Odie Bliss http://climate.atmos.colostate.edu Through 1999 Through 1999 Fort Collins Total Water
NatGasWeather.com Daily Report
 NatGasWeather.com Daily Report Issue Time: 5:15 pm EST Sunday, February 28 th, 2016 for Monday, Feb 29 th 7-Day Weather Summary (February 28 th March 5 th ): High pressure will dominate much of the US
Seasonal Climate Watch April to August 2018
 Seasonal Climate Watch April to August 2018 Date issued: Mar 23, 2018 1. Overview The El Niño-Southern Oscillation (ENSO) is expected to weaken from a moderate La Niña phase to a neutral phase through
What Does It Take to Get Out of Drought?
 What Does It Take to Get Out of Drought? Nolan J. Doesken Colorado Climate Center Colorado State University http://ccc.atmos.colostate.edu Presented at the Insects, Diseases and Drought Workshop, May 19,
2013 Summer Weather Outlook. Temperatures, Precipitation, Drought, Hurricanes and why we care
 2013 Summer Weather Outlook Temperatures, Precipitation, Drought, Hurricanes and why we care Role of the ERCOT Meteorologist Forecasts Develop temperature input for hourly load forecasts (next day, days
2016 Hurricane Season Preview
 2016 Hurricane Season Preview Eric Uhlhorn, Ph.D. 1 2 Recap of 2015 Hurricane Season - El Niño played a significant role in activity - Atlantic activity was slightly below normal 11 named storms, 4 hurricanes,
Seasonal Climate Watch June to October 2018
 Seasonal Climate Watch June to October 2018 Date issued: May 28, 2018 1. Overview The El Niño-Southern Oscillation (ENSO) has now moved into the neutral phase and is expected to rise towards an El Niño
Climatography of the United States No
 Climate Division: AK 5 NWS Call Sign: ANC Month (1) Min (2) Month(1) Extremes Lowest (2) Temperature ( F) Lowest Month(1) Degree s (1) Base Temp 65 Heating Cooling 90 Number of s (3) Jan 22.2 9.3 15.8
2003 Water Year Wrap-Up and Look Ahead
 2003 Water Year Wrap-Up and Look Ahead Nolan Doesken Colorado Climate Center Prepared by Odie Bliss http://ccc.atmos.colostate.edu Colorado Average Annual Precipitation Map South Platte Average Precipitation
Tokyo Climate Center Website (TCC website) and its products -For monitoring the world climate and ocean-
 and its products -For monitoring the world climate and ocean-") Tokyo, 14 November 2016, TCC Training Seminar Tokyo Climate Center Website (TCC website) and its products -For monitoring the world climate and ocean- Yasushi MOCHIZUKI Tokyo Climate Center Japan Meteorological
Tokyo, 14 November 2016, TCC Training Seminar Tokyo Climate Center Website (TCC website) and its products -For monitoring the world climate and ocean- Yasushi MOCHIZUKI Tokyo Climate Center Japan Meteorological
Multivariate Regression Model Results
 Updated: August, 0 Page of Multivariate Regression Model Results 4 5 6 7 8 This exhibit provides the results of the load model forecast discussed in Schedule. Included is the forecast of short term system
Drought and Climate Extremes Indices for the North American Drought Monitor and North America Climate Extremes Monitoring System. Richard R. Heim Jr.
 Drought and Climate Extremes Indices for the North American Drought Monitor and North America Climate Extremes Monitoring System Richard R. Heim Jr. NOAA/NESDIS/National Climatic Data Center Asheville,
Drought in Southeast Colorado
 Drought in Southeast Colorado Nolan Doesken and Roger Pielke, Sr. Colorado Climate Center Prepared by Tara Green and Odie Bliss http://climate.atmos.colostate.edu 1 Historical Perspective on Drought Tourism
Challenges to Improving the Skill of Weekly to Seasonal Climate Predictions. David DeWitt with contributions from CPC staff
 Challenges to Improving the Skill of Weekly to Seasonal Climate Predictions David DeWitt with contributions from CPC staff 1 Outline CPC Background Prediction, monitoring, diagnostics, and climate services
A Report on a Statistical Model to Forecast Seasonal Inflows to Cowichan Lake
 A Report on a Statistical Model to Forecast Seasonal Inflows to Cowichan Lake Prepared by: Allan Chapman, MSc, PGeo Hydrologist, Chapman Geoscience Ltd., and Former Head, BC River Forecast Centre Victoria
Assessment of the Impact of El Niño-Southern Oscillation (ENSO) Events on Rainfall Amount in South-Western Nigeria
 Events on Rainfall Amount in South-Western Nigeria") 2016 Pearl Research Journals Journal of Physical Science and Environmental Studies Vol. 2 (2), pp. 23-29, August, 2016 ISSN 2467-8775 Full Length Research Paper http://pearlresearchjournals.org/journals/jpses/index.html
2016 Pearl Research Journals Journal of Physical Science and Environmental Studies Vol. 2 (2), pp. 23-29, August, 2016 ISSN 2467-8775 Full Length Research Paper http://pearlresearchjournals.org/journals/jpses/index.html
Sierra Weather and Climate Update
 Sierra Weather and Climate Update 2014-15 Kelly Redmond Western Regional Climate Center Desert Research Institute Reno Nevada Yosemite Hydroclimate Workshop Yosemite Valley, 2015 October 8-9 Percent of
Chiang Rai Province CC Threat overview AAS1109 Mekong ARCC
 Chiang Rai Province CC Threat overview AAS1109 Mekong ARCC This threat overview relies on projections of future climate change in the Mekong Basin for the period 2045-2069 compared to a baseline of 1980-2005.
Seasonal Climate Watch September 2018 to January 2019
 Seasonal Climate Watch September 2018 to January 2019 Date issued: Aug 31, 2018 1. Overview The El Niño-Southern Oscillation (ENSO) is still in a neutral phase and is still expected to rise towards an
COUNTRY REPORT. Jakarta. July, th National Directorate of Meteorology and Geophysics of Timor-Leste (DNMG)
") The Southeastern Asia-Oceania Flash Flood COUNTRY REPORT Jakarta. July, 10-12 th 2017 National Directorate of Meteorology and Geophysics of Timor-Leste (DNMG) Carla Feritas and Crisostimo Lobato Democratic
The Southeastern Asia-Oceania Flash Flood COUNTRY REPORT Jakarta. July, 10-12 th 2017 National Directorate of Meteorology and Geophysics of Timor-Leste (DNMG) Carla Feritas and Crisostimo Lobato Democratic
Seasonal Climate Watch July to November 2018
 Seasonal Climate Watch July to November 2018 Date issued: Jun 25, 2018 1. Overview The El Niño-Southern Oscillation (ENSO) is now in a neutral phase and is expected to rise towards an El Niño phase through
YACT (Yet Another Climate Tool)? The SPI Explorer
? The SPI Explorer") YACT (Yet Another Climate Tool)? The SPI Explorer Mike Crimmins Assoc. Professor/Extension Specialist Dept. of Soil, Water, & Environmental Science The University of Arizona Yes, another climate tool for
YACT (Yet Another Climate Tool)? The SPI Explorer Mike Crimmins Assoc. Professor/Extension Specialist Dept. of Soil, Water, & Environmental Science The University of Arizona Yes, another climate tool for
OVERVIEW OF IMPROVED USE OF RS INDICATORS AT INAM. Domingos Mosquito Patricio
 OVERVIEW OF IMPROVED USE OF RS INDICATORS AT INAM Domingos Mosquito Patricio domingos.mosquito@gmail.com Introduction to Mozambique /INAM Introduction to AGRICAB/SPIRITS Objectives Material & Methods Results
The Role of Weather in Risk Management For the Market Technician s Association October 15, 2013
 The Role of Weather in Risk Management For the Market Technician s Association October 15, 2013 RIA PERSAD President StatWeather rpersad@statweather.com Predictive Analytics Consumer Behavior Astronomy
DRIVING ROI. The Business Case for Advanced Weather Solutions for the Energy Market
 DRIVING ROI The Business Case for Advanced Weather Solutions for the Energy Market Table of Contents Energy Trading Challenges 3 Skill 4 Speed 5 Precision 6 Key ROI Findings 7 About The Weather Company
peak half-hourly New South Wales
 Forecasting long-term peak half-hourly electricity demand for New South Wales Dr Shu Fan B.S., M.S., Ph.D. Professor Rob J Hyndman B.Sc. (Hons), Ph.D., A.Stat. Business & Economic Forecasting Unit Report
Climatography of the United States No
 No. 2 1971-2 Asheville, North Carolina 2881 COOP ID: 46175 Climate Division: CA 6 NWS Call Sign: 3L3 Elevation: 1 Feet Lat: 33 Month (1) Min (2) Month(1) Extremes Lowest (2) Temperature ( F) Lowest Month(1)
Climatography of the United States No
 No. 2 1971-2 Asheville, North Carolina 2881 COOP ID: 42713 Climate Division: CA 7 NWS Call Sign: Elevation: -3 Feet Lat: 32 Month (1) Min (2) Month(1) Extremes Lowest (2) Temperature ( F) Lowest Month(1)
Climate also has a large influence on how local ecosystems have evolved and how we interact with them.
 The Mississippi River in a Changing Climate By Paul Lehman, P.Eng., General Manager Mississippi Valley Conservation (This article originally appeared in the Mississippi Lakes Association s 212 Mississippi
ENSO UPDATE By Joseph D Aleo, CCM
 ENSO UPDATE By Joseph D Aleo, CCM El Nino is still hanging on but likely not for very long. Warmer than normal water can still be seen along the equator in the tropical Pacific. It is even warmer in the
Local Ctimatotogical Data Summary White Hall, Illinois
 SWS Miscellaneous Publication 98-5 STATE OF ILLINOIS DEPARTMENT OF ENERGY AND NATURAL RESOURCES Local Ctimatotogical Data Summary White Hall, Illinois 1901-1990 by Audrey A. Bryan and Wayne Armstrong Illinois
International Desks: African Training Desk and Projects
 The Climate Prediction Center International Desks: African Training Desk and Projects Wassila M. Thiaw Team Leader Climate Prediction Center National Centers for Environmental Predictions 1 African Desk
Climatography of the United States No
 Climate Division: CA 5 NWS Call Sign: Elevation: 6 Feet Lat: 37 Month (1) Min (2) Month(1) Extremes Lowest (2) Temperature ( F) Lowest Month(1) Degree s (1) Base Temp 65 Heating Cooling 1 Number of s (3)
Climatography of the United States No
 Climate Division: CA 4 NWS Call Sign: Elevation: 2 Feet Lat: 37 Month (1) Min (2) Month(1) Extremes Lowest (2) Temperature ( F) Lowest Month(1) Degree s (1) Base Temp 65 Heating Cooling 1 Number of s (3)
 http://www.wrcc.dri.edu/csc/scenic/ USER GUIDE 2017 Introduction... 2 Overview Data... 3 Overview Analysis Tools... 4 Overview Monitoring Tools... 4 SCENIC structure and layout... 5... 5 Detailed Descriptions
Climatography of the United States No
 Climate Division: CA 4 NWS Call Sign: Elevation: 13 Feet Lat: 36 Month (1) Min (2) Month(1) Extremes Lowest (2) Temperature ( F) Lowest Month(1) Degree s (1) Base Temp 65 Heating Cooling 1 Number of s
Climatography of the United States No
 Climate Division: CA 5 NWS Call Sign: Elevation: 1,14 Feet Lat: 36 Month (1) Min (2) Month(1) Extremes Lowest (2) Temperature ( F) Lowest Month(1) Degree s (1) Base Temp 65 Heating Cooling 1 Number of
Fire Season Prediction for Canada, Kerry Anderson Canadian Forest Service
 Fire Season Prediction for Canada, 2014 Kerry Anderson Canadian Forest Service 1 Introduction The Canadian Forest Service is now presenting monthly and seasonal forecast maps through the Canadian Wildland
What is the difference between Weather and Climate?
 What is the difference between Weather and Climate? Objective Many people are confused about the difference between weather and climate. This makes understanding the difference between weather forecasts
Climatography of the United States No
 Month (1) Min (2) Month(1) Extremes Lowest (2) Temperature ( F) Lowest Month(1) Degree s (1) Base Temp 65 Heating Cooling 100 Number of s (3) Jan 63.9 39.3 51.6 86 1976 16 56.6 1986 20 1976 2 47.5 1973
Climatography of the United States No
 Temperature ( F) Month (1) Min (2) Month(1) Extremes Lowest (2) Lowest Month(1) Degree s (1) Base Temp 65 Heating Cooling 100 Number of s (3) Jan 32.8 21.7 27.3 62 1918 1 35.8 1983-24 1950 29 10.5 1979
Eric Snodgrass Co-Founder and Senior Atmospheric Scientist of Agrible, Inc Director of Undergraduate Studies Department of Atmospheric Sciences
 Eric Snodgrass Co-Founder and Senior Atmospheric Scientist of Agrible, Inc Director of Undergraduate Studies Department of Atmospheric Sciences University Of Illinois Urbana-Champaign snodgrss@illinois.edu
Weather Analysis and Forecasting
 Weather Analysis and Forecasting An Information Statement of the American Meteorological Society (Adopted by AMS Council on 25 March 2015) Bull. Amer. Meteor. Soc., 88 This Information Statement describes
NatGasWeather.com Daily Report
 NatGasWeather.com Daily Report Issue Time: 5:15 am EDT Wednesday, March 22 nd, 2017 1-7 Day Weather Summary (Mar 22-28 th ): A cold blast will sweep across the Great Lakes and eastern US today and Thursday
Integrated Electricity Demand and Price Forecasting
 Integrated Electricity Demand and Price Forecasting Create and Evaluate Forecasting Models The many interrelated factors which influence demand for electricity cannot be directly modeled by closed-form
Introduction to Climatology. GEOG/ENST 2331: Lecture 1
 Introduction to Climatology GEOG/ENST 2331: Lecture 1 Us! Graham Saunders (RC 2006C) graham.saundersl@lakeheadu.ca! Jason Freeburn (RC 2004) jtfreebu@lakeheadu.ca Graham Saunders! Australian Weather Bureau!
Changing Hydrology under a Changing Climate for a Coastal Plain Watershed
 Changing Hydrology under a Changing Climate for a Coastal Plain Watershed David Bosch USDA-ARS, Tifton, GA Jeff Arnold ARS Temple, TX and Peter Allen Baylor University, TX SEWRU Objectives 1. Project changes
Climatography of the United States No
 Climate Division: CA 6 NWS Call Sign: LAX Elevation: 1 Feet Lat: 33 Month (1) Min (2) Month(1) Extremes Lowest (2) Temperature ( F) Lowest Month(1) Degree s (1) Base Temp 65 Heating Cooling 1 Number of
Climatography of the United States No
 Climate Division: CA 6 NWS Call Sign: TOA Elevation: 11 Feet Lat: 33 2W Temperature ( F) Month (1) Min (2) Month(1) Extremes Lowest (2) Lowest Month(1) Degree s (1) Base Temp 65 Heating Cooling 1 Number
Seasonal Climate Watch February to June 2018
 Seasonal Climate Watch February to June 2018 Date issued: Jan 26, 2018 1. Overview The El Niño-Southern Oscillation (ENSO) is expected to remain in a weak La Niña phase through to early autumn (Feb-Mar-Apr).
Climatography of the United States No
 No. 2 1971-2 Asheville, North Carolina 2881 COOP ID: 46646 Climate Division: CA 4 NWS Call Sign: 8W Month (1) Min (2) Month(1) Extremes Lowest (2) Temperature ( F) Lowest Month(1) Degree s (1) Base Temp
Climatography of the United States No
 No. 2 1971-2 Asheville, North Carolina 2881 COOP ID: 4792 Climate Division: CA 6 NWS Call Sign: Month (1) Min (2) Month(1) Extremes Lowest (2) Temperature ( F) Lowest Month(1) Degree s (1) Base Temp 65
Missouri River Basin Water Management Monthly Update
 Missouri River Basin Water Management Monthly Update Participating Agencies 255 255 255 237 237 237 0 0 0 217 217 217 163 163 163 200 200 200 131 132 122 239 65 53 80 119 27 National Oceanic and Atmospheric
CATCHMENT DESCRIPTION. Little River Catchment Management Plan Stage I Report Climate 4.0
 CATCHMENT DESCRIPTION Little River Catchment Management Plan Stage I Report Climate 4. Little River Catchment Management Plan Stage I Report Climate 4.1 4. CLIMATE 4.1 INTRODUCTION Climate is one of the
South Eastern Australian Rainfall in relation to the Mean Meridional Circulation
 South Eastern Australian Rainfall in relation to the Mean Meridional Circulation Bertrand Timbal, Hanh Nguyen, Robert Fawcett, Wasyl Drosdowsky and Chris Lucas CAWCR / Bureau of Meteorology Long-term SEA
Climatography of the United States No
 Climate Division: CA 4 NWS Call Sign: Month (1) Min (2) Month(1) Extremes Lowest (2) Temperature ( F) Lowest Month(1) Degree s (1) Base Temp 65 Heating Cooling 100 Number of s (3) Jan 55.6 39.3 47.5 77
Climatography of the United States No
 Climate Division: CA 5 NWS Call Sign: Month (1) Min (2) Month(1) Extremes Lowest (2) Temperature ( F) Lowest Month(1) Degree s (1) Base Temp 65 Heating Cooling 100 Number of s (3) Jan 56.6 36.5 46.6 81
Climatography of the United States No
 Climate Division: CA 1 NWS Call Sign: Month (1) Min (2) Month(1) Extremes Lowest (2) Temperature ( F) Lowest Month(1) Degree s (1) Base Temp 65 Heating Cooling 100 Number of s (3) Jan 57.9 38.9 48.4 85
Climatography of the United States No
 Climate Division: CA 5 NWS Call Sign: Month (1) Min (2) Month(1) Extremes Lowest (2) Temperature ( F) Lowest Month(1) Degree s (1) Base Temp 65 Heating Cooling 100 Number of s (3) Jan 44.8 25.4 35.1 72
Climatography of the United States No
 Climate Division: CA 4 NWS Call Sign: Month (1) Min (2) Month(1) Extremes Lowest (2) Temperature ( F) Lowest Month(1) Degree s (1) Base Temp 65 Heating Cooling 100 Number of s (3) Jan 49.4 37.5 43.5 73
Climatography of the United States No
 Climate Division: CA 6 NWS Call Sign: Month (1) Min (2) Month(1) Extremes Lowest (2) Temperature ( F) Lowest Month(1) Degree s (1) Base Temp 65 Heating Cooling 100 Number of s (3) Jan 69.4 46.6 58.0 92
Climatography of the United States No
 Climate Division: CA 4 NWS Call Sign: Month (1) Min (2) Month(1) Extremes Lowest (2) Temperature ( F) Lowest Month(1) Degree s (1) Base Temp 65 Heating Cooling 1 Number of s (3) Jan 58.5 38.8 48.7 79 1962
Climatography of the United States No
 Climate Division: CA 6 NWS Call Sign: Month (1) Min (2) Month(1) Extremes Lowest (2) Temperature ( F) Lowest Month(1) Degree s (1) Base Temp 65 Heating Cooling 1 Number of s (3) Jan 67.5 42. 54.8 92 1971
Climatography of the United States No
 Climate Division: CA 1 NWS Call Sign: Month (1) Min (2) Month(1) Extremes Lowest (2) Temperature ( F) Lowest Month(1) Degree s (1) Base Temp 65 Heating Cooling 1 Number of s (3) Jan 57.8 39.5 48.7 85 1962
The Energy Markets. Use and interpretation of medium to extended range products. ECMWF, Reading, 14 th of November 2005
 The Energy Markets Use and interpretation of medium to extended range products ECMWF, Reading, 14 th of November 2005 drs. Stefan Meulemans, MSc Sempra Energy Europe Ltd. London smeulemans@sempracommodities.com
Climatography of the United States No
 No. 2 1971-2 Asheville, North Carolina 2881 COOP ID: 43417 Climate Division: CA 4 NWS Call Sign: N Lon: 121 Month (1) Min (2) Month(1) Extremes Lowest (2) Temperature ( F) Lowest Month(1) Degree s (1)
Missouri River Basin Water Management Monthly Update
 Missouri River Basin Water Management Monthly Update Participating Agencies 255 255 255 237 237 237 0 0 0 217 217 217 163 163 163 200 200 200 131 132 122 239 65 53 80 119 27 National Oceanic and Atmospheric
Climatography of the United States No
 Climate Division: ND 8 NWS Call Sign: BIS Month (1) Min (2) Month(1) Extremes Lowest (2) Temperature ( F) Lowest Month(1) Degree s (1) Base Temp 65 Heating Cooling 100 Number of s (3) Jan 21.1 -.6 10.2
Climatography of the United States No
 No. 2 1971-2 Asheville, North Carolina 2881 COOP ID: 4795 Climate Division: CA 6 NWS Call Sign: SBA Month (1) Min (2) Month(1) Extremes Lowest (2) Temperature ( F) Lowest Month(1) Degree s (1) Base Temp
Climatography of the United States No
 Climate Division: TN 1 NWS Call Sign: Month (1) Min (2) Month(1) Extremes Lowest (2) Temperature ( F) Lowest Month(1) Degree s (1) Base Temp 65 Heating Cooling 100 Number of s (3) Jan 47.6 24.9 36.3 81
Climatography of the United States No
 Climate Division: CA 5 NWS Call Sign: FAT Month (1) Min (2) Month(1) Extremes Lowest (2) Temperature ( F) Lowest Month(1) Degree s (1) Base Temp 65 Heating Cooling 1 Number of s (3) Jan 53.6 38.4 46. 78
U.S. Outlook For October and Winter Thursday, September 19, 2013
 About This report coincides with today s release of the monthly temperature and precipitation outlooks for the U.S. from the Climate Prediction Center (CPC). U.S. CPC October and Winter Outlook The CPC
Climatography of the United States No
 Climate Division: CA 6 NWS Call Sign: 1L2 N Lon: 118 3W Month (1) Min (2) Month(1) Extremes Lowest (2) Temperature ( F) Lowest Month(1) Degree s (1) Base Temp 65 Heating Cooling 1 Number of s (3) Jan 63.7
Climatography of the United States No
 Climate Division: CA 5 NWS Call Sign: BFL Month (1) Min (2) Month(1) Extremes Lowest (2) Temperature ( F) Lowest Month(1) Degree s (1) Base Temp 65 Heating Cooling 1 Number of s (3) Jan 56.3 39.3 47.8
THEME: Seasonal forecast: Climate Service for better management of risks and opportunities
 CENTRE AFRICAIN POUR LES APPLICATIONS DE LA METEOROLOGIE AU DEVELOPPEMENT AFRICAN CENTRE OF METEOROLOGICAL APPLICATIONS FOR DEVELOPMENT Institution Africaine parrainée par la CEA et l OMM African Institution
Computing & Telecommunications Services Monthly Report January CaTS Help Desk. Wright State University (937)
") January 215 Monthly Report Computing & Telecommunications Services Monthly Report January 215 CaTS Help Desk (937) 775-4827 1-888-775-4827 25 Library Annex helpdesk@wright.edu www.wright.edu/cats/ Last
January 215 Monthly Report Computing & Telecommunications Services Monthly Report January 215 CaTS Help Desk (937) 775-4827 1-888-775-4827 25 Library Annex helpdesk@wright.edu www.wright.edu/cats/ Last
Missouri River Basin Water Management Monthly Update
 Missouri River Basin Water Management Monthly Update Participating Agencies 255 255 255 237 237 237 0 0 0 217 217 217 163 163 163 200 200 200 131 132 122 239 65 53 80 119 27 National Oceanic and Atmospheric
SYSTEM BRIEF DAILY SUMMARY
 SYSTEM BRIEF DAILY SUMMARY * ANNUAL MaxTemp NEL (MWH) Hr Ending Hr Ending LOAD (PEAK HOURS 7:00 AM TO 10:00 PM MON-SAT) ENERGY (MWH) INCREMENTAL COST DAY DATE Civic TOTAL MAXIMUM @Max MINIMUM @Min FACTOR
Climatography of the United States No
 Climate Division: TN 3 NWS Call Sign: BNA Month (1) Min (2) Month(1) Extremes Lowest (2) Temperature ( F) Lowest Month(1) Degree s (1) Base Temp 65 Heating Cooling 100 Number of s (3) Jan 45.6 27.9 36.8
Climate Variability. Andy Hoell - Earth and Environmental Systems II 13 April 2011
 Climate Variability Andy Hoell - andrew_hoell@uml.edu Earth and Environmental Systems II 13 April 2011 The Earth System Earth is made of several components that individually change throughout time, interact
Supplementary appendix
 Supplementary appendix This appendix formed part of the original submission and has been peer reviewed. We post it as supplied by the authors. Supplement to: Lowe R, Stewart-Ibarra AM, Petrova D, et al.
Climatography of the United States No
 Month (1) Min (2) Month(1) Extremes Lowest (2) Temperature ( F) Lowest Month(1) Degree s (1) Base Temp 65 Heating Cooling 100 Number of s (3) 42.6 24.2 33.4 79 1950 25 44.2 1974-16 1994 19 18.8 1977 977
The Climate of Bryan County
 The Climate of Bryan County Bryan County is part of the Crosstimbers throughout most of the county. The extreme eastern portions of Bryan County are part of the Cypress Swamp and Forest. Average annual
August Forecast Update for Atlantic Hurricane Activity in 2015
 August Forecast Update for Atlantic Hurricane Activity in 2015 Issued: 5 th August 2015 by Professor Mark Saunders and Dr Adam Lea Dept. of Space and Climate Physics, UCL (University College London), UK
Seasonal Climate Watch November 2017 to March 2018
 Seasonal Climate Watch November 2017 to March 2018 Date issued: Oct 26, 2017 1. Overview The El Niño Southern Oscillation (ENSO) continues to develop towards a La Niña state, and is expected to be in at
Will a warmer world change Queensland s rainfall?
 Will a warmer world change Queensland s rainfall? Nicholas P. Klingaman National Centre for Atmospheric Science-Climate Walker Institute for Climate System Research University of Reading The Walker-QCCCE
MDA WEATHER SERVICES AG WEATHER OUTLOOK. Kyle Tapley-Senior Agricultural Meteorologist May 22, 2014 Chicago, IL
 MDA WEATHER SERVICES AG WEATHER OUTLOOK Kyle Tapley-Senior Agricultural Meteorologist May 22, 2014 Chicago, IL GLOBAL GRAIN NORTH AMERICA 2014 Agenda Spring Recap North America Forecast El Niño Discussion
August Forecast Update for Atlantic Hurricane Activity in 2012
 August Forecast Update for Atlantic Hurricane Activity in 2012 Issued: 6 th August 2012 by Professor Mark Saunders and Dr Adam Lea Dept. of Space and Climate Physics, UCL (University College London), UK
NOAA s Climate Normals. Pre-release Webcast presented by NOAA s National Climatic Data Center June 13, 2011
 NOAA s 1981-2010 Climate Normals Pre-release Webcast presented by NOAA s National Climatic Data Center June 13, 2011 Takeaway Messages Most Normals will be available July 1 via FTP NWS Normals to be loaded
Climatography of the United States No
 Month (1) Min (2) Month(1) Extremes Lowest (2) Temperature ( F) Lowest Month(1) Degree s (1) Base Temp 65 Heating Cooling 100 Number of s (3) Jan 54.3 40.1 47.2 75 1998 17 53.0 1995 18 1949 11 41.7 1972
Lesson 8: Variability in a Data Distribution
 Classwork Example 1: Comparing Two Distributions Robert s family is planning to move to either New York City or San Francisco. Robert has a cousin in San Francisco and asked her how she likes living in
Presentation Overview. Southwestern Climate: Past, present and future. Global Energy Balance. What is climate?
 Southwestern Climate: Past, present and future Mike Crimmins Climate Science Extension Specialist Dept. of Soil, Water, & Env. Science & Arizona Cooperative Extension The University of Arizona Presentation
ALASKA REGION CLIMATE OUTLOOK BRIEFING. December 22, 2017 Rick Thoman National Weather Service Alaska Region
 ALASKA REGION CLIMATE OUTLOOK BRIEFING December 22, 2017 Rick Thoman National Weather Service Alaska Region Today s Outline Feature of the month: Autumn sea ice near Alaska Climate Forecast Basics Climate
ANNUAL CLIMATE REPORT 2016 SRI LANKA
 ANNUAL CLIMATE REPORT 2016 SRI LANKA Foundation for Environment, Climate and Technology C/o Mahaweli Authority of Sri Lanka, Digana Village, Rajawella, Kandy, KY 20180, Sri Lanka Citation Lokuhetti, R.,
Responding to the 2016 and 2017 Mass Coral Bleaching events on the Great Barrier Reef: from Observations to Modelling
 Responding to the 2016 and 2017 Mass Coral Bleaching events on the Great Barrier Reef: from Observations to Modelling EMatson@aims Craig Steinberg & Claire Spillman N. Cantin, J. Benthuysen, H. Tonin,
Champaign-Urbana 2001 Annual Weather Summary
 Champaign-Urbana 2001 Annual Weather Summary ILLINOIS STATE WATER SURVEY 2204 Griffith Dr. Champaign, IL 61820 wxobsrvr@sws.uiuc.edu Maria Peters, Weather Observer January: After a cold and snowy December,
Climatography of the United States No
 Climate Division: CA 6 NWS Call Sign: Month (1) Min (2) Month(1) Extremes Lowest (2) Temperature ( F) Lowest Month(1) Degree s (1) Base Temp 65 Heating Cooling 100 Number of s (3) Jan 51.5 35.0 43.3 80
Climatography of the United States No
 Climate Division: CA 5 NWS Call Sign: Month (1) Min (2) Month(1) Extremes Lowest (2) Temperature ( F) Lowest Month(1) Degree s (1) Base Temp 65 Heating Cooling 100 Number of s (3) 59.3 31.5 45.4 80 1976