4) At the end of this presentation we have an operator that will organize the Q & A s.
|
|
|
- Aileen Scott
- 5 years ago
- Views:
Transcription

1 Hello and welcome to the next in a series of Missouri Basin specific climate outlook Webinars My name is Dennis Todey and I am the State Climatologist for the State of South Dakota. We are taking the opportunity to address some of the longer term weather and climate concerns in the basin to help you all plan a little better in the upcoming months. We hope to deliver information pertinent to your decision making needs. The we here is a group of agencies and partners including the USDA NRCS, USGS, National Drought Mitigation Center, USACE, state climatologists and High Plains Regional Climate Center that provide climate relevant information. So thanks to those other agencies and organizations for your input to this presentation. This Webinar is meant to be an overview of the current climate situation and what we may expect in the coming months. It is also meant primarily for stakeholders and partners in other agencies, tribes, state and local governments, universities and various interests from agriculture, water resources, natural resources and ecosystems. Let s start first with a quick look at the map on the first slide. As many of you know March went down as a very warm and record breaking month for the nation. Well over 5,000 records were set. This map shows that out of 118 years of record keeping the ranking by state of how warm it was. You can see how it easily was the warmest March on record. 1
 The next webinar will occur on July 19 th at 1 PM CDT.")
2 1) Our first central region climate/drought Outlook of this series responding to building drought conditions in the central port of the country including the Corn Belt and Great Plains. We will continue as conditions warrant to address issues with the drought and fires. 2) The next webinar will occur on July 19 th at 1 PM CDT. The webinar presenter is from the National Drought Mitigation Center (actual presenter is TBD). 3) A recording of this webinar will be available within 1-2 days at the links listed below at the Midwest Regional Climate Center and the High Plains Regional Climate Center 4) At the end of this presentation we have an operator that will organize the Q & A s. 5) We will appreciate your feedback on these and other climate services at that time or at any time. We will provide contact information at the end. 2

3 The structure of the webinars is to review current climate conditions and put them in some historical context. We will look back at what has led up to the situation we are in and then look ahead using the Climate Prediction Center Outlooks and Drought Monitor Outlooks. Pictured here is a grassland in Fall River County (far Southwest South Dakota) showing the condition of grass/rangeland and why there is great concern about fire. Actually several fires (some natural some human) have initiated in this area in the last few days. 3

4 Current situation has generally dry conditions over nearly the whole central part of the country except for far northern areas of MN and WI. Part of the issue been associated with dry conditions. We have some stations which have set record low precipitation totals for the last month to several months. Or they have been on the low end of the precipitation distribution. What has really impacted the dryness over much of the spring has been the heat. Warm temperatures have been very common and persistent. This condition has helped to move crop development. But it has also increased crop water use. Generally drier conditions in the west along with very low relative humidity (and limited snowpack) has led to the fires in throughout the front range of the Rockies. Looking ahead for this current week, much of the central part of the country is in a heat advisory because of heat and now higher dew points. This will help crops a little in reducing water use. From a human perspective it will be uncomfortable. We should remind livestock and pet owners about the potential for stress on livestock. All indications seem to agree that warmth will continue throughout the summer most likely. Precipitation changes are not as clear-cut. We ll talk a little more about that later. With the overall dry soil and ridge of high pressure we expect no major changes in the near term. 4
5 We are currently in ENSO-neutral conditions with a potential change to El Nino in the fall. There are conversations about the possibility of the shift to El Nino helping shift conditions. This shift does not seem to be likely in enough time to change the status for crop issues. 4
6 Now we will look at the precipitation conditions since October 1 st and other time periods. The goal here is to set the stage for what has occurred leading to the season. The roots of the current situation go back to the fall. Note that over much of the corn belt precipitation is % of average going back to October 1 (includes soil moisture recharge time). While this is not always a killer for the following season, it does increase the risk because of dry soils. Also not even drier conditions in the western plains. Fall is not a peak precipitation time there. But it does help to maintain wetness for the spring. Not shown, but remember that winter was warmer and likely allowed some additional loss of moisture in surface soils where snow cover often is. The lack of snow pack in the Rockies was a direct leader to the current fire situation. The overall lack of snow during the winter also probably allowed some drying of surface soils exposed to the air throughout the winter without being frozen for much of the time. This is somewhat speculative, but seems reasonable. 5

7 Skipping ahead to spring conditions looking at seasonal plots from the National Climatic Data Center. Spring temperatures were record or near-record warm across all of the Corn Belt into the Plains, particularly in March. Many places were actually warmer during March than April. This helped to push along crop development and made for a possible earlier planting season over many areas. It also introduced an early dormancy break, which along with a normal April freeze caused a great deal of damage in Michigan and some in surrounding states. (The Central Region Climate Response Team, which is helping with this webinar, is in final editing of a document reporting some of the impacts of the freeze. Note the overall rankings for climate divisions in March being record or near-record warm. The 2 nd map indicates spring precipitation ranking. There was a great deal of variability across the Corn Belt with northern areas actually being a little wet. Some of the east and south was quite dry. Overall this would not be indicative of serious conditions. The Rockies were also very dry in the spring. Combining dry conditions with warm temperatures dries surfaces and plants even more quickly. 6
8 Looking at precipitation for a slightly updated time frame to get a more current picture of precipitation. The image on the left is observed precipitation. The image on the right is percent of average since April 1. Similar patterns are very apparent with wetter conditions in eastern SD to MN where over 20 has fallen during this time. Much of the southern part of the corn belt less than 75% or even less than half average precipitation. This is the peak precipitation time of year and critical to crop development. 7
 in much of the Midwest.")
9 Moving to an even more immediate picture we drop to the last 30 days. It is during this time that precipitation has dropped off greatly leading to rapidly worsening drought conditions (termed flash droughts) in much of the Midwest. In some places of NE, SD, WI and IL-IN-KY there has been 10% of average precipitation or less. For corn this is a very critical time leading up to tasseling the reproductive stage of the plant. Crop stress at this time can cause large yield losses. 8

10 In conjunction with the dryness we have had very warm temperatures. Over the last 30 days temperatures have been well above average over most of the region. They have been warmest most significantly over the plains where temperatures during June were 6-9 F above average in the plains. During dry conditions, warm and dry in the plains usually go hand-in-hand because of surface processes. The main part of the corn belt has been warm, though not to the extent of the plains. While temperatures may not be running above average crops under stress cannot handle high temperatures. Climatological averages during this time of year are near potential stress levels. When a plant has reduced water available, it experiences stress and tries to accommodate for that stress by curling leaves (for corn) or turning over leaves (for soybeans). 9
 become concerned about the amount heat accumulated to push their crop along during the season to get to maturity before potential freeze in the fall.")
11 The warm temperatures have had some positive effect. Often producers (especially in northern states) become concerned about the amount heat accumulated to push their crop along during the season to get to maturity before potential freeze in the fall. In this map from the USDA-JAWF from the Weekly Weather and Crop Bulletin last week, you see departure from average growing degree days. The additional accumulation has pushed most crops along very early this year. The deviation from average GDDs puts crops ahead by 2-3 weeks in some places. Wheat harvest is moving along at near record pace. Crops are developing much earlier than some years. 10

12 The off-side of the warm temperatures we will talk about here. As mentioned conditions this spring have been somewhat to very dry depending on location, but very warm over the whole region. An additional impact of warm temperatures is to change the crop water use dynamic. The map on the right shows a large scale deviation from average for potential evaporation. Warmer temperatures in conjunction with lower relative humidity place more atmospheric demand on a plant for water. In response to the demand the plant uses more water. The areas in green to red in the right map show where more water could be used by the crop during the April-May period. June data are not available, yet. This crop water use is combined in a single term (evapo-transpiration) combining evaporation from the bare ground and transpiration from the plant. The issue this year is that soils over much of the corn belt we likely somewhat drier. Some places were quite dry. Others were not as bad. But wit increased ET, more water is used from dry soils and plant stress conditions occur earlier than we expect. Widespread maps of ET are not usually available because of the difficulty in assessing and measuring it. The High Plains Regional Climate Center does have daily and weekly maps potential ET (shown on the lower left). This map shows that during the last week a fully grown plant with enough water could be using as much 2 for the week. With limited water available and more being demanded by the atmosphere you can see why some issues have occurred this year. 11

13 Following on from the previous slide we need to talk about soil moisture. There are not widespread soil moisture measurements across states. A few states run their own networks. Thus, we are left with modeling the situation, which is difficult to do because of the issue with balancing precipitation and water use for various crops and conditions. This is one version of a soil moisture model from NLDAS through NOAA. The deviations are listed in mm (divide by roughly 25 to get inches) deviations are apparent in the orange to red colors. 12

14 Crop reports released yesterday highlight the agricultural impacts. Corn and soybean and shown here. Also reporting in bad conditions are pasture and hay ground. For corn, MO, IN and KY are near 50% poor to very poor. IL and KS are above 30 % Soybeans not as bad at the current time. MO still nearly 50% P to VP. IN and KY near 40%. 13
 to D4 (brown exceptional drought). It is very apparent the issues across the corn belt, great plains and across the country.")
15 Combining all the previous discussion we get to the current situation on the US Drought Monitor from last week. This map updates on Thursday mornings at 7 AM EDT. Conditions are shown from D0 (yellow- abnormally dry) to D4 (brown exceptional drought). It is very apparent the issues across the corn belt, great plains and across the country. The mid-section has up to D3 currently. The wetter areas from the spring in the north are not included, yet. Conditions continue to be very fluid with rapid changes. The new map this week will likely show additional worsening. Note that there are several categories on the USDM which have some specific guidelines. These are included on the link on the slide. What is most important is local input. We encourage everyone on the webinar to pass on location-specific comments observations to your state climatologist, regional climate centers or directly to the National Drought Mitigation Center. These reports are necessary to track local conditions. 14

16 Included here are the regional views for most of NOAA s Central Region. The USDM also has state views with county boundaries to help guide where the category lines are and place at the county level. 15

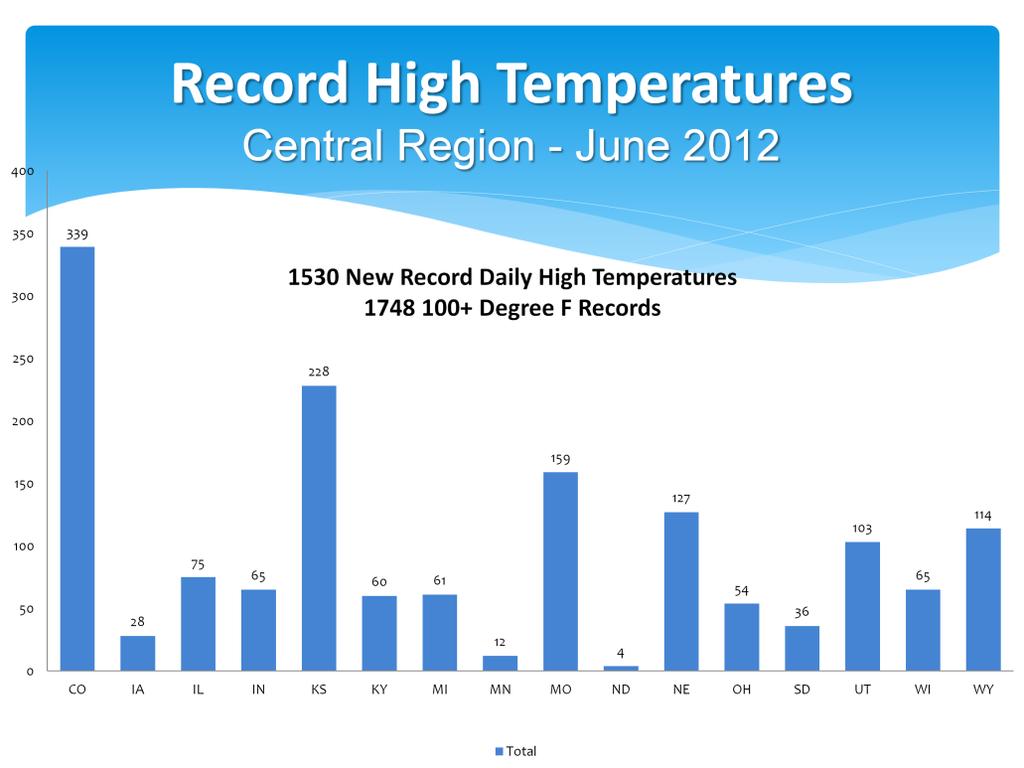
17 There are a large number of records being set from daily to monthly to seasonal. What is apparent it that the warm temperatures are we are seeing are not only warm for this time of year, they are warm overall. Records are being set for daily highs, monthly highs and even a few all time state monthly and all time overall highs. The overall highs are usually more in July than June showing how anomalous this pattern is. Records Temperature records 16
18 17

19 Impacts Hay bales 2/3 to ¾ weight color like fall in MO 18

20 Arapahoe 0% containment Some inkling that this could be a bad fire year. Dry conditions coming on the end of a wetter period. Lots of fuels. These are likely outdated already as conditions continue to be very fluid with the main part of the fire season ahead of us. 19

21 Now let s turn our attention to the outlooks. In the next few slides we will look at outlooks that are routinely issued as part of NOAA s operations. These figures come from the Climate Prediction Center. As we go through them you will see that they all use the same method and colors to describe the forecast. The maps all are based on probabilities. These probabilities show increased chances toward below or above average conditions at various locations or equal chances where there is not enough skill to change the outlook. More about understanding these outlook will occur in future webinars. One other note is that predictive skill during the warmer times of the year tend to be based less on large ocean connections like El Nino/La Nina and more on regional and even local conditions like soil moisture, elevation and many other effects. We can also look at trends over regions to help us determine if temperatures and precipitation has tended to rise or fall over time. 20

22 Here is a depiction of temperature, on the left, and precipitation probabilities on the right. For the temperature map the brownish colors indicate better chances for warmer conditions and blue colder. On the precipitation map the brown colors mean better chances of drier conditions and green wetter. White indicates near normal conditions most likely. The timing as you can see is for the week after next or days 8 through 14 in the future. The warmer conditions seem very likely to continue across the whole corn belt into the first part of July. Dry conditions and a ridge of high pressure parked in the southern US will continue to lead to warmer temperatures all across the northern part of the country. The precipitation pattern indicates more likely drier than average over much of the corn belt more likely in the eastern corn belt and Great Lakes. 21

23 July outlook, temperatures probabilities (left) precipitation probabilities (right). Temperatures are likely to continue warm throughout the month over nearly all the central US. Given the warmth in early July will likely dominate, that is most likely how the month would end up. Drier than average indications are maintained just still in a main part of the corn belt. There is a greatly reduced area of dryness than depicted in the 8-14 day outlook because of the overall uncertainty in precipitation. Warmth is still the most likely bet and impact producer. 22

24 The same color scheme applies again as with the previous maps. Warm temperatures are likely again through early fall. Dry soil moisture and no pattern change are the main culprits. Precipitation is not showing any specific indications. Once we reach fall, many things can change with changing atmospheric patterns which occur during the summer fall transition. The problem for the agricultural community is that the damage is already done by the time we reach fall. 23

25 Another product of the US Drought Monitor and the Climate Prediction Center is the Seasonal Drought Outlook. This map shows expected changed in areas that are already D1 or worse or expected to enter D1. The bulk of the region in drought is expected to stay in D-level conditions throughout the summer. Some changes are possible in far southern areas and northern areas where better precipitation chances exist. On the north end of the current drought areas, development is expected. Given the current situation large changes would have to occur immediately to resolve the current soil moisture and precipitation deficits. This is not likely. This would be the case over the whole corn belt. Deficits are very large with tasseling coming soon. The damage to crops is going to continue. The only question now is how severe will it be ongoing and how will newer varieties handle them. 24
26 To recap some of the main issues. Dry conditions and warmer temperatures are forming a double-whammy on much of the central region. Whenever years such as this come around people search for similar years on comparison. From a crop standpoint the comparison to 1988 has been passed around because it was the last major corn belt drought. We will have to see how we compare to 1988 and other years as we go along. One difference for 1988 was a little earlier onset of drought conditions. Discussion among several modelers who contributed to this webinar from NOAA and Iowa State compared this to 1980 as a later onset pattern. We will continue these comparison and may talk more about them in a later webinar. The main point in the outlook is that in the bulk of the corn belt little change is seen. Some indications of an early onset of the monsoon could bring some needed precipitation to the western part of the region. 25

27 We will load the recorded Webinar as quickly as we can at the web site mentioned on this slide. Several other links are included here as were ed after the webinar last month. 26

28 Thank you for coming everyone. What questions do you have at this point? I/We would like your feedback on the Webinar and it s worth to you. Please do not hesitate to your suggestions or questions to me at dennis.todey@sdstate.edu or doug.kluck@noaa.gov. We will now open it up to questions 27
4) At the end of this presentation we have an operator that will organize the Q & A s.
 At the end of this presentation we have an operator that will organize the Q & A s.") Welcome to the next in the series of central US drought status and outlook webinars through the cooperation of several regional partners including NOAA/USDA/RCCs/SCs and several other partnering groups.
Welcome to the next in the series of central US drought status and outlook webinars through the cooperation of several regional partners including NOAA/USDA/RCCs/SCs and several other partnering groups.
Midwest and Great Plains Climate- Drought Outlook 16 April 2015
 Midwest and Great Plains Climate- Drought Outlook 16 April 2015 Dr. Dennis Todey State Climatologist South Dakota State Univ. dennis.todey@sdstate.edu 605-688-5141 Photo taken Feb 19, 2013 Wildfire Wind
Midwest and Great Plains Climate- Drought Outlook 19 November 2015
 Midwest and Great Plains Climate- Drought Outlook 19 November 2015 Dr. Dennis Todey State Climatologist South Dakota State Univ. dennis.todey@sdstate.edu 605-688-5678 Photo taken Feb 19, 2013 SDSU Campus
Great Plains and Midwest Climate Outlook February 18, 2016
 Great Plains and Midwest Climate Outlook February 18, 2016 Dr. Jim Angel State Climatologist Illinois State Water Survey University of Illinois jimangel@illinois.edu General Information Providing climate
Midwest and Great Plains Climate- Drought Outlook 20 April 2017
 Midwest and Great Plains Climate- Drought Outlook 20 April 2017 Dr. Dennis Todey Director USDA Midwest Climate Hub Nat l Lab. for Ag. and Env. Ames, IA dennis.todey@ars.usda.gov 515-294-2013 Photo: BJ
Central Region Climate Outlook March20, 2014
 Central Region Climate Outlook March20, 2014 Dr. Jim Angel State Climatologist IL State Water Survey University of Illinois jimangel@illinois.edu 217-333-0729 Happy Spring Equinox! General Information
Central Region Climate Outlook May 15, 2014
 Central Region Climate Outlook May 15, 2014 Dr. Jim Angel State Climatologist IL State Water Survey University of Illinois jimangel@illinois.edu 217-333-0729 Chicago-area flooding General Information Providing
Midwest and Great Plains Climate- Drought Outlook 17 April 2014
 Midwest and Great Plains Climate- Drought Outlook 17 April 2014 Dr. Dennis Todey State Climatologist South Dakota State Univ. dennis.todey@sdstate.edu 605-688-5141 Photo taken Feb 19, 2013 Tornado-Trenton,
Oregon Water Conditions Report April 17, 2017
 Oregon Water Conditions Report April 17, 2017 Mountain snowpack continues to maintain significant levels for mid-april. By late March, statewide snowpack had declined to 118 percent of normal after starting
Midwest and Great Plains Climate and Drought Update
 Midwest and Great Plains Climate and Drought Update June 20,2013 Laura Edwards Climate Field Specialist Laura.edwards@sdstate.edu 605-626-2870 2012 Board of Regents, South Dakota State University General
Midwest and Great Plains Climate- Drought Outlook 17 July 2014
 Midwest and Great Plains Climate- Drought Outlook 17 July 2014 Dr. Dennis Todey State Climatologist South Dakota State Univ. dennis.todey@sdstate.edu 605-688-5141 Hail damaged tree Josh Boustead copyrighted
Great Plains and Midwest Climate Outlook 18 December 2014
 Great Plains and Midwest Climate Outlook 18 December 2014 Wendy Ryan Assistant State Climatologist Colorado State University wendy.ryan@colostate.edu 30 Nov 2014 Looking down at the Yampa Valley near Steamboat
Midwest/Great Plains Climate-Drought Outlook September 20, 2018
 Midwest/Great Plains Climate-Drought Outlook September 20, 2018 Brian Fuchs National Drought Mitigation Center University of Nebraska-Lincoln School of Natural Resources September 20, 2018 General Information
North Central U.S. Climate Summary & Outlook May 19, 2016
 North Central U.S. Climate Summary & Outlook May 19, 2016 Golf course Lincoln, NE Image courtesy Terry Sohl Hailstones Lincoln, NE Image courtesy Andrew Ozaki EF1 tornado Lincoln, NE May 9 Photo by Bill
Midwest and Great Plains Climate- Drought Outlook 21 August 2014
 Midwest and Great Plains Climate- Drought Outlook 21 August 2014 Dr. Jeff Andresen State Climatologist Michigan State University andresen@msu.edu 517-432-4756 Flooding along I-696 in Warren, MI 11 AUG
NIDIS Intermountain West Drought Early Warning System November 21, 2017
 NIDIS Drought and Water Assessment NIDIS Intermountain West Drought Early Warning System November 21, 2017 Precipitation The images above use daily precipitation statistics from NWS COOP, CoCoRaHS, and
Great Plains & Midwest Climate Outlook June 18, 2015
 Great Plains & Midwest Climate Outlook June 18, 2015 Pat Guinan Extension/State Climatologist University of Missouri guinanp@missouri.edu 573-882-5908 Saturated Soybeans, Monroe County, MO Yellow Corn,
CropCast Corn and Soybean Report Kenny Miller Monday, March 13, 2017
 Accumulated Rainfall (inches) Accumulated GDDs Temperature ( F)/Wind Speed (mph) Precipitation (inches) CropCast Corn and Soybean Report Kenny Miller Monday, March 13, 2017 Peoria, IL Regional Forecast
Great Plains and Midwest Drought Impacts and Outlook May 16, 2013
 Great Plains and Midwest Drought Impacts and Outlook May 16, 2013 Dr. Martha Shulski Director, High Plains Regional Climate Center University of Nebraska - Lincoln mshulski3@unl.edu 402-472-6711 May snow
Midwest and Great Plains Climate- Drought Outlook 20 October 2016
 Midwest and Great Plains Climate- Drought Outlook 20 October 2016 Laura Edwards Acting State Climatologist SDSU Extension, Aberdeen, SD Laura.edwards@sdstate.edu 605-626-2870 Cottonwood Fire 17 Oct 2016
Upper Missouri River Basin December 2017 Calendar Year Runoff Forecast December 5, 2017
 Upper Missouri River Basin December 2017 Calendar Year Runoff Forecast December 5, 2017 Calendar Year Runoff Forecast Explanation and Purpose of Forecast U.S. Army Corps of Engineers, Northwestern Division
NIDIS Intermountain West Drought Early Warning System January 16, 2018
 NIDIS Drought and Water Assessment NIDIS Intermountain West Drought Early Warning System January 16, 2018 Precipitation The images above use daily precipitation statistics from NWS COOP, CoCoRaHS, and
WeatherManager Weekly
 Issue 288 July 14, 2016 WeatherManager Weekly Industries We Serve Agriculture Energy/Utilities Construction Transportation Retail Our Weather Protection Products Standard Temperature Products Lowest Daily
CropCast Corn and Soybean Report Kenny Miller Friday, March 17, 2017
 Accumulated Rainfall (inches) Accumulated GDDs Temperature ( F)/Wind Speed (mph) Precipitation (inches) CropCast Corn and Soybean Report Kenny Miller Friday, March 17, 2017 Peoria, IL Regional Forecast
Midwest and Great Plains Drought and Climate Summary 20 February 2014
 Midwest and Great Plains Drought and Climate Summary 20 February 2014 Wendy Ryan Assistant State Climatologist Colorado Climate Center Colorado State University wendy.ryan@colostate.edu 970-491-8506 General
UNITED STATES AND SOUTH AMERICA OUTLOOK (FULL REPORT) Wednesday, April 18, 2018
 Wednesday, April 18, 2018") T-storm Weather Summary Coolness continues over the next week in much of the central U.S., most likely producing the coldest April since 1907 in the Corn Belt, but followed by seasonable to mild weather
T-storm Weather Summary Coolness continues over the next week in much of the central U.S., most likely producing the coldest April since 1907 in the Corn Belt, but followed by seasonable to mild weather
Weather and Climate Summary and Forecast February 2018 Report
 Weather and Climate Summary and Forecast February 2018 Report Gregory V. Jones Linfield College February 5, 2018 Summary: For the majority of the month of January the persistent ridge of high pressure
Missouri Basin Climate Outlook. 4 April 2014
 Missouri Basin Climate Outlook Dr. Dennis Todey South Dakota State Climatologist South Dakota State University 4 April, 2014 Dennis.todey@sdstate.edu 605-688-5141 4 April 2014 Gavins Point Dam July 2011
NIDIS Intermountain West Drought Early Warning System April 18, 2017
 1 of 11 4/18/2017 3:42 PM Precipitation NIDIS Intermountain West Drought Early Warning System April 18, 2017 The images above use daily precipitation statistics from NWS COOP, CoCoRaHS, and CoAgMet stations.
Midwest and Great Plains Climate & Drought Outlook 16 November 2017
 Midwest and Great Plains Climate & Drought Outlook 16 November 2017 Jim Angel IL State Climatologist University of Illinois Champaign, IL jimangel@illinois.edu 217-333-0729 Harvest underway in Illinois
UNITED STATES AND SOUTH AMERICA WEATHER ROUNDUP Sunday, December 17, 2017
 T-storm Weather Summary Extreme heat was followed by heavy rain in some key areas of Argentina yesterday. T-storms affect much of the driest Argentina, southern Brazil, and Paraguay through 7 to 10 days,
North Central U.S. Climate Summary & Outlook April 21, 2016
 North Central U.S. Climate Summary & Outlook April 21, 2016 Eskridge, KS Fire Chip Redmond Eskridge, KS Fire Chip Redmond Pat Guinan Extension/State Climatologist University of Missouri guinanp@missouri.edu
Weather and Climate Summary and Forecast August 2018 Report
 Weather and Climate Summary and Forecast August 2018 Report Gregory V. Jones Linfield College August 5, 2018 Summary: July 2018 will likely go down as one of the top five warmest July s on record for many
CropCast Corn and Soybean Report Kyle Tapley Monday, March 20, 2017
 Accumulated Rainfall (inches) Accumulated GDDs Temperature ( F)/Wind Speed (mph) Precipitation (inches) CropCast Corn and Soybean Report Kyle Tapley Monday, March 20, 2017 Peoria, IL Regional Forecast
Weather and Climate Summary and Forecast March 2018 Report
 Weather and Climate Summary and Forecast March 2018 Report Gregory V. Jones Linfield College March 7, 2018 Summary: The ridge pattern that brought drier and warmer conditions from December through most
CropCast Corn and Soybean Report Kenny Miller Tuesday, March 14, 2017
 Accumulated Rainfall (inches) Accumulated GDDs Temperature ( F)/Wind Speed (mph) Precipitation (inches) CropCast Corn and Soybean Report Kenny Miller Tuesday, March 14, 2017 Peoria, IL Regional Forecast
NIDIS Intermountain West Drought Early Warning System January 15, 2019
 NIDIS Drought and Water Assessment NIDIS Intermountain West Drought Early Warning System January 15, 2019 Precipitation The images above use daily precipitation statistics from NWS COOP, CoCoRaHS, and
NIDIS Intermountain West Drought Early Warning System February 6, 2018
 NIDIS Intermountain West Drought Early Warning System February 6, 2018 Precipitation The images above use daily precipitation statistics from NWS COOP, CoCoRaHS, and CoAgMet stations. From top to bottom,
NIDIS Intermountain West Regional Drought Early Warning System February 7, 2017
 NIDIS Drought and Water Assessment NIDIS Intermountain West Regional Drought Early Warning System February 7, 2017 Precipitation The images above use daily precipitation statistics from NWS COOP, CoCoRaHS,
UNITED STATES AND SOUTH AMERICA OUTLOOK (FULL REPORT) Thursday, December 28, 2017
 Thursday, December 28, 2017") T-storm Weather Summary Despite scattered t-storms Sat.-Sun. in central and northern areas in Argentina, more will likely be needed especially in sunflower areas of the southwest. Some t-storms likely
T-storm Weather Summary Despite scattered t-storms Sat.-Sun. in central and northern areas in Argentina, more will likely be needed especially in sunflower areas of the southwest. Some t-storms likely
UNITED STATES AND SOUTH AMERICA SNAPSHOT REPORT Thursday, December 21, 2017
 T-storm Weather Summary A small but key corn and soybean area in western Argentina was wetter than expected overnight. T-storms affect varying areas of South America at varying times into January, but
North Central U.S. Climate Summary and Outlook Webinar July 21, 2016
 North Central U.S. Climate Summary and Outlook Webinar July 21, 2016 Stuart Foster State Climatologist for Kentucky Department of Geography and Geology Western Kentucky University Stuart.foster@wku.edu
NIDIS Intermountain West Drought Early Warning System October 30, 2018
 10/30/2018 NIDIS Drought and Water Assessment NIDIS Intermountain West Drought Early Warning System October 30, 2018 Precipitation The images above use daily precipitation statistics from NWS COOP, CoCoRaHS,
Weather and Climate Summary and Forecast Summer 2017
 Weather and Climate Summary and Forecast Summer 2017 Gregory V. Jones Southern Oregon University August 4, 2017 July largely held true to forecast, although it ended with the start of one of the most extreme
Missouri River Basin Water Management Monthly Update
 Missouri River Basin Water Management Monthly Update Participating Agencies 255 255 255 237 237 237 0 0 0 217 217 217 163 163 163 200 200 200 131 132 122 239 65 53 80 119 27 National Oceanic and Atmospheric
Upper Missouri River Basin February 2018 Calendar Year Runoff Forecast February 6, 2018
 Upper Missouri River Basin February 2018 Calendar Year Runoff Forecast February 6, 2018 Calendar Year Runoff Forecast Explanation and Purpose of Forecast U.S. Army Corps of Engineers, Northwestern Division
Oregon Water Conditions Report May 1, 2017
 Oregon Water Conditions Report May 1, 2017 Mountain snowpack in the higher elevations has continued to increase over the last two weeks. Statewide, most low and mid elevation snow has melted so the basin
Weather and Climate Summary and Forecast January 2018 Report
 Weather and Climate Summary and Forecast January 2018 Report Gregory V. Jones Linfield College January 5, 2018 Summary: A persistent ridge of high pressure over the west in December produced strong inversions
NIDIS Intermountain West Drought Early Warning System October 17, 2017
 NIDIS Drought and Water Assessment NIDIS Intermountain West Drought Early Warning System October 17, 2017 Precipitation The images above use daily precipitation statistics from NWS COOP, CoCoRaHS, and
NIDIS Intermountain West Drought Early Warning System September 4, 2018
 NIDIS Drought and Water Assessment NIDIS Intermountain West Drought Early Warning System September 4, 2018 Precipitation The images above use daily precipitation statistics from NWS COOP, CoCoRaHS, and
Weather and Climate Summary and Forecast Summer into Harvest 2016
 Weather and Climate Summary and Forecast Summer into Harvest 2016 Gregory V. Jones Southern Oregon University September 3, 2016 With school and football season starting a hint of fall is right on time
National Wildland Significant Fire Potential Outlook
 National Wildland Significant Fire Potential Outlook National Interagency Fire Center Predictive Services Issued: September, 2007 Wildland Fire Outlook September through December 2007 Significant fire
Weather and Climate Summary and Forecast October 2017 Report
 Weather and Climate Summary and Forecast October 2017 Report Gregory V. Jones Linfield College October 4, 2017 Summary: Typical variability in September temperatures with the onset of fall conditions evident
NIDIS Intermountain West Drought Early Warning System February 12, 2019
 NIDIS Intermountain West Drought Early Warning System February 12, 2019 Precipitation The images above use daily precipitation statistics from NWS COOP, CoCoRaHS, and CoAgMet stations. From top to bottom,
Weather and Climate Summary and Forecast January 2019 Report
 Weather and Climate Summary and Forecast January 2019 Report Gregory V. Jones Linfield College January 4, 2019 Summary: December was mild and dry over much of the west, while the east was much warmer than
Weather and Climate Summary and Forecast Winter
 Weather and Climate Summary and Forecast Winter 2016-17 Gregory V. Jones Southern Oregon University February 7, 2017 What a difference from last year at this time. Temperatures in January and February
Missouri River Basin Climate Outlook 1 May Dr. Dennis Todey State Climatologist South Dakota State Univ.
 Missouri River Basin Climate Outlook 1 May 2014 Dr. Dennis Todey State Climatologist South Dakota State Univ. dennis.todey@sdstate.edu 605-688-5141 Photo taken Feb 19, 2013 General Information Providing
NIDIS Intermountain West Drought Early Warning System May 1, 2018
 NIDIS Intermountain West Drought Early Warning System May 1, 2018 Precipitation The images above use daily precipitation statistics from NWS COOP, CoCoRaHS, and CoAgMet stations. From top to bottom, and
Midwest/Great Plains Climate-Drought Outlook August 17, 2017
 Midwest/Great Plains Climate-Drought Outlook August 17, 2017 Brian Fuchs National Drought Mitigation Center University of Nebraska-Lincoln School of Natural Resources General Information Providing climate
UNITED STATES AND SOUTH AMERICA SNAPSHOT REPORT Wednesday, December 20, 2017
 T-storm Weather Summary T-storms affect all growing areas of South America at one time or another over the next two weeks, but abovenormal rainfall is only likely for corn and soybeans in southern Brazil
Weather and Climate Risks and Effects on Agriculture
 Weather and Climate Risks and Effects on Agriculture Dr. Eric Snodgrass Official Journal of the Fluid Fertilizer Foundation Vol. 26, No. 2, Issue #100 DOWNLOAD Summary: So, what do we need to watch for?
MDA WEATHER SERVICES AG WEATHER OUTLOOK. Kyle Tapley-Senior Agricultural Meteorologist May 22, 2014 Chicago, IL
 MDA WEATHER SERVICES AG WEATHER OUTLOOK Kyle Tapley-Senior Agricultural Meteorologist May 22, 2014 Chicago, IL GLOBAL GRAIN NORTH AMERICA 2014 Agenda Spring Recap North America Forecast El Niño Discussion
2011 National Seasonal Assessment Workshop for the Eastern, Southern, & Southwest Geographic Areas
 2011 National Seasonal Assessment Workshop for the Eastern, Southern, & Southwest Geographic Areas On January 11-13, 2011, wildland fire, weather, and climate met virtually for the ninth annual National
NIDIS Intermountain West Drought Early Warning System May 23, 2017
 NIDIS Drought and Water Assessment NIDIS Intermountain West Drought Early Warning System May 23, 2017 Precipitation The images above use daily precipitation statistics from NWS COOP, CoCoRaHS, and CoAgMet
Weather and Climate Summary and Forecast December 2017 Report
 Weather and Climate Summary and Forecast December 2017 Report Gregory V. Jones Linfield College December 5, 2017 Summary: November was relatively cool and wet from central California throughout most of
Weather and Climate Summary and Forecast November 2017 Report
 Weather and Climate Summary and Forecast November 2017 Report Gregory V. Jones Linfield College November 7, 2017 Summary: October was relatively cool and wet north, while warm and very dry south. Dry conditions
National Wildland Significant Fire Potential Outlook
 National Wildland Significant Fire Potential Outlook National Interagency Fire Center Predictive Services Issued: April 1, 2008 Next Issue: May 1, 2008 Wildland Fire Outlook April 2008 through July 2008
NIDIS Intermountain West Drought Early Warning System November 13, 2018
 NIDIS Intermountain West Drought Early Warning System November 13, 2018 Precipitation The images above use daily precipitation statistics from NWS COOP, CoCoRaHS, and CoAgMet stations. From top to bottom,
Precipitation. Standardized Precipitation Index. NIDIS Intermountain West Regional Drought Early Warning System January 3, 2017
 1/3/2017 NIDIS Drought and Water Assessment NIDIS Intermountain West Regional Drought Early Warning System January 3, 2017 Precipitation The images above use daily precipitation statistics from NWS COOP,
Missouri River Basin Water Management Monthly Update
 Missouri River Basin Water Management Monthly Update Participating Agencies 255 255 255 237 237 237 0 0 0 217 217 217 163 163 163 200 200 200 131 132 122 239 65 53 80 119 27 National Oceanic and Atmospheric
Monthly Long Range Weather Commentary Issued: July 18, 2014 Steven A. Root, CCM, President/CEO
 Monthly Long Range Weather Commentary Issued: July 18, 2014 Steven A. Root, CCM, President/CEO sroot@weatherbank.com JUNE 2014 REVIEW Climate Highlights The Month in Review The average temperature for
An ENSO-Neutral Winter
 An ENSO-Neutral Winter This issue of the Blue Water Outlook newsletter is devoted towards my thoughts on the long range outlook for winter. You will see that I take a comprehensive approach to this outlook
Weather and Climate Summary and Forecast April 2018 Report
 Weather and Climate Summary and Forecast April 2018 Report Gregory V. Jones Linfield College April 4, 2018 Summary: A near Miracle March played out bringing cooler and wetter conditions to the majority
Weather and Climate Summary and Forecast Summer 2016
 Weather and Climate Summary and Forecast Summer 2016 Gregory V. Jones Southern Oregon University August 5, 2016 The month of July saw the continued flip, flop of the western US temperatures. It was warm
NIDIS Intermountain West Drought Early Warning System July 18, 2017
 NIDIS Drought and Water Assessment NIDIS Intermountain West Drought Early Warning System July 18, 2017 Precipitation The images above use daily precipitation statistics from NWS COOP, CoCoRaHS, and CoAgMet
NIDIS Intermountain West Drought Early Warning System December 18, 2018
 NIDIS Intermountain West Drought Early Warning System December 18, 2018 Precipitation The images above use daily precipitation statistics from NWS COOP, CoCoRaHS, and CoAgMet stations. From top to bottom,
NIDIS Intermountain West Drought Early Warning System August 8, 2017
 NIDIS Drought and Water Assessment 8/8/17, 4:43 PM NIDIS Intermountain West Drought Early Warning System August 8, 2017 Precipitation The images above use daily precipitation statistics from NWS COOP,
NIDIS Intermountain West Drought Early Warning System January 22, 2019
 NIDIS Drought and Water Assessment NIDIS Intermountain West Drought Early Warning System January 22, 2019 Precipitation The images above use daily precipitation statistics from NWS COOP, CoCoRaHS, and
Weather and Climate Summary and Forecast Summer 2016
 Weather and Climate Summary and Forecast Summer 2016 Gregory V. Jones Southern Oregon University June 6, 2016 May 2016 continued the warm trend for portions of the west, while providing some relief for
2011 Year in Review TORNADOES
 2011 Year in Review The year 2011 had weather events that will be remembered for a long time. Two significant tornado outbreaks in April, widespread damage and power outages from Hurricane Irene in August
NIDIS Intermountain West Drought Early Warning System December 30, 2018
 1/2/2019 NIDIS Drought and Water Assessment NIDIS Intermountain West Drought Early Warning System December 30, 2018 Precipitation The images above use daily precipitation statistics from NWS COOP, CoCoRaHS,
Illinois Drought Update, December 1, 2005 DROUGHT RESPONSE TASK FORCE Illinois State Water Survey, Department of Natural Resources
 Illinois Drought Update, December 1, 2005 DROUGHT RESPONSE TASK FORCE Illinois State Water Survey, Department of Natural Resources For more drought information please go to http://www.sws.uiuc.edu/. SUMMARY.
Weather and Climate Summary and Forecast March 2019 Report
 Weather and Climate Summary and Forecast March 2019 Report Gregory V. Jones Linfield College March 2, 2019 Summary: Dramatic flip from a mild winter to a top five coldest February on record in many locations
NIDIS Intermountain West Drought Early Warning System April 16, 2019
 NIDIS Intermountain West Drought Early Warning System April 16, 2019 Precipitation The images above use daily precipitation statistics from NWS COOP, CoCoRaHS, and CoAgMet stations. From top to bottom,
Weather and Climate Summary and Forecast Winter
 Weather and Climate Summary and Forecast Winter 2016-17 Gregory V. Jones Southern Oregon University December 5, 2016 Well after an October that felt more like November, we just finished a November that
Weather and Climate Summary and Forecast Fall/Winter 2016
 Weather and Climate Summary and Forecast Fall/Winter 2016 Gregory V. Jones Southern Oregon University November 5, 2016 After a year where we were seemingly off by a month in terms of temperatures (March
U.S. Outlook For October and Winter Thursday, September 19, 2013
 About This report coincides with today s release of the monthly temperature and precipitation outlooks for the U.S. from the Climate Prediction Center (CPC). U.S. CPC October and Winter Outlook The CPC
NIDIS Intermountain West Drought Early Warning System March 26, 2019
 NIDIS Intermountain West Drought Early Warning System March 26, 2019 The images above use daily precipitation statistics from NWS COOP, CoCoRaHS, and CoAgMet stations. From top to bottom, and left to right:
Monthly Long Range Weather Commentary Issued: APRIL 25, 2016 Steven A. Root, CCM, Chief Analytics Officer, Sr. VP, sales
 Monthly Long Range Weather Commentary Issued: APRIL 25, 2016 Steven A. Root, CCM, Chief Analytics Officer, Sr. VP, sales sroot@weatherbank.com MARCH 2016 Climate Highlights The Month in Review The March
Missouri River Basin Water Management Monthly Update
 Missouri River Basin Water Management Monthly Update Participating Agencies 255 255 255 237 237 237 0 0 0 217 217 217 163 163 163 200 200 200 131 132 122 239 65 53 80 119 27 National Oceanic and Atmospheric
2012 Growing Season Weather Summary for North Dakota. Adnan Akyüz and Barbara A. Mullins Department of Soil Science October 30, 2012
 2012 Growing Season Weather Summary for North Dakota Adnan Akyüz and Barbara A. Mullins Department of Soil Science October 30, 2012 Introduction The 2012 growing season (the period from April through September)
Precipitation. Standardized Precipitation Index. NIDIS Intermountain West Drought Early Warning System September 5, 2017
 9/6/2017 NIDIS Drought and Water Assessment NIDIS Intermountain West Drought Early Warning System September 5, 2017 Precipitation The images above use daily precipitation statistics from NWS COOP, CoCoRaHS,
January 2011 Calendar Year Runoff Forecast
 January 2011 Calendar Year Runoff Forecast 2010 Runoff Year Calendar Year 2010 was the third highest year of runoff in the Missouri River Basin above Sioux City with 38.8 MAF, behind 1978 and 1997 which
NIDIS Intermountain West Drought Early Warning System November 14, 2017
 NIDIS Intermountain West Drought Early Warning System November 14, 2017 Precipitation The images above use daily precipitation statistics from NWS COOP, CoCoRaHS, and CoAgMet stations. From top to bottom,
Seasonal Outlook through September 2007
 Seasonal Outlook through September 2007 Klaus Wolter (18apr07) University of Colorado, CIRES & NOAA-ESRL Climate Analysis Branch klaus.wolter@noaa.gov http://www.cdc.noaa.gov/people/klaus.wolter/swcasts/
NIDIS Intermountain West Drought Early Warning System April 24, 2018
 NIDIS Intermountain West Drought Early Warning System April 24, 2018 Precipitation The images above use daily precipitation statistics from NWS COOP, CoCoRaHS, and CoAgMet stations. From top to bottom,
Crop / Weather Update
 Crop / Weather Update This is our last for the 2018 planting, growing and harvesting seasons. USDA will publish their Crop Progress Report again in April 2019, and we will continue our coverage sometime
Climate Change Impact on Air Temperature, Daily Temperature Range, Growing Degree Days, and Spring and Fall Frost Dates In Nebraska
 EXTENSION Know how. Know now. Climate Change Impact on Air Temperature, Daily Temperature Range, Growing Degree Days, and Spring and Fall Frost Dates In Nebraska EC715 Kari E. Skaggs, Research Associate
Seasonal Outlook through September 2007
 Seasonal Outlook through September 2007 Klaus Wolter (15may) University of Colorado, CIRES & NOAA-ESRL Climate Analysis Branch klaus.wolter@noaa.gov http://www.cdc.noaa.gov/people/klaus.wolter/swcasts/
Weather and Climate Summary and Forecast October 2018 Report
 Weather and Climate Summary and Forecast October 2018 Report Gregory V. Jones Linfield College October 4, 2018 Summary: Much of Washington, Oregon, coastal California and the Bay Area and delta region